Transcripts
1. Intro: Hello, guys. And today, we will get acquainted
with stream let. Today's lesson will
be very useful. We are going to build
several projects using the Yahoo Finance and
Motlotip libraries in the stream Lit environment. If you've checked out
my Motlot Lip tutorial, then you already know about
the Y Finance library. In this lesson, we
will first build a test project where we can see the real stock
price of a company. Then we will use Matplot Leap to visualize the correlation
between several companies, which we can change
and select as we wish. Using the Y Finance Library, we will retrieve financial
data from stock exchanges, and with the help of MotlotLip, we will create
stock price charts and visualize them in Streamlt. And finally, we will deploy
it on StreamldCloud. It's a platform provided by
Streamlt to easily deploy, share and manage your
streamlined apps. You can deploy your
app directly from Github repository with
just a few clicks. There is no need to
configure servers or deal with complex
deployment processes. When you push changes to
your Github repository, your streamlt app on
Streamed Cloud automatically updates ensuring that your app always reflects the latest code. StreamltCloud manages the resources needed
to run your app, so you don't have to worry
about server management. Also, you can control who
has access to your apps, keeping your data secure
and private when needed. By linking directly with Github, StreamltCloud leverages
version control, making it easy to track changes
and collaborate on code. We also have as a benefit, apps deployed on StreamltCloud, use HGTPS to ensure
secure connections, and StreamlitCloud is designed to handle varying
levels of traffic. So your app can
scale to accommodate more users without any
additional configurations. It's incredibly easy to share your data apps
with the world, and we are going to do this
at the end of this video.
2. Introduction to Streamlit: Installation, First App, and UI Overview: Streamlt is a tool for creating web applications
based on Python. It's designed for data
work and machine learning, allowing you to quickly and
easily turn your scripts into interactive web
applications without needing to know HTML,
CSS or JavaScript. Yeah, Streamlt is an open source Python framework designed for creating interactive
web applications for data science and
machine learning projects. It uses a straightforward
Pythonic syntax. If you know Python,
you can use Streamlt without needing to learn
additional web technologies. You can add interactive
elements like sliders, buttons, and text inputs using
simple streamlt commands. This makes it easy to create
dynamic user interfaces. Streamlt apps refresh
automatically when you change the code. So you don't have to keep
reloading the browser. This makes development faster. This library integrates
seamlessly with popular data science
libraries such as Pandas, Nabi, Mad Plotlp,
Plotly and many others. This makes it easy to create rich visualizations
and manipulate data. We can use various
functions to display data, including tables,
charts, maps, and more. If needed, you can
extend streamlt with custom components or integrate JavaScript libraries to
add unique functionality. All apps you've made in Streamlt can be easily
shared and deployed. Streamlt offers a Cloud
Service streamlt Cloud for deploying apps with
minimal configuration. Alternatively, you can deploy streamlt apps on other
platforms like Hioku, AWS or Google Cloud, but I think streamlt
the easiest way. Well, streamlt is a powerful
tool that simplified the process of creating interactive web applications
for data science. It allows you to focus
on your analysis and visualizations without
getting bogged down by the complexities
of web development. So let's get started. First, we will install streamlt in our
virtual environment. I'm going to use a virtual
environment with Python 311. If you don't know what
a virtual environment is and how to properly
organize your workflow, I highly recommend
watching this video. Here I explain in detail what a virtual
environment is and how to install libraries separately for each project to
avoid conflicts. I install streamlt using
the package manager PIP the Command PIP freeze will show us all libraries that I have in my
virtual environment. Here in the source of
my future project, I create a file in which I will write a basic
Python simplest script. Then we will run it and
see how it all works. Here I import the streamlt
library into my Python script, and I will use ST as
an alias because it allows me to refer to the streamit library with a
shorter more convenient name. We see an error in
importing, but that's okay. We just need to change
our virtual environment. In the settings at the bottom of Visual Studio code,
we need to switch it. Then I import pandas and
Nam pi. We will need them. Now I sent the title
of the application. You can set your own. The title function in Streamlt
is used to add a title. These functions displays text at the highest level heading. If we were using HTML tags, it would mean the H one tag, allowing us to quickly
and easily create a clear and attractive
title for your application. Visually, it will be the
largest most proming heading. Of course, we need
data to display. Therefore, using Pandas,
I create test data. If you have taken
the Pandas course, this code will not raise
any questions for you, but I will explain anyway. Using Pandas and the
Nampire library, we will generate
random data and obtain a data frame filled using
the random random function. I generated 1,000 random
numbers for each axis. Then I display the
first five rows of the data frame in
the streamlt app. As you remember, head without any argument will give
us five first rows. I the function in
the streamlt library used to display various
types of content. Then I'm going to use the
scatter chart function. It generates a scatter plot, which is a type of
data visualization. As a data, I will pass our newly created data frame and then with the command
streamtrun app Pi, I will run the script. It initializes the streamlt
server on your local machine. Then it reads the script
from top to bottom, executing the code to set
up the web application. I would leave this blank. I don't want to receive
any promotion data. When you run Streamlt
application and see the prompt, do you want the application to accept incoming
network connections? It means that your
operating system is asking whether you want to allow your stremlt app to be accessible over
the network or not. By default, when you run
Stream Lit Run command, the streamlt server starts and binds to the local machine. Typically at Local host 8,501. This local URL is used to access your app from the same machine where you are running
the streamlt server. Local host refers to
your local computer. This means that if you
open a web browser on your computer and enter this
link in the address bar, you will be able to view
your streamlit app. In case of network URL, it can be used to access your streamlt app from other devices on the
same local network. This means that if another
device like laptop, smartphone or tablet connected
to the same local network opens a web browser and enters this link in
the address bar, it will be able to
view your stremlt app. Allowing incoming
connection would let other devices access the app if they know the IP
address and port. I deny because I
don't need this now. And here we can see our app, see the title we
specified and see the data we generated
using Pandas and Napi. We can expand our scatter
plot to full screen, return it to how it was, sort our data by X and
Y axis as we wish. As we can see, everything
is very interactive. We can download this
in any format we can choose and view the
available settings here. In the settings, we can go back see the available themes and choose one for ourselves. We can print the document. Next, we see screencast, a feature that allows
you to record a video of your screen demonstrating
your app in action. This is useful for
creating tutorials, showcasing the
functionality of your app, or providing visual
reports on its usage. This is really great
because you can easily create such videos
without needing to use third party screen
recording software and show in detail
how your app works. Then we can check the version. Next, we see clear cache. This means clearing the cache, which involves
deleting safe results from previous
function executions. This can be useful when
you want to ensure that functions are re executed
to get up to date results. This is especially useful if the input data or calculation
logic has changed. We can use the deploy
feature directly in the app. This means the process of
deploying your streamlt app to a server so that it becomes accessible to users
via the Internet. This allows other people
to interact with your app without needing to run the code locally on their computers. Well, we saw how it looks like. So let's move on to creating the second app using Qi Finance.
3. Creating a Stock Price Visualization App with Streamlit and Yahoo Finance library: Let's start from the beginning. I will import
everything necessary. In this case, instead
of random created data, we will get data
from Yahoo Finance and Y Finance Library
will help us. Next, as we did in the previous
app, we create a title. I will need a text input box, so I will use text
input function. It allows users to input text data interactively
into a Streamlt app, and it's commonly
used for collecting user input such as text,
string or numbers. You provide a label for
the input box and streamlt displays a text input field
where users can type text. Here, we should enter
the stock symbol, and we assign it to the
variable stock symbol. Then we check if the variable
stock symbol has a value. If stock symbol is not empty
and the condition is met, it calls the download
function from the Y Finance Library to
retrieve historical stock data. This function downloads
historical market data for the specified stock symbol. As a parameters, we
can pass stock symbol. The symbol of the stock, we can get it from
the site, NASDAQ. And the second
parameter is a period. We specify the time period for which historical
data is retrieved. Here is requests data
for the last four years. This code ensures
that stock data is downloaded only if a
stock symbol is provided, preventing unnecessary iclls and errors if the symbol
is missing or invalid. First condition if
stock symbol checks if the stock symbol variable has been provided and is not empty. It ensures that the Y
Finance download function is only called if there is
a stock symbol to query. It prevents
unnecessary API calls and errors that would occur if Y Finance download
function was called with an empty
or invalid symbol. Second condition, if
not stock data empty, verifies that the Y
Finance download function successfully retrieved data for the given stock
symbol because even if a valid stock
symbol is provided, it's possible that no data is
available for that symbol. For instance, the symbol
might be incorrect or the stock might not have data for the
requested period. Then inside, we are
displaying financial data. Right function displays the
first few rows of the data. If you saw my tutorial
about Bands or polars, you'll know that head
function shows us only the first five
rows our data frame. Then we use line chart. It creates a line chart of the closed prices
from the stock data. And of course, we use ls Blog. Here, we are going to
display an error message indicating that no data was found for the
provided stock symbols. The error method in Streamlt
displays an error message. It will be displayed in
red to attract attention. We run our app with
the familiar command, and in the open browser
we see our page. Let's test it and enter, for example, the name of Apple Stock, and
we got an error. Well, there that we cannot
specify four years. But we can specify, for example, five years. Let's do that. We don't even need
to restart our app. We simply change
it to five years, save it and open the browser
and refresh the page. We see that now everything works correctly because it
updates interactively. This is very convenient. We can see the stock
price at a specific time. We can zoom in or
zoom out our chart. Let's try entering Google
stock, for example. We can open it in full screen. It's called when you
want to observe how prices have changed
over a certain period. Let's take another example. I want to look at Tesla stocks. However, it's a
bit inconvenient. For instance, I want to
compare stock prices over the entire period between
any two companies. I want to build a
new app where we can specify the names of two stocks
and compare their prices.
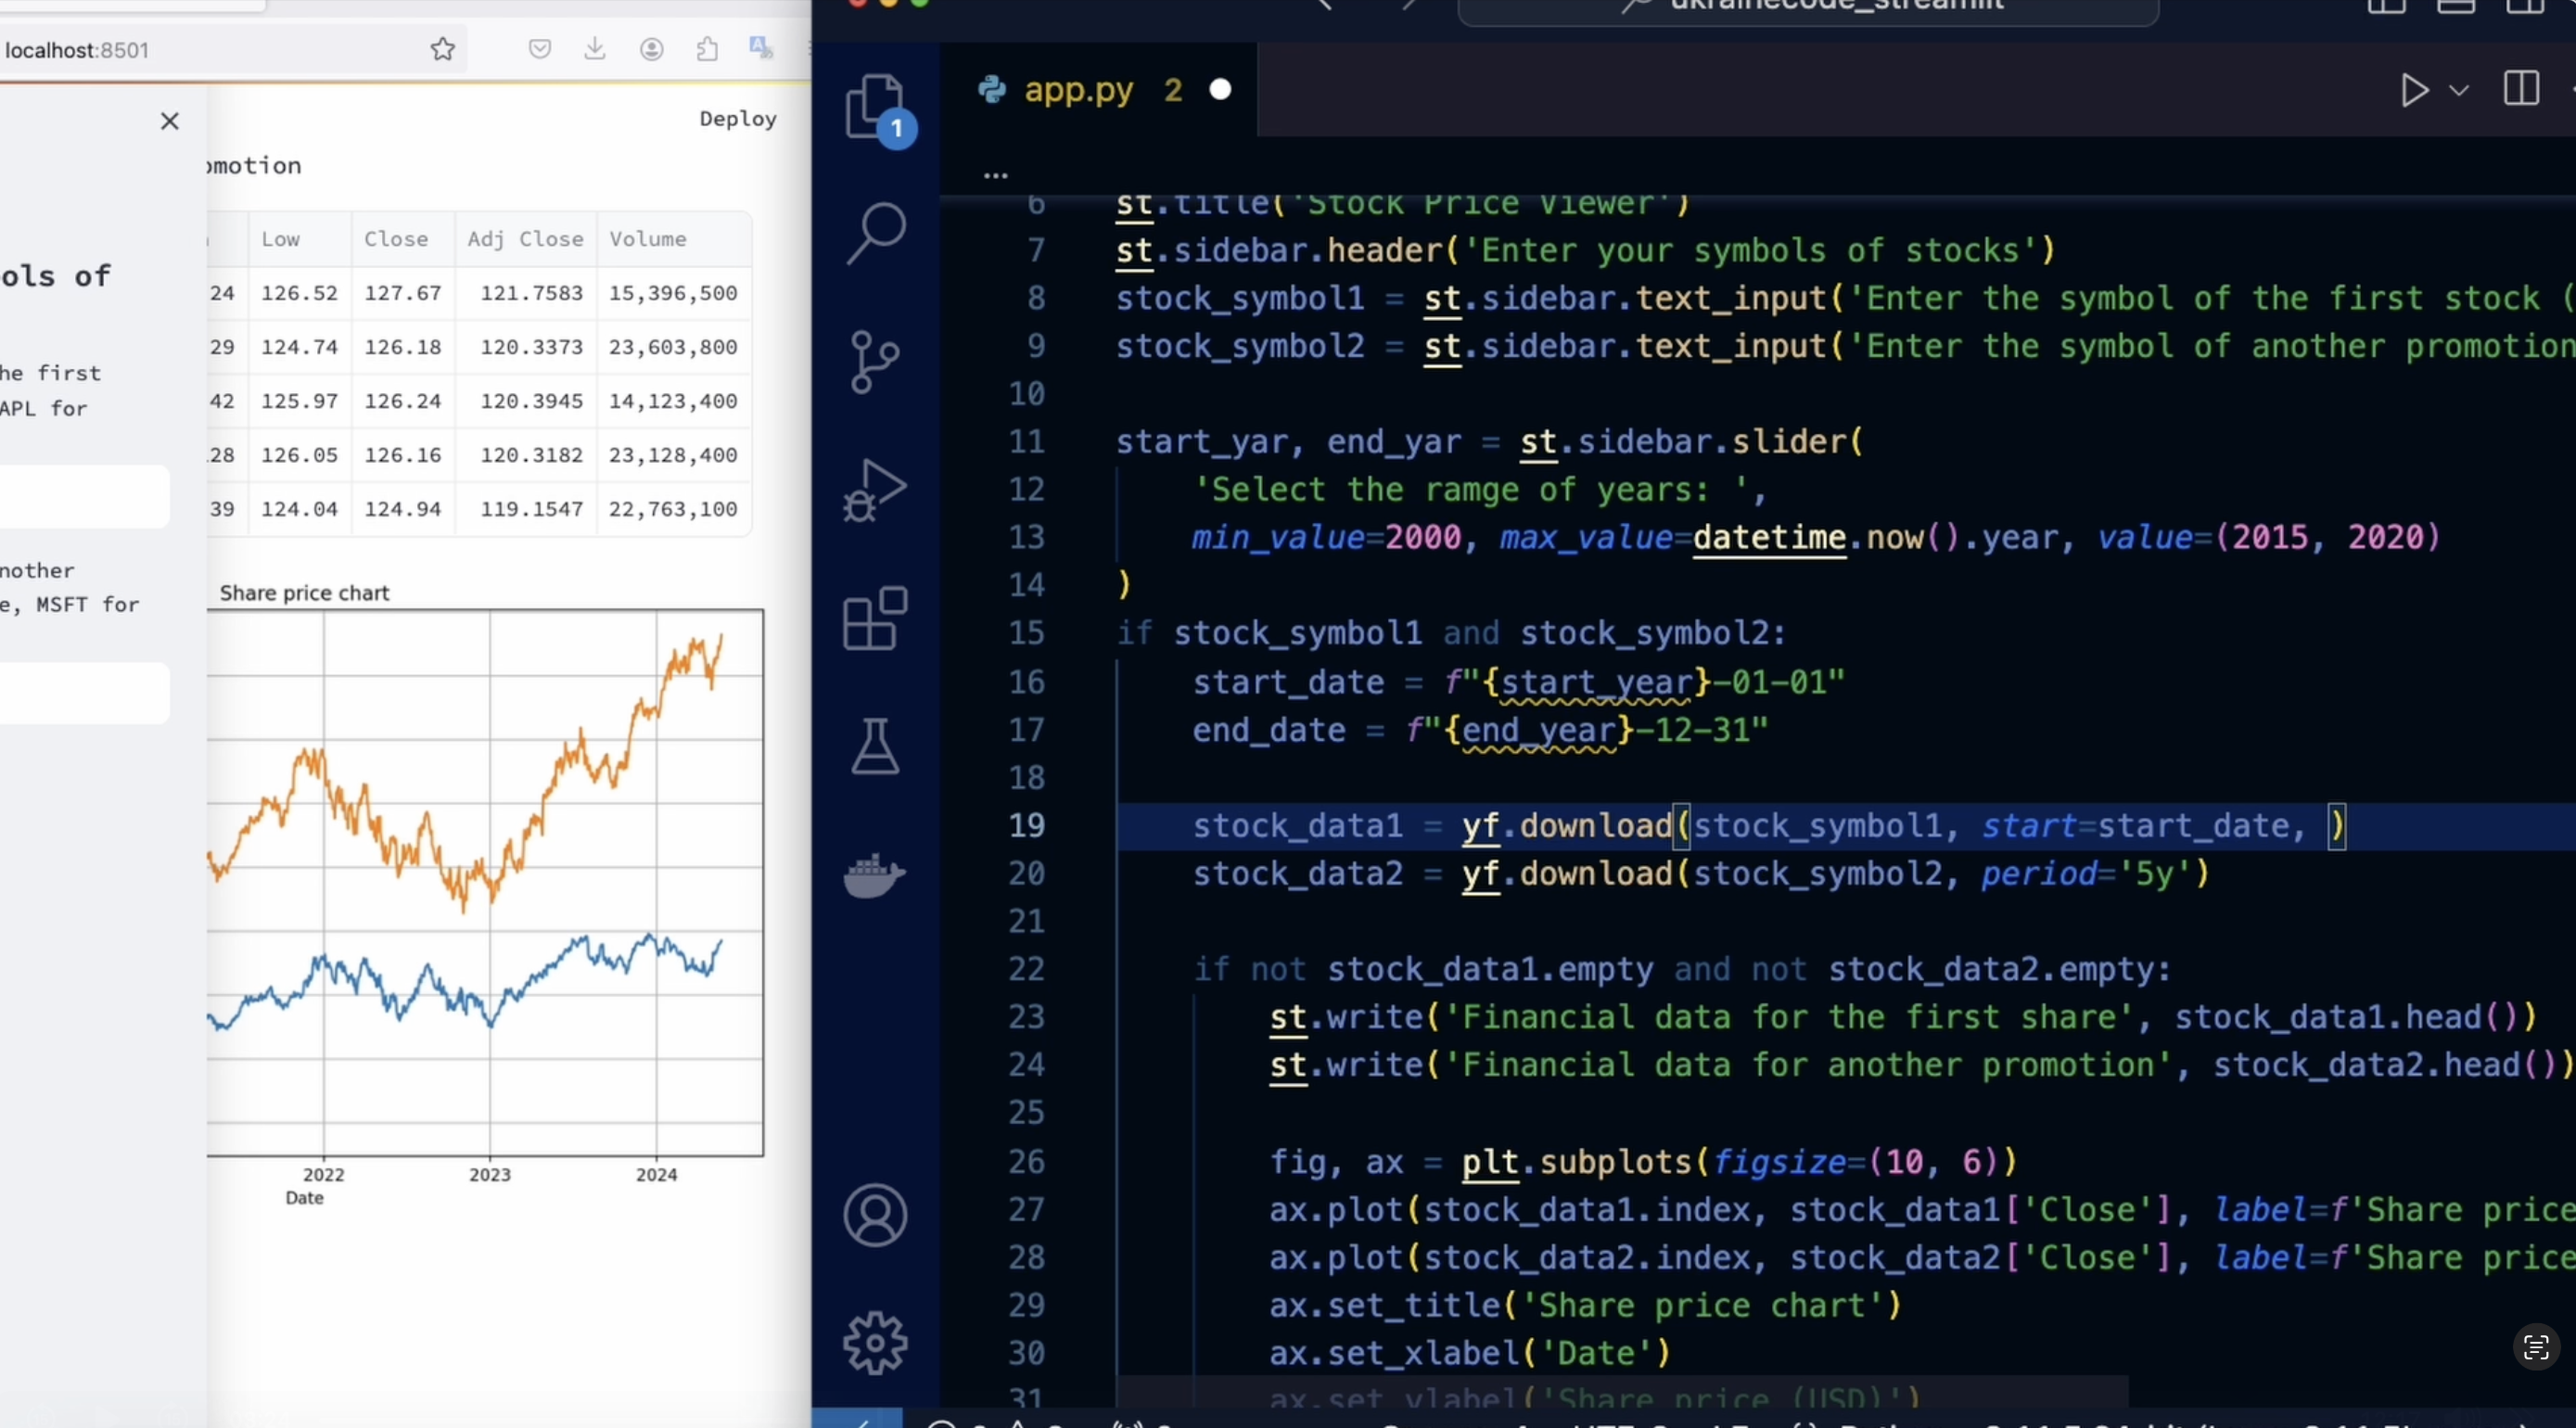
4. Enhancing Stock Price Visualization: Streamlit, Yahoo Finance, and Matplotlib: As always, the first thing we do is import all the
necessary libraries. This time, I will be
using Matlot Leap. If you haven't installed
these libraries yet, you can use the
Command Beep Install, followed by the library name to install them in your
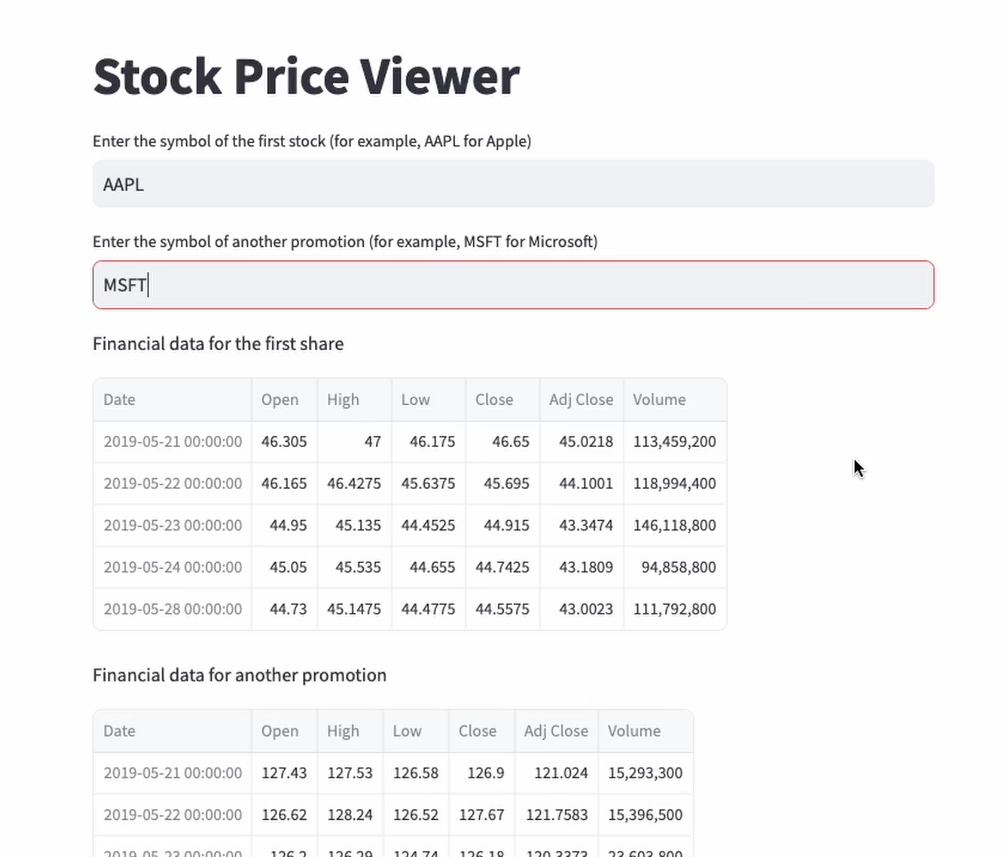
virtual environment. Next, I set the title for our app using the
familiar function. Then I create two
interactive input fields where our users will enter the names of two
stokes. They want to compare. Then we check if both stock symbols have
been entered by the user. If both symbols are entered, the app downloads
historical data for each stock symbol for the last five year using the download function from
the Y Finance Library. After that, we check
both sets of stock. Data are not empty. If they contain data, the code displays this data and plots a chart to
visualize the stock prices. The right function is used to display the first
few rows of data. I'll remind you that
the head function returns the first five rows of the corresponding data frame. Next, we create a figure
and axis for the plot with dimensions of ten per 6 ". Then we use the plot
function to add a line plot to the
closing prices or the stock for each symbol. Here we pass the
stock data index, stock data in the
data frame containing historical stock data for each symbol that we downloaded using the
download function. The index represents the
index of this data frame, which typically
consists of dates. When the stocks were traded, this will be used as the X axis, the horizontal
axis on the graph. Then we specify
stock data, close. This is the closed column
of the data frame which contains closing prices of
the stocks for each day. This will be used as the Y axis, the vertical axis of the graph, and finally, we specify a label. Working with data frames was covered in detail in
the Pandas course, and Pandas is a library. You need to know whether
you plan to become a data analyst or
data scientist. Pandas and pullers, the
two libraries or at least familiarize yourself with it
and understand how the work. Next, we set the
title of the plot. Then we set the label for
the X axis and for Y axis. Then we add a grid to the plot. It makes it easier to
read our data points, and I add a legend to the plot, which identifies the
different data series or elements plotted
on the graph. Then we use function to display a Mtlotlp figure directly
within your streamlit app. Byblot is a streamlt function that accepts a Mtlotlp
figure as its argument. This represents a
ultplotlpigure object that I have previously created using Mt Bot Lip plotting functions. At cool that streamlet seamlessly integrates
with Mt Blot Leap, allowing you to display Mult lip figures directly within
your streamlt app. And then we handle cases
where data is not available. We should provide clear feedback to the user when
no data is found, restart the project,
enter the data. And we got an error. Just a few typos.
Sorry about that. I will fix it, and now
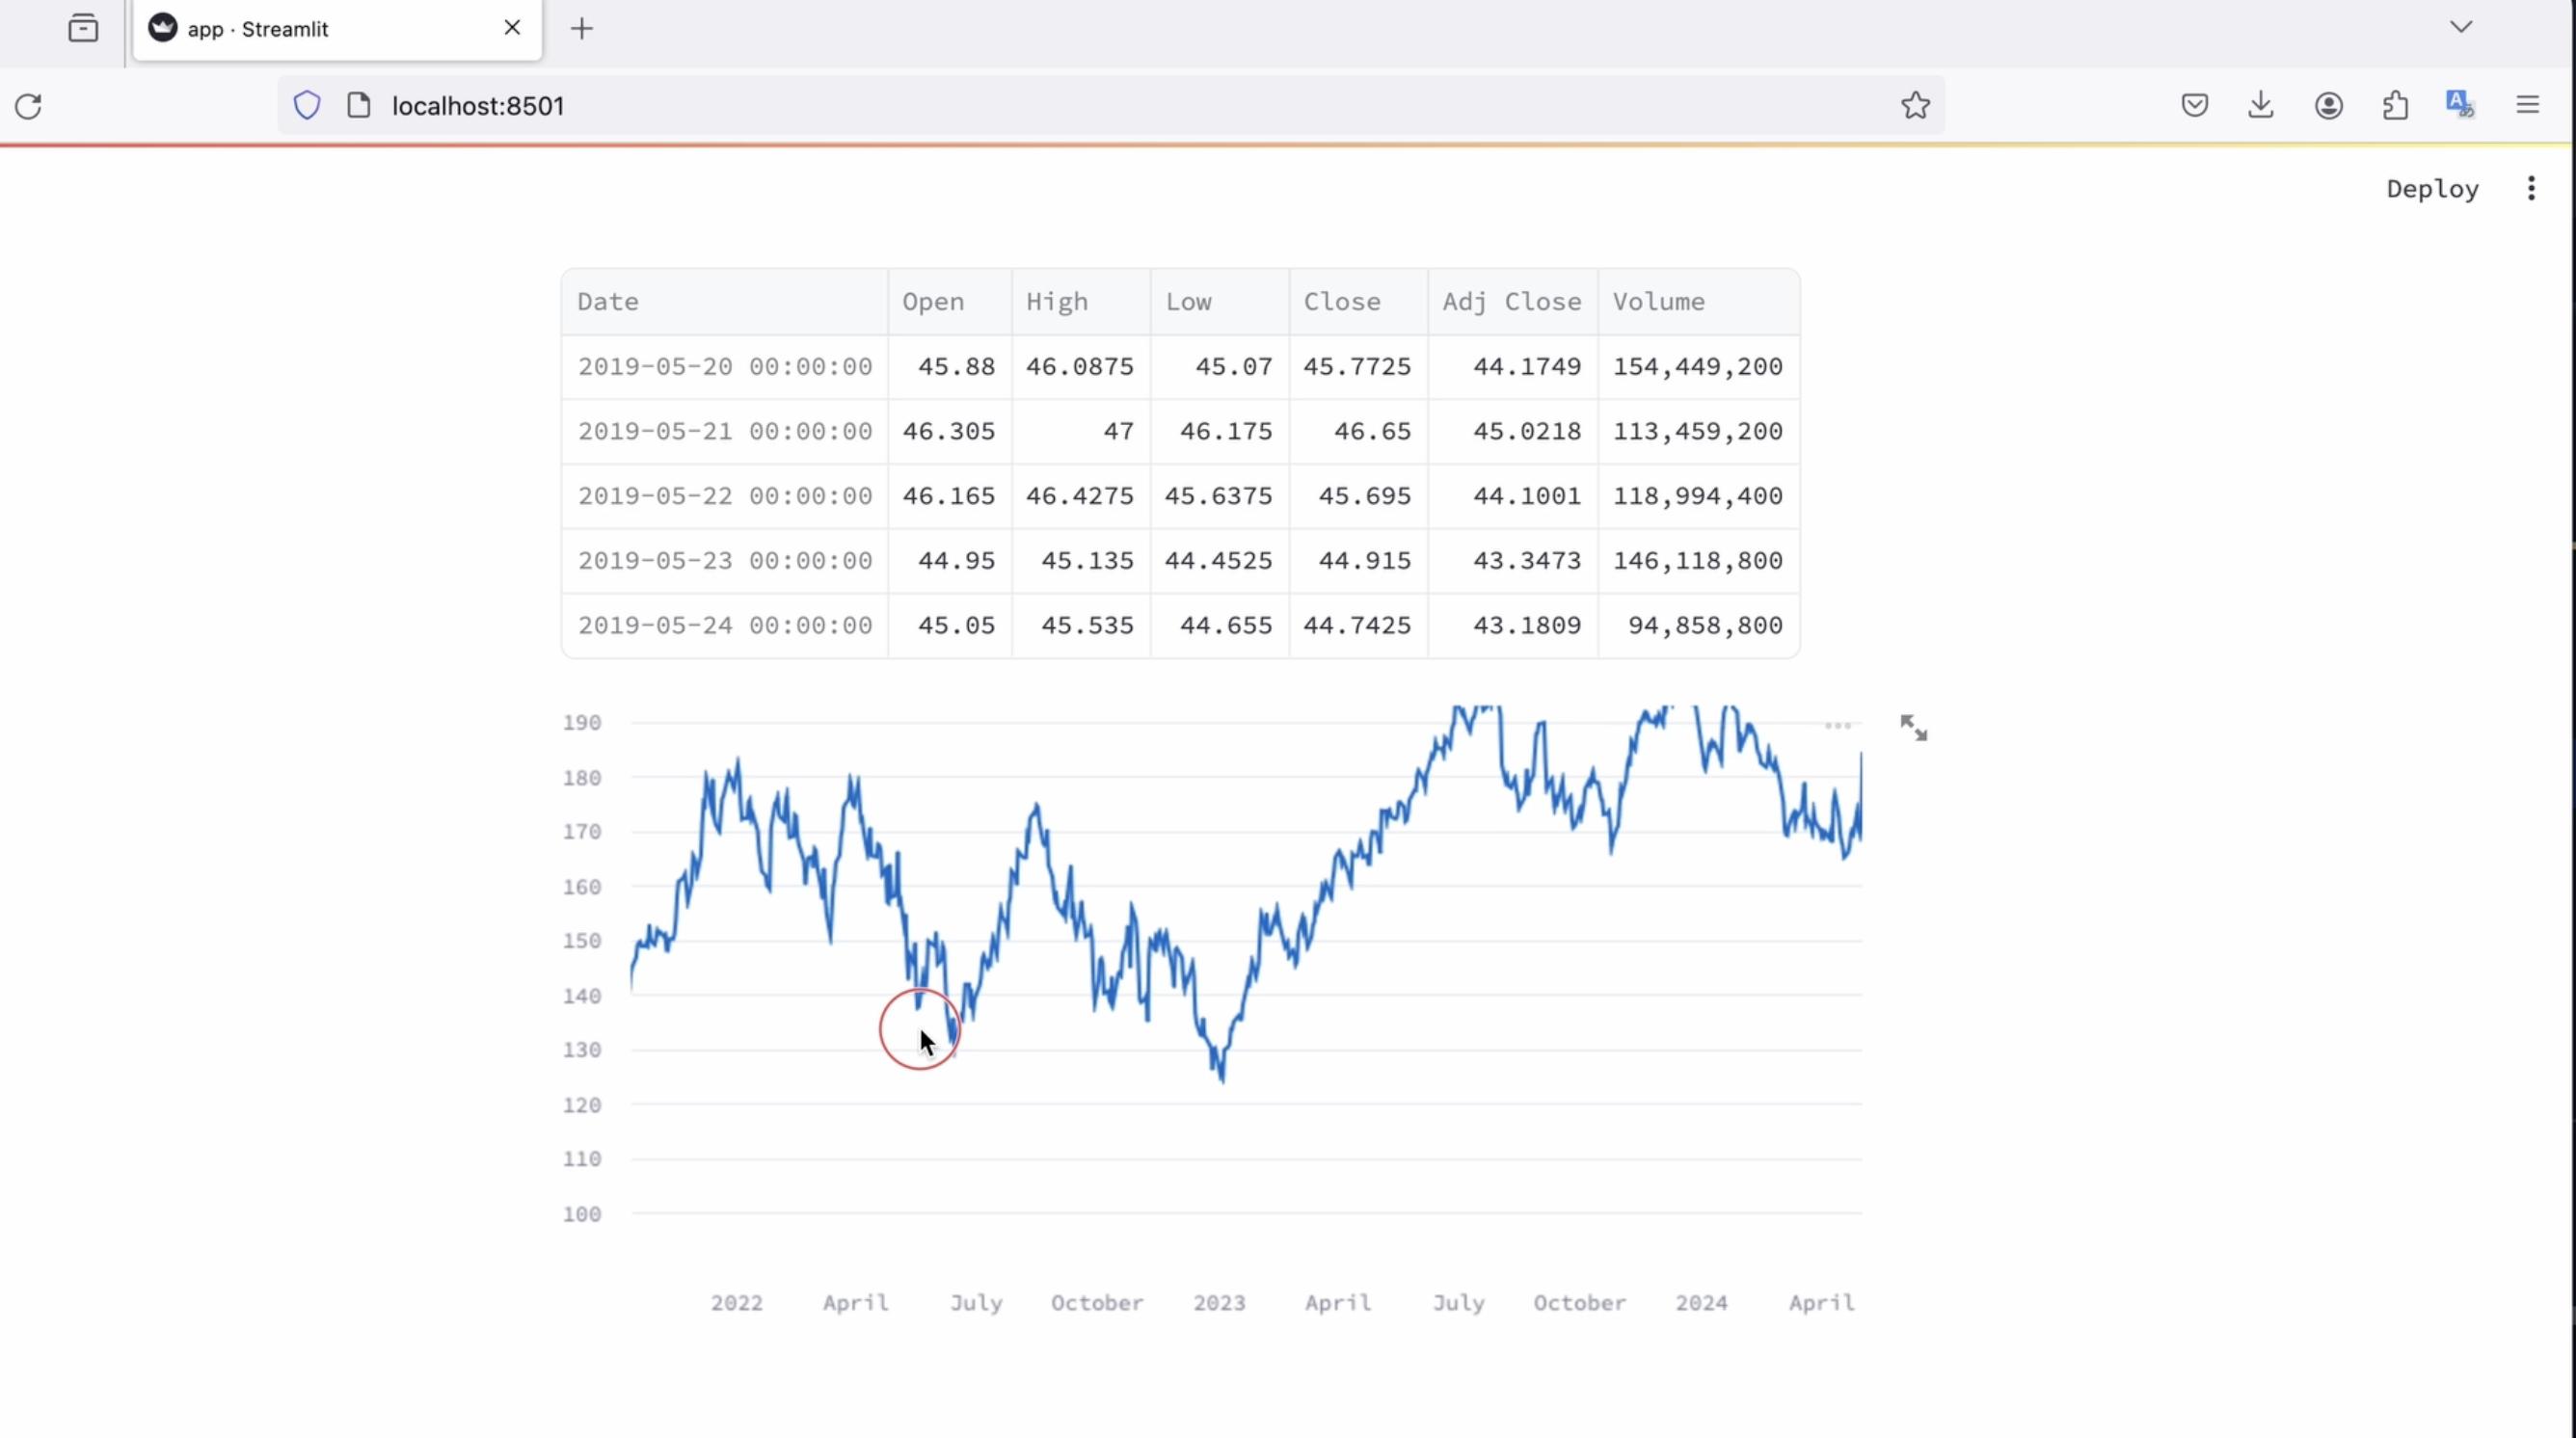
everything should work. So let's test it out. I we can select
any stock and see its price and compare it
with any other stock. And for this, we used streamld, Mud od lip, and I Finance. We visualized historical
data for five years. Of course, we can change this date range to be
longer or shorter. Thanks to the Yahoo
Finance Library, we can get historical
stock price data with great accuracy. Using our web application
makes it easy to compare the stock prices of two
companies on a single chart, and that's really cool. You can use not only Mattel, but any library we've
already covered, you can create something of your own to analyze your own data. Streamlt helps you to display all this without needing
front end knowledge. You don't need to create a
website to showcase your work.
5. Advanced Features of Streamlit: Adding Functionality and Deploying App for Free on Streamlit Cloud: And now I want to add a bit more to our application
and deploy it on StreamltCloud so that it can be accessed publicly or simply showcased as part
of a portfolio. I will split the screen into two parts so I can see
the changes in real time. For me, it will be
more convenient. I will change a bit my title. Here I'm using the
sidebar function. The sidebar is a separate
section of the web app, typically used for inputs and controls that affect
the main content. I find it inconvenient
when we enter the names of our companies and don't
immediately see the chart. I want to move this
to the sidebar. This panel allows you to organize control
elements separately, providing a more convenient
and organized interface. Then I use header. This method adds a
header to the sidebar. This way, I'm providing
instruction to the user. I refresh the page, and we immediately
can see changes. And here we can see our sidebar. The streamlit sidebar
is used to create a side panel where you can place various
interface elements, such as headers, text
fields, buttons, and generally everything that you would place
on the main page. If I now select our stock names, we will see that it's
much more convenient. However, I don't like that the time period is hard
coded to five years. I want to be able to choose the time period according
to my preference. I want to view and
compare stocks perhaps over a year or
maybe over ten years. Now I'm going to change
some of the logic. I've inputed the
data time module. This is a standard
library that provides classes for working with
dates and times in Python. This module allows for various operations
related to time. I want to create a
slider on the sidebar. To do this, I'm using
sidebar slider, which creates the slider. Next, I specify the
label that explains to the user that the slider is for selecting
a range of years. Then I indicate
the minimum value that can be selected
on the slider, which is the year
2000 after that, I specify the maximum value that can be selected
on the slider. Which is the current year
dynamically determined using our daytime module by
calling the null method. Next, I specify
the default values that will be set on
the slider by default. I'll choose the
starting year as 2015 and the ending year as 2020. The result of this line
of code is two variables, start year and year, which hold the selected
start and end years. These values are then used
further in the application. Here we check if symbols were
entered for both stocks. If both symbols are not empty, the code block inside this
condition is executed. Here we define the start and end dates for further use
in the application. We are replacing hard
coded five years with dynamically generated
dates based on user input of
start and years. Let's refresh and see what
we have. We got an error. We got an error
because there was a misspelling that
needed to be corrected. Now, everything works
and we can change the time frame for which
we use dock names, which is displayed more
conveniently than before. I think it's really
more convenient because we immediately see what these
stock prices represent. Let me change it to Tesla. Then I want to change Apple
to Google and play around. Let's see how their prices have changed over
a specific period. Let's now deploy all this
to stream with Cloud. We want to show our
project to someone, so we need some hosting where we can applaud what
we've done together. But first, we need
to use Git for this. If you are unfamiliar with Git, I highly recommend familiarizing yourself with it by
taking a course. Please check my profile. There is a great course on Git. It's essential knowledge,
regardless of your IT role, whether you are in
testing or programming. Now we've logged into my Git account and created
in your repository. Choose public and don't add anything else like read
me file or Git Ignore, leave everything as it is. After you create it, you
have a list of commands you need to execute to push your project from
your local machine, from your computer to the
remote server that is GID. And after that, we
move to our project. We use the command to
initialize our project. This command will create a new empty repository in the current directory
of our project. If you look at all the files, including hidden ones, you can
see the dot GID directory. This means that we have
initialized a new project under version control and created all necessary files and
structures for working with GID. After this, we will see
the files in our case, a file that will be
added to the stage. That is, we will see that we will send the
remote repository. Next, we use Git add command to add
everything to the index. We check the status change, and then with the
GIT Commit command, we save all files, all changes that we were
added to the index using the add command as a new commit
in the local repository. For now, our task is to push the local repository
to the remote server. For this, we passed the
copied commands from GitHub. After executing these commands, we go to GitHub and
refresh the page. We can see our file
already on GitHub. Our next task is to deploy
this product to StreamltCloud. We go to this site. If you don't have a
profile, create one. If you have one, login
into your account. Creating a profile
doesn't take much time. You use your email provide
your details in your case, and in my cases, it might be correct
to specify student. Next, it's simple. Choose the settings for yourself and the profile is created. StreamltCloud offers a
multitude of features. Here we see the My Apps tab. Next, we have the Explore tab. The stub allows you
to find and explore public apps on StreamLt that
were created by other users. Then there is the
Workspaces tab. The stub is used
for managing teams and collaborating on
streamlt projects. Here we see the
button to connect your GitHub account to the StremltCloud workspace,
which is what we need. Streamlt will ask for permission
to connect to Github. I will click the
authorized button, and our GitHub account will be connected to the
stream Llet workspace. Now our task is to prepare the project and send it
to the Streamlt Cloud. For this, I go to our project and create
requirements TiktiFle. In Python projects, this file
is necessary to define and list all dependencies that were installed at the time
of project creation. In other words, all the
packages and libraries needed for your app to function correctly are listed
in this file. This is especially important
before deployment, regardless of the platform. When deploying a project
on streamltCloud, the platform will
automatically look for these requirements 60 file in the root directory
of the project. Then it installs all
the specified packages so that the environment is set up according
to your needs. This ensures that
your app will have all the necessary
dependencies for proper functioning without additional effort on your part. And by effort, I mean you are
going to the remote server and manually installing
all libraries or dependencies for your
app to start working. I recorded all the
necessary libraries and dependencies in
requirements Txt file. I removed Pandas because
we didn't use it. I edit it out of habit
because it's often used. Then we add this as
a change in Git. We make another commit and push it to the remote
Github server. If you now go to Github
and refresh the page, we will see our requirements Tik Di file with
all dependencies. Then we go to the
Streamlt Cloud, click Streamlt app and then click Create and
fill out our form. Here we can select
our repository, specify the branch
we will deploy from, indicate the main file. In our case, it's api, so I rewrite automatically
created name main file and come up with a link
for our application. There is also a slightly
different method where we click here and can post the Github
link to our main file, which we can copy directly
from Github here. Then we also come up with a
link for our application. Here we see advanced
settings which provide additional configuration options for our application. We can store API keys, passwords and other
secrets here. Stream let ensures
that the secrets will not be displayed
in the code or logs, but will be available
to the app during use. We can also specify environment variables
here and deploy. This will take some
time. And here we see our application. Now our app is on
the Internet Wi. You can share this
link with anyone and people will be able to visit
and test your product. In general, StreamltCloud is an excellent tool for
showcasing your portfolio. It allows you to quickly deploy your projects from your
Github repository. Any changes you make to
your code and push to Github are
automatically reflected in your app on StremltCloud. This makes it easy to keep
your portfolio up to date, making development
and publishing of your data fast and simple. Deployment is very
straightforward. You can collaborate and as a
bonus, we have versioning. We can track changes in our applications and switch
between different versions. It's great that
you can customize your own domain for
your application, giving a professional
look to your portfolio. Additionally, streamld adapts
to different screen size, ensuring a good look on both computers and
mobile devices. This is very cool
because your application can be viewed
properly by everyone, whether from a phone or a home computer, and
most importantly, StremltCloud offers
a free plan that allows you to host
your applications without additional costs. This is very useful for
students and beginners. You can have your own domain and host your test project on
the Internet for free. So let's practice and share.
 Olha Al, Software engineer