Transcripts
1. Introduction: - Hello . You're welcome to this course. Advanced Excel for hay HR managers, Another office managers on will be focusing on private tables. Now pay what? Tables are very powerful tools that enable us analyze collates. I am present our data in reports that make coherent stories. It doesn't matter if your HR manager ahead of supply chain If I notice director, why a job seeker looking to ace his next interview wherever you might be at this point in time, this course is for you if you need to analyze reports or ever make sense off data or reports that have been sent to you. My name is Linda ideally, and I've had several years of experience managing people on in the course off this carrier have worked in the oil and gas service sector on the manufacturing sector in Nigeria, I invite you to join me. That's known about
2. What is a Database?: now, pilot tables are used to manage an extract meaningful information from data on and we can summarize and allies explore and present our data in ways that are meaningful for our audience. Representation of data in a way that makes meaning. It's very important for decision making it I can come in the form move has no debt are from your employee databases can come from your accounting ledger can come from the capture over attendance. If you have an automated attendant system, information will come in automatically from that way and also have administrative stuff in different functions. Capture in data on it any basis. What do we do with these data? Private tables give us the possibility to analyze this data in a way that makes sense. Information can also come from seals can come from your customer data bees. So what about the source of the data I want? Table will be able to make more meaning from the data. So here we have a doctor sits, we have information that is arranged. We have titles at the top room and then we have the information arranged in columns. Each row is a record we can see that each of the records is unique. Of course, some some information is duplicated, like you can see a stuff name here. It's also repeated in Rule 20 here, but each of the information presented here is different. So if we look at this, information will find out that it's sales report for each employee show you the department . The unit price off item that is sold the quantity sold the amounts the item itself on the month when it was sold and when information is arranged in this nature by column and the rows with quality database.
3. Pivot Tables - Rules: so it's for excel To make a private table. You would need to have the information organized this way, and you will. Observer. There's no empty column If we have an empty column light here, Excel is not going to be able to run a private table on this data. You'll have an error message on if and if you have an empty rule somewhere in the data, excel around the pipe or table up until the empty room, so you will capture all your data. So the first rule is that each column must have a heading on. There should be no empty spaces in terms Off. Empty rules are empty columns in your data. So to recap, each column must have a heading, and there should be no spaces, no empty columns and no empty rows throughout your database or else Excel Mary tone an error message. In addition, each record must be presented in one rule across the fields. Make sure details consistent, So if you have time in a column, make sure it's time all the way. These dates make sure it's dates all the way. Now that we've understood what a database is on the ground rules for creating a private table will be creating private tables in the next lessons pleasing. Sure, you download the practice files so you can fuller long.
4. Creation of 2-dimensional Pivot Tables: so another. We understand what you pay about table is and we understand the rules. Let's created two dimensional pilots able. So when we want to create our private table in excel, we go to insects and private table and we'll find out that we have marching ants around our data. Now, this will only happen if you have no space in between. If you have a space on empty rule, the marching ants will end at the empty rule on the private table will be computed based on the data that is a both the empty room. So if you found out that you've got all your data, you could also click in this box, Andi, manually select the data yourself. Then we can choose where to put the private table either on the new worksheet on the existing worksheets. If we want to put it on this sheets, for instance, here, who would go into this box? We would click on the existing worksheets going to this box and click where we want the private table two. Sure, but for this example, we will go to a new worksheets and we press OK. Excel has created this blank private table on a list off the field names for us to develop our private table the way we want it. Now you will see that the field lists headings appear here, and we can drag them into the pilot table to create our private table. At the bottom of this dialog box, you see that you have filters. Colon's you have rules and you have values. So Piper Table is arranged in such a way that you can drag anything into any of these four areas to determine how your pyre for table will be. If, for instance, we want to see what each stuff sold, we can drag stuff named, for instance, into rules, and we can see at the left hand side that the names off the stuff, even if this stuff names were repeated for different activities, we've just taken one value, so the stuff names are there in the rules. And if we scroll down to the other M headings, we confined amounts, for instance, we can put the amount as the values. So what private table has done is to at all the instances for each of the staff to give us total values which we can actually formats the way we want. So this now shows us the total seals meat by paper stuff.
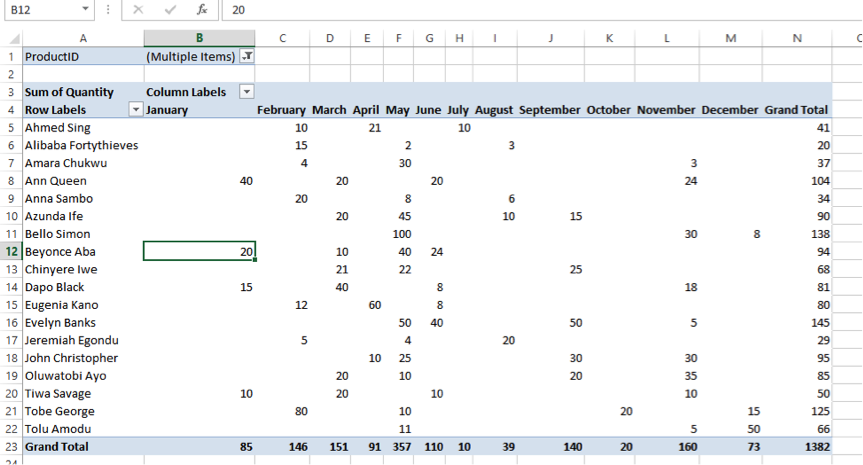
5. Creation of 3-dimensional Pivot Tables: suppose you want to have some column headings. I will want to put the departments, for instance, in the columns to show us by departments what each stuff has done. We can put department in columns if we move this out of the way. Who find out that for each of the departments shown here, we have the sales. So if you want, you can centralize it so you can see it better. We can see at a glance what happened in engineering. What happened in, I mean, what happened in medical department, for instance, hand the various and information so Piper table, you can put the data in any way you want. Suppose you want to swap and put the stuff names and put the department above this stuff names. If we do that by moving this above the stuff names, we now have the department festival, then we have the name off the employees, so it's sorted. So here, for instance, you have engineering and there you have the breakdown off everything that happened in engineering. So it's very clear to see what is happening for each of the areas. So you probable table gives us this capability off sorting information the way we want it. You, for instance. We want to take the department, want to take the month, for instance, and put it as a column heading. We will see month by month how the sales happened. Now let's click out off here to remove this dialog box. And then if we go to the top, we can see how Excel has sorted our data. So we have the departments we have the months of the year I'm generates a December, and we have the information. As I said before, we could also put in the formatting because excel normally reform, it's each time the information changes. So if, for instance, we have a change in our main data, recall that we created the private table on a new worksheets which was created. If we go back to our data and change any information here, I would come back to our private table. The information automatically updates and give us new totals. Lynch to our data, so updates the data when we've changed anything in our source file. We just need to right click anywhere in the private table. I'm press refresh on the data will be updated accordingly. We can do our normal for Martine just to make sure the columns are aligned the way we want by clicking on the column. Onda lining something else we may recognize is the format in the indentation. So here, if would like to remove these and what we call when we called them radio buttons, we just need to right click. We go to private table options, and we can actually in the display, either show or remove the expand collapsed buttons. So in this instance, we can decide to hide it by on checking, the botsan on those buttons will be removed.
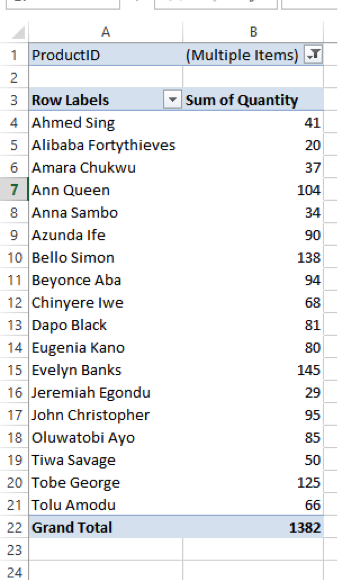
6. Inserting Filters: other things we need to look at is filtering. Now we can see that we've used the columns area, refused the values refusal, rose. If we decide to feel to our data, for instance, we want to know, maybe we want to see only a particular product. We can put that into the filter's area. What happens is that we now have a filter at the top for the product, Heidi. So if we drop down here, we can opt to see I have a warn or two or all of the information. If we actually check all, it means there's no filter. So normally by defaults, when we create a filter, all of them are selected so you could remove the all so to see, for instance, only slings both large and normal slings, For instance, you can check those two boxes, and the information will automatically show you the information for those multiple items. If we want to see only couplings. For instance, young, check these other two and we see the information for couplings. So this is a great tool, especially when you want to feel toe you want to show all again you just highlight call, and that is the same thing as removing the field
7. Structuring our Pivot Table results: now something else we can do. If we noticed, we will find out that Excel has summed. Our sales figures here has given us this. Some on this is because Byfield that we have put in the Value area is calculating the some off the amount. If you if you put your mouse, if you hover your mouse, you'll see some of amounts, the value, the rule and the column. So he's given us a some suppose I want to see a counts. In other words, want to know how many instances this person sold or harmony I am unique products. We can go back to our information, our private table fields. I'm here instead of this. Some of the amounts we can change the value off the field settings two counts, So he's going to count for us each transaction that was made. So instead of seen it as as figures we're now seen, it is obscene it as the amount we're now seeing the total instances or the Count's. We can never put this information to the rights, which is the normal format for figures, and that way we find out that someone like evening banks, for instance, um, had six transactions. Whenever we click inside the table, the private table field is going to show unless we forcefully close it. So if we close it on, we click anywhere in the pilot table. It's not going to come out onto. We use the right mouse button on Show it again. So for this for now, we can leave it heating so we can see that we have all the instances by department. There were only six transactions by this stuff. This is the spread over the months. So we see how we have changed from a summation to accounts off the transactions. And if we scroll down, we'll see that in all, we had 100 and eight transactions during the month. In the same way we can change from summations accounts, we can change toe average. We can change, too. Let's show the field list again. So here we have accounts. So we go to the value of that particular field. We can see the different options that are available can show the maximum we can show the minimum we can show average and so on. So it's something I invite you to play with, experiment with explore and see what I am the private table is able to do for you
8. Consolidating data from several data ranges: now a private table can also constantly data from two separate databases. Andi will recall that we used the data, you know, file here, but it's possible to collect better from two separate files. You're for instance, we have this worksheet and we have another work sheet in another file or in a different place, we can consolidate the data from the two areas. Now, usually, if we look at the reborn on the set, many looks this way. But on mine, I have a pilot table and pie. What chat wizard? You need the wizard to show on your reborn for you, too. Being a position to consulate dates your data. Now this private table, private table on private chat wizard is not normally visible until customize your rebound. So to do this, you just you right click in the rebound on you. Customize the reborn before you drag the private table which is under or commands before you drag the private table and private chat wizard into your ribbon. Before you drag it into your reborn. You need to create a new group where you put your bottom because if you look, you find out that you have a Ditan. You have clipboard. You have funds and so on and so on as groups m be reborn. So what you need to do is to create a new group where the Botsan by what Chatham privates were with that will reside. So you come here, let's put it under in sets. So we click on insets and we see a new group. So if we create a new group, we can actually rename the group where we have new group here. We can call it Wizard when we say, Okay, we now have a group called Wizard. So if we take our private table and private chat with that button or command and take it into the Wizard Group, we now have it under wizard. And we said, OK, on W cassettes menu. We now have a new group called Wizard On Inside. With that, we have private table and private shots with that. Now, when you're when you're creating your private table with the Wizard, it's going to ask you at the beginning. If you want to use a Microsoft Excel databases, which is what we've done by clicking on private table extrano data source or you want to show multiple consolidation range is now if you click, multiple consolidation range is and you want to create a private chats you go to next, you can click next again. Now, when you click when you see range, you cannot click on this range. Select everything in our data here. Let's do that when you click on the range. Okay, you have your marching ants around your data 100 ad, it's You cannot come back here again. Hand click on another range. Normally, you would have the range open, but if you don't have it open, you browse. You open the file on. Then you select the range again and you add so you can add multiple ranges on. It will constantly dates into one private stable. So when you're done, you just press finish Onda and the private table recreated for you to build. I invite you to open the Excel file provided called skill share private table console exercise when we have to work sheets that will be consolidated to create one private table as a project on to post it in the project section off this class
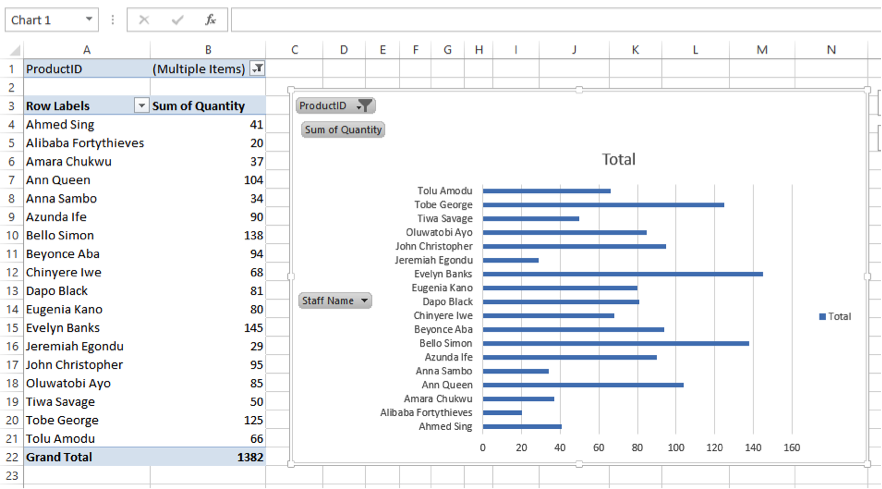
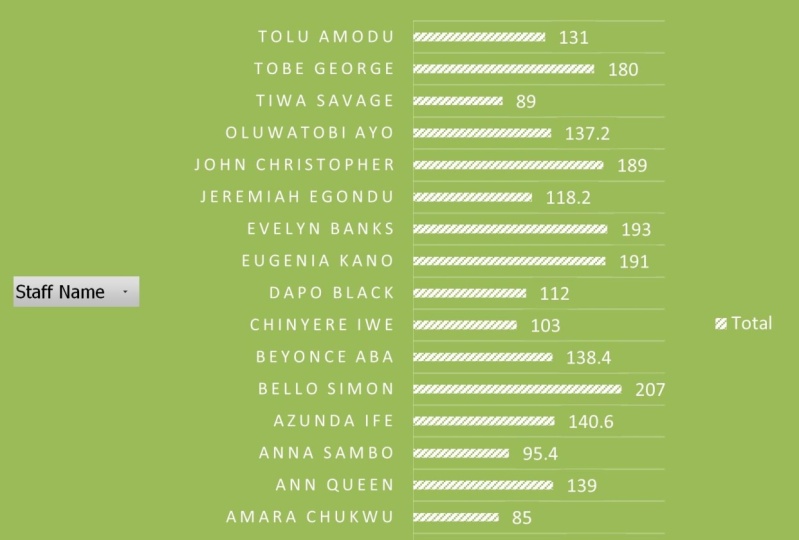
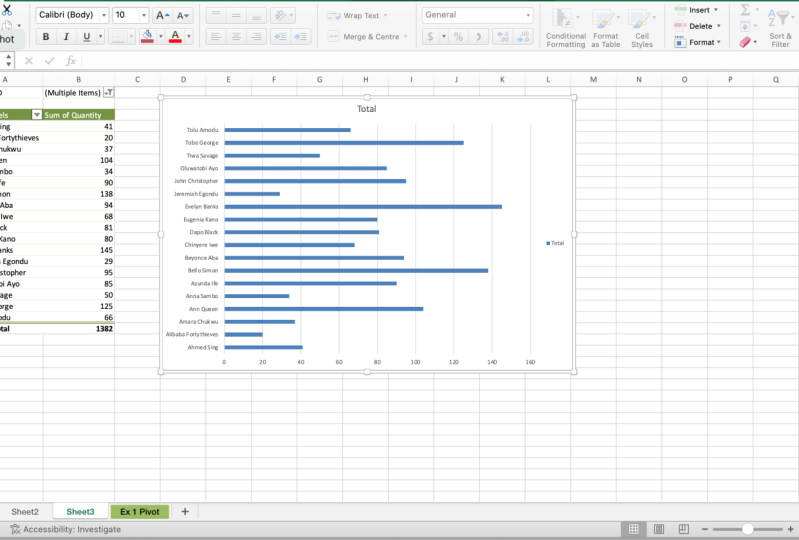
9. Pivot Charts: finally, let's because how we can create I have worked chocks that are linked to powerful pie. What tables From our data record. In previous lessons we created the pilots, chats, the private table and pie. What chat wizard? And we dis books. And right from the beginning, we can create a pilot Shots together with a private table can create both of them at the same time. So to do this whilst our data eyes open, we click on Piper Table and private chats Wizard and we're using our Excel list or deter. Bees were not constantly dating at this point and isn't of creating a pilot table. We created private chart reports with a private table, and here now we have our our marching ants around our data, which ends at rule 18 So they want to hitch 109 is our data on would like to create this charts on private table on a new worksheets. So when we finish here, we now have our normal blank private table and platform and another place where charts will be automatically created while we create our private table. So if, for instance, we want to know how much I was sold by each employee. We can take our employees, as we have previously dull we can take it to. Now here you're seeing private chat fields. If we take it to employees, it's the same thing as taking it to the rule area in our pilots able. So if we click on private on the private table here, we see that we've taken employee ideas into the rules on If we click on the charts, we have taken it into the axis. I will see what it will produce for us when we put in the values. So if we have the employee, I. D. S are rather listen to use the employee names for clarity so we can move. I DS take the employee names into the rule area. We cannot take the quantity sold into the values. So we take quantity sold into the values, will observe that as our pilot table has sure lost the quantity sold. It has also produced a graph simultaneously showing us all that was sold by each employee. Obviously, we can play around with this. We can change the formatting. We can do all sorts of things with this information the way it is. So if you're not comfortable with the type of graph you can go back to once you've clicked on the on the charts, you have a private chat tools available and you can go to design. You can change. You can change the design of the chats. Okay, can change the design off the charts. Toe what suits your reports. You can also change the type. So if, for instance, and the type which is a column charts, which it took by default is not what you want, you can change it to a lion. Charts on the example is sure in the middle here, if you hover over it, it will toe increase on. You can see what the lion chats is going to be so you can choose what kind of charts you like and your data to be represented. Us. Let's take this, for instance, with which is a close dad back shots. And if we look property for look clearly, we'll see that because off the because of the size, some of the names are not showing, so you need to be very careful on ensure that all the names are showing here showing alternate names. So you need to size your chance to such an extent that all the names will be showing so we can see here now that we have the quantity sold for each employee on as in a normal Excel graph. If you want me, if you want the at the values to show you actually go like a normal Excel chat on your type , are you put in the data only bills or call outs, as the case may be, which would now show you the the figures for each employee so you can play with this function. Use different types off charts here on different types off for months to get the charts toe the way you actually wants. And that's how we creates about very powerful private chats, which you can now copy and paste as a picture in your power point presentations, just to have more sense off your data.
10. Project and Final Remarks: - know that we have learned how to make powerful private tables and charts. I'm sure it will revolutionize the way you make your reports. I invite you to using the files provided Make your own private tables from Piper chats. Play around with the difference for months on the different scenarios, in turn, creates on Excel. Make sure you post your final results in the project section of our classroom. Thank you very much for joining.
 Linda Adiele, MS Excel teacher | HR expert | Artist