Transcripts
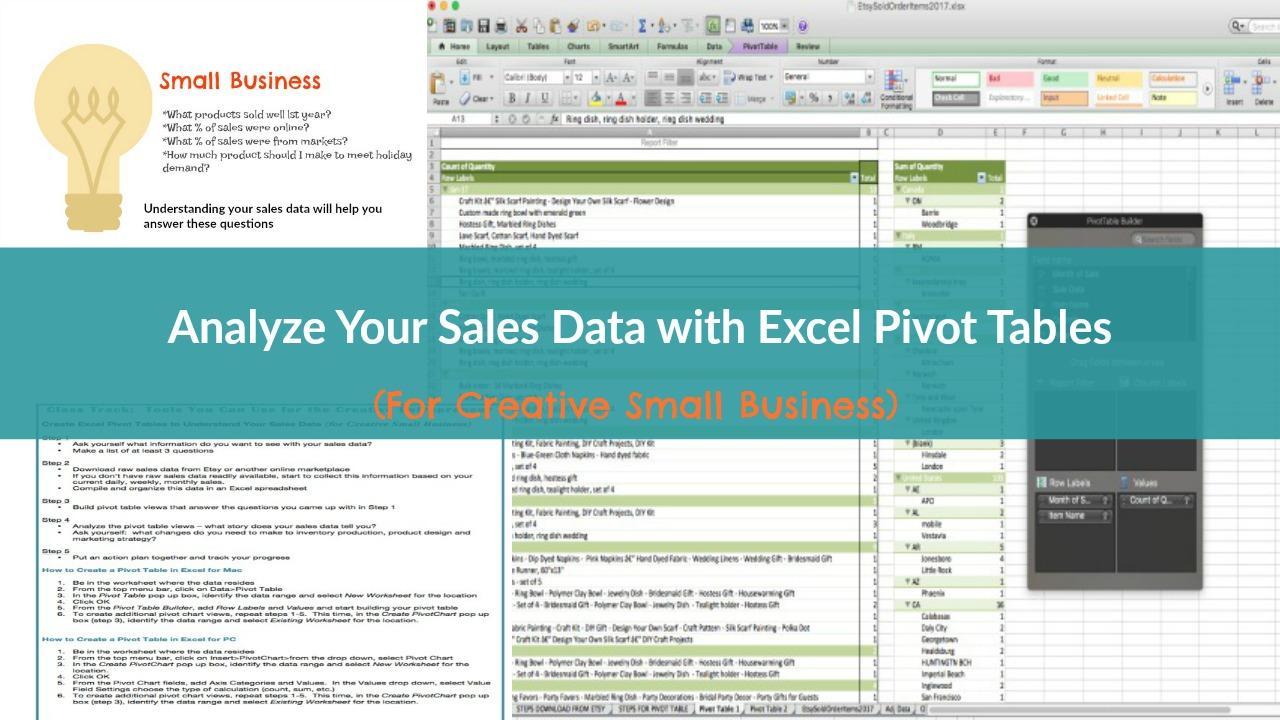
1. Introduction: Hi, everyone. My name is Rika. I've read a creative business where I sell handmade products on Etc. And Amazon handmade. Now I want to ask you when you hear the term big data, what comes to mind? You probably are thinking in terms of large companies and how they utilize big data. And you might be wondering, I'm a small business and I'm a small creative business. What does this have to do with me? Well, first of all, it doesn't matter whether you are a large business or a small business. Understanding your data and in particular sales data is really important. And I've taken a very strategic approach to understanding my own sales data, and that has helped me understand my business in more depth and really help me figure out what direction I want to grow in and how I want to grow. So that's what this course is all about. I'm going to show you how you, the small creative business owner, can analyze your own sales data using Excel activity. Here's what you'll learn in this class. What a pivot table is. What questions you should be asking when thinking about your sales data had a download, sales data from etc. How to create pivot table views. And if you're not on etc. And don't have readily available sales data, I'll even walk you through how you can start to manually collect data. And finally, for your class project, you'll be creating a pivot table, use of your own sales data and analyzing it so that you can understand what story you're sales data is telling you now. This is a beginner level class targeted towards creative business. Owners sell on Etsy, Amazon or other online marketplaces, but really, anyone can take this class if they want to have a basic understanding of how to analyze data. However, this class does assume that you know basic itself and just focuses on how to create river tables. And finally, there is a downloadable PdF included as well. It is a one page PdF but lays up the four step process to understanding your sales data and step by step instructions on how to create a pivot table in Excel. You'll find this. Pdf in the class project section. So what are you waiting for? Let's get started and learning how to understand your sales data better by creating pivot tables. See you in class
2. Lesson 1: What is a Pivot Table?: now in this lesson, I want to go over the basics of what a pivot table is. So ah, pivot Table allows you to organize large amounts of data in a meaningful way so that you can better understand sales trends and you'll be able to make decisions about inventory production, understand where your customers are located and just in general, make decisions about growth and direction of your small business, the more you could understand your sales data, the better decisions you'll be able to make. So let's take a look at thes pivot table views and understand the basic components that are role able and value. Now, in the next couple of lessons after this, I'm gonna actually switch into Excel, and we'll go over in more detail about how to create these pivot tables and how to gather the data. But for right now, let's just take a look at this one slide so you can see that a pivot table eyes really made up of a row label and value. So when you think of the role able, you have to think about what criteria you want an answer, or like you're asking a question toe understand your data better. For example, you know what is the breakdown of online sales versus in person sales? Or, you know, how many products are sold each month online and in person are just in general how maney products are sold online versus in person by month and then even by country, like how many products did you sell in different states in different countries? Okay, so when you ask that question and you picked your criteria, you'll be able to get very specific answers. And the value is the actual amount that you actually want to have counted or some. Okay, so I usually use count. But just know that you click on this, you can actually pull the some you can pull average maximum minimum. There is a drop down of different types of values that you can choose from. I think the most common that you will use will be count or some. So in the next few lessons ahead, I'm going to show you a step by step approach on how to create a pivot table for your own sales data, how to use data from your Etsy shop. And if you're not on Etsy Or maybe you're using a different marketplace. I'm going to provide you with suggestions on how to collect the raw data. And then I'll walk you through on actually how to create pivot tables in Excel. Um, for the Mac, like the Excel version for Mac, as well as the Excel version for PC. It's slightly different between a Mac and a PC, and I'll cover both, and I normally work with a Mac so all of my excel is done on the Excel version for the Mac . But I am also very familiar with PC and the Excel version for the PC as well, so I will see you soon in the next lesson.
3. Lesson 2: Deciding on the Information You Want: Now, before we dig deep into the data and start creating pivot tables, you first need to be clear on what information you want to see as a small business owner about your sales. For example, for my own business, where I so handmade products on FC and Amazon, the type of information I want to know from my sales data for a given year is the following . How much inventory should I plan for it during peak holiday season? What products cues sold each month and how many? Which countries and states did my products shipped to getting answers to these questions and understanding when sales data will help me make better decisions on how much inventory I need to make at different seasons throughout the year? Help me decide on which products to continue selling which colors I should continue selling and focus on growing them and which products to eliminate. And also it will help me understand where there is a demand for my products in a particular country or state. So now it's your turn. This is part one of the class project. I want you to come up with 2 to 3 questions that you would like answers to regarding your own sales data. And now, if you don't have sales data, but you're managing is just a big project or operations or some other task within your business. Perhaps your questions might be around efficiency and improvement. So things like you know how many complaints are received in the given months or how many customer reviews were submitted in 1/4 or how Maney customer surveys were sent out in a year. Things like that are the types of questions you might want to have answered. So go ahead and type of questions and a word document and save it sales, data analysis, questions and submitted in the class project section. So in the next lesson, we're gonna go over downloading and collecting broad data.
4. Lesson 3: Downloading Raw Data: Okay. So in this lesson, the focus will be on how to download etc. Data and in the next lesson, all offer some suggestions on how to manually click data if you don't have sales data readily available. Okay, so if you haven't Etsy shop, you're going to log into your Etsy store and you're gonna go to shop manager, then you're going to go to settings, then you're gonna go toe options, and then you will see the screen right here where you're going to click on the down load data tab, and this is the view you will have. And as you can see, there are four different types of reports that you can download an at ST and the reports that I normally download or order, item and order. So for this lesson, we're gonna focus on the order items report. So you just select order items from this drop down. You leave the month as just as it is as month, because I actually want to see the whole year. If you want to see a specific month, you could just click on that specific month. But I want to see the whole year, so I've selected 2017 and then I'm going to click on download CSB. Okay. And what you're gonna see is something like this. You're gonna have this view just know, for privacy reasons, I have already taken out all of my customer data informations on the buyer name, the street address. You know, all of that kind of confidential information. I've taken all of that out. So in your at sea download, though, you will have your customer information in there. So it is a CSB format. So the first thing I suggest that you do is go and do file save as and you can keep the same name. But just change that file format, you would select Excel workbook, and then that will automatically have this X l s X extension on it. So I recommend that you do that first, we just go ahead and save it so it's no longer CSB. Save it into an excel for Max. Okay. And as you can see from this file, it Z not very, you know, pretty, there's things, the columns, Hurwitz or not correct. And you can't see everything really clearly. So what I recommend that you do is go ahead and adjust some of these Colin wits. Now, just to note that this course on pivot tables is assuming that you have basic knowledge of excel, You know how to adjust. Call him with, um and you know how to insert data and insert rose and delete columns. It's assuming that you know all that information. Okay, so let's just make this a little bit bigger. We've made our transaction. So the item name I can't really see. I didn't see my item. Titles are pretty large, and I can't really see it. So first of all, I'm gonna make that a little bit larger, and then I want to just wrap the text because it still can't see all my titles. So I'm gonna select this whole call him, and then go up here and do wrap text and then do rap right there, and it will It will adjust that. So I'll actually make this a little bit bigger. So if it's a little nicer, Okay. So the other thing you want to do so remember, in one of the prior lessons we went over, um, you know, what is it that you want to know? what information That you want to know from your data, right? That was your part. One of the class project. So keeping that in mind, you may realize that you don't really need all of this information. You may only get some information you may even have to add in information. So I've actually done some of that data massaging. That's what I refer to is when you're manipulating data accommodated massages. I've already done that. And that's right here. Um, so that just took. I just basically took this data here, and I copied it over on when you downloaded. This will actually be your default name. BSE sold orders items 2017. That will be your default name. And it will have a CSB on the Independent. So I suggest that you just double click on this tab name and change it. Ah, and remove the CSB because it's no no longer in that format. So here I have my data, the other things. I went and deleted, like if you go back to the original, there were a couple of extra columns here that said in person discount in person, local V A. T. It's not really anything I need. So I went ahead and deleted these four columns. So they're not here anymore. Deleted those out. And the other thing, I decided that I actually only want to analyze my online data for this pivot tables, and I'm gonna create I don't really want to analyze the in person. So there's two ways you can do this. You can actually just manually eyeball and look through and then just select, you know, the ones that you don't want to have in your data anymore, and then just click on delete. Okay, so that's one way you could do it. The other way is you can put a filter on it. Okay. The filter adds the arrow. Okay. And the order type, I can actually filter. I could find Seiken. UNSA left all that. I can find everything it says in person. So that way I can just delete these one at a time, okay? You can't highlight how I did it in the previous example. When I didn't have the filter, I just highlighted things. And I said you could delete that. You can't do that when you have a filter. Because if you do, you're gonna delete additional information. If you see here, sometimes the roads are skipping like that goes from 16 to 21. So if you were to just select these two and delete, you're gonna be deleting data that's in row 17 18 19 and 20 and you don't want to do that. So if you are doing it this way, you have to literally select row by row. So I would select wrote eight. I would click on delete, and then I would select Row nine, and I would click on delete Select Row 10 click on Delete and so on. Okay, so that's how you can clean up your data. So here, this is a clean view. So you can see here. I only have online, and I got rid of the extra information that I didn't need. I probably could get rid of some additional data like transaction. I de listing I d number. I probably don't need that, but I'm just gonna keep it. I'm not gonna, um, you know, clean it up that much. Okay, so now we have our data the way we want it to be, and we're ready to create pivot tables, but in the next lesson. I'm first going to go over how to manually collect this data in case you don't have these raw data reports and then a lesson. After that, we'll start to build our pivot table in Excel.
5. Lesson 4: Manually Collecting Raw Data: Okay, So in this lesson, I want to talk about Amazon sales data and what to do if you don't have readily available sales reports. Okay, so first, let's focus on Amazon. So if you do sell on Amazon, they do provide performance reports that allow you to select a timeframe and this NC sales orders by months or different views, Which is great, Um, and you can even download them as a CSP bile. As you can see here, if you just click on that download, you'll be able to download as a CSC format. Um, and in Amazon you would actually go into your dash for you, would go to reports and you would go to business reports. And that's where you'll see these different views on this particular views, actually sales and orders by month. And then I switched into a skew view so that I could see what skews were selling. I can see the quantity okay, so that it's great that you do get a lot of reporting in Amazon. However, um, I still find it's not granular enough for the kinds of information I want and the kinds of analysis that I'm looking to do so. And this is what I would suggest if you're on other platforms, like society six or a spoon flour, because I don't know what level reporting you get. Unclos platforms, As I am not selling with those platforms at this point, um, so I would actually love to hear from anyone if anyone does sell in society six or on spoon flour. If you could just leave a comment in the community discussion board and let us know, like what kind of reporting, Uh, sales reports you get on those platforms, that would be helpful. So in the event, though you don't get the the level of detail that you want, you may have to manually put your data together, which is not the most ideal way to do this. However, when you're a small business and you can't really afford, you know more expensive data reporting tools, this might be the best way to do it. I think collecting data is very important, especially if you're a small business, because you do need to know you know what's going on with your sales. You could make better decisions as we've been discussing throughout this course. So what I've started to do for my 2018 sales is I just started to collect this information in except And this is what I suggest that you do if you don't have enough sales data to begin with. So I really want to know by months. You know what? Selling the skew. Um, what quantity sold. And I'm I am particular to know about the ship to city and the ship to state. And, of course, a ship to country. Most of my sales and Amazon are to the United States, but I do get occasionally international orders. Um, so if you collect this every month, then by the end of the year you will have enough data that you can do more meaningful data analysis. And you know, you've pivot tables to understand that data a little bit more. All right, so this lesson again was really about what to do when you don't have readily available sales data and how you can create your own if you don't have it. And in the next couple of lessons, now we're gonna dig deeper into actually creating pivot tables or our data that we have already closed
6. Lesson 5: Create a Pivot Table in Excel for Mac: Okay, So in this lesson were actually to create a pivot table using the Excel version for Mac. Okay, let's recap what we've done so far. First, we made a list of questions that you want to get answers for regarding your sales data. That was part one of the project. Next we downloaded the orders item report from Etc. And we cleaned it up so that the raw data is relevant to the type of information we want to know. And if you didn't have S e data, you either manually created data from historical information or you downloaded data from another online marketplace platform, and now we're actually ready to create our paper table. But actually, before we start, I just wanted to go back to the raw data and show you one more change I've made to the raw data. I actually inserted this column called Month of Sale, and I manually typed in the month of the sale for each item that was sold. Although I have the sale date, I want to be able to roll it up to one level higher and just be able to view the sales by month. And I'm not able to do that, given the data that I downloaded from etc. And that's why I added this column that says month of sales. Okay, so let's just go through the steps on how to create a pivot table and then we'll actually create one. So your first of all gonna be in the worksheet where your raw data resides, and from the top menu bar, you're gonna click on data and Pivot table and then the create pivot table Papa box is gonna come up, and then you're gonna select the range, and in this case, you're going to select you worksheet for the location, and then you're gonna click, OK, And then you add the role labels and the values and you start building your property. So let's just actually do this. So here I am, in my data, Okay, This is the whole range of data that I'm going to select. So I'm actually gonna go to data pivot table, and I can see that the range that of data that I want is the correct range. If you're not sure, you can actually just go and drag from a one all the way to the end of the data just to make sure you're capturing everything. But this looks like it is the correct range that we want. And you can create your pivot table in the same worksheet or in a new worksheet. So in this particular case, because we have a lot of data, I am going to go ahead and select new worksheet. That's where a pivot table is going to be creative. So I'm gonna click on, OK, and it's going to create this you worksheet on. So now we can start to build our pivot table. So again, it's going back to those questions. And those criteria is like, What do I want to see? So I definitely want to know. Month of sale, right? I want to know, Like what? What selling like which month products sold. So the month of sale is there. I want to know specifically which products sold in each month. Okay. And I want to know the quantity, so I'm gonna put quantity over here undervalues, and I don't want some. I actually want the count. I'm gonna change it to count and click. OK, so this is my first pivot table I've created and As you can see, I can see, But each month, exactly what was sold and the quantity, like which products sold in which quantity sold. So this is good information for me to have so again when I'm planning my inventory for this coming year. I know during my peak selling period October, November and December, these were the main products that sold. And these are probably the product that I want to make sure I have enough stock of in my inventory. Okay, so this is our first view. But, you know, I may want to now, no. Where did my products shipped to In which countries? I sold products. So I want to create a you pivot table. So I'm going to just get out of this pivot table. And, you know, you always know when you're out of the pivot table when you no longer see that row and value box. If I click back in the pivot table, I'm going to see this pivot table builder. So I any changes I make to the pivot table builder is going to impact this particular Pima tickle. But now I want to build a new pivot table so I'm going to place my cursor right over here, and I'm going to go through that same process against I'm gonna go to data. I'm gonna go to pivot table. And this time you could see that the range is not selected. I actually have to go back and select the range. So I'm going to go back to my data sheet, which is right here, and I'm just going to select this whole range all the way down to the 98. Well, we don't like that. And once I release it, it's automatically there. Um, and at this time, I wanted to be in the existing worksheet, right? I don't want to create a brand new working. I want to keep building another pivot table in this same worksheet where I created the previous pivot table. So now I'm gonna click, OK? And I've got again my pivot table builder and the areas where I'm gonna add my criteria. So this time, what I want to know is first, I'm gonna start with country, so I want to know where did my products shipped to a German That simply put it, their military put it here relabel where my products shipped to on. Then I want to know the ship state. Which states did it go to? And let's say the ship city and I also want to know in this case, I wanted to account of the quantity again. So my value is the quantity and so I can see now, Obviously, most of my, um, sales have been in the United States, but I do have a couple of international orders, like to the UK have got seven Switzerland one, and then I've got a couple orders to Canada and within the U. S. I've got 16 orders to California and C 16 hours to count 14 artists in New York, so I can see that my main customer base really is California, New York, and it looks like Pennsylvania is up there as well. Okay, So knowing this information is just helpful, because if I'm doing any kind of special marketing or, you know, I want to do some very specific targeted marketing than I know, maybe I am going to do some kind of targeted marketing in California because I have a large customer base there. So this is how you build pivot tables Okay, so I'm actually to switch over to the Amazon data that I created earlier. This is the manual information that I was creating previously, and we'll just do this again just to make sure you understand the steps. So again, this time I'm gonna be in the same worksheet because I don't have a lot of data here, So I'm gonna go data Piven table again. I'm going to select my range, which is right here. Okay? And I'm going to do existing worksheet, actually, Just want to build it right here. So once again, my pivot table builder pops up and I'm going to do the same thing. I'm gonna to see which countries and states I ship the most product to. So I'm gonna do chip to country in the road, and then I'm gonna have shipped to ST and then shipped to city, Okay? And then I'm gonna add the skew. Let's see if I can do this man at the skew which skews went to which cities and then I want quantity sold. I want the value here and I want this to be count, not some. And there we go so I can see again that which products went to which state? And you know, I don't have a lot of data here, but as I build us up and I have more data for the whole year, I might be able to actually really see some trends that will help me with my inventory production. It will help me with my marketing. Um, it will just help me with my overall general business direction and growth. All right, so that wraps up how to create a pivot table in excel for Mac. And next, I want to show you the same process. I'm gonna show you how to create pivot tables using the Excel version for PC.
7. Lesson 6: Create a Pivot Table in Excel for PC: in this lesson, I will go over how to create a pivot table in Excel for PC. It is slightly different than the Excel version for Mac. Okay, so now we have You can see here we have our downloaded data from Etc. And we covered how to download and clean up this raw data in lesson three. So I'm not really repeating those steps again. We're just going to really focus on creating a pivot table in the Excel version for PC. So let's follow these steps. Okay? We're gonna be in anywhere in the raw data, right? This is our data. We want to create a pivot table around this. We're gonna be in our raw data and from the top menu bar I want you to go to insert, and then you're gonna go to pivot chart, and from this drop down, just select pivot chart, okay? And you get this create pivot chart, pop up that comes up, and for the range, it automatically selects the race. So just double check and make sure it is correct. And this is a range that we want to use. So I'm not gonna change that. And for the location where you want the tip it chart to be placed. Uh, select new worksheet and then click. Ok, so now we have this new worksheet. If you want, you can go ahead and rename the worksheet as pivot table. Okay, so now you'll see here in the Excel version for PC when you create a pivot chart, pivot table. Rather, you also get a chart. It will automatically create this chart for you. Um, if you find the chart irrelevant or not useful, you can just delete it. But I would suggest waiting until you complete the pivot table information first and then decide if this chart is useful for you or not. And if you just want to move a chart out of the way for right now, all you have to do is select it. Make sure you get those, um, was double arrows and then just move it over to another spot. So it's a little bit out of the way. Okay. And then now we have, like, the pivot chart feels This is also similar to the Mac version of Excel. Now the differences in the Mac version of Excel we had role able and value. But in the PC version of Excel, the row label is now called access categories. But it's the same thing as row label. It operates in the same way it functions in the same way that I showed you in less than one . Okay, um and the values is the same thing that we already covered in less than one. So let's start to build our pivot table. Now, this is the question I want to answer. I want to know what quantity of products did I sell in a given month. Okay, so I'm going to first select month of sale because I want to know that's you know, how many products sold in each month, and I'm just gonna drag it. So when you get those four arrows like that, you could just drag it down and make sure you drop it below that line. You'll see that line. Don't drop it up here. It's not gonna It's not gonna take it. So drop it in the box over here, below the line, okay? And so you can see already we've got our months show up. And then, of course, I want to know which items sold in each month. So again, I'm gonna go up over here, select this and then drag it below month and you'll see that line again. Come up. You don't want to put it above because then it's going to categorized by item name first and then months. That's a different view. If you want to want to see it that way, that's fine. But for our question are specific question. We want to know what items sold in each month, so we would drop that right below. And you can see now I have all my product item names by each month and for the value I'm gonna go to quantity, cause I want to know how many of each of these items sold, and I'll drop it here in the value box. And once again, you have to drop it below that line's I've dropped it here. Now you can see it automatically just defaults to some, and in this case I don't want some. I want count. So for me to change that, I'm going to click on this drop down and I'm going to select value field settings and this opens up the value field settings. Papa box and I want to change the calculation that I want to use, right. I don't want to use some in this case, I want to use count. And so just know if you did want to use some, you would leave it a sum or if you wanted to change it to average or any of the other calculations. You could do that here. Now, for the pivot tables I create most often I'm just using count and then I do use some. Also, if I want to know like the, you know, sales volume or order volume by each month, I would use some, but a lot of times I'm just using count. So then you click on OK, and now I've got I know how many products are items sold and each month right, This is like the summary the 19. I sold 19 products in November, and then this breaks it down. How many of each item I sold? So that's one view. So now let's say I want to create a second pivot table and the second pivot table. I want to answer which country and state did I shipped my products to in a given year, and I want to know the quantity that shipped each country and state So and I want to create the second pivot table in the same worksheet. So I'm just gonna first of all, move over And here's a chart. So I could decide if this chart is relevant. I may just leave it for right now and I can change the name. I'm not gonna deleted just yet. I'll just leave it as is. So for my second pivot table, I'm gonna move over here, So make sure when you're creating another pivot table on that same worksheet, you put your cursor prompt in a space where you want to actually build this other pivot table. So I'll just put it in actual, put it over here and l to Okay, so I'm going to do the same thing. Now I'm gonna go to insert right. I'm going to go to pivot chart pivot chart, and then you'll notice this time when I'm building another pivot chart. The range is not populated. I have to manually do that. So I'm gonna go back to my data, and I'm actually going to just select the whole range. There we go. And in this case, I don't miss. I don't want a new worksheet. I'm just building my pivot chart views in the same worksheets. I'm gonna use existing worksheet and I'm gonna click on OK, And now I've got this other pivot table builder that comes up. Rights of the chart just is right in the middle. I need to move it out of the way because it's not helping me. If I keep it right there, I'm gonna actually move the chart to right over here. And the question again that I want to answer is I want to know how many products I sold in each country and state. So I'm going to first select shit country. Drop that down over here and I want to do Ship State. I could use Ship City as well, but I'm just gonna keep it country and steak a little bit higher level. And I wanted quantity again, so I'm gonna go quantity. Bring that over here and again. I want to change it to count. I don't want some, so I'm going to change it to count. Okay, so this tells me that in terms of my international market. I do have the most international sales to the UK now. Obviously, most of my sales are domestic there in the United States. And I can see I've made a lot to you, California and New York or my to stop to top states where I make sales to. So this information again just helps me. Ah, in terms of my production planning, in terms of my marketing in terms of, you know, maybe I want to dig deeper and understand. Well, what specific products are my customers in California drawn to? And, you know, maybe I I focus on different designs that might appeal to this market, even though I may still market the whole country. Maybe I have something a little more specific that's cuter to California. These are the Texas decisions I would have to make based on this type of analysis. Okay, so this is how you create a pivot table in the Excel version for PC. So it is similar to the Mac. Um, so now you know two ways, you know, excel for PC and, you know, excel for Mac. And I will see you in the next lesson.
8. Lesson 7: Class Project - Create Pivot Table Views & Analyze Results: part two of the class project is to create pivot table views of your sales data and analyze it. What story does your sales data tell you? Are you able to get the answers to the questions you came up with in part one of the class project? Ask yourself, what changes do you need to make to inventory production, product design and marketing strategies? And finally, start thinking about an action plan on how you're going to implement these changes and track your progress? This is actually a big part of the project management functions. Now stay tuned because I will be launching a class on project management suit. If you feel comfortable, submit the pivot Table views in Excel format in the Class Project section. Alternatively, you can submit the analysis and conclusions you came to based on the pivot table analysis. I look forward to hearing from you and having some very active discussions about what your data is telling you.
9. Conclusion: thank you so much for being part of my class. I really hope you found this information useful and that it will help you understand your sales data so that you can make better decisions about how to manage and grow your small creative business now. Also included in this course is a one page pdf that lays out the four step process toe, understanding your sales data and step by step instructions on how to create a pivot table in Excel for Mac and for PC. It's essentially everything that we have covered in this class. Now I really love to hear your feedback on this course and any suggestions on how I can improve it. In addition, if you have other suggestions for new class ideas, please let me know, because I would really love to hear. Now make sure you do follow me here on skill share so that you could be notified. But any of my new classes launches see you again real soon.
 Rekha Krishnamurthi, Mixed Media and Digital Artist