Transcripts
1. Introduction to TradingView Tutorial Class: This trading view tutorial, I'm going to share
with you how to use the trading view
charting platform. I will take you through
the basics of setting up, customizing, and using this
powerful trading platform. You will discover how to
analyze trading view charts, how to use trading
view drawing tools, how to conduct research
within trading view, how to create your own personalized charts
and trading strategies within trading view, and more. By the time you have
finished with this video, you will know all
the tips and tricks on how to get the most
out of trading view. Don't miss out on this complete
trading view tutorial. Additionally, make sure that you follow me on skill share
so that you're able to be notified once I upload additional content
onto the platform. Without further ado,
let's get right into it.
2. Signing Up to TradingView: Right. So first, I'm
going to show you how you can create a trading
view account for free. If you already have a
trading view account setup, feel free to skip this section. To create a trading
view account, simply go to the
Trading Ve website, select the Blue Get
Started button. You'll be taken to the plans
page where you can sign up for a free or paid
trading Ve plan. As you can see, the three
main subscriptions that are offered by Trading
Ve are the P plan, the P plus plan and
the premium plan. Can get a free trading
view trial for 30 days on any of the plans if you're
new to trading view. I always recommend that new
or beginner traders go for the pro plan as it'll give you all the tools that you'll
need as a beginner. You can always upgrade to a more advanced plan as you progress within your
trading journey. Alternatively, you
can sign up for the free plan for trading view, that comes with
various limitations such as displayed
advertisements, a maximum of three
indicators on a chart, no time intervals
or time frames, limited historical data, and a variety of
other restrictions. To see all the
differences between the free plan and
the paid plans, simply scroll down to the
compare plan section, and you'll be able to see
all the different features and allowances included
within each plan. That being said,
the free plan is still a brilliant place
to start with trading. Get enough functionality
and features to make a decision on
whether you want to progress to a paid plan or not. Besides, you get a
free 30 day free trial on any of the paid plans and can cancel the subscription
anytime before the free 30 days period is over so that you
don't get charged. And once the plan is canceled, you will automatically
be signed up to the free trading
view version, and you can always
upgrade later. There's also no rush
to upgrade as you can get the free version for
as long as you need. Although I'd recommend the
pro plan for new traders or beginners that want to take their trading and investing
journey seriously. Let me show you how to do this. To set up a pro plan
trading view account, select the button within
the P plan section. Sign up using Facebook, Google, or by simply typing in
your e mail address. Create a password and activate your trading
view account using the link that will be sent to the e mail address that
you registered with. You can create your
profile on this page by uploading an image and inputting
your name and last name. Select continue, and you'll
come back to the plans page. You'll have to select
your desired plan again, and note that the
platform may be running a special offer
for an annual plan. I'd recommend that you trial the account type that
you would most likely go for if you were to have
a paid trading view account in the future. This way, you know
that you're getting all the features you need
when your trial ends. You just want to see the full unrestricted version
of trading view, then opt in for the
premium account trial. I will sign up using
a monthly pro plan in this tutorial as I
have a premium plan, which I already use on
my personal account. Select the bottom for
the plan you want, and you'll be taken
to a payments page where you'll have to enter your payment details if you
chose a paid free trial plan. But you won't be charged
if you decide to cancel your free trial before the
free 30 day period has passed. This way, you get to see what a proper trading view account is like before committing
to actually paying for put your details and select
the button to the right. You will then be signed up for a free paid plan for 30 days, and the last day for the free trial will be
stated on this page. Select start charting to
begin using trading view, and you'll be taken to
the chart section of the website where you can use your new trial plan features.
3. How to use TradingView drawing tools: Now that we have created a trading view
account and we are on the trading user interface, the charting user interface. If you have never used a
charting platform before, this can look very
confusing and daunting. Let's break it down. What I'm going to do is
I'm going to break down the interface into sections, and this should make
it easier to digest going to start off with
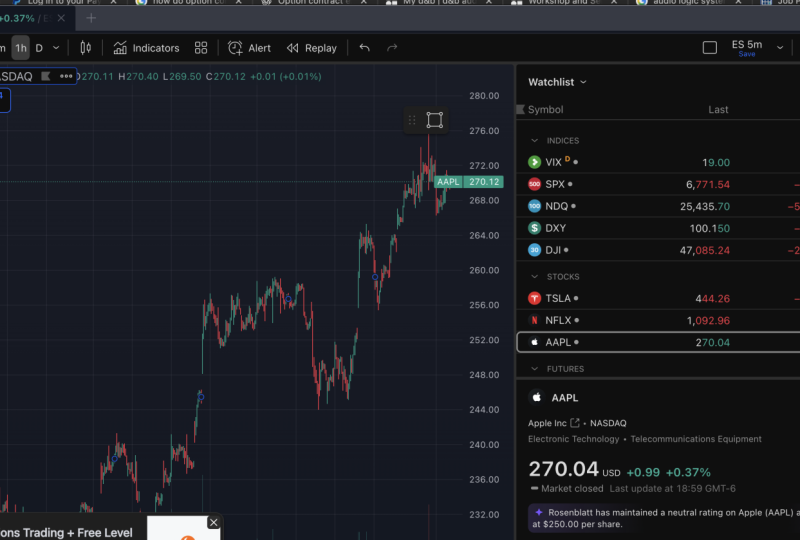
the larger section, which is the chart itself. So you can see we
have a chart here, which is a candlestick chart, and you have green
and red candles, and these are all candlesticks going up and down in price. On the white axis to the right, we've got the price in US
dollars and on the x x bottom. We've got the timeline, which is the dates in months. But if you look at
each candlestick, you will realize
that it represents one day because we're
on a daily time frame, and we will go through
time frames in a second. And just underneath right
at the bottom here, we've got volume bars, and these are daily volume bars. They just show how much volume is being traded on the current and if you look at the
top left hand side, you'll be able to
see the volume. So at the moment, the volume traded on Wednesday 30 November, 2022, was 111.381 million. Just above that, we've got a red button and a blue button. These represent the buy
price and sell price. So if you're trading
your account is connected to a broker, you can make a buy OS order
using those two buttons, and just above that, you
will have a description of the ticker that you're currently looking
at on the chart. As you can see right now, this chart represents Apple Inc. This is a daily chart. That's what represents Py one D, and it's data from
NASDAQ on trading view. Just to the right, you can
see the letters, O, H, L and C. So these letters
stand for opening price, the highest price,
the lowest price, and the closing price. When you're analyzing
a candle stick, you can just look at
these letters to know the opening price very
quickly, the highest price. The lowest price or
the closing price. And to the right
you have plus 6.86. This represents the
change in price. Further on to the
right in brackets, you have plus 4.86%. This represents the percentage
change on the price. Next, we're going to go over the section on the right
hand side to the chart can see that we have a watch
list that is pre populated. You can always change
this and add in any stock or crypto orf that
you want on your watch list. But this is currently
pre populated, and what you realize
is that you've got symbol last change and
percentage change. So the symbol just represents
the tika for the stock or crypto orph that you will
add onto your watch list. The last stands for
the last price, so that will fluctuate
as the day goes, and change stands for the
change within the price. Will fluctuate as the day goes, and the percentage
change also represents the percentage change in
price as the day goes. To add a stock crypto
or Fax symbol, all you have to do is select
this plus button right here, and you'll be able to search for a symbol that you can
add to your watch list. So in this instance, you can search for BTC, for example, and that will show you the BTC pairs available. If you know the full pair
that you want to search for, it is best for you
to type it in. So we want a BTC USD So we are going to select the
second one because we can see right here that this
is for the symbol BTC, and the description is
Bitcoin United States dollar, and we can see that this is
a spot crypto on coin base. So this data will be represented from the
coin based exchange. That's why we're
selecting the second one because I use coin base to trade crypto or to get
into cryptol and then I transfer my crypto
to a different exchange, and then trade on that exchange. To add this symbol
to the watch list, all we'd have to do
is simply select the plus button to add
it to the watch list. And as you can see, it's been added right here at the bottom, where it says BTC
USD right here. We can see this one as a
Bitcoin US dollar peer on the Bit stamp Exchange. And just below that, we've got a Bitcoin US dollar peer
on Binance Exchange, and then we've got
Etherium USDP on Bit stamp and Bitcoin USDP on in base, which we just added. So you can see that these are actually broken
down into sections. You've got indices at the top here, and then
you've got stocks. Then you've got futures. You can amend this to look
however way you like, and you can also add some flags to any
symbols that you like, and you can color code them just so that they're
easier to pick out. And just below this, we've got some news headlines. This section here just
shows you just market news within the
financial markets, and you can just select it to read more about
the news headlines, and that will just open
up, and you can read Educated or be more informed for your financial decisions. So if we come out of that. Oh, and by the way, if you wanted to edit your watch list, all you have to do is
just select settings and then you're able
to show other items such as volume or extended hours or take away
the percentage change. You can customize this
the way you want it. You can rename the watch list. You can make a copy
of the watch list. You can clear the list and then make a completely new one. You can have a ticker or
a description instead. So you can actually
edit this and customize it however
way you want as well. And just to the left, we've got the advanced view. If you want this to be presented
in a pie chart manner, you can use this view and
then you can actually see the percentages of the markets
that you're involved in, and you can scroll down and
see more information here, which is just the advanced view. You can also share your list. Next, we're going to go
through the tool bar. So we're going to
break these tool bars into six different sections. And we're going to
start off section one, which is on the far
left hand side. This tool bar contains
all the drawing tools and charting tools that you can use directly on the charts
to the right side. From simple trend lines to long or short position tools and horizontal support
and resistance. There are a lot of options and tools that you can
explore on this section. You can also right click to see an extended list
of each selection. Right now, we are looking
at the mouse cross, and you can change this
into a dot or an arrow or simply an eraser if you've got some
drawings on your chart. So if I select a
dot, for example, you can see now my mouse is
turned into a dot right here, and if I ask to select
the erasor tool, I can just click on any drawings to erase them that
I'll have made. I'm going to change
this back to the cross. And just underneath,
you've got trend lines. So if we right click or select this right arrow
Chevron right here, we'll be able to
see the extended tool lists that we have here. The main ones that I use
personally are trend line, horizontal line, vertical
line, parle channel. Those are the main
ones that I use. So if I select the trend
line, for example, I'm just going to
draw a trend line from the swing high. Right here. And we can see that we've got
our trend line right here. If we wanted to erase
that trend line, we could select the eraser tool and just click on it
and that will erase it. And if I just change that
to the cross cursor. Below that we've got Gan
and Fibonacci tools, so we can select a
couple of tools here, so we've got fibro trasment. And if you notice to the
right of each selection, we've got a star, and this will allow us to add
it to favorites. And once you add a tool
to your favorites, it will make it easier to
access it very quickly because you'll have
your favorites tool right at the bottom. I just select this start, I can to make this tool
one of my favorites. You can see that there's a pop up that's just
come up right here, and this is now
my favorite tuba. I usually just keep mine
right at the bottom here and the more tools that
I add to my favorites, they will appear right here. Whenever I want
to use this tool, all I have to do
is just select it, and then I can select
the swing high. Right down to the lull, and we can see the
fib replacement right here using this tool. I'm not going to go deeper into what Fibonacci replacement is. However, it is just a tool that traders use to determine
support and resistance areas. If we just select
the eraser cursor, and erase this tool
from our chart. Just below that we've
got geometric shapes. If we select these, we can see some shapes that
we can use on our chart. I'm just going to
use the triangle. Actually, what I'll
do is I'll add it to my favorites just
so that you can see how the tool bar gets added. So you can see it's now added. It's blue because
it's been selected, and I'm just going to draw
a triangle right here. So a triangle can be used as an area of support
and resistance. As you can see,
every time the price hits this resistance
line at the top, the price comes back down, and it's finding
support right here. And then it's going
back up. Once it goes near the resistance line,
it's coming back down, and then the support
line is going back up, and then resistance line is coming down, and then
it's going back up. So what usually
happens is that this happens until the price
gets towards the Apex, which is this area right here
where the two lines meet, and then price will either break out to the upside
or to the downside. Another way that you can
actually remove tools from your chart is to just right
click it and select remove, or you could just enter back space on your keyboard as well. That's a keyboard shortcut. Below that, we have
some annotation tools. You've got text, and
you can add images, notes, comments, et cetera. So for example, if you just
wanted to add some text, I have to do is
just select text, click anywhere on the chart, and then you'll be able
to type some text in. And you can drag
this text anywhere on the chart you'd
like to edit the text, you can simply double click
into it and edit the text. You can edit the color, the font size, make it bold. Let's make it white,
and let's just 28, and you can add a
background, et cetera, so you can play around
with these tools, and then you'll be able to annotate or write some
text on your charts. And to delete it, you can just select this bin icon to remove, or you can just select Backspace that will
also remove it, or alternatively, you could
go right up to the top right here and select this Chevron and select eraser and
just click on it, and it will be Era. Below that, we've got
the patterns tools. So if we right click and
select Elliott impulse wave, we are now able to draw
some Elliot waves, so this could be a one, two, three, four, and a five. So this is how you'd
draw your Elliot waves. Moving on, we have prediction and measurement
tools just below. This is where you can
select your long position. Or position, date
range, price range. Those are the main
ones that I use, especially the long
and short position. So if we select a
long position and put it in our favorites and
select it right here. And this would be for when you want to take
a long position. So for example, let's say we were willing to enter
a trade right here, we input our long
position to right here, and would set our stop loss
just below the swing low, and our target would most
likely be just at the resistant Right, either at the
first resistance here, or if you're confident
with the trade, you could go for the
higher target range, which would be right at
this resistance right here, so this resistance here. And that would give
you a good ratio of 1.92 in comparison to the
other risk to reward ratio. So you can see
we've got a risk to reward ratio of 1.92 here. And at the bottom, you'll have a stop loss, that will be a 5.59%
loss and in comparison to a 10.75% gain if your
trade is successful. So that's how to use
the long position tool. So if we just remove
it from our chart, and below that, we've got icons. So you can add some
icons onto your chart, such as thumbs up, thumbs down a tick. If we get this
ticker right here, and then if we click
right here on the chart, now we have a tick on our chart, as you can see right here. S can be used to
undertate or reference any plays or strategies that have been working
out for a trader. Next below that we have
a measurement tool. So this is just to measure the distance either
going down or upwards. So you can see that this was a 21.62% drop to this
candle right here, and this was for 31 bars, which is equivalent to 46 days. So this is very good because
you get to see some data right here on the chart just by using the
measuring ruler tool. And just below that, we've got an icon that we can
use to zoom into the chart. So if you select this, you can actually zoom into the
chart using your mouse. All you'd have to
do is just select a section on the chart that
you'd like to zoom into, and you'd be able to
zoom into the chart, so you can actually see
these candlesticks now. To zoom out, you
just simply select the Zoom out button and you go back to the original
chart that you were on. Next, we've got magnet mode. So what magnet mode
does is it will help you with drawing precise
trend lines on your chart. So we have weak magnet
and strong magnet. So if I demonstrate
using weak magnet first, you'll notice that
the icon has turned blue to show that magnet
mode has been turned on. And what we have to
do now is select any of our tools that we want to use to
draw on our chart. So if I use a horizontal
ray right here, So, now that's selected, when I move my mouse, you'll notice that
nothing happens until I get close to a
candle or a bar, and the mouse snaps
to the nearrest open, close, high or low. So as you can see,
it's just snapped right there to the opening
price of this candle. If I move down, it's
just snapped again to the closing price of this
candle. If I move down again. Just snapped to the lowest
price of this candle, and if I move up, it snaps to the highest
price of this candle. And as I move along
these candlesticks, it actually snaps
to either the O, the H, the L, or the C
of these candlesticks. However, if I am far
away from a candle, it doesn't actually snap. So that is the
difference between the weak magnet and
the strong magnet. Whereas, if I give an example
of the strong magnet, once I select that,
it snaps regardless How far I am from each
candlestick or each bar. As you can see, snapping
to the lowest point or the low of each candlestick because I'm further away
from the candlesticks. If I go closer, it
will now snap to the high or the opening
of each candlesticck, or the close of
each candlestick, or the low of each
candlesticck, as you can see This is very helpful when you're trying to be precise
in your drawing. For example, we may want to get this candle right here
and draw a trend line. What this has done is
it's made sure that this line is precisely
exactly on the high. As you can see if I
zoom in right here, you can tell that that line is touching the high of
that candlestick. And if we give an example
using a different tool here, if we use a trend line, let's say we want to connect these two points from this high. This high right here
for this candlestick. So you can see that
this has actually drawn a precise and
accurate trend line using the magnetic tool. And what we can do is we can
actually extend this line, and we will have our trend line set right
here as you can see. All I did was I double click it, and it will give you some
settings where you can actually select to
extend to the right. You can also select to
extend to the left, and there are other settings
that you can use here. You can add price labels, for example, and some
stats, as you can see here. Can also add some
text to this drawing, or you can also add
some coordinates, and you can also change the visibility of the item
that you've just drawn. So with visibility, it will now depend
on whether you want this trend line to be shown on a different
time frame or not. So these are some settings that you can actually change to your preference when
you're performing technical analysis
on any given chart. So if I just select okay here, can see that we have drawn
a very precise trend line, whereas in when you're
drawing a trend line, you would be in free hand mode. So if I deselect
the magnetic tool, and I'm just going to
change the setting of this trend line back to
not extend it to the right. And what we're going
to do is we're going to hide this trend line. So if I right click
and select hide, I'm now going to redraw the same trend line
in free hand mode. So if I select this tool and draw the exact
same trend line, you can see that it's free hand, and it's quite
difficult to get it precise, I would have to try and get
it precise, which you can. However, it's just easier and quicker when the
trend line is just snapping to the highest
price of the bar or candlestick as you
move the mouse closer. So I'll give another example, just using the magnetic tool. So if we draw it from
this high right here, and can you see how
it just easily snap We're going to
draw the trim line to this high for
this candle stick, and you can see that
this is very precise. And let's try and draw
another one from the high of the one that we've
just drawn and compare it and see
how straight it is. So what I'm going to do
is I'm going to zoom in. And comparing these two, you can see that the one that
we drew in free hand mode, which is the longer line. What I'll do is I'll
change the color of this line to yellow. It is slightly under
the h of that candle. As in the blue line is
actually exactly on the high, and the yellow line
at the bottom is just above just
above, just above. So this is all about
precision here. So if I just auto
scale this chart, all I'm doing is double
clicking where the dates are, this will auto scale my chart. Next, we have the stay
in draw mode, too. So if we just come out of this magnetic mode and
select stay in drawing mode. What this does is
it'll ensure that your drawing tool does not get deselected once you
have drawn a line. So for example, if I
select this trend line, and I draw a trend line
in free hand mode, I will be able to draw another trend line without
reselecting the tool again. So I can draw another
trend line here, and I can actually draw
another trend line here. So, as you can see, the
drawing mode is handy if you want to carry on
using a specific tool, and this will work
for any of the tool, so if I came here and I changed the tool to
the horizontal array. If I wanted to draw
one right here, I can draw another one at
the bottom right here, and it will remain
in drawing mode. Was if drawing mode
is not selected, if I select a tool from here, let's say if we draw
a vertical line, If I draw a vertical
line right here, if I move and I want to draw another vertical line
right here, I can't. If I click, nothing happens, whereas if I'm in drawing mode, I'd have been able to draw
these vertical lines as often as I want to because the item would
still be selected. The tool that I'll have
selected will still be selected as long as
I'm in drawing mode. Next, we have the Lock O
ld drawing tools icon. So if I select this icon, what that does is
it locks my chart. So that means that I can't move any of these drawing tools. So for example, if
I try to select this trend line so that
I can move it I can't. And if I try select any
of the drawing tools, I wouldn't be able to move them. Whereas, if I'm not locked
into my drawing tools, I can actually just select
them and I move them. If I click on them, I can actually drag them. However, if I am in lock
or drawing tools mode, then I wouldn't be able to move. All I can do is just
move the chart. So this is useful when
you're just looking at your chart and
just analyzing any of the technical
analysis drawings that you've just made
and you don't want to move things by
mistake when you're just trying to move the
chart around, for example. Below that, we've got
an icon right here. If you select this,
all that will do is it will hide your drawing icons. If I click it, it hides
all my drawing icons. If I click it again, it'll
show all my drawing icons. And if you select the Chevron, you can hide just the drawings. You can hide indicators. You can also hide positions and orders, and
you can hide all. As default, you'll be just
hiding your drawing tools. So if I select it, it just
hides my drawing tools. Whereas if I wanted
to hide indicators, I'd be able to do that by just clicking the hide
indicators tab. Volume bars are considered
to be an indicator. So if I select this, the
volume bars should disappear. So once I select
this, as you can see, the indicators have been hidden, and I can just select this I, I can again to reveal
my indicators. Or I can just hide
all so that I can have a clear candlestick
chart on the screen. To reveal everything. All I have to do is
simply select the ol. Below that, we've got the
remove objects icon that will remove drawings indicators
or drawings and indicators. It actually tells you how many drawings
you've got that you can remove and how many indicators that you've
got that you can remove, or you can remove both
at the same time, or drawings and indicators. If I selected
remove 12 drawings, that will remove all my
drawings instead of me going in and removing
them one by one. That basically Section
one of the tool bars. We do have an icon right
at the left right here, this star icon, and this is to reveal your favorite
tools or tool bar. So if I select this, this will hide my favorite tool bars, and if I select it again, it'll show all my
favorite tool bars. So whenever you're not using
your favorite tool bars, you could decide to
hide them or unhide them as in when you
need to use them.
4. TradingView Tool Bar, Indicators & Alerts: Now we're going to look at
Section two of our tool bars. This is located at the top of our screen towards the left. Here you'll be able
to find options to change the look and
feel of your chart. So we have a profile icon, a search icon that you can use to change the asset
displayed on your chart. You can also choose
between different charts, such as line graphs
and candlesticks. Area graphs and more, and you'll also be able to add indicators and strategies
onto your chart, as well as alerts. So let's explore some
of these features. Starting off with our profile, if you select this icon, you'll be able to see the
name of your profile, what current account that
you have with trading view. So as you guys already know, we signed up for a pro plan, and you can explore and go to your profile profile settings account and billing
and refer friends, and you've got Queens here. So if I select got its on here, can see that we have home, a help center, what's new, and here you can toggle
this on and off. This is for dark mode. Personally, I prefer dark mode. I like how when trading
view changed their logo, they also made the
default interface for trading view to be
dark mode because that's what I prefer and
that's what I've always used. However, if you prefer
it to be a white screen, this is how you can
actually change it. So if you toggle this off, then that would
change the interface of your trading view platform. You will see the older
version of trading view. The default was like this, and personally, I
prefer dark mode, so I'm just going to
switch that back on. This is where you can change it, and below that, we've
got drawing panel. If you want the drawing
panel that's on the left hand side
not to be shown, you just toggle this off and anytime you need to
use the drawing panel, you can just come up here
and switch it back on. I personally leave it on because it doesn't
take too much space, and you can change
the language on here. And you can see all the keyboard shortcuts by
just selecting right here. So as you can see here some of the keyboard shortcuts
for trading Ve. So if we select this Chevron, you'll be able to see
some keyboard shortcuts. These are very handy. And if we go back to the icon, we can see that we can
get the desktop app. So Trading view
has a desktop app, which you can download for your Mac or Windows
computer, and it basically similar to
the web browser one, but it just has a
few more features. So if you'd like me to do a tutorial on how to
use the Disk top app, please leave a comment in
the comment section below, and I will look into
creating a video for that. Below that, we've
got the sign up button where you can actually
just sign out of your co Next, we've got this search bar, and at the moment it's
populated with a PPL. So if we select the search bar, we can search for any asset that we want to show a chart for. And the best way to
search for an asset is by typing in the
Tika or symbol pair. For example, if we wanted to
search for a cryptocurrency, we're going to go for Bitcoin, which is the biggest crypto. We will type in the Tika
for Bitcoin, which is BTC, and it's also best to also type in the pair that you want
to see the asset with So, for example, bs TC USD, because then we want the
Bitcoin US dollar pair. So if I type in USD, we'll be able to see
Bitcoin US dollar pair, and on the left, you see the symbol in the middle, you see
the description, and to the right,
you see the source, and the sources will be the
exchanges or the brokers are currently
trading these pairs. And whilst you're
searching something, you can also filter the
search a categories. So for example, I could
have just typed in BTC and selected crypto
because I know it's a crypto, then I will just
see crypto pairs. Or if I select Fox, you can see that nothing
shows up because there isn't a ticker named BTC within
the ForEx category. So that's another way
that you can filter this. So if I just go to crypto
and we want the BTC USD on coin base, because
coin base is one of the most popular exchanges,
which is reputable. So if I select that, we can see the chart
has now changed to the Bitcoin US
dollar on coin base. To the right of the
search bar icon, we've got a plus
symbol right here, and this is for us to add a symbol that we want to
compare on a chart with. So for example, if I
was to type in ETH, which is for Etherium, and if we do eheum
USD on the binar I select that, you can see
that a chart has been plotted. We're seeing two different
charts on the same chart now, and this is a comparison. This orange line right
here represents eheum, and you can see that
towards the right here, and you can see BTC USD, so we can see a comparison
between the two. This can be useful to see a correlation between
the two assets. For example, you can see
that eheum started dropping first right here before Bit quin started dropping and
then BitQin followed after S Bit quin started
dropping here, it theorum had already
started dropping from here. So this is how to use
the comparison button, which is this plus
button right here. So if I just move to the right, you can see a D. So
this is where the time frames are at the moment we're on
a daily time frame. And what that means
is that this chart represents one day at a time. So every candle Every bar represents one day. This bar where M Mass represents price
action within a day. This next bar represents price action the following
day and so forth. And you can see
right at the bottom, we've got Thursday 15 September, Friday, 16 September, Saturday, 17 September going on. So that's what the D stands for. It's a time frame. And if we click on that icon, we can see all the time frames that are available on
the plan that we have. So certain plans will give you more time
frames than others. I don't think that you have the seconds within
the free plan. So this is one of the features with a pro plan. If I'm mistaken, just let me
know in the comment section, but I believe that you don't get the seconds on the free plan. I think it just starts
from the 1 minute. What you can do here is
just select a time frame, and the chart will change. So we will select 4 hours. And as you can
see, the chart has now changed to a four
hour time frame. So what that means is that
every single candlestick is now represented by a
four hour time frame. So every candlestick is 4 hours. So Women mouses. We can see that that's
Wednesday 30 November. 12. So the next candlestick will start at four
in the morning. So Wednesday 30 November at 4:00 A.M. That's
the next candle. And then the next candle, which is the red
one to the right, will start at 8:00 A.M. So if you move on, it'll be Wednesday 30th of
November at 8:00 A.M. So these are all four
hour candlesticks, and that's how you
change that here. If we select this icon again, what we can do is we can favorite some time frames
that we use the most. So for example,
if you're someone who is interested
in scalp trading, what you would most likely
use is a 1 minute time frame, three minute, five minute, a 50 minute and a 30 minute. Maybe a 45 minute as well. But mainly these ones
would be what you'd use. Some people don't
even use the 1 minute because sometimes it's too
fast for their liking. So if we select
these and star them, what that does is
it favorites them, and it makes them appear
at the top of your chart. So if I click out
of this. You can see now we've got
a three minute, five minute, 15 minute, 30 minute, and four
hour time frame. Four time frame was the
default one that was already on there that we changed
from the daily time frame. So this is how to add your
favorite time frames on here, and all you have to
have to do to remove them is select on this
Chevron right here. If you select that, you can actually just unstar
a time frame, and that will remove it and add additional ones or different
ones if you'd like so. So if we can add the
monthly time frame. And what you can also do
is collapse these columns. So if you don't want to see
the seconds time frames, you can collapse it. If you don't want to see
the minutes time frames, you can collapse it, and you can also extend it whilst you're selecting
your time frames. And to just come off it, all you have to do
is just click out. So if we just select this plus button and remove
the eighth USD, pair and come out of this
so that we just have a bitcoin chart with
Bitcoin price action. We're now just going to
move on to the next icon, which is this chart icon. So this is where
you can actually change the candlesticks or the chart to either a bar
chart or a line chart, and you also have
many other options. So for example, some
traders prefer to use bars. So you may see charts
that look like this, and this is the way
they prefer to analyze the market using bar charts and other traders
use hollow candles. However, personally,
I like to use candlestick or candles because they give a lot of price data. So do bars. However, personally,
I just prefer candlesticks because they just
are easier for me to use, and I like the way that
they tell a story for me. For example, they give you
the open the high the low, and it's just more
simple for me. Everyone has their preference. So in order for
you to change it, all you have to
do is just select this icon and you can change it to whatever charting preference
that you prefer to use Sometimes I do go
between candles and a line chart and the
line break as well. So that's how you can actually change the chart for
the price action. Next, we've got
indicators to the right. So this is where you can add
indicators onto your chart. One of my favorite
indicators is the RSI. I think it is the best
indicator out there. It is also free
on training view. The RSI is just the
relative strength index, and this indicator shows
you the strength of the current asset that is on your chart at a
particular given time. And personally, I just
used the default one. And the general rule
is that below 30 is oversold and above
70 is overbought. So below 30, most
likely the price is going to start going
back up and above 70, most likely the price is
going to start going down. So people generally buy when the RSI is below 30
or around near 30 and sell after the RSI has gone above 70 or has stayed
around 70 for a while. But this is not guaranteed. This is just the
general strategy. There isn't any technical
analysis strategy that guarantees the price to change or go in the direction
that you think it will. So that's how to
add an indicator. All you have to do is
just click on this icon and search for the indicator that you'd like to search for, click on it, and it'll be
added onto your chart. Next, we've got this
indicator template icon. If you select this, you can actually save an
indicator template, and we have a few
default templates here that you can use. The next icon is an alert icon. So if we select this, we can actually add an
alert on our chart. What alerts do is they give
you the freedom of not having to be on the screen and watching the price
every single time. You can sit an
alert to be sent to your mobile phone if you've got the trading view app
installed onto your phone. To your mobile phone number
or your e mail address. You can get a notification sent directly to
your e mail with an alert that the price has
reached a certain point, and it will trigger this alert to be sent to
you so that you can either come in and make a
purchase or come in and sell a particular asset that
has reached resistance, and you think that it may not go further up in
price, et cetera. This is where you'd
add your alerts. As you can see here, you've
got a few options to do so. You can change the condition, which can be the volume or the RSI indicator
that we just added, and you can either
change it from crossing crossing up only. This is for an alert once price
is only crossing upwards. If you want an alert for price when it's only
crossing downwards, we're just going to
leave that crossing, and then let's just leave
the value as it is, and you can select only
once or every time. So only once will be prompting the alert to
be sent to you once. So one time once the price has crossed the 17,238.26 mark. And the expiration
date is right here. You can change it and you can
do this up to three months, 90 days, I believe. You can name your alert, input a message in your alert. So for example, this
could be a buy in. Just simply hit create. You can see that an alert
has been set right here. So as soon as the
price has crossed this price point where
our alert has been set, this will trigger
a notification. To trading view, and I'll
know to go and purchase some BTC USD because I set a
buy in alert for this asset. To edit your alert, double click it and
edit it to delete it. All you have to do is just
select this delete icon. And to edit the type of
notification that you want, you can select notification, and the alert can be sent to your trading view app if you select notify on Trading view. And you'd have to
install trading view, you can get the alert sent to your e mail or you can
set up a webhook URL, or if you just want the alert to be sounded on your computer, you can just let the
sound be played here, and you can select
whether it's played once or twice or
every 10 seconds. And you can also select
for an e mail to SMS, and you'd have to put
your e mail address here, and they will send you
a text message with a confirmation code so that you actually get these
alerts via SMS. So if I just remove this alert, Next, we've got
the replay button. This is a bar replay button. So if we select
the replay button, you see that we've
got a tool that just popped up at the
bottom right here, you can actually replay price action that has
already happened to either back test strategies
or just to see how you could have made a better trade or just to analyze the trade
that you just made. There's multiple purposes
that you may want to use this replay
button for. For example, Once this is blue and selected, which it was already, this
will prompt you to jump to. If I go onto the
chart, I can jump to start from anywhere
on this chart. If we want to replay from right here when the price
started coming back down, so if I click on that,
that will just the chart, and I can select
a playback speed. If we want to play
back at times three, so it'll go three times four. And if we press play, you can see that's the speed
and it's just showing us the price movement until
the current price. That's when this will stop. So that's how you use the replay button for the
trading view platform. And what we can do is select this button to come
out of replay mold. Just to the right, we've got this backspace button
and forward button. So this is a undo
button and redo button. So for example, if I was to
draw a trend line right here, this was a mistake and I wanted
to remove that trim line, what I could do is I could
select this undo button, and that would remove
the trim line. Or if I deleted it or
removed it by mistake, and I wanted to put
that trim line back, I could use this redo button, and that will just put
it back onto my chart. Other way that you can add alerts other than
using this alert I can write here is by selecting this plus button to the
right of the chart. If I select this plus button, I can add alert at
that exact point and that will automatically
add da alert. But it doesn't let me name
the alert, et cetera, so I'd have to click into it, and then I'll be able to edit
the settings of this alert, so I can now name
the alert and add some messages or
notes for this alert, and I can also change the notification or any
other conditions on here. I just save this alert. Another way that is
very useful when adding alerts is using the
trend line alerts. If I right click on
this trend line, I can actually add an alert. What will happen is every time the price crosses this trend
line, I can get an alert. Be this trend line is
a support trend line want to know once support
is broken or once support has been reached because if support is reached
and it's not broken, it means that there can be a good probability of a
bounce back to the upside. However, if support is broken, then I know that there is a high probability of the
price plummeting even more. This is how to set an alert on a trend line or
any drawing tool, all you have to do is just
click it and add alert, and then you can actually
specify your conditions here. So we want piques D
crossing the trend line. Then the trigger we
want it once per bar. That's what I mainly use, that means that it will trigger once for every
single candlestick, rather than it
triggers only once. I usually change the
expiration date to the last date possible and
you can name your alert. What you notice is
that there's a clock, I can right here next
to the trend line, and that shows that the alert has been added to
remove the alert, all you have to do
is just right click. And select edit trend line alert and then click the delete icon. However, we're just going to
leave this alert on there. At the moment, you
can see we've got two alerts on this chart. We've got one right here, which is just an alert
for a price point. Once this price reaches
this price point, an alert will be sent to us, and once the price reaches
anywhere on this trend line, we're going to get
another alert. As soon as it touches
it or crosses it, we will get an alert notifying us that price has reached
this price point. That is one of the very best
features on trading view for me personally because then I don't have to spend a
lot of screen time. I do my technical analysis. I know the buying price points, my cash out price points, and once these are hit, either via trend lines or
just alerts that I just set, then I can go into an exchange and action
these alerts accordingly. One can also use these settings right here to edit
the drawing line. This trend line, you
can change the color, you can change the thickness. If you want it to be thicker, change it, and if you want it to be thinner, you
can change it. I usually use it at two pixels, and you can change the line. You can a a dashed line
if you prefer that, and you can also go
into further settings, and you can add an alert
using this as well, because this will always pop up once you have a drawing tool on your Bey trend lines and
other tools, and you can also So the same thing that you
can do on two bar number one, where you can actually
lock your chart, you can lock a
specific drawing tool using this tool bar right here. So if you select this
icon that will lock this and you won't
be able to move it. However, if you click
on it and unlock it, then you will be
able to move it, and we're just going to use the undo button so that it
goes exactly where it was, and you can also delete the trend line using this
bin icon right here. You can also use these three
dots to see more and have a visual order if you
want to bring an item to the front or visibility
on intervals, or if you want to clone it, copy it, or wind it. So this is a quick
way to edit items, and you can actually move this out the way if you
want it below, if you don't want it
at the top, et cetera.
5. TradingView Chart Layouts & Chart Settings: Next, we're going to go
through Section three, which is another tool bar that can be used to name charts, use multiple screens, and
change various settings, as well as take screenshots off your chart and
publish your charts. So if we start off with
this icon right here, this is a layout icon. So if we select it, you can change the screen on your chart. To multiple layouts. So we can use two
layouts, for example, and you can see we've got
two different layouts here, and we can now change
these two charts to different charts or
different time frames. So for example, I've just
selected the second chart, and I'm just going to change
that to a 30 minute chart. So you can see this one is
on the 30 minute chart, and this one is on
a four hour chart. Now we can actually just do technical analysis on two different time
frames at the same time. You'll notice that there are plenty of layouts that
you can use here. And these layouts
are dependent on the subscription that you
have with trading view. So if you've got the
premium subscription, you'll have access to
all of these layouts, and I'm not too sure how many layouts you get
with the pro subscription. I think it's just
one, two, and three. If not one and two, you'd have to just check
the subscription details for that because I do not remember off the top of my head. I'll try to change it
into a 61 actually. Y. So as you can see, it won't allow me to change to a six image layout because of the
subscription that I'm on. So I'd have to upgrade to
get to a six chart layout. So a pro plan only has
two charts per table, and the P plus has four, and the premium has eight. So all of them are on the premium one.
The P plus has four and the pro plan only has two. Below that, we've
got Syk in layout, and this allows
you to adjust what happens within the
multiple layouts, so the multiple screens. So, for example, the symbol
will allow you to have two different symbols or just one symbol on a
layout simultaneously. So if this is selected, then you'll just only
be allowed to have one. When it's deselected, you'll be able to have more than one. So for example, we're on a bit queen US dollar
pair right now. I could change this to eerium. And this second chart,
well, the chart on left, the first one will
not change its pair. However, if I go back
and select the symbol, that will automatically
change to the pair that I have
selected on my watch list. So if I change that to BTC, both of them will
change to BTC, like so. So that's what that would do, and you've got other settings
that you can use here, such as the interval, the time, and the date range. And to the right, we have a save button that you can
use to save your charts. So if you select this, this will save your chart, All changes will be saved. Anything that you've moved or any drawing tools
that you've added to your chart that
will be saved and anytime that you open
trading view again, your chart will load as it is. You can actually save multiple layouts and
name each chart. You can make a copy and
auto save is always on. However, I would
always recommend to always click the save button, so just click this button. To save anytime you do
any changes that you just definitely want to
be saved just to be sure, because sometimes maybe you may have a slow
internet connection, and it may just not
trigger quick enough. So it's just best to do so and if you've got
any layouts that you have previously created, you can load them here or you can create a new
layout and save one, and you can rename your
layouts and name your layouts, and that's how you do it all you have to
do is just select this Chevron right here
to manage any layouts. So to the right, we've
got a search icon, and this is a quick search icon. So we can search
for drawing tools, functions, and any settings. To the right, we've
got a gear icon, and this is for chart settings. So if you select this icon, you can actually
customize your chart. So for example, at the top here, we've got symbol, and this represents
our candlesticks. Or if you had a line chart, it will represent
the line chart. And if we select a color here, we can change this
to suit our needs. So for example, if you
wanted these to be yellow and let's say purple, you could select
those and select k, and that would change the chart. So you can see our chart
is now changed and the candlesticks have been represented by the
colors that we chose. So this will change the
appearance of your chart. Able to change the
color of the borders, the wick, the last price, and we can also add
previous day clothes, high and low, bid and ask, and precision and time zone. This is where you can
change your time zone, depending on whereabouts
in the world you are, as well in your
settings on your chart. Below, we have status Line, and status Line contains options to change information
that you'll find in the Left off your chart, such
as the O HLC values, so the open, the high, the low and the closed values. If you untick this, you will notice that the H L and C values will have
moved from your chart. I'm just going to move this to the right so that you can see this because the chart that is being edited is
the one on the right, since we're on a
multi screen chart, and it's the one on the
right that's selected. You can see that because
of these blue board So if I take this, you can see the OH and C have been added
back onto the chart, and if I untick it,
they will be removed. So that's how you edit these. You can remove the
open market status. The open market status is the green dot right at
the top of the page. If I untake this, that's off, I put this back on. Will show. So this just indicates that the
market is open, and if you don't know yet, the crypto market is open 24
hours, seven days a week. You can also remove the title. So if I tick this, you won't see what asset is
currently on my chart. However, if I put it back on, you'll be able to see the
title and the information. So you can edit all
these settings, including the
indicators settings. So titles, arguments,
values, and the background. That, we have scales. Scales provides
options to change the trackers that you can
see on the right hand axis. For example, you could add the high and low prices
by just ticking this box. And as you can see, the
high and low have been added onto our chart on
the right hand axis, and you can untake
this to take that off. You could also remove the
count down to the bar close. So if I removed this, you can see the count
down has been removed. And if I add it back on, can see that it's counting down the 30 minutes for
each candlestick. So after the 2 minutes are over, a new candlestick would be created because
we're currently on a 30 minute chart and the countdown was
counting from 30 minutes, and there's only
2 minutes left on this chart before the
candlestick closes. There are various
settings that you can use here and change according
to your preference. Just below that, we have appearance, which lets you
change your grid lines, the background, the
background color, axis, and other
cosmetic features. For example, if we wanted a
different background color, we can change it from
gradient to solid, and we can change
the color to orange, for example, that would
change our background color. We could change it to
a much lighter color. And you can customize
this to your preference. If you just wanted
a white background, you can change it to white. And there are so many other settings that
you can change here. You can change the
vertical grid lines, can change the
horizontical grid lines. If you don't want them to show, if you want them to show, you can change the
thickness of them. You can make them
dashed or dotted. This gives you the
ability to edit your charting platform the
way you would like it. And what works best for you because everyone has
a different preference. So I suggest that you do so
and then save your layout, and then you'll
be able to use it every time you log into
your training your account. And other people use multiple layouts because
sometimes you might prefer a certain layout for
nighttime done daytime, so you may have
different layouts. So this is where you
can actually customize the appearance of your
trading view charts. Next, you've got trading, and this is where
you can customize visual elements if you're
logged into a broker account, where you can actually trade using the trading view platform without logging into your broker account on their website. You can actually place
trades within trading view. Below that, we've got events, and this gives you the
options to display dividends. Splits and other events
on the chart area. So I'm just going to cancel so that this can go
back to what it was. However, the candlesticks,
I saved them earlier. So if I select the undo button, that will undo the
candlesticks, as you can see, and now we're back to
how our charts looked. So if I just change this
back to a single layout, Next to the right, we have
the full screen icon. If we select this, this will change our chart
into full screen. We can hit the escape button
to come out of full screen. The icon next to that
is a snapshot icon. You can take a
snapshot by selecting this and selecting save chart, and that will take a
snapshot of your chart and save it or you
can copy image chart, and if you select this, you can actually just paste
it wherever you want. Or alternatively, you
can copy the link to the chart image and
share it with others, or you can open the
image in a new tab. So if I select this,
you can see that a snapshot has been
opened in a new tab and you can just copy
the link and share it with others showing
your technical analysis. Next, we've got a
blue publish button. So you can share your ideas with the
trading view community. So if you publish an idea, you can send it to the Trading
view social community. You can also record a
video idea and publish it.
6. TradingView Watchlist, Alerts & Data Window: Next, we're going to go
through Section four, which is another
tube bar located to the far right of the
trading view platform. So the first icon shows you
the watch list and details. So if we select this icon, that will collapse our
watch list and we'll have a full screen
view of our chart. And anytime we want to
view our watch list, we can select this icon, and we can see our watch list
and the news at the bottom. We can edit this
watch list if we want to see more assets
by dragging it down. Below that, we have a
clock icon right here, which shows our alerts. Anytime you want to see
any alerts that you've added onto your
trading view platform, if you select this clock icon, you'll be able to see
a list of your alerts and these can be filtered to
just alerts on one ticker or from A to Z ticker or by name or by message
or by date created, et cetera, and you can also use the search icon to
search for alerts. You can also simply select an alert and pause
it to stop it or you can restart it by
pressing the play icon if an alert is not active and
you'll see it right here. It will note that it is inactive and every time
you hover above an alert, you'll see some more
information about the alert that pops up
to the left hand side. The top, you can click this icon to add an alert
or to create one. You can also click
these three dots to see some more
settings on the alerts. So you have the option to
restart all inactive alerts, to stop all alerts, to remove all inactive alerts, to remove all alerts, and to just show active alerts
or current scam ball only, or current time interval only. And you can show alerts for prices, drawings,
indicators, strategies, and you can customize
the list by name, message, source icon,
and last trigger. You can see that
there are various settings that you can use here, which is very useful, especially for someone who
trades multiple assets and uses alerts to stay up to date and
on top of the market. This is probably one of the
features that I use the most, if not the feature that I use
the most on trading view. The rest of the icons on
this tool bar section mainly cover news and trading
views social elements. So you have access to a
personalized calendar. This will show you
the economic calendar Earnings calendar
and some points of interest that you
may be interested in. And you also have a hot list right here
that you can look at. You have an ideas tab
right here where you can post your ideas
onto the community. And one very useful icon that I also use is
the Data window. So this gives you a lot
of data from the chart right in front of your face, so you can see the open the g, the low, the close,
the change in price, the volume, the date, the time. You can see the current
data for the RSI. So we know that the RSI
is currently at 55.48, and it's just jumped up
and then it's fluctuating. We can see the RS exact
moving average number, which is 50.41, and if you
have other indicators, you'll be able to see more data. This is a very useful window
that I use on a daily basis. Above that, you've got news. You can see the
headlines that are currently happening
within various assets, and here you also
have private chats, so you can communicate with
various other traders. I don't usually
use these as much. You've got public chats, so you can gain some ideas on what's going on in the market
and what people thinking, and you can
also watch some streams, and here you've
got notifications. Below that, you've
got your order panel. This is where you would make your buy and sell orders if
you're connected to a broker, and then you've got
Dip off market, which is basically
an order book, and below that, we
have the object tree. So if we select
this object tree, we are able to amend what exactly is
showing on our charts. For example, if you want to hide a trend line, we can hide it. Earlier, I hid a drawing tool. If you wanted to unhide it, you'd come down to
the object tree and select the i button to show it because you won't be able
to unhide it on the chart because you can't actually click on it since it will be hidden. And you can also
hide the volume bar. For example, if you
don't want to delete it, you just hide it temporarily, if you want to view it again, you come down here
to the object tree, and then you just view it. So this basically shows
items on your chart, and you can also realign items. So if you've got multiple items, if you wanted to put one
item on top of the other, you could by moving
items around. Et cetera. So if we
just come out of the object tree and
the depth of market,
7. TradingView Timezones, Scales, Log & Linear Chart: We're going to go
through Section five, which is another two bar, which is just at the bottom of our chart towards the right. So here we can see
the time zone, and right now the
time zone is UTC, so you can also change the time zone by
just clicking here and changing it to
wherever you are based. So I'm just going to
change this to London and here, you can total
the percentage. So if I select percentage, you'll be able to see that
instead of seeing price, we're now seeing the
changes within percentages. So I'm just going to
change that back to price. And here we've got a log scale. So this will togal the
log scale on and off. A log scale will change
the look of a chart because it will show you the same distance
from point A to B, so from any point on the chart. So for example, if I change
this to a one month chart, and you can see how this chart
looks like on a log scale. I change it from a log
scale back to how it was, can you see that
this drop doesn't look the same as the
drop on the log scale? That is because the log
scale shows the chart plotted in a way that
price changes can be represented by the
same vertical distance on the scale as opposed
to the linear scale, which is the default scale, which is this one
right here that shows severe price
increases or decreases So when you're looking
at a chart long term, it's best to use the log scale so that you can actually see how severe price has actually moved in comparison
to the linear scale. Let me know in the common
section below if you'd like a more in depth video
regarding the log scale. To the right, we have
an auto scale button. So if we select this button, we are now out of auto scale. So what that allows us to do is we can scale this
chart as we like. So we will be able to click
and drag the chart anywhere. We can zoom in on a chart, we can move the chart around. We can do anything to the chart. When we are in auto scale, it will automatically
scale the chart. We can only move certain
directions, and when we zoom in, we can only do certain
things so we can't move the chart because
it's an auto scale. Another way that you can get
out of auto scale is just by scaling the axis yourself, and that will automatically
come out of auto scale, and then you'll be able
to move the chart. But a quick way to get back into autoscale is
just select auto, and then everything will be moving accordingly,
automatically.
8. TradingView Trading Panel & Asset Screener: Next, we have Section six, which is another
tu bar located at the bottom left of our
charting platform. Here you'll find a trading panel that you can actually use to trade on trading view with a broker that
you're registered with. So you'd have to register
with one of these brokers, and then you can
connect your account and trade directly
within trading view. And you can also back test strategies using
the strategy tester. Right here, so you can
load your strategy and actually back test your
strategy within trading view. Next, we have Pine editor, and this is mainly for programmers or
those that are more advanced in using trading view. You can actually program certain
conditions to trigger on your charts once a
specific strategy has been met using code. And to the left of that,
we've got stock sc and this will just show you some information that you
can use to screen stocks. You can also change
this to FIs or crypto. This can be very useful
for date trading. You can enlarge this by
selecting this icon, and you can see that we have a lot of relevant
data right here. You can customize this
to suit your needs, so you can change
the time frame. We can change this to a
four hour time frame, and we can also filter this according to
certain conditions. So this is something that
you'd have to look into. It's a bit more advanced. But It is very useful
even for a beginner. I would also recommend
that you start getting to know how
to use the screen
9. Next Steps: Congratulations on making it
this far in this tutorial. If you want to learn
more about trading and investing or
technical analysis, check out my crypto
and stop trading using the RSI class that you
can find on skill share. Thank you so much for watching, and I'll see you
in the next video.
 Kundai Dzawo, Digital Learning, Trading & Investing