Transcripts
1. Introduction: Hello investors. Welcome to this training, the
Outer Val Investing. This is now the third re
recording of this training. We are March 2026,
nearly April 2026. And I've been updating the whole training to
bring in, let's say, the most recent updates, including updates on
the methodology that I will show you already in
the introduction lecture. So, first of all, so, my name is Kani Carrera. Why am I speaking
about Val investing? Well, I've been since
1999 a Val investor with today more than $1 million
in equity without debt. So this is fully owned equity. And also next to that, I have experience
managing companies, including have been 12 years at Microsoft Luxembourg and eight years managing
the business, so in charge of the country
of Luxemburg for Microsoft. I'm also an independent
board director since 2020, also certified by ISA. I have an MBA, and
I continue also. I like to, let's say, share my knowledge with people, and I'm teaching as well at
University of Luxembourg and ASCA School of Business
in Malaga, Spain. And since November 2023, I'm the co founder
of and CO vile.ai, which is an AI companion that actually I have
created for myself. The team today of 12 people that we also make available
to you as investors. And the tool I will
introduce the tool. The tool is actually following exactly the value investing methodology that I'm showcasing
and explaining here. So what has been the approach writing this course
about value investing? So I've been reading
more than 50 books, and you see some of them here
in the back in my library. And I mean, this has taken me a lot of time to
read those books, and I wanted to have a
synthetic view and a list of tests that I could apply to
my own investment process. Been listening, and
that's not a joke to more than 60 years of annual Shallow meetings
of Berkshire Hathaway. So Warren Buffett and
Chalimonga I will speak about Warren Buffet and Chale
Manga in the next lecture. And I wanted to
extract the essence of those annual Shallow meetings that I've
been listening to. You have to imagine those
are more than 60 years, and each annual
Shall meeting was around four to 5 hours
in terms of podcast. Um, I also wanted
to add I'm saying this lot of respect when we
speak about Warren Buffett, and we'll come back
to this again. I wanted to add something on top of what I learned from Ben
Graham and Warren Buffett, which is adding making modes. So this really pricing power, competitive edge of company is making it more tangible
and quantifiable. And beyond what
Warren Buffett has always been saying that a
mode that is observable a company that has a return
on invested capital, which I will explain
in this course, no worries about that. But Ron Buffett has always
been saying that one way of looking at modes is when the company has
profitability that is above, let's say, eight to 10%
for many years in a row, that shows that the
company has pricing power. So I wanted to have
something on top of that, and I will show you
this in the method. That's the third, let's
say, pillar of the method. Also, I mean, in this course, I'm addressing challenges
that I have been going through over the last
20 now 27 years were 2026. Things like, how do
I choose the cost of capital when I calculate the intrinsic value
of a company? Which growth rate shall I use? And of course, and again, I'm not here to promote
the tool Vena AI, but honestly, we have created this tool also to make our
investment process faster. I mean, for those who I mean, if you will be talking to the first students that have been taking
this course in 2020, I was providing an Excel file, and in order to calculate
the intrinsic value, which is the holy grail
for any investor, what is the intrinsic
value of a company? Um, actually, it would take 2 hours for one single company. Now it's not even one click. It's you have it in
the user interface. So that's also why we
have created Villa AI, and Vila AI actually follows exactly the method that
I'm explaining here. So in terms of course content, there's going to be, let's
say, five big chapters. The first one is the
key financial concepts where we speak about money, how companies create value, what is investing, the risk
versus return equation, which is very important. Then the investor mindset. Not walk you through
all the points here but the investor mindset is really about what I have learned also from
Warren Buffett, how you define your
circle of competence, what is your
investment universe? What are the five
plus one habits that serious investor
should have? And then, indeed, I
will walk you through three big chapters
which are really then, let's say, the foundation
of this training, which is the very
investing method, the level one, let's say, pillar, which is the
fundamental analysis, you're going to see on
the left hand side, if you see my mouse
moving that I have added now in March 2026. A new chapter, which is
reliability of financials. I will not go into the details
of forensic accounting, but that's something that we
want all of our let's say, student investors to be the
first metric they look at. Are the company financials
reliable or not? And you're going to see
how easy it is to have a quick perspective on if the financials are reliable or not, because that's
the very first thing. If your financial
or not reliable, is just stay away from
the company actually, or at least you will have
to dig into the numbers. Why are the financial
not reliable? Then the second pillar
is going to be really the holy grail for
any value investor. Serious investor is
intrinsic valuation. I'm going to teach you the differences between relative valuation and
absolute valuation, various methods
that you're going to see like discounted cash, discounted future
earnings, et cetera. And then the third one,
that's really, let's say, my own piece of
supplemental research, where I wanted to
quantify modes, and we're going to look
at brand valuation. We're going to look as well at employee information and
customer sentiment as well. Of course, I mean, I
will have a lot of examples that I will speak about so that it is not just theory, but you will be able
to apply it as well. So what I believe makes a
serious and good investor. And so in order to become a seasoned value
investor, of course, you will need to navigate in the main financial
data. That's a mouse. You will not have the
choice about that. You will have to
understand concepts like solvency and
financial strength. You'll have to understand
concepts like profitability, for example, those
type of things. What is also important for
a seasoned value investor, you will have to be
able to estimate the relative and intrinsic
valuation of a company and the margin of safety
that the market is now giving you versus what
the company is worth. Of course, now with a
tool like Villares, it's going to be extremely
easy to do that. It's just, I mean, let's say, opening the tool
and you're going to have the value that
will be appearing, in fact, and then you will be able to play around with it. Intention as well for season value investor
is that on top of, let's say, the baseline, which is understanding
financial data, estimating the intrinsic
valuable company, being able to take
rational decisions, and then it becomes a
repeatable investment process. And then from there, you're
going to be developing over the years a serious
investor mindset. And as I'm always
saying, I'm still around after 27 years. Without any debt,
even our real estate now doesn't carry any debts. And I will speak about this, of course, in the
investor mindset, how I feel about debt as well. One of the things
that I always want also new investors to consider is you
will have to accept that you're going to
be making mistakes. What is important is that
those mistakes are minor, that they don't wipe you out. That's really the
most important thing. And the second thing is that you learn from it and that
you have, let's say, an improvement process on looking back at the
mistake that you made. And and I really speak and I
will speak about this also, again, in the investor mindset, really investing real money
into the stock market. This will train your
muscle because I have had students who were playing with virtual portfolios, and the level of stress is
just going to be different. But I will speak about this in the investor mindset
in the second chapter. So, also, the course
cannot be exhaustive. So this is the Auto value
investing, and I've received. So this is a new slide that
I've added now in March 2026. So I've received very
often a question, What would be the
typical sequence that I should do after taking the
Auto Vale investing? Well, I would recommend
you and you do, of course, whatever you want, but I would recommend you that. You start with the
value investing, which is a very broad
and general, let's say, training on value investing, you will have a clear method, or at least you will
know what is my method, how I perform value investing. Then if you want to
immediately practice it, I would strongly
recommend you to take the value investing with Vina
AI, which is a free course. You have access to that one. So just that you know
a little bit how if you want to
implement the method, how to indeed leverage
a tool, for example, like VNA AR, but you're not obliged to use a
tool like VN AI. But again, we have created
this tool for ourselves, and I continue using this tool for my own
investment process, right? So it's not a product that
we created for other people. It's really a solution that we are creating for
ourselves to make our and my own
investment process much more productive
and efficient. And if you want to become more, let's say, expert,
more advanced, I would recommend you
that you do the course, the out of reading
financial statements. That is really going. If I go back to understanding financial data and
financial reports, that's going to go
deep into that, that would be one that
I would recommend you, but just pay attention. It's an advanced
course. In that course, I will be sharing a little bit my experience also as an
independent board director and also as an investor who reads financial reports for
more than 20 years. Last but not least, this is the most advanced
course is really looking at forensic
accounting metrics. So we'll show you as well in how to use those forensic
accounting metrics, but we will speak specifically
about the BiniJam score, which is a proxy for earnings,
manipulation signals, and then the Altmanzisc which is a bankruptcy risk
score, in fact. So there are specific trainings
on forensic accounting. So, yeah, I mean, very
briefly on Vinay. So Vin said we have
credit for ourselves. We started this project
in November 2023. I'm showing you here just
a couple of screenshots. But today, in March 2026, it covers 60 stock exchanges. We have users all across
the world, from Qatar, from Singapore, from China, from Argentina, from Colombia. From Europe, of course, as well, and from the US,
the UK, et cetera. So we covered today 38,000
companies, 10,000 ETFs. We will be adding very soon crypto assets because that's
a request that we have. And I'm not the crypto expert. I don't invest into crypto. I only invest into stocks, so into companies, but just nonetheless to tell
you that we will have this. And really, the honest
intention of Ville as an AI companion with
user interface was really to address my
personal challenges that I faced specifically
when I started 1999, I was unequipped or I had seven subscriptions because I had very fragmented information. I had to pick the information from one website, from
the other website. Then I had to go on a company or employee sentiment website. I was using Excel files, and Excel files, they
do generate errors. I mean, you may make a mistake on the
units that you're using, and then it completely makes a wrong calculation on the
intrinsic value, for example. What I was missing when I
started as a valid investor, I was missing the
interpretation part of a lot of financial
metrics, right? When you go on a
lot of websites, you have all those
financial metrics, but they don't help
you interpret it. And this is something
that we created. Vine, you can actually
ask the tool, What is a price to earnings? What is good price to earnings? What is ROIC? How should what is a good dividend
payout ratio, for example? So we really tried and
there are more than I mean, there is a lot of
curated knowledge we have written
with my co founder Adriana more than 200 pages
of own curated knowledge, plus we have added
research papers, a couple of books, et cetera. So we really tried I wanted
to have something like Warren Buffett in a tool that is available to me when I
have to ask questions. That's a little bit the idea
that we had by doing this, and I will not go nine
to these details. Take the training value
investing with Windle AI, where we'll speak about
sensitivity analysis and how to Vinla will suggest growth rates and cost of
capital, for example. The only last just wrapping
up here about Vinlay. So Vinlay actually follows exactly the do value investing. So you see it here
in the main screen. You see that I was
mentioning that the method in this course is about
fundamental analysis, valuation, and then
quantifying modes and intangible metrics
like employee sentiment. And customer sentiment
and also brand valuation. So actually, Vinley has been created following exactly the method that I'm explaining here. So you're going to
have clear elements on fundamentals valuation mode as it is laid down
in this training. So this training
is not about Vin. This training is about
teaching you a value investing method and method that I've
learned from Ben Graham, Warren Buffett and I've
been adding stuff to that method with a level three mode and
intangible metrics. So that's brand
employee sentiment and customer sentiment.
This is the end game. If I would recommend you if you allow me to
summarize it like this, if there is one slide that you should keep in mind,
it's really this slide. This slide actually summarizes everything what
value investing is. So value investing has the following idea.
You have the market. We will speak about Mr.
Market in the intro, but you have the market,
and you have a company. I'm speaking now about stocks. I'm not speaking about
any other asset class. What the market
what will happen to the market is that the
market will be emotional. The market will go
up, will go down. So it will give you every day, every 15 minutes, will give you a different price to buy
a piece of that company. That company can
be ProctanGamble, Coca Cola, Nike, Adidas, Samsung, Sony, I mean, those type of companies, I'm just taking out
those examples. Is important for
you as an investor, what is important for me
as a van investor is, I want to buy the company
when the market is giving me the company at 25 to 30%
discount of its real worth. And the real worth is
called the intrinsic value. That's what we're
going to see in the Level two intrinsic
valuation chapter. Do I calculate an
intrinsic valuation? You're going to see
differences between relative valuation and
absolute valuation, various methods,
discounted cash flow, discounted future earnings, even the dividend discount
model, those type of things, so that I equip
you to know how to calculate an intrinsic
valuation of a company. So this slide actually
summarize everything is what you want is that the market
is giving you the company at, let's say, at 100, but the company is worth 130. This is actually
where you will be able to make at a
certain point in time. In my opinion, this is
what happened to me over the last 27 years that I will start making money
because actually, at a certain moment in time, if I have correctly, let's say, estimated the value
of the company, the market will reflect this. It may take one year, two years, five years. That happens, right? I mean, I have had examples where it
took the market six months. The last example
I had was AmBev, which is a drink distribution
company in Brazil. I think I bought it
over the summer, something like eight
dot $9 a share, and I sold it at 265 a
couple of months later. And it even crossed $3 because the market became really so hot about the company, and now it's back
at two dot seven. So this is a little bit
the mechanism that I want you to explain that at
least so first of all, that you have a repeatable
investment process and that you know how
to value a company. And then you will have to what is the market giving me today? Is it too expensive and maybe I have to wait or go and look
at other opportunities. So that's the whole idea, and that's why I'm
showing this slide. This slide actually summarizes what value investing
is as a method. With that, thanks
for your attention. I hope you will like the course and talk to you in the
next lecture. Thank you.
2. The origins of value investing: All right, welcome
back Investors. So second lecture
after the intro. And in this closing lecture
of the introduction part, I will just briefly explain to you the
origins of Val investing. I could ask you the question, if you would you physically with me in the class if you know
these three gentlemen? I know it's not very diverse. I'm sorry for that, but
those are the three men that actually structured my
thoughts around Val investing. So on the left hand side, you actually have Ben Graham. And in the middle
and on the right, those are the owners
of Berkshire haway. So in the middle is Warren
Buffett and on the right, Choli Manga that unfortunately
has passed away. I think it's one year
now ago, two years ago. So first things
first, Ben Graham is considered the father
of value investing. So he wrote two
very famous books called The Security
Analysis Book with David Dodd and
Intelligent Investor has been actually the book
that I came across in 1999. In fact, when I
said that I started investing into the
stock market in 1999, it's not fully true. I started investing in 1990. I think it was 1996,
if I'm not mistaken. But I didn't know exactly
what I was doing. I was looking at the graphs and trying to
predict the prices. And in 1999, I came across the book the
Intelligent Investor. I have now three versions, if you look at my library
behind me, even one in German. And actually, that has been the book that
structured my thoughts. And that was like I think that Ben Graham has
indeed understood how to invest into companies by looking at
undervalued companies. So his main investment
philosophy principles have been minimal debt. I mean, I'll speak about this in the investor
mindset for me, it's zero debt, but he was
okay to have minimal debt. Have a buy and hold strategy because sometimes you need to be patient until the market gives you the right
price for a company. A fundamental analysis, really understanding the
financials of the company, being a little bit diversified, I can really mention this because I get this
question very often. If I diversify a lot or not, I tend to have always between, I would say eight and 13, 14 companies in my portfolio. That's kind of the average
that I have I think now actually have 13
companies in my portfolio. Ben Graham also taught me and explained in his book,
Intelligent Investor, that you should buy
with the margin of safety and very often, you will have to have
a contrarian mindset. And this is also how I
was able to make money. I will teach, of course,
you should not take an investment
decision just based on one metric, for example, I was running a webinar
yesterday for the launch of Vinla and I had an investor
who was asking me, Well, then if this metric and this metric are okay,
I can buy the company. I said, No, no, no, no.
You need and I mean, with all respect, this investor didn't do the Ado Val
investing training, but I had to repeat
that investing investing your real money into a real company requires more than just looking at one or two metrics that are green. So this is what I
will share with you here with this whole
investment methodology, how actually I became
financially independent. By using value
investing methods. And the foundation of
My investment method is actually coming from Ben Graham.
And what is interesting. So coming back to this slide, so Warren Buffett in the middle
is that Warren Buffett, who has been now for the last at least one
to two decades, always in the top ten of the most wealthy
people on Earth. So actually, Ben Graham has been the mentor
of Warren Buffett. Warren Buffett has been
studying with Ben Graham, who was a professor at
Columbia University. And then Warren Buffett
actually went and worked for Graham's company that was called Graham New En Corporation until Ben Graham
retired, in fact. So then, indeed, Warren
Bufftt and Cholie Monger structured a lot my
investment methodology. I will explain to you
now in the next slide, what is the different or what Warren Buffett and
Choli Monge have added on top of what Ben Graham has been
teaching Warren Buffett. And for that and putting
you I've put you here the YouTube URL,
if you're interested. The article 0R sorry, not the article, this
interview with Charlie Monger, who has been with
Warren Buffett, his partner for, I don't
know, 50, 60 years. And so he was speaking on the BBC in 2012 in an interview, and I was really
summarizing what are the main characteristics
that if it is him or Warren Buffett use to
invest into businesses. The first thing that Johnny Manga was mentioning is that you have to deal with a business
that you understand. And I will be repeating this in the investor mindset
in the second chapter. So you really need to
understand what you're doing. That's the very first
thing. The second thing and that's actually
point number two, this is what Warren Buffett
and Johnny Manga have added on top of Ben
Graham's method. Is what Warren Buffett
calls the mode, or Charlie Minga
calls this the mode. But what is important
is that if you understand which company
you want to invest into, so you understand its business. You need also to
make sure that you invest into a company that
has a competitive advantage, a competitive mode or just
a mode. What is the mode? I will repeat this
during the course. A mode is the water around a
castle, a medieval castle. The wider the mode, so the more water it is
around the medieval castle, the more difficult it is
to attack the castle. That's a principle of a mode. This is what Charlie Manga and Warren Buffett have been
teaching me is that actually, and this is one of the
reasons, and again, I will be speaking about
this in the course, why I very often only invest into top hundred
brands in the world. I currently have Nestle,
Nike, Porsche, Ferrari, Louis Vuitan, Gucci, those type Nestle I think
I forgot to mention. I mean, I have those strong brand companies
because they do have a competitive advantage and a competitive advantage can be network or distribution channel like Coca Cola has
or Amazon has, for example, but it can also be just that they
have pricing power, which is something that
ProctanGamble has. I will speak about all things, but just already elaborating
that that's really what I did not find in the book the Intelligent
Investor of Ben Graham, what I found actually
listening to Warren Buffalo and Charlie Manga that they
were actually teaching me. So not only you need to understand the business
of the company, but the company need to make
sure that it is strong, it has a strong competitive
position, in fact. Third thing, and this is
what brings me then also. And we have introduced
this in inle as well is forensic accounting. So basically, you need
to trust management. So what you don't
want you don't want management to
manipulate the numbers. And I will teach you. And that's actually the new
lecture that I'm doing now in the re recording in
2026 of this course, I will make a short introduction to the Benish A
score because that's the very first metric
that you should look at before you invest your real
money into real company is, are there any signals of earnings manipulation?
Yes or no? And then finally,
course, you need, and that was the slide
that I was showing you at the end of the
very first lecture, you need to have a
margin of safety. So if the market is
overpricing the company and the company so if the
market is giving you a price of 200 and the
company is worth 100, you don't have the
margin of safety, right? And that's what Charlie
Manga is saying here. No matter how fantastic
the business is, it's not worth an
infinite price. So as I was teaching you in the last slide of
the first lecture, is what you need to
have is at least 25% 30% below its intrinsic value. This is where the stock price or the share price
should actually be. So if the share price is 100 and the intrinsic
value is 150, that's already a
good thing, right? Of course, it is more than
just one metric to look at, but that's a good thing to have at least 25 to 30%
margin of safety. Right. And one of the things
and I was also wondering. And again, I mean, I continuously
teach value investing. So now we are March 2026. I have more than 10,000
students across the world. This course actually is the
best seller course on Demi. And one of the things that I realized is that why are not more people doing
value investing? And it's very interesting
what Charlie Monge is saying and Warren Buffett
was saying the same, is that the
professional classes, and you have some companies, even news companies
like Bloomberg, CNBC, Mad Money with Jim
Cram, et cetera, they cannot justify
their existence on simple things like
value investing. So as Charlie Mong
and Warren Buffett, were always saying is
that if those professors at financial education or yeah, financial education schools, what would they do
for the rest of the semester if investing into stock markets
would be so easy? And that's actually what
value investing is about. Of course, you need
to have a process. I'm going to be sharing
here the process and everything that I
learned from Ben Graham, Warren Buffett, and what
I've been adding to this. Over those 27 years. But what is very clear I mean, it's common sense at a
certain moment in time. So you don't need to look
at graphs and trying to predict and trying to detect
patterns on the graph, double show the single
show, et cetera. So here, it's actually you are putting your money into real businesses, with real customers, with real employees, and so
you want to be able to buy those companies at a
discount price when the market is giving
you this discount. That's basically the main thing, the main characteristic
of value investing. And it's pretty easy as Warren and Charlie
as been saying, is what would those people
that sell their services, their news threats
for very high prices? What would they do for
the rights of Temasa? They need to justify
the existence. So that's already everything
for the introduction. We're going to go now into the key financial concepts,
if you're interested. I mean, of course, you can
skip the next two chapters. So the next chapter is going
to be a key concept that I believe you have to
understand related to money, inflation, how
companies create value. We're going to the chapter after it is going to be
about the investor mindset. But of course, if you
want to skip those and go immediately into
fundamental analysis, which is the first chapter of the value investing
method, you can do that. But it's nonetheless important. At a certain in time,
even for example, when we speak about
intrinsic valuation, I will be using the concept
of cost of capital, which is the concept
that I will be explaining in the
next chapter as well. So thanks for your
attention. Talk to you in the next
lecture. Thank you.
3. Money & cash circulatory system: Come back investors.
So we are starting now the concepts
around investing, and amongst the key concepts that I want to discuss with you, I'm going to start actually
explaining to you how money works and also how
companies create value, so what I call the cash
circulatory system. So, the first thing that I want you to understand
as an investor, before you invest into
the stock market, even any type of asset, not just stocks, that the value of money changes over time. And I think the graph here on
the right hand side that I took from Investopedia explains
it in a very easy way. So it shows the
cost or let's say, the change of pricing
of a cup of coffee. Imagine it would be a Starbucks
cup of coffee over time. So in 1970, you would have paid $0.25 for a cup of
coffee while rough cut, let's say, 50 years
later, the cup of coffee, you see that the price has been multiplied by nearly ten times. What is the reason for this? Well, the reason for this
is called inflation, and it is something that
I want you absolutely to understand so that
you can set realistic, let's say, return expectations on your investments,
any type of investment. This applies to real
estate, to bonds, to any type of even a
cash savings account. So the reason why I want
you to understand inflation is and you will see
this when I will speak about expected returns, what is the minimum
return that you should at least expect and be able to generate
from your investments? It has to be on an annual
basis, at least inflation. Otherwise, you will
be destroying wealth. What is the reason why
is inflation happening? So what happens very often, there could be a crisis. We are now March 2026. There is a geopolitical crisis in the Middle East
with the supply of oil and gas being disrupted with the situation
currently between Iran, US, and Israel, and all the
states in the Arab Gulf. So this will, for example, a shortage in supply will
make prices increase. And automatically through
that, inflation will go up. So I mean, if you're paying
more for a gallon of gas or a liter of petrol
at the gas station, of course, this will have
an impact on inflation. So this will reduce
the purchasing power of people because they
have to spend more, for example, on oil or on gas. Be the same if there
is a shortage on corn, for example, on wheat, the price of bread will go up. What happens sometimes
as well is not just the increase of production
costs that will go up, but it's just sometimes
that the sellers of those products believe that users have more
purchasing power, and they will actually increase the price of the products and services that
they are selling. This also creates inflation, and by the way, on
our YouTube channel, I had been making a video many years ago now or I think it's like two
or three years ago, where I was speaking about
consumer defensive stocks. And you will see I will bring
this to inflation as well. So what happens with
consumer defensive stocks, which are mostly companies
that are active in health products in food
and drinks as well, is that they over time
generate growth by actually increasing
the prices and not necessarily because their
production prices increase. Just that it's a way for
them to generate growth. And I always take the
example of ProctanGamble. So I do shave with Gillette. So most of you, if women
or men, you know Gillette, women will maybe
use Venus glatte as a brand while men just
use Gillette shaves. And so PcanGamble if you
would look at their revenues, and this generates
inflation for us as well. They from time to time
just increase the prices because they believe that consumers have more
pricing power. This is something
that absolutely increases inflation as well. And this is one of
the strengths of consumer defensive
stocks is that they can on a regular basis, you're going to see in their financial repos
that they will speak about revenue growth that is
linked to pricing growth. This is just that they increase their prices on a regular basis. Things that you have to keep
in mind as well in terms of inflation, and I
often get this question, but what should we factor in as the average inflation over
a longer period of time? The easy answer is 2%. Why? Because the
US Federal Reserve and European central bank. I'm not sure about
China Central Bank or Japan or India China
national bank. How they manage this. Maybe I should get myself
informed about that. But at least, what
I can tell you is the two largest central
banks in the world, which is the European
and the US OL Reserve, specifically the US OL Reserve, they try to manage inflation by playing
with a supply of money. And their target is, in fact, to be at around 2% for a
period of around 30 years. Of course, the inflation
will go up, will go down. You may have inflation at 5%. It may cool down
and be even at 0%. So what will happen
is that, indeed, those central banks are going
to play amongst others with interest rates in order
to be able to, let's say, to support a cooling market or actually to reduce
a market that would be too hot where inflation
would be too high and would actually have
an impact on people. So just keep this in mind, keep in mind that in average
over 30 year period, the average yearly inflation
is going to be 2%. And that's something that
will come back when I will explain to you what
is the minimum, let's say, profit that
you should generate on an annual basis
from your investments. And why is this important? And I'm going to show
this immediately here. And here I'm even just taking
one note five inflation. If you are putting your money into a bank savings
account and that bank savings account is
generating zero dot 5% per year, that's what the
bank is giving you. And inflation is at one dot 5%. Of course, in the first year, the difference is
going to be minimum. But when you look over
a ten year period, just look on the bullet 0.1 on the right hand
side of this slide. You're going to
see actually that your bank savings account
over a period of ten years has increased by
5% because that's a compounding effect of
zero dot five per year. But if you look at inflation, inflation will have reduced
your purchasing power by 16%. So that's the one dot 5% compounded over a
ten year period. So that's the one dot 16. So that means that your
purchasing power that was won in year zero has now been
reduced in year ten by 16%. And this is typically the
example I was showing you in the previous slide with
the cup of coffee. So, um so you have
then to think that net net for you over
this period of time, if you have left your money in a bank savings account that generates or that yields
zero dot five per year, you will have actually
destroyed 11%, which is the difference between inflation has been reducing
my purchasing power by 16%. So prices have increased in average by 16% over
the last ten years. My money has only
been growing by 5%. So the difference
between the two is that my purchasing power
has decreased by 11%. This is basically why
you have to understand inflation when you are trying to generate earnings
from your assets. And you see in the
examples below, of course, if you're able to generate
3% with one 5% inflation, your wealth would
increase by 18%, 5%, you will see that
your wealth will have increased by 47% compounding. And the one that is my benchmark is I try I can already
share this here. I try to generate 7%
on an annual basis. And I consider
that there's going to be around 2% inflation. So I will be around,
let's say, 65, 70% of wealth generation
over a period of ten years. So just keep this in mind that inflation is important and
the compounding effect of inflation is important to tell you what should be the
minimum yield or let's say, profitability that
your investments generate on a yearly basis. So of course, I mean, this is just
summarizing visually. Of course, if you're
keeping your money in a bank savings account, you're going to be destroying wealth over a long
period of time. Of course, it's less
risky. I will speak. I think it's in the next lecture about risk versus return, but you will be reducing your pricing power or let's
say, your purchasing power. So the first preliminary
conclusion that I can already make here is that if you want
to increase your wealth, you need to avoid
destroying wealth. And for that, your annual
return of your investments, whatever type of asset can be
real estate, can be bonds, can be Orex can be
crypt or can be stocks, which is my, let's
say, a competence. It has to be above
annual inflation. And consider as a benchmark that annual inflation is
going to be 2% because that's basically what US
Federal Reserve and what the European Central Bank want to achieve over a
long period of time, is that inflation is at 2%. That's the first thing how
you have to understand money. The second thing is, what
does it mean to invest? And I will try to explain
this in an easy way. And this is a summary of a course at Harvard
Business School, which was for me the first time many years ago
that I was able to understand the circultor
system of money. Basically, and you see this is basically like a balance sheet. So you have on the
right hand side, the sources of capital, on the left side, the employment, the use of
the sources of capital. This is how actually
you generate what is a process of investing. You are trying to generate
income by using capital. And in reality, now we
make it simple here, there are just two
sources of capital. One where you borrow money. You can borrow
money from friends, from a bank, from any type
of even a private lender. We are now March 2026. There is a private credit crisis in the US with private lenders. And so this is one
source of capital. The other source of
capital is when you self, you have the power
have the cash. So this is more like
acting as a shareholder. So you don't need to borrow
money from a third party. You bring in the money or let's say, the capital yourself, and bringing in capital is not just bringing it through money, through cash, but it can be also bring in an asset
like a computer, a car, a machine as
a productive asset. So those are the two
sources of capital. And what you want to achieve, and I'm explain this
in the next slide. And let's consider that
the typical way how in a company value is created is that you have those
two sources of capital, either that the company borrows money from a
lender, can be a bank, can be a private creditor, or the money comes in
from the shareholders. And that cash, let's
consider just in an easy way that the cash is coming in from those
two sources of capital. That cash will be used
and will be used to buy assets and buying assets
if you are, for example, an airline company,
you're going to buy airplanes with this capital, again, two sources of
capital, lending money. So borrowing money from lenders or bringing it as shareholders. You're going to buy office
space or manufacturing plant, new machines, cars, if you're
a taxi driver company. So those are the type of things that you're going
to be employing your capital in order to transform the
capital into assets. And the hope that you have, this is my flow number
three is that you're going to hope that those assets
will generate a profit. Then what happens when
the company has generated a profit from those assets
from those productive assets, as we also say? Well, basically, the company and company management
has three choices. Either they reinvest
the profits generated, so the cash generated
as profits, and they expand the
amount of assets. They're going to buy new planes. They're going to buy more
buildings, more office space. They're going to employ more employees as well, more people. They're going to add
manufacturing plan. So that's flow number four. That's one choice that management has with the
board of directors. The choice that they have in case the company has
been raising money through debt holders so that they borrowed
money from lenders. What they can do is just
reduce the amount of debt because when you
borrow money from lenders, you're going to or the company is going to be paying
interest on it. And interest is something
that will evaporate. I mean, this is cash that has just been used
to buy assets, but you have a certain
amount in time, first of all, to service
the debt through interest. So that has a cost
to the company. And secondly, you will at
a certain point in time, have to reimburse
the debt as well. So what I like as an investor to see is that
the company management also reduces the debt burden and even the cost of
servicing the debt, so reducing the amount of
interest that are being spent on the outstanding debt. So that would be
flow number five. Then flow number six,
this happens more for very mature companies
like the Unilevers, the Nikes, the Proc Dan Gamble, the Microsoft, is
that the money, sorry, the company
has excess cash. And so, I mean, so they continue to
use flow number four, so they continue
reinvesting cash into the company because
sometimes you also have to replace old assets. If for example, the manufacturing plant
exists in 30 years, you're going to
have to let's say, update the manufacturing plan. So there's going to be a part of the money that will
be used just to re update old assets, in fact. But sometimes when there is excess cash and the company
has low debt, well, what happens very often is that the company
just gives the money back under the form of cash dividends to
the shareholders. So this is the cash
returned to shareholders. Let's be very clear, in
this value creation cycle, what is called also the cash circulatory system in companies, the options 456 are very
often a combination. So you may have 40%
of the profits. So when I speak
about the profits, I'm speaking about flow
number three here, the profits that the assets
have been generated. Well, maybe 40% are going for being reinvested
into the company, 30% are being returned
to reduce the debt, and other 30% are
returned to shareholders. For young startups, for
young growth companies, the flows five and
six do not exist. It will be 100% of the
profits generated by the assets will flow into
the process number four, which is reinvesting
the money into the company to accelerate
the growth of the company. And so always keep
in mind that this is the type of judgment and
arbitration that management, together with the
board of directors has to do on behalf
of the shareholders. Of course, sometimes
shareholders, they will have to agree on a certain amount
of elements as well, specifically on 45 and six. So this is what I wanted
to share with you. So on top of understanding that money carries an
element of inflation so that your annual
returns should be at least at the level of inflation. Otherwise, you're going
to be destroying wealth. When you think about what
investing means, well, you understand how for a
company or in general, even outside of a company, investing is you
bring in capital. You have two sources of capital, you have debt capital and
then really equity capital. And from there, you
hope to generate an asset or let's say you transform this into an asset
that will generate profits. And this is what
investing actually means. And that profit should
be above inflation. That, I hope that
you understand how money works with
inflation, of course, in a very quick way, and also the cash
regulatory system, which is something that
we will look as well. When we will be analyzing
companies, for example, in the fundamental analysis, we're going to be looking at, for example, how companies are good or bad are
generating profits, for example, from their assets. With that, thanks for
your attention and talk to you in the next
lecture. Thank you.
4. Risk vs Return: MAC investors. Next lecture in the chapter about key concepts related to the use of money, we already saw inflation and now an extremely
important concept, which is the risk
versus return equation. So as you saw in the
previous lecture, the first preliminary
conclusion that we could take based on inflation
and let's say, the long term 2%
that central banks try to achieve is that in
order to increase your wealth, you should at least every
year generate the yield, so the profitability
of inflation. So if you are below, let's
just take 2% as a benchmark. If you are leaving your money in a cash savings account
at zero to 5%, of course, the
risk will be zero. And this is exactly the lecture, I want to speak about
risk versus return, but you will be
destroying wealth over a long period of time, as you saw in the
previous lecture. But as I already just mentioned, returns are not equal depending on the type of asset that you invest your money into. And I like to use this
graph to explain, and this goes beyond investing
into the stock market. This goes actually into the conversation of wherever
you put your money, you have to adjust your return based on the risk
profile of the asset. And when we speak about asset, you can see on the
right hand side, if you would have
$1,000, $10,000, $1 million or $100 million, you have various opportunities
for you as an investor, where you can put
your money into. It can be a corporate
debt type of asset. So and corporate bond, as we call it, where maybe
the yield is eight 5%, which is then probably a where the risk is
nonetheless higher. Let's put it at 25% of
default, for example, a bank savings account
where we already saw that the yield is zero dot 5%, and the risk is not zero because the bank
can go bankrupt. You saw this with
financial institutions like Lehman Brothers,
for example, but, of course, you
cannot expect with a very low risk to have
a very high return. That doesn't work.
So this is, in fact, the most important
thing that you have to understand after
understanding inflation and that your purchasing power decreases over time
because of inflation. That, in fact, your
return has to make sense versus the
risk that let's say, the risk has to be aligned with the type of asset that you're
putting your money into. And I want to just I mean, I'm not a financial advisor. I'm just sharing my 27 years of value investing that allowed me to be financially
independent. If you see advertisings
where they say it's zero risk and
you get a return of 7%, honestly, stay away from it. They have been cases, including Icelandic banks
during the financial crisis, I think it was 2007, where they were claiming that
on a cash savings account, they would give you like six 7%, and the risk would be zero
on a cash savings account. So pay attention. Always think logically if you are
investing into a startup, of course, your expected return should be maybe 35% per year, but the risk is going to be 95% because we know
that startups, they disappear in average, I mean, 95 out of 100 startups disappear
in the first five years. So Keith is in mind, and, of course,
think about, okay, I mean, your money will have various opportunities where you can invest your money into, and this can be
real estate assets, treasury notes from the
US federal government, can be a company, which is a growth company, can be a startup, can be corporate obligation
or banks this account. But just think that it
tends to be logical, okay? So a return, an
expected return of 30% cannot come with
a risk of zero. And if you're investing
or you want to put your money into a very
low risk vehicle, your return is going to
be very low as well. So keep always this correlation
between the two in mind, and this is what I'm trying
to share here with this risk versus return graph,
in fact, or line. So when you think about now
stock markets, actually, and when I speak about even
publicly traded assets, you're going to have
what is called primary market and secondary market. To make it simple here, will not go into
the details of it. Primary market is
private market. So those are assets that you
don't have access to And so, for example, private equity, startups, everything that is
related to venture capital. Those are assets that are not listed on the stock exchange. And then secondary market, those are already, let's say, second hand assets that have moved from the private
market to the public market. So those are assets that
become publicly listed. Have bonds that become
publicly listed, which is a corporate debt. You can have the government
who is, let's say, who wants to finance
infrastructure, railways, a new airport, and
they're going to actually be publishing a sovereign debt. So that's going to be on
the secondary market. So that's going to be
a public listed asset. And you can, of course,
have the same with stocks. So my investment universe is
clearly a secondary market. I don't invest into
primary market. So just that you have heard,
what is the difference between primary market
and secondary market? Now, what is the expected return that you can have when
you invest into stocks because the other
value investing is about value investing into stock markets and
into company shares. So I'm trying to summarize, and I'm going to
show you also how Warren Buffett
thinks about this. If I would have to make
a precise calculation, what should be today in 2026, we end of March 2026? What should be my
expected return if I put my money into the
stock market today, let's say, for the next year, let's just keep it on an
annual horizon perspective. There's going to be three
variables in that equation. The first one is so what we want to calculate is
the average expected return. So the three variables
that we have to calculate, first of all, what is the overall
inflation rate that we have? And I mean, you can go on I've put you the
website at the bottom. I mean, you can even ask
the US Federal Reserve. We have this in
Ville when you can actually prompt the
US Federal Reserve. So the US inflation rate at the latest
available number was 260 8% on a yearly perspective.
So that's one thing. So this is the speed at which your money will be
eaten up by inflation, what we saw in the
previous lecture. And then you could say, Well, if I want to so I have
to consider this 260 8%, my money has to yield at least at an amount that
is above that inflation. If you would invest
if you would have a perfect vehicle and you would invest into the US economy, which could be reflected by the US gross domestic product, the US gross
domestic product has generated last year
around 5%, okay? So it means that if you
would have a vehicle, and this vehicle would
allow you to invest into the growth of the US
economy minus inflation, you would be at rough cut two 7% of growth on top
of the US inflation, which is okay, you will
not be destroying wealth. Now, if I come back, I'm
showing you the slide again. If I look now, if I'm investing
into the stock market, where does the stock market
sit and what should be the expected return of
the stock market if I invest into shares
of companies? Well, this is where
you have to think about the equity risk premium. And one of my
favorite, let's say, references that I use
is from ASPA Damodaran from the New York University
Stern School of Business, where, in fact, in March
2026, ASPA Damodaran, he calculates this
with his students, and this is public information, and I really like
what he is doing. I have a lot of respect
for ASWAEmn so he has estimated that the current 12 trailing months
equity risk premium. So that's the risk premium
that you have to add because you invest
into the stock market, because the risk. So coming back to this slide. So if you invest into
the stock market, your risk will be more
or less here, right? So if you look at the X axis, so it will not be zero risk because you never know you
invest into a company, the company goes bankrupt. I will share this all with you when I will speak about
fundamental analysis, how, for example, look at bankruptcy risk to try
to reduce this risk. But technically
speaking, you would be safer if you would invest
into a sovereign debt, for example, of a AA
listed government like the Luxemburgsh government. I think the US and now A, they have lost their A
from the rating agencies. So if you would invest into
A type of bond, for example, of the Luxemrig
government, well, the risk is close to zero
because it's a AA rated bond. And but at the same time, your return will be
below 1% very probably. If you invest into
companies like, and I'm going to show this
to you like Coca Cola, ProctanGamble, Urban
Outfitters, Microsoft, you have to expect a certain return on those
type of investments, and it's going to be more
risky than investing into a AA sovereign bond of the Luxemburgis
government, for example. So this is what Aswat explains as being the
equity risk premium. So this is the risk premium
that you have to add on top of the US gross
GDP minus inflation. So if I would do now in
March 2026, the calculation, out and you see the calculation
here in this slide, your expected return,
if you invest into equities is seven not
zero, 4% currently. So rough cut, it's 7%, actually. So this is what you should
be expecting if you are investing into average
stocks on the stock market. But I will now be a
little bit more precise. You're going to see
I'm going to be being a tiny more precise on this. I said, I mean, in
Vinla and again, it's not about making
the promotion of Vin, but we really created
this tool for us because I want to be fast in making my
investment decisions, but having a sound and
serious investment process. So we have put actually
into Vinla the cost of capital database that is
public from AswatamolRn. So I've put you even the URL. You can go and see
that database. So he is publishing
per continent. And here we are using
the global cost of capital by industry sector, and it's always updated in
January, so start of the year. Just to give you a benchmark. As Wade Moran has
been benchmarking 48,000 more than 48,000 companies across all
sectors globally. And, of course, that
includes financial sector because financial sector
is a specific beast, how to make the valuation
of that sector. And overall, it's 43,000 companies without
financial sector that are being analyzed and kind of aggregated in this
cost of capital. Um, database. So why is the
cost of capital important? Because the cost of capital, if I come back to this slide, the cost of capital will tell us if you have a
company like Coca Cola, where should it sit here
on this graph, in fact. That's the whole intention
of this cost of capital, which is kind of the
expected return that you should have if you invest
into company like Coca Cola. So I'll explain now this
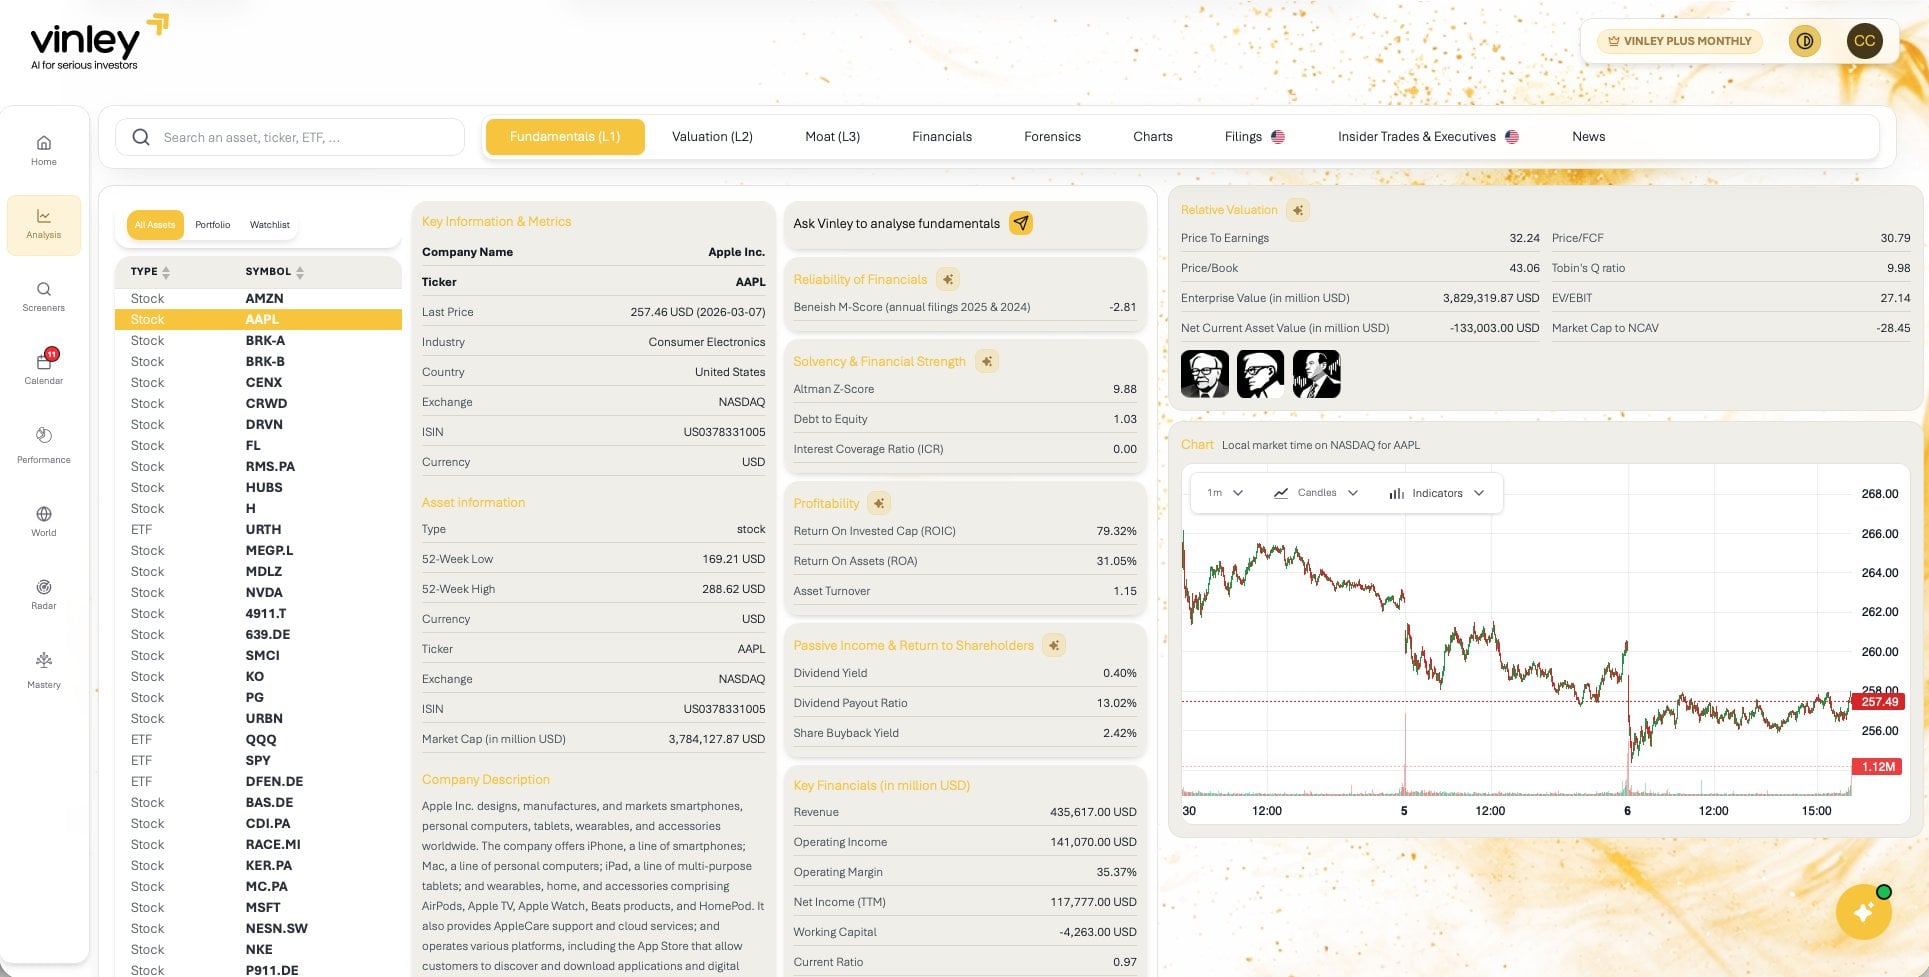
with four concrete examples. So the first thing, when you are in Vinla
when you go here to the valuation screen in the analysis part and
you take a company, you will actually see at
the bottom that Vinla is fetching automatically. So it's searching
automatically the cost of capital for the industry
that the company is in. And this is extremely powerful. And again, this
is, for me, being much more productive in
my investment process, because if I invest into
Coca Cola versus Microsoft, the expected return
should be different. Why? And I could ask another question and
maybe think about it. Is Coca Cola a higher risk
investment versus Microsoft or is Microsoft a more risky
investment than Coca Cola? Answer, you're going
to get it in Vine. And this is based on
Aswatamodorans database. I'm going to show you here four examples of four companies. You probably know
those four companies. So the first one is a Tika KO, that is for Coca Cola, where, in fact, in the
last year, in fact, the cost of capital for
Coca Cola and let's say, the industry that
Coca Cola was in, which is beverages, non
alcoholic was of 730 9%. Urban outfitters, which is a brand very well
known to youngsters. They love to shop and buy apparel from those shops
of urban outfitters. So you see the industry's
apparel retail. So the cost of capital
is eight to 22%. So you see that here already, Vinley based on ASW Motorn
database is telling you that urban outfitters is
a little bit more risky investment than Coca Cola. Why? Because of the industry. Rock Dan Gamble, which is in household and
personal products is considered that industry is considered at a cost
of capital of 9.02%. And Microsoft, you
see that if you would click in
Vinley on Microsoft, it will do so this is what we
call sensitivity analysis. It will tell you that
software infrastructure has a current cost of
capital of 11 80%. If you keep those figures
739-1180% in your mind, and you would put
them actually into this risk versus return graph, you see that, and again,
it's not now here, super precise, but I just want you to understand the logic. You see that investing. So I was mentioning, so
just bring things together, that the average return on equity should be
around 7%, right? Okay. But depending on the company that
you're investing into, because zero the 70, 4% is a market average. If you're investing into
a specific company, there you have, again, to
risk adjust your investment. And you see, and this is where we want it to be leveraging the power of technology within Vinla Viney will tell you
that Coca Cola has a 730 9%. So it will you see it's
very close to the 70 4%. But you see that
Microsoft because Microsoft is tech industry. The, the risk adjusted
return is nearly 12%, even though Microsoft exists for more than 40 years, right? So this is the sensitivity
analysis that Vin automatically doing for
you, you can, of course, disagree to it and change, let's say, the
value, if you want. But just telling you that this is why we created
Vine to be able to at least do the sensitivity analysis and
be able to tell you, Listen, if you're investing into
this type of stock, what should be the cost of
capital that you should be using based on the
riskiness of the stock, meaning the company slash the industry that you
are investing into. Just to be precise without going too much into the details, we don't have and it's very complicated to get the cost
of capital per company. Um, so here we are
taking the industry. The company is in as a proxy as a correct measure when we do
the sensitivity analysis. But some companies, but I
have not seen it very often. I remember Mercedes in one of the financial
reports doing this. They were showing what is their
cost of capital they use. But here we just
use the industry as a valid proxy
for the company. In fact, to adjust
the cost of capital, which means to adjust the risk versus return expectations when you invest into those companies. And we have this, I mean,
we are using, as you saw As Wa Moderns database. Now, what is the
so based on that? What could be the
also here the slide, that's the reason why I
invest also into stocks. If you look over
the last century, and I would take the
big classes of assets. So stocks, cash, bonds, real estate, and gold. Okay? So I will not put crypto and those type
of things in here. It's just too young
for the time being. If you would look at
the last century, and this is the reason
why I invest into stocks, stocks has been the most
performant asset class across all asset classes. Of course, it has to
be risk adjusted. It's more risky to
invest into stocks versus keeping your money
in a cash savings account. And you see that
if inflation over the last century in
average was three 2%, this is globally speaking
across the world. You see that cash has
only yielded three 3%. So you see that actually you would not be very well off
by investing into cash. Bonds very safe. So, I mean, bonds,
just to explain here, bonds are here on the
lower side of risks, but also at the same time on
the lower side of returns. And this is exactly what
you see here in the slide. Bonds have been at four or 3%. Real estate in average four 7%, a gold five 6%, and of course, it depends on the decade
that you are looking into. But you see that stocks in average for the
last century have been generating ten
3% of annual return. Another figure, and even Warren Buffett has been
speaking about this, if you would, as an investor, not be interested
in learning how to invest into the stock market
and doing stock picking because I became a
better business manager by being a value
investor and vice versa. Because I was running companies, I better understood how to
invest into the stock market. So I had the chance that
both sides actually help me. But if you are not into understanding or even reading
financial statements, I mean, you can
look at the SP 500, which is like the 500 largest
market caps in the US, and you could see
what is the type of performance that you
can get from SP 500. And just give me a
couple of minutes that I explain the next
slides about timing as well of the market
before you run over and start investing
into the SP 500, ETF, for example, or trackers. So the SP 500 has been
generating rough cut 12% on a yearly basis
for the last decade. This is a figure
that is coming from the standards and Po website, but just keep one thing in mind. When you see this
figure, so beware, please, when you read
the figure of 12%, it means that you would
have a perfect timing, and you would even
not sell your SP 500. So if you would buy
an SP 510 years ago, and you just Larry Run, would have generated 12% on a yearly basis for
the last ten years. So we're looking here
at the last decade. So let's say between
2015 or let's say, actually 2016, 2026, okay? Oh, but what you
have to keep in mind is that an SP 500 will only generate in average 2%
of dividends, right? So it will not generate
a lot of passive income. I will cover why passive income is important for me in the upcoming lectures. So it means that if you want to, and this is something
that people don't understand when they
see or even when they hear that investing
into the SP 500 generates 12% on a yearly
basis for the last decade. What they don't realize is that in order to generate those 12%, they cannot touch that asset. So they just have to leave
the asset run, in fact. And, of course, I mean, if
you don't need the money, that's great because
12% is much, much higher than inflation. So you're going to be actually increasing your wealth
in a very strong way. But what you have
to be aware of is that you cannot time the market. And in order to generate those
12%, you cannot extract. You cannot do, let's say, selling those assets and take in capital
gains because then, let's say, the stream of performance would
then stop, in fact. One thing and this is an
extract that is coming from a public conference I gave
on the future of finos 2030, which's now what 1.5
years ago in front of a large crowd at a public event where also I was speaking
and I was mentioning and reminding all of us
and everybody in the room. So there were financial
professionals in the room that what people, what humans, where they are irrational, is that they think they can perfectly time the market,
and actually it's wrong. Even myself with 27 years
of experience, I cannot perfectly time the market. So I know that I will never be buying new companies at
the bottom of let's say, of the market, and
I will not be able to sell companies at the peak. I was giving, I think
in the intro lecture, the example of Ambev
which was a company I bought around one
dot 85, one dot $9. I sold it 265, and the market went up to 305, and then it came down
to two dot seven. So even there, and I'm
speaking here six months ago, I was unable to perfectly
time the market, but nonetheless, I was happy to get dividends,
passive income, plus buying at one
dot nine in average and selling it at 265 a
couple of months later. So just keep this in mind, also, when you look at the statistic
of the SP 500 is that you will be unable to
perfectly time the market. And actually, the
official statistic, and there is a
company in the US, which actually publishes a repot that is called the
quantitative Analysis of investor behavior repot. And so the company I
think is called Dalbar. They have been proving that
over the last 20 years, the gas t ratio of humans, timing the market has been 55%. What is 55% is one
out of two times, which means that it's
nearly the same probability then taking a coin,
flipping the coin, and then depending if it is one side or the other
side of the coin that you decide to
buy or to sell, actually, and to predict the direction where the
market will be going. So if I bring this
back to what should be your realistic long
term expectations when you invest into stocks, so into real companies, and you buy shares
of the companies, and even Warren Buffett
has been confirming this. So he has been saying that rough cuts the average return that you can expect by investing
into stocks is between 6% to 7% over
a period of 30 years. Rough cut. That's basically
what he's saying. This is where I want to set
realistic expectations. And again, I mean, this is a quote from Warren
Buffett many years ago. If I go back to the
slide here and I just make and I prove you the
mathematical calculation today, this is exactly
also how and this is kind of the
reverse calculation that Warren Buffett has
been doing at that time, is that you're going to have
the GDP of the US growth. Mine is inflation.
Plus, you're going to add the equity risk premium, which is the risk that you
want to be rewarded for because you invest into stocks
and remember that stocks Ah, here in terms of
risk versus return, they have higher risk
than, for example, sovereign bonds or
AAA corporate bonds, for example, or even a
cash savings account. And this is Warren is saying, Warren says, Well, basically, if I consider that
inflation is going to be around 2% and that the GDP
growth will be around 3%, that at the very end of the day, if I add the risk premium to it so the equity
risk premium, so it's good to be
at 6% to 7% yearly. And what does that mean? So
just to give you a sense, because a lot of people
don't understand or don't realize from a
quantitative perspective, what does it mean to generate
7% year over year, for, for example, ten years, you're going to be
doubling your wealth because of the
compounding effect. So this is like a
snowball effect. If your assets
generate 7% per year, you're able to keep that streak of performance for ten years, you're going to see
actually that 7% compound it ten times will become two, so one dot 967. Only generating one dot 5% and you compound this over
a ten year period, it is going to be 16%. So you understand that,
and this is where also, I want you to be
realistic is that if you believe that by investing
into the stock market, you're going to earn 30%
for the next ten years, and every year, this
will not happen. I promise you're
going to be taking very high risk or you're going to have unrealistic
expectations. Me personally, I try to
achieve 6-7% every year, and then having this
compounding effect. In fact, for the last ten years, and now I'm doing
this since 27 years, and I'm now 54-years-old. Five years ago, actually was able, thanks to
Value investing, together with my family, to be financially
totally independent. No debt, real estate assets that we fully own without debt and actually the
dividends that our assets generate are paying our family
budget on a yearly basis. And last thing before
wrapping up the lectures, because I think it's
important that you understand risk versus return. In Vina, what we have added as well in the valuation
screen is that you can assess and I
will explain what is the intrinsic value
of Warren Buffet, Peter Lynch and Joel
Greenblatt later on. Specifically, we're
going to be focusing on Warren Buffett method. But just to show you a graph, what are those people
have been exceptional. Have been, in fact, the
performances of those people. And so, I mean,
the ones that have inspired me are definitely
Warren Buffett first. You see, Warren has been
generating something like around let's say, 13% over nearly 60 years, which is just an
incredible amount of wealth that he has generated. Peter Lynch has been
generating as well around, let's say, 13% for a
shorter period of time, where Joel Greenblood,
for example, was able to generate over
20 year period around 30%, according to analysis
that have been done. So I will not go into
the details of it, but just to tell you, you will need to have realistic
expectations on returns. These people here
are exceptional. And I tell you, for me, this is the red line
that I've put here. If I'm able to generate 7%
for my family for 20, 30, 40 years, I think we're
going to be okay, and this is what has happened
until now with us, in fact. So that thanks for
your attention. This was I hope that after the money and inflation
understanding perspective of things
that you understand also how to risk adjust
your investments and be realistic about
what you can expect from investing into the various
classes of assets, including stocks, including then the equity risk premium or the stock risk premium that you have to
add on top of that. So with that, thank you for your attention and
talk to you in the next one where we will briefly
speak about investment, stars and vehicles. Thank you.
5. Investment styles & classes of shares: Investors, next
video, next lecture, a couple of things
before you start investing that you need
to pay attention to. We're going to be speaking, first of all, about
investment styles, but also the type of vehicles
that you may be exposed to. So first of all, let's speak
about investment style. So actually, one thing that
has to be also very clear. I mean, I mentioned in the intro that I'm
a value investing, but there are different
populations of investors. You have speculators,
you have people who look at technical
graphs and try to predict based on patterns what the stock
movements will do, and they're going to
look at for example, moving averages,
those type of things. So I just kind of summarized here what you have in terms of investment
techniques. I'm a fundamental investor, so I look at the
finances of the company, but you have other
ones which could be called technical analysts. So they look at
graphs, for example. You have in terms of
investment styles, you have people who like to have passive management of their
investments like investing in ETF and the ETF is automatically adjusted by machine
or other ones that prefer to have ETFs that are managed and our decisions
are done by humans. Have also people who
like to invest into private equity companies
that are pre IPO, are the ones that invest into
companies that just have listed that just have
IPO on the stock market. You have people who want to
invest into growth companies, are the ones who prefer to
invest into mature companies. You also have sizes of companies that you can find
on various stock markets. You have what we call micro cap, small cap, mid cap, large cap, and mega
cap companies. Then you have various
asset classes, like people who like to put
their money into crypto, other ones into ETFs, other ones into
closed end funds, other ones into stocks or Forex. So that's foreign
exchange conversion rates and try to predict how
the yen, for example, will move compared to the
US dollar, for example, or euro versus the
British pounds. As a value investing,
coming back, like what is a little bit the end game of value investing, if I would have, just to pick, what are the attributes
and I put them here is, I'm a fundamental analysist. I am an active investor, so I do stock picking. I invest into mature companies. I don't invest into
growth companies, and the type of companies
that I invest into, and I will explain
this in the next slide is large and mega cap, and I only invest into stocks,
nothing else, in fact. So this is little
bit the attributes of my investment style. To speak about caps when we
speak about micro small, mid large and mega caps, so mega caps are companies that have typically above 200 billion of market capitalization. What does market
capitalization mean? You take the current
share price of a company and you multiply
by the number of shares, so a share is a portion
of equity of the company. So you will never own 100% of Nvidia of Microsoft of Apple. So you have a portion of the balance sheet
of the company. That's what a share actually
represents a share. So that's why it's
called shares. So it's a small piece
of the company. And if you multiply the current
share price by the number of shares that represent
the whole company, it will tell you what is
the current market cap. So for example, mega cap
is above $200 billion. Large Cap is typically
set between sorry, $10,200 billion,
mid cap small cap. So it doesn't mean that large cap companies are more profitable than
small cap, for example. So it really just depends
on the type of let's say, even of industry or how fragmented or concentrated
markets actually are. So for value investing, I mean, they have been very and
I do know a couple of value investing who only invest
into small cap companies. So those are small
companies that have either a very niche
product or just present, for example, in one,
two, three countries, but are not global companies. I have to admit, and if you would look at my
current portfolio, we are now March 2026, I tend to invest into
very big global brands, as I already started to explain
in the previous lectures. So I do like to invest to at least large two
mega cap companies. Of course, if they
are undervalued by the market and I feel that there's an opportunity
to make money out of it. So just to tell a little bit on the risk versus return curve, what I was showing earlier
in previous lectures, where basically, actually, if I would not just look
at value investing, but me specifically
as a value investing, I would even remove here from the red frame on
the left hand side, the small cap public stocks, I'm just investing to
large cap public stocks which are global companies. One of the things
that is important, and I will explain
to you as well, things that you have
to pay attention to when you decide to invest, for example, into stocks. The first thing before sharing you examples of BMW, Alphabet, and Richmond about where I have seen people make
mistakes or ask me questions. But first is one
of the things that is for me and allowed me to gain my financial independence
at the age of 49 is that I always consider that
there are two ways of making money when
investing into stocks. The first one is what
I call passive income. And you will learn when I will look at the
fundamental analysis, how you can read passive income, how healthy the
passive income is. But passive income so
earning dividends on a stock is and this only
works for mature companies. Very often growth
companies, if you remember, the cash secretory system, growth companies will not provide a return
to shareholders. What they will do is
they will actually keep the money and just
grow the operations by reinjecting probably
100% of the money into new assets new markets
or buying competition. But for mature companies
like the Nestles, the Unilevers, the proctors
and Gamble, et cetera, they earn so much money and they have probably low
amounts of debt that they can afford to give a part of the profits
back to the shareholder. So again, remember, in the
cash circulatory system, my apologies, you have
those three flows. Company generates
profits from its assets. It sends money back to reinvest
into its own operations, or reduces the debt or, in fact, provides a return
to the shareholders. And very often, the return is either cash dividends
or share buyback, so buying their own
shares from the market, which will just
decrease the amount of outstanding shares to
explain it in an easy way. So I'm always
saying, coming back here that there are
two ways of making money on stock market when
investing into stocks. The one is earning
passive income, and the other one
is when you sell the company at a much higher
price than you bought it. This is called a capital gain. So I always consider and
that's the reason why I don't invest into growth
stocks that for me, there is a possibility
when I invest. And again, this is not
investment advice. I'm giving you. I'm just
sharing how I do it. I want to earn
actually in two ways. So I'm going to be I
want to be rewarded for my patients while maybe the company remains undervalued. And as I told you, I cannot
perfectly time the market. I cannot time the
top of the market, and I cannot time the
bottom of the market. And it happens that I buy a company and the stock
continues to go down, I will then probably continue
to do cost averaging, so buying more of the company if the fundamentals
have not changed, and the market is
just being emotional. But this is the two
ways because if I just rely on capital
gains to make money, it means that I will
always have to sell and to find an opportunity after that to make even more
money and grow my wealth. So it's going to be for me, at least in my investment stale, going to be a mix of
the two, in fact, and I'm going to teach in the
fundamental analysis how to look at the sustainability
of passive income as well. And in the valuation part, so that's the chapter
after the fundamental, I'll show you how to
calculate intrinsic value. So and one of the things that I realize when
investing into stocks that a lot of people or at least I have seen many
people that they get this wrong because they
maybe use a bank or broker and they are
searching for Nike, and then they see Nike is an ADR stock and I'm going to show you
a couple of examples. Or they look at BMW. That's my next slides.
They look at BMW, and they get like four stocks. But which company are we talking about and which stock
which asset should I buy? So one thing that is
important is that every company or every even
asset that you are buying, every securities that you
are buying on stock markets carries an international securities
identification number. That's a unique number that is also shown
by the companies on the investor relations site
so that you can clearly identify that you are talking about the shares of
that specific company. I'm going to show this
to you for examples. In the USA, it's
also called QCP. That's a committee on Uniform security
identification procedures. So they have also QCP number. And sometimes you have both. You have securities that
have an ICN and a QCP. But the one that I really
recommend you because, again, even Vine covers
more than 60 markets and 38,000 stocks so
that you look at the CI. So let me give you
a concrete example. So the example that I want
to talk about is about BMW. You all probably know this
German car manufacturer. And I'm showing you
a couple also of screens of Vin so that you get ws also about an
important element, which is that let's imagine
that you're interested about BMW and you like the company, you
like their products. You like how customers
feel about the company, the nice looking cars.
And you want to invest. You want to buy a
little bit of BMW. And I'm not doing now
here the analysis, the fundamental, neither the intrinsic nor the mode analysis. So that will come later.
I'm just trying to explain to you what you
have to pay attention to. And a lot of people don't pay attention to
those type of things. The first thing is, and
I'm showing you even here on the screenshots of Vinla when you are
searching for BMW, and this is the reality of
investing into stock markets, you are actually you will
receive four different tickers. Why is this? Because
actually, BMW, so the car manufacturer is listed on three stock exchanges. They're listed on the Warsaw. So that's Poland stock exchange. And they have two different
Shack classes that are listed on the Frankfurt's
on the Xtra stock exchange. And then you have a company in India that is on the
Mumbai Stock Exchange, that is called BMW
Industries Limited, which has nothing
to do with BMW, if I'm not mistaken, I
have not searched this up, but I'm assuming it's
not the same because they're categorized as an
industrial conglomerate. And the same, I mean,
if you search visually in Vinla or even you
would ask Ville, do we have BMW in your
Universe or in your companies? It will show you as well. Also, the AI agent will come
up with the same results, so you're going to
see four tickers. So if you want to buy
the car manufacturer, which of those four
do we need to buy? Well, probably the one
in Mumbai already not. Then you can, of
course, always decide to buy the one in Warsaw. But then you're
going to say, Okay, no, I don't want to
buy one in Warsa. I want to buy the main share, which is on the Frankfort
Stock Exchange. But then you have an
ambiguity problem, and this is what financial
AI models also have to do. It's called disambiguation. Is telling people, when
you speak about BMW, which company and which ICI, which unique securities
identification number are you talking about? And then you're going
to realize that well, actually, and of course, this is part of becoming a better investor that BMW has actually two
types of shares. And I'm just focusing now, so if you allow me just
to come back here. So if you type BMW in the search screen Vinla or
you ask the Vinla AI agent, do you have BMW
in your Universe? It will tell you, I
have four tickers that carry the word BMW.
This is what you see below. So it will ask you
disambiguation. So tell me the one that
you're really interested in, for example, to do perform
fundamental analysis. So if I just look at the core, so really the car manufacturer on the Frankfort Stock Exchange, for BMW, they have
two types of shares, but you're going to say, wait, why two types of shares? It's one single company? Well, yes, but you also
have to know as an investor that companies can and I'm going to give you the
example with alphabet, so the previously
called Google Company, that companies can have
multiple types of shares. And what is specific for BMW and you're going to see
the consequences of it. BMW has two types of shares. Why? Because you have what is called a preferred
share and an ordinary share. Ordinary share is also
called a common share. Why do they have two
types of shares? Because they are actually making a difference
for shareholders, they are waiving, so they are removing their voting rights on the preferred shares
because they are saying if you are buying
ten shares of BMW, you will, in any
case, not be able to, let's say, push the needle on decisions that are part
of that are circulated to the annual shareholder
meeting because you are just a0.00 0000 1% shareholder. I mean, it doesn't make
sense that you would buy a common or ordinary
share that has voting rights. But for very big shareholders
that would maybe buy, I'm just saying now 10
million of shares of BMW, those shareholders
probably want to have a say on
decisions of the board of directors and of the executive management
team, including CEO. BMW, this is not the
case for every company, so a lot of companies
only have one class of shares which carry
voting rights. And even if you have one share, you can go to the
annual General Assembly and participate in the voting. But of course,
you're going to be such a small investor that
it will not push the needle. It will not change the
direction of a decision that needs to be approved
or rejected by the annual during the annual
shareholder meeting. But BMW has two types of shares. So you see that for
ordinary shares and preferred shares of BMW, you see that the IC
number is different. So if you would like
to buy into BMW, you need to understand
a little bit that why does the company have
two types of shares, and which one do you want to buy? And there is a difference. Of course, there is difference
on the voting rights. But what BMW does as well, if they're removing you a
right as a shareholder, they need to remunerate
and reward you for this. And if you would look
at the cash dividends, so the tickers are BM w.de and BMW three.de
for preferred shares. You would actually
see that sorry, it's the other way
around BMW dot E is the preferred share
without voting rights, and BMW three dot EE is the
one with voting rights. They actually
providing a premium on the dividend yields and
on the cash dividends. So they are giving you more
money just to keep you silent and not have you vote at the annual
shareholder meeting. That okay, not okay? You
have to judge for yourself, but that's just the reality. So a non let's say, a non voting shareholder
will receive a higher cash dividend than an owner of shares that
carry the voting right. And you see here the prompt. I was asking Willis, show me the different history
of Bmw dot E and BMW three dot E sit by
sat in a markdown table. Another example that is
important to understand as well, I'm giving you another
example which is alphabet, so the conglomerate that owns
Google amongst others and YouTube and all those companies
Deep Mind, et cetera. It is very interesting
if you would look at the financial report, and I really recommend you if you want to
be a stock picker, that you train your
eye on reading financial reports and
develop your muscle. And by that, you will become even a better business
manager if you're running a company or
being part of a company. So Google so Alphabet, sorry, I should not say Google, but Alphabet has three
classes of shares. They have two that are listed on the stock exchange
that you see on the front page of a
quarterly or annual report. So this is the front page what
is called a 10Q that say, quarterly report
that is published by Alphabet and is
available through the US Securities and
Exchange Commission website, amongst others, but also on the Investor Relations
website of Alphabet. And also, of course,
in the annual report that is called the 10K report. I will cover what those reports are I think it's the next
lecture, I'm covering this. You're going to see that Google, sorry, Alphabet has two tickers. They have a ticker that is
called Goog and another one that is called Google
with an L suffixed. What are the differences? Well, the differences
is, as well, that you have and you see
on the right hand side, I prepared this graph that
you have the Class A shares. So that's the Girl with an L.
They do have voting rights, and the Class C shares, they don't have voting rights. So similar situation with BMW. But what is more interesting,
and this is where by becoming an
investor, you need to train your muscle on this is that Alphabet has a third class of shares that is not listed, that is only hold by the management and by
the main shareholders, which is the Class B shares. Why is this important? Because they mentioned
this in the report, but you need to
read the reports. So they mention, and I was just taking the snapshot of 2022, that there are also
Class B shares, and those Class B shares,
you cannot buy them, except if you are part of the
management of the company, which is very probably
not the case. It's interesting
when you would read this in the various reports of alphabets or Google as a conglomerate, as a
tech conglomerate, you would see that
Class B shares when you see the volumes
on the right hand side, if you see my mouse moving here, you see that Class B shares are really a minority
amount of shares. So if you would
make the sum when I prepared the slides, 2023, I think I prepared
them, and I mean, maybe the numbers
have now changed, but the story has not changed. You had rough cut, let's say, around 13 million shares, nearly half half split it between Class A and
Class C shares. And you had, like,
let's consider less than 10% that
are Class B shares. And those shares. So when
you own 10% of company, you are a minority shareholder. What the founders of Google decided is that
this is, of course, something that you can do as
a founder of a company that those Class B shares have ten times more voting power
than a class A share. And they have decided
that Class C shares similar to BMW with
a preferred has, that the Class C shares, which are called
here ClassE but they could have been called
preferred chairs as well. It's just a matter of
terminology, but it's the same. Don't have voting rights. So at the very end,
when you look, and these were the numbers of 2023 that were
available in 2022, I would have to
rerun the numbers, but the story is the same. This is where I want to
train your eye is that, technically speaking,
Class B shares, even though they only
represent less than 10% of the total amount of equity
of shares outstanding. Have more than 50%
of voting rights, which means that management and founders of Google have not
lost control on the company, which is something that I
would do actually, as well. I can tell you, in
the current company where we have
incorporated Winley, it is like this, as well. So I mean, we don't have
three types of shares, but we have two types of shares. We have with voting rights
and without voting rights. Richmon has been a company. I had invested into, I remember, I bought a 57 and I was lucky
after a couple of months, it went up to 93. I decided to sell it. In the meantime,
it went up to 120 because the financials
have evolved again. But I was happy to sell it at that time when it was overvalued
by a couple of percent. It is interesting
with Rigmas well, they have a pretty
similar situation to alphabet, so to Google. And again, of
course, you need to look at the latest reports. But technically speaking,
what was said is that so there are two types
of shares, Class A, Class B. Class A is freely
available on the market, but they will never own more than 50% of
the voting rights. So if you would buy Rich Ma
even as a big shareholder, family. So it's the Rupot family from South Africa that owns
this luxury conglomerate, that the family
will actually still maintain the control
of the company. So that's the type
of thing. And again, I don't want to scare you here, but that's the type of
thing when you think about what type of
investor you are, what are the
attributes? Are you? Are you looking at
technical graphs? Are you a fundamental
analyst or investor? Do you look at ETFs, at crypto, at stocks? Do you prefer smaller cap
stocks, bigger CAP stocks? So you understood that
I'm a stock picker. I like fundamental analysis. That's all about
value investing. I will teach you in the
upcoming so in three, four lectures, we'll start
going into the fundamentals. But you need to understand
a little bit because I recommend you to act as
an owner of a company. When you buy even
one single share, you have to think as an owner of a company that you need to also train a little bit your eye on when you are
buying a company, what I was sharing
here with BMW, which ticker is the one
that you want to buy. So sometimes you need
to also for yourself, make sure that there is no ambiguity in the type of ticker that you're
investing into. With that, thanks
for your attention. And in the next one, I will give a very short introduction
about financial reports. Thanks for attention. Talk
to you in the next one.
6. Balance sheet, income statement & cash flow statement: Mac investors next lecture, we are still in
the key concepts, and one of the key concepts that is very important
to understand is, in fact, looking at
financial reports. So I don't have time to go into all the details of
financial reports. I do have a specific training
that is called the art of reading financial statements or reading financial reports. So here we'll try really to give you the main
keys to understand the three main financial reports that are part of the financial
statements of a company. So the key question that
I could ask you is, what are the main tools
to understand how the company creates value
for its shareholders, its customers, its
suppliers, its employees? And in fact, the main tools
that allows us to observe how they create value is by looking at the
financial statements. And in the financial statements, I will just speak about three. In most of the companies
that are public list, you're going to see five
financial statements. There is one which is
related to equity, one that is specific as well for what is called
comprehensive income. So those two we will skip. I will just focus on
the three main ones, which is, first of all,
the balance sheet. So the balance sheet, and
I tend when I analyze companies to start looking
at the balance sheet. The reason is that
the balance sheet at any moment in time shows the creation and destruction of wealth for that specific
company since day one. So you are not looking, and this one I'm trying
to show you here, if I introduce the two other financial
statements or reports, which is the income statement and the cash flow statement. So there are three,
the balance sheet, the income statement and
the cash flow statement. You will actually see, in fact, that the main difference
between the balance sheet and the other statements is that the other statements
are showing you, let's call it a performance over a period of time,
in terms of income, in terms of cash, for example, cash collection, disruption
or cash outflows. Balance sheet is not having
a specific time period. It's from day one that
the company has been credtd until the moment that you're looking
at the company. So that's why before I
invest into companies, I start actually by looking at the company by looking
at the balance sheet, in fact, before I look at the cash flow statement
and the income statements. I know, I mean, if you are a little bit fluent
in investing into stocks, you may actually understand
that most of the people, they look at the
income statements and then they don't look too
much at cash flow balance. Actually, my order, and
I'm speaking extensively about this in the art of reading financial
statements training, actually start with
the balance sheet, then I look at the
cash recepment and then only at the end, I look at the income statement. So, a little bit different. On the order, I look at
financial statements. So this is an example. I'm going to give
you two examples. I will be speaking,
also, again, very brief. I don't have the time to
go into the details of it about IFRS and USA
GAAP standards. So IFRS is for listed companies across
the world all countries, with the exception
of India, China, US, and there are three other ones, all countries follow IFRS
as an accounting standards. The US, they do follow US GAAP, and I will very, very briefly show you the differences.
So you see here the logo. So we'll speak
about two examples of companies, one which is NSL. So here a consolidated
balance sheet of Nesl also observe
that very often, and this is in IFRS, but it's the same in USA. You're going to
have at least two consecutive years
that you can have comparative measures between the previous
year and the currently. So the current year
that is being reported, if it is in the balance sheet, if it is in income
ceil on the cash flow. That's why you see
those two columns here. M and you see here, this is the income statement on the left hand side for NSL, which is a very big
food conglomerate worldwide with headquarters
in Switzerland. Then you see on the
right hand side, the cash flow statement I will briefly walk you what are the differences
between the two. Here you have the company Nike, which is a US company. Nike does not follow IFRS. They follow USA which is US generally accepted
accounting principles. We'll also briefly explain
to you the differences. You have here a
consolidated balance sheet. Again, you're seeing two years, so two comparative years, and you have the
statement of income and also consolidated
statement of cash flows. Don't want to go too
much into the details, but just be aware that those are typically the three that you should be actually looking into. Well, we have done
in Ville as well, and that's something
that I wanted to have for me also
as an investor. Of course, you can look at the annual and quarterly statements, if it is balance sheet, cash flow statement,
income statement. But there is something that I was very interested to create, first of all, for myself, Will is to have a side
by side comparison. Be very often when you look
at many financial tools, going to have five years or ten years of
the balance sheet. Of course, we have this as well. In Vinla, you're going to
have, for the time being, at least five years
or five quarters. It doesn't matter. You're
going to have both. But what I was missing in
a lot of tools before we created Vinlay I want to have
a side by side perspective. I want to be able to see the two sides of the balance sheet. This is what you see here
in the Vinlay screen. So the assets under liabilities plus equity that I
can directly compare, but also want to see in
the same perspective, cash flow and income
without having actually to click
between screens. That's why we created
this unique side by side view for those who like to read
financial statements, I honestly believe that it
helps looking at companies specifically at the three core financial statements
which are balance sheet, as you have understood,
income statement and cash flow statement. Now, what is the income
statement? Very briefly. The income statement
is capturing the economic activity of the
company as easy as that. So everything that they
have generated in terms of revenue will be captured or caught in the
income statement. This is money that
has been invoice to customers or is money that
will be invoice to customers, but where the
company has already incurred or generated the
products, for example, the products, half for the time being not been collected yet
from a cash perspective. I will explain the difference
between income and cash. Then, of course, in
the income statement, you can have additional
reporting like pjography per customer
segment, those type of things. So rough cut or in average, what the income statement or
in summary not in average. In summary, what the
income statement captures is the economic activity
of the company. So this is what you see here, if I take the Nesli side by side with the Nike
income statement, you see if you just follow the
bullet points one and two, that Nestle has generated
91 billion Swiss francs because they report in
millions of Swiss francs. So they have generated 91
billion of Swiss francs. Of sales or revenues,
it's the same. And Nike, for example,
in the year 2025, they have generated $46
billion of revenue. So that's the economic activity, but does not tell you yet what is the profitability
of the company. Some people even call
this a gross income. I have seen this sometimes. I prefer to call it revenue
or sales, economic activity. When then you continue in the income statement,
you just go down, you're going to see the line
that is called net income. So you see, for example, that
Nestle, so if you remember, they have generated 91 billion
of revenues or of sales, and they have
generated out of those 91 billion of economic activity, Rough cut 11 billion Swiss
francs of profits, net income. Those are non cash profits. I will explain this in
a couple of seconds. So you can see that from
the economic activity, Nesl has been generating
rough cut 12%. So the 12% is the 11 billion
divided by the 91 billion. Nike side. So Nike had an economic activity in
2025 of 46 to $3 billion, and they have generated three
dot two non cash profits. So again, if you make the math, it's going to be
rough cut six 7%, in fact, of net income
versus economic activity. So dividing 219/46309. A thing that is
very important to me is looking at the cash flows. And why? Because
you're going to see, you're going to cover this in a couple of seconds,
cash is king, and I've learned this also from Ron Buffett, cash is king. So what is interesting in
the cash flow statement, and how you're going to see
the differences already. And, of course, maybe if you have never looked at a
cash flow statement, I may be challenging
a little bit your brain here
between net income, which is non cash profits
versus cash generation, which is, in fact, well, this is cash profit. So what is interesting
for Nesli. You can see if you look
at bullet point number one is that Nestle in
that particular year, we're looking at the year 2024, was able to generate incremental
742 million of cash. So 742 millions of
Swiss francs of cash. And when you look at
Nike, Nike, in fact, even though just
showing you here, has generated $32
billion of net income. The cash position, in fact, went down by $23 billion. How is this possible? So this is what I
have to explain. From an accounting perspective, there are, in fact, two
accounting methods. There is a non cash
accounting method, which is also called
an accrual method, and then there is a
cash accounting method. What is rough cut the difference between the two, and
why is this happening? Let me explain this to you
with a very concrete example. Let's imagine you
are a taxi company. So you drive users of, let's say, CSMAs from
point A to point B. There are two ways how I mean, let's imagine you have
this Mercedes car. There are two ways, in fact, how you can, let's say, account for this car. This car is going
to be an asset. It sits in your balance sheet. But there are two
ways of doing it. One is, in fact, that you're
going to be renting the car, so you lease the car. What happens then
is that there will, technically speaking, be
no difference between the cash flow statement and
the income statement. Why? Because you consider that This car, you will be leasing it during five years,
and every year, you're going to account
for a fifth or 20% of the leasing cost of
the car, rough cut. So it means that your income
statement follows exactly, so the cash flow statement. But what is a little bit more
complicated to understand is when you buy the car,
you're not leasing it. Well, at that moment in time, and let's consider that
we have a five year span. This is what is called the
useful life of an asset. Let's consider that this
luxury car is worth 100,000 euros or US dollars
and has a use for life, so a depreciation
period of five years. Well, if you are buying so now we are not
leasing the car, but if you are buying the
car from a car dealer, you will I mean, before even you
can drive the car and make this car available
to your customers, you will have to pay upfront, you're going to have
a cash outflow of 100,000 euros in year one. And this is, if you
see my mouse moving, this is what I'm showing
you here, in fact. So from a cash flow perspective, you're going to
have in year one, a cash outflow here of 100 K. But from a
revenue perspective, and there are even tax
reasons for this, right? Because when you
invest into a car, you're going to have indeed
an immediate outflow of the total value of the car in year but that car has use for life of five
years, and this is where, in fact, the income statement comes into account because
the income scene will allow you to reflect the use
for life for every asset. And if this car has use
for life of five years, the income statement
you will only incur you will only
charge an expense, which is a fifth, which one divided by the useful life of this car
in the income statement. And this is where you're
going to have a difference, specifically here your one that you're going to have
a higher cash outflow versus a lower non cash expense
in the income statement. But this is very important. Numbers cannot be manipulated. At the end of the day, at the end of the
five years period, the total amount here of 100 K, which has been a cash
outflow in one will be exactly the sum of the five non cash expenses over the years one
to years five, which is 20 K in year
one, 20 K in year two, 20 K in year three, 20 K in year four and -20
K in year five. So the total amount over five
years on non cash expenses will be the exact
amount that you have spent on cash in year one. This is where there is
a difference between the income statement and
the cash flow statement. So it does not mean
that it's problematic. But of course, if the company is destroying systematically
cash year over year, the company is going to
be ending up in trouble, or it has to increase
the sources of capital. Okay? So this is why I tend to look and you're
going to see this when we speak about
intrinsic value. Of people consider
that cash is king, so they're going to look at the capability of the company of transforming revenue not
into non cash income, but into cash generation. So into increases in
cash or cash collection, as it is called as well, because that is key, right? Giving you another
maybe stupid example. If I'm sending you an
invoice of $1 billion and you will never
pay that invoice. I have a huge income statement because let's imagine I would
recognize that revenue. That's now a little
bit accounting, but I would recognize
that revenue. But I will never have
this cash inflow. So at the very end of the day, at a certain moment in time, the accountants or the statutory
auditor will say, Candi, invoice in 2023, this invoice, but you are not
collecting this invoice. So this invoice has, in
fact, to be reverted. So you're going to have
then a negative effect on the net income a
couple of years later. In terms of cash, well, as you have Nava Cora
collected the cash, there is no impact on the
cash flow statement because cash cannot be manipulated,
technically speaking. Okay? So that's something
very important to consider. Now, as I said, cash is king. They're actually, and you're going to practice your
eye with me on this. There's going to be three
types of cash flows. You have the
operating cash flow, you're going to have the
investing cash flow, and you're going to have
the financing cash flow. The ones that are
very important, and this is often very
often referred at, I'm taking an easy shortcut
here as the free cash flow to the firm is the sum of operating cycle
and investing cycle. And let's practice our eye, and then you will see
how I bring this back to the value creation cycle. So I'm taking here the cash
flow statement of Nike. So Nike, you see that the cash flow statement
has three sections, has a first section, which is the operating cash
flow, has a second section, which is the investing cash
flow and the third section, which is a financing cash flow. And you're going to see in the
Nestle one, it's the same. So you're going to
see that Nestle has an operating cash flow, has an investing cash flow and
has a financing cash flow. So typically, operating cash flow of a
normal company has to be positive because if the
company already from its operational cycle cannot generate a positive cash flow, this is already showing that the company is in big trouble. Then typically what
the company does, and let me show you this through a cash circulatory system or value creation cycle that you have seen in a couple
of lectures before. I'm taking here the
example of Nesli, okay? So Nesl has a balance
sheet has 139 1,000 million of Swiss
francs of assets. So Rough cut, they have a balance sheet
that has a size of her 139 billion of Swiss francs. Okay? And when you look at that, you can see that the operating
cash flow was 166 billion. So if you make even
the math between the operating cash flow and
the total amount of assets, you see that Nesli was able to generate rough cut
to 12% profits, cash generation of
its company assets, which is very decent, let's be very honest about it. And then if you remember this
cash circulatory system, the company has three choices with the operating cash flow. Either it re injects money into and making the size
of the company bigger. So this is what Nestle
has been doing. They have reinjected eight or
6 billion into the company, and so this is going to be the investing cash
flow, for example, buying raw materials,
buying a new factory, buying new offices, buying
new cars, buying whatever. Okay, so buying new assets can also be just keeping it as
cash in the company as well, by the way, or buying
securities, for example. Then what the company has as a second choice is reducing the amount of debt
that the company has. What the company did, in fact, is they in this specific year, they have not reduced
the amount of debt. They have actually
increased the amount of debt by rough cut 5 billion. And then that's
flow number four, if I remember, then flow. So we have sorry,
flow number five. So we have flow three, which
is operating cash flow. Then reinjection of money. I'm reinvesting money
into my assets. So that's flow number four. Flow number five is I
decrease, typically the debt. In this case, Nestle
has increased the debt, so they have added 5
billion. We can discuss. We'll see this later
on we speak about the debt to equity ratio
that was good or bad. And then the last flow, which
is the flow number six, that's actually
what is called also the free cash flow to
equity holders or just, let's say, the return
to shareholders. There are two ways of giving a return to shareholders,
paying out dividends. So in that year, Nestle has, in fact, returned 78 billion
from the 16 billion, which is rough cut half of the operating cash
flow to shareholders, and also they have bought
so they have spent cash to buy back shares
from the market. We're going to see this. This is a way how to generate
passive income, as well. The company, and there are some tax conversations
around this. But when the company, in fact, instead of sending you
the money through SHAC, so through cash dividend, they're going to actually buy back shares from the market, and through that, normally, mechanically, the
share price will increase because the amount of outstanding shares is
going to be reduced. You're going to
see this later on, but just mentioned this here. What is also interesting to know is that those three statements, so balance sheet
income statement and cash flow statement,
they're linked together. A lot of people
don't understand. As a lot of people
don't understand, the balance sheet looks
at the creation of wealth since day one or destruction
of wealth since day one, where income and
cash flow you look at the period can be a month, can be a quarter, can be a
semester, can be a year. Right? So there's really a timing
difference between the two. But on top of that, they
are linked together. Why? Because everything has to flow back to
the balance sheet. So everything that happened in the cash flow and
everything that happened in the income statement has somehow to come back into
the balance sheet. Two examples here. And again, if you really want to
go into the details, take the case, the out of
reading financial statements. I really go into
depth, how to read, what type of categories
of assets and debt and equity exist in a
financial statement. This really not the purpose
of doing this now here. For example, if you look at
the cash flow statement, you remember the
cash flow statement is over a certain
period of time. So it was for the year
that ended May 31, 2025 for this is Nike. Nike, you can see that they had at the beginning
of the year when you see here in the blue one, a $98 billion position, and it went down to seven dot four because they destroyed two dot three or they consumed, they burned two dot 3 billion
of the cash position. Well, if you look at
the balance sheet, the same bullet
point number one, you see the variation here. So the cash flow statement, what is happening in terms of cash increase or decreases will have an effect on
the cash position in the balance sheet
as easy as that. The same, for example,
if the company is buying new buildings, this is a little bit more
tricky because there is going to be let's, let's say, movements, if you remember
the thing with the car, that maybe they're
going to be spending 430 million on property
plan and equipment, which is typically
those, let's say, tangible assets, physical assets can be building a car,
those type of things. But so in the balance sheet, you're going to have then
the net movements, right? But here, you see that indeed rough cut that there
was a negative effect, in fact, on the property
plan and equipment buy. So they have less physical
or tangible assets in the balance sheet. And here you see
one of the effects. This is the cash
that they spent, and this is let's
say, the net amount. But you're going to see actually that and it's going to be the same in the
income statement, that all the movements
that you go to have, they will have an impact, in
fact, on the balance sheet. Why? Because the
balance sheet collects everything since
day one in terms of creation of value and destruction of
value of a company. Last thing, again, I don't want to go too
much into the details, but if you're interested,
please do this out of reading financial
statements course. So the main difference to
understand when you look at an IFRS and the USGAP type of financial repots is that IFRS follows a different
order than USA, right? So in USA you're going to have, for example, in the assets, you're going to have
the very highly liquid or even the cash items, and then you're going
to have less liquid and then really the intangible
non physical assets, long term assets at the end. In IFRS, it's the
other way around. You're going to
have, for example, the cash position is going
to be at the bottom, and you start with the
intangible assets. And it's going to be the
same on the liability side of the two sources of capital. In IFRS, you start with equity
and you finish with debt. In UAE it's going to be
the other way around. It's going to be debt
first, and then equity. So without going too
much into the details, but at least I think there
is one thing that is important is that you understand this thing
is that balance sheet, you look at the creation
of wealth since day one of the company
at any moment in time, while the income and
cash flow statement shows you the
performance in terms of non cash profits or cash collection over
a period of time, can be a month, can be
12.5 weeks, can be a year. And those results have to come back into the balance sheet because the balance
sheet collects everything since day
one that the company has created or destroyed
in terms of wealth. I hope that this was useful. And in the last chapter
of the key concepts, I will just briefly explain to you the things that I would
recommend you to look at, which are, for
example, things like investor relations and
annual repos, as well. And then we'll really start
going to the fundamentals. We first, we will
cover the mindset, and then we're going to
go into the fundamentals, then valuation,
and then the mode. Thank you for attention,
talk to you in the next one.
7. Investor relations & annual reports: Mac Investors, welcome to the last lecture of the
Key Concepts chapter. In this lecture, I will
be introducing you to investor relations and also financial
reports and that you understand the
differences between countries and how
that influences also the type of information
updates that you can get from the companies that
you will be investing into. The first thing and so we'll not go into
the details here, but I just want already start a little bit because
the next chapter will be about the mindset. Give you a first tip on
mindset, how you should act. You should act actually as a business owner when you
invest into a company, because as I'm always saying, companies are real businesses
with real management, real employees, real customers. So even if you just
own ten shares, 100 shares, 100,000 shares, or 10 million shares
of a company, you should always consider
yourself as an owner of the company and thinking
like a shareholder, what would be your expectations
from management, in fact? One of the things
that I strongly recommend is that you
reduce yourself to the Iveceration newsletters of the companies that you
are invested into. This is something that
indeed that I do as well. When I'm a shareholder for, let's say, a certain
period of time, that indeed I want to get
automatic updates into my mailbox of everything that
is related to the company. So that's the first thing to do. Then one thing that I also have seen over the
years teaching, let's say, corporate finance, how to invest into stock markets that people do not always understand are the reporting
frequency differences between countries, and through that, the markets and the companies that are
listed on this market. So I'll make it short here without going too
much of the details, but I think it's important
that you understand that. The first thing is, I mean, the country, of course, and I see this in Viln as well, where we have most of our users either having companies
in their watchlist or in their portfolio
is indeed the US. The US market is the
most liquid market compared to other
very big markets. But I want to give
you here an overview of I'll call it like the four, five largest stock
markets across the world. If I speak about countries. I'm going to start
with US, India, and Japan because
they have similar, let's say, reporting
frequencies. So if it is in the US, India or Japan, companies, of course, report once per year their audited
financial statements with a statutory auditor. And so every quarter, they do publish updated
financial statements as well. The difference is
that every quarter, those financial
statements are unaudited. So it's just the
CEO and CFO kind of signing off those
reports, which, of course, brings in a certain
amount of, let's say, inherent risk because
they have not been controlled by
an external party. This is where, of course, we are expecting that CEO and CFO, they are not manipulating
the quarterly statements. On the annual audited one, investors get a supplemental, let's say, guarantee
or safeguard, because statutory
auditors like the KPMGs, Deloit Pricewaterhouse,
et cetera, DOs, they're going to be, in fact, signing off
the accounts as well. US India, Japan is once per year an audited financial
statement, and every quarter, an unaudited financial report, which is going to
be a little bit smaller than the
annual audited one. In the US, you're going
to very often hear the term ten K and ten Q. So ten K, that's
the SEC, let's say, filing standard reports for
annual audited reports, and ten Q will be the
one for quarterly. In Japan, they have
their own names. I cannot speak Japanese, but just to show you a
little bit that, of course, there are differences
how those reports are even identified in the
various countries. The Europe and China is
working differently. Well, kind of. First
of all, of course, they have to publish once per year audited financial reports. There is a matter of trust
in those markets as well. So, indeed, in Europe and China, every year, you're going to
get annual audited report. Of course, and again,
it's going to be the same type of
statutory auditors, the Arns and Youngs the Deloits, Price Waterhouse, et cetera. What is different
between Europe, China versus US India, Japan is that in Europe, you will not get every quarter, an unaudited financial report. You will only get
a sales update. So they're going to tell you
the revenues by geography, by product segments, typically for the first and
the third quarter. And mid year, you're going to have and we're going
to have as investors, we will have a half year
of semesteral unaudited, half year report,
where you're going to have also the financial
statements, but unaudited. In Europe and China, at least for the time
being, we are April 2026. You will not have every quarter, an unaudited financial report. US India and Japan
are requiring this. And there is a small, let's say, nuance that I want to
share with you as well. So you have non US
headquartered companies that are nonetheless listed on the New York Stock Exchange, for example, on the
NASDAQ, that can happen. And these are called FPIs. So foreign companies that
are listed in US markets. And so those companies,
they do have, because they're
listed on US markets, they do have indeed
statutory obligations or statutory reporting
obligations. And so for those who would
be interested, the US SEC, so the Securities and Exchange
Commission is obliging foreign publicly
listed companies in the US that they file once
per year a 20 F report. So it's not a ten K that
they will be finding, but a 20 dash F report. That's the US SEC terminology. But it's not because they're
listed in the US that they will then fall under the obligation of filing an quarterly unaudited
financial report. So the US AEC is okay that they file just once per
year a 20 F report. And, of course, these companies, if it would be European company, they have to comply with the
local European regulations, which is then coming back to a half year unaudited
financial update, so with financial statements, and then a ir quarter and
third quarter sales update. That's a typical type of
rhythm that you will find. So without going too
much into the details, so I want to just add one supplemental layer that
you need to understand, which is related to the fact
that in most, let's say, developed stock markets and countries which have regulators, what is expected on top of
the typical annual report, here see an example
of the first page of a McDonald report
from you remember, that was 2016, the ten Q report for the US, which
is a quarterly one, in the US, you have also,
and you're going to have similar things as well
in other countries. But in the US, it's
called an eight K report. So an eight K report is a
material event that cannot wait until the next
quarterly update to be communicated to
existing shareholders. What are those let's
say, material events? For example, change of CEO, change of board of
director members. There would be, I don't know, buying or selling
subsidiary, for example. So when we speak
about materiality, I will not go into
the A value investing training into the details
of materiality means but there's going to be elements that have to be disclosed. So another one would be they change the
statutory auditor. I mean, that's something
that is important. Why would a company change a statutory auditor
that has to be reported within a
certain delay things like two days after the
event has happened, they have to make
it public speaking about public listed
companies in the US, so they will do what is
called this eight K filing, and there's going to be various
types of items, in fact, that will then identify
what is the nature of the event that is
material that has to be communicated to
the shareholders. You're going to see in other countries going
to be the same. But, of course, here, let's say, the financial markets
regulator and oversight authority will play a role
in structuring the delays, what type of events
have to be reported. So this is why you have always
to think when you invest into countries where you don't know how the
regulator works, you may have different
expectations from what maybe you use if you are investing into
US stock markets. I have to be honest,
for the time being and it has not changed. I have always been investing into US and European markets. I nearly invest into Japanese
markets. China, I did not. For whatever reason, that's just my personal
style of investing. We speak about this
in the mindset and circle of competence. But I have now with nearly 27 years of
investing experience, I have a certain,
let's say, rhythm, how I expect companies
to report how the markets worked specifically
for US and Europe. So just wanted to
share this with you. Um, so yeah, so this is an
example of an eight K form. So you see if you see
my mouse moving here, you see that it's
prefixed eight K report, but this is for
the United States. So depending again
on the geography, you may have different reporting obligations and even formats. So that's basically
what I wanted to share with you in
the key concepts. So I hope that this was giving you a good introduction on how to think about money, inflation, the risk versus return equion is very important. Different styles of
investing and vehicle. First introduction to
financial reports, specifically the
difference between balance sheet income statement
and cash flowstement. And they also the importance of non cash profits
and cash profits. And then just to wrap up the whole chapter that you
understand a little bit, how the rhythm is
and the frequency of companies that are listed on stock markets across
various geographies. So thanks for your attention. And in the next chapter, I will covering, in
fact, the mindset. So what are things that
you have to pay attention to in terms of mindset
as a serious investor? Thank you for attention,
talk to you in the next one.
8. Circle of competence & investment universe: We connect investors. So next chapter, we are discussing very imp, it will be a short
chapter before we go into the fundamentals, the valuation and the
mode, explanations. So making it practical how
to invest into companies. I just want to frame the type of mindset that you need to
have as a serious investor. So the first thing
is, I'll speak about circle of competent
and investment Universe. So one of the things
that I strongly recommend it's also something if you remember what Johnny
Mong and Warren Buffett, I mean, first of all, I've been learning this
from them as well, is that you cannot be
good at everything. I mean, I have a
tech background. I've been managing tech
companies for many years. So I believe I understand
the tech industry. Doesn't mean for
that that I will invest into tech markets. I will explain that
a little bit later. At least, what is
sure is that I will refrain from investing
into industries, markets or verticals or sectors
that I don't understand. Examples for me, and, of course, you have to make
your own choices. I don't understand Pharma. I don't understand biotech. I don't understand banks, and I cannot analyze
their balance sheets. So insurance companies
is the same. So those are, let's
say, businesses. Of course, I mean,
I'm saying this. I don't understand
them to be able to, um own such a company
in my portfolio. Of course, I understand
how a bank works, but I don't understand
the type of assets that they carry
in the balance sheet. For me, at least, and even with the new regulations
that provide a certain substance in
terms of equity that banks have that they
are obliged to have, like the Basel two Basel
three regulations, I still do not feel okay
to invest into banks. Same with insurance companies. I don't know the type
of exposure that they have from a risk perspective
on their product because, I mean, they are not obliged
to report all those things. Pharma, a lot of
people have been even when I was giving classes, so in person, they were
asking, But Pharma, I mean, I mean, we have been exposed
to vaccine, et cetera. I said, Yeah, but I
don't understand. I'm not a biologist. I don't understand this
type of business. I don't know how patterns
work in pharma industry. And I am unable with my
very low knowledge on, let's say, everything that was related to pharma industry. I cannot predict which
company will have the right pattern and which
patent will be successful. So I don't understand
those things. So that's why I just
stay away from that. So you will never
have me invest into biotech or pharma or insurance
or banks, for example. So, and that's something that I would strongly
recommend you that when you think about investing and becoming a business owner by becoming a shareholder of
companies on the stock market, is that you think, would I be able or do I
understand that business? I'm not saying that
this is set in stone. I mean, over the last
27 years, for example, 25 years ago, I didn't
understand the luxury business, but I have been reading a lot. I will speak about
the six habits, which is educating
yourself permanently. But I was absolutely not into the luxury industry
and many times, now I have invested
into luxury companies. So I think what you
have to consider is, do you really understand
the business and the dynamics that actually
structure a specific industry, and segmentation attributes can be growth versus value stocks, can be size of capitalization. Some people are very good in
their circle of competence, investing to small
cap companies versus big cap. Industry and vertical. So I have like food
industry, cars, luxury. Those are sports apparel. Those are the type of
companies, for example, that I invest into, but I don't
invest asset into pharma, biotech, insurance,
banks, those type of things because I don't
understand those businesses. Then geographical markets
in the previous lecture, I was mentioning that at
least for the time being, for the last 27 years now, I have been always invested
into US and European markets. I even never invested into UK markets has been
France, Germany, the Netherlands, Spain, Italy, as well, the US, obviously, but never
Japan, never China. I nearly invested into Japan
a couple of years ago. At the end, I decided to put my money into a market that I understood a
little bit better. And then of course, the
circle of competence includes the instruments,
the asset classes. I'm a pure stock investor, but maybe some of you want to invest into ETFs or into crypto. Even though I have to
be honest as well, I do not consider crypto
to be an investment. I think it's more speculation. But okay, that's my position. So you have to understand
those businesses. And I'm not considering myself a crypto expert on not
even being crypto fluent, and it's going to be the same on Forex on sovereign bonds,
those type of thing. So I believe that I'm a little bit fluent on stock
market investing, and that's what I'm
actually sharing here. And I'm thinking as
a business owner, but I invest into companies where I do
understand their businesses. So it will not be
any type of company. So as I already mentioned, my investment zone is
typically large cap. So I really invest into
very, very big brands. I mean, we are now April 2026. And again, it's not solicitation for you
now to go and buy, but just sharing transparently. I mean, if I just look
back at all the big brands that I have and I have
still in my portfolio, I mean, if I speak now what
I have in my portfolio, you're going to have
things like Louis Vuitan, Porsche Ferrari,
Kering, which are the owners of Gucci Valencia
Alexana McQueen, Um, I would love to
invest into Hermes, for example, I had Richmond, luxury group who owned Van
Cleve and Arb and Carter, for example, and a lot
of luxury men's watches. I sold them with a very nice profit after a couple of months. So I had Mercedes. My children have BMW
in their portfolio. Those are businesses that we are more or less able to understand. Food industry, I have been always invested
into food industry. I have had Mondes,
Proc Dan Gamble, Nestle, Danon,
Unilever, as well. So all those, if it
is food or let's say, consumer products and
household products, those are easy to understand Um, because I'm always
saying people, they have to eat that whatever, even if COVID happens, people will have to eat,
so they will be able to always continue
selling their products, as long as they
don't mess it up, I speak about those companies. So that's a little bit the type of companies I invest into, but that's my
investment Universe, my circle of competence. You have to decide
what is yours. Why do I invest into these into, let's say, strong brands? And I look, I mean, if you would look
at Vin, we do have, so the top hundred of
the global brands for the last 13 years as data
points available in Vine. So one of the things
that I like, in fact, about investing to
strong brands, well, first of all, it has
never wiped me out. That's the first thing. But it has been proven that strong brands are actually
overperforming markets, including SP 500 performance. And that's one of the
reasons why I have always been invested
into those companies. And as I said already earlier, I cannot perfectly
time the market. So if I look, for example, now at Porsche, which is a big position I have
in my portfolio, I'm negative on that
position for the time being, but I will be patient, and during my patience, I will be rewarded with cash
dividends from the company. And there are other companies. For example, I was
mentioning Richmond that I think it was like 2017. I
don't remember exactly. I bought the company
at 57 Swiss Francs. So Richmond are the
owners of Van Cleve and Archel and Cartier and
other men's luxury watches. And six months later, I sold them at 93 Swiss Francs plus dividends that I received over those six months period. I had the same with
Amba, for example. That's a brewer or brewing
distributor in Brazil. Even with my kids, we bought
the company at one dot nine, and a couple of months later, the company was at two dot six. I will explain you how
to see those things. And again, you will have
to make your choices, but those are the type of
things that it happens. And it happens that and
we'll speak about this in this chapter that markets
become actually emotional. But I'm just telling
you, the first thing in the right mindset as a serious investor is that you develop your
circle of competence. What are the attributes that you will be investing into
in terms of companies? Just to finish and to wrap
up here, a lot of people, in fact, ask me why I don't
invest into tech companies? Because I do have
a tech background. It's because for
me, tech companies, if I look at investing, and as even myself, I cannot perfectly
time the market, it has happened to me that
I have been invested for nine years in a company
or another company, I have been invested
for five years. And then, of course, sometimes
it happens that there is a market turnaround and the market has been
emotional about a company, and after six months, I'm
ready exiting the company. But I believe that
tech companies, the future is so uncertain
related to things like, for example, quantum computing. And on AI, it's
another conversation. If you would follow
me on social media, you would understand a little
bit my current position, which is the reason
why I do have SAP. I believe that an
ERP system like SAP will not be disrupted by AI. But maybe other
consumer tech products, like indeed Office RA 65, they're going to be
definitely impacted by AI. So I think that
sometimes people, they just mix everything up. But okay, that's just
my position on things. So, but that's the reason why
I don't invest into tech. I do understand
the tech business. I've been more than
20 years working in the tech industry, and even now, I mean, together with Adriana, we have created Ville,
and that's a Fin tech. But still, I don't invest
into tech companies. I invest into more
traditional things, and I'll try always to have very strong brands in my
portfolio whenever I can. And then one thing that
I tend to consider that a lot of people fail to
consider is the following. If you are just investing
into growth stocks, the only way that
you will be able to make money and extract money to reinvest that money is when you will be
selling those stocks, which means that there is
a timing element to this. What I try to do, and this is what
I'm trying to share here in this training is that me being a value investor is that I just look
at Warren Buffet. Warren Buffett has 400 million of Coca Cola shares
since decades. He is not selling that position. Why? Because he's getting
an incredible amount of cash dividends from
Coca Cola every year. So why would he
sell this, right? So that's one of the
things where a lot of people don't understand
or misunderstand that making money on
stock markets is not just about buying and then
trying to sell higher. There is also a way to cover, in fact, let's say, your annual returns
by having a mix of, okay, sometimes you
will have to sell when the market will
overvalue the company. But it's also very
interesting to earn cash dividends and to
build up this snowball effect. And from the cash dividends,
you're going to be, if you don't need the money reinvesting those
cash dividends and actually Snowball will become bigger and bigger and
bigger over the years. And that's actually one of the things that
a lot of people underestimate is the
compounding capabilities of dividends that
are reinvested. And I will teach you
in the fundamentals how to look at dividends, how to look at healthy
dividends as well, because there are some elements that you have to look into. But I just want to keep you I want you to
keep those two things in mind that the way of making money as a value investor,
there are two ways. One is, of course,
like growth investors, you buy cheap and you sell when the company
is overvalued, and I will teach
you how at least I look at undervaluation
of companies. But the second one that
is very often forgotten, specifically today, Um, is the power of compounding
of cash dividends. Well, so that's for the first
lecture in the mindset. In the next one, I will cover the five co habits that you need to have as
a serious investor. Thank you for your attention.
9. The 6 core habits: Mac Investors next lecture
in the mindset chapter. So I will share with you
the five core habits that serious investor needs to carry along his or her
investment journey. So if I summarize the main habits that a serious
investor needs to have, it's those five on top of
what I already just shared, which is the circle
of competence. So understanding in
which businesses and industries maybe or type of companies you're
investing into. The first one is courage. I mean, it's very clear when I started more than 25 years ago, that it really stressed me
pushing on this bottom to say, I go to transfer, whatever, at that time, 10,000, $2,000 of my cash or my savings account into a real company and knowing what would
happen with that money. And even as a young, let's say, worker, of course, that
was a real stress. But what I really
recommend is that as a high performance
sports athlete that you start with money that even you would be willing to accept
to completely lose. So you should not be
depending on that money. And not all my recommendation
is don't play around with, let's say, fake or
virtual portfolios. Play with here, I'm going
to use the term play, invest into real companies. But in order to
develop your muscle, invest first with amounts that
you feel comfortable with. So don't invest your
whole family wealth if you have never invested
into stock market. So the question I often get is, what is the minimum
that I should invest? And I would say, Well, I believe that because
you're going to have fees, depending on the type of broker that you're
going to choose, you're going to have brokers
that don't charge you a lot, where maybe a $5,000 transaction will just
cost you, let's say, $80. But if you're just
investing $200 and you have $80 of fees, I mean, in order to um
at least break even, you need the let's say
your investment to grow to $280 because you
need to cover the cost, and you're going to have
costs also for selling this. So probably a $200
investment with $80 of fees, you will need at least your $200 to double just
to be break even. So what I tend to recommend to people
who have never started is try at least to start
with maybe 2000 $3,000. Again, it has to be a small
portion of your wealth. And invest and I will share
with you teach you how to invest afterwards when we speak about fundamentals,
valuation and mode, but that the cost, the fees that your broker, your bank will take on a $2,000 investment or 2000 your
investment will be below 100. So it means that maybe you maybe even the cash dividends
after one year already, in fact, covering the fees
when you bought those shares. That's the first
thing, but really is you need to have courage
and start investing into real and putting real money into the stock market if you
feel comfortable with that. So that's the first thing. Second thing is
being humble, right? So I always say that
you should never, and it happened to me
that I became arrogant. It's now nearly, let's
say, 15 years ago, where I felt that I could
be smarter than the market. And I didn't respect one of my fundamental roots because I became arrogant and I went
into my comfort zone. It's really important that you
are humble always when you invest and specifically
that you remain humble when you are really
having very nice performances. Examples that I gave you, I bought Richeon 57 Swiss Franc, sold 93 Swiss Francs
after six months. The same with Ambev
Ambev I bought it, I think 19, something like this. I sold it 260 after a
couple of months, right? So sometimes you're
going to have humbling experiences as
well, where, for example, I had bought telephonica
and I had to do cost averaging during
nine years after nine years, really being able to, of course, I was
receiving dividends, but being able to hit a profit that was really
nice, I have to say. So always be humble when you invest real
money into stock market. So don't become aggressive, don't become arrogant.
That's the second thing. The third thing, I mean, if there would be
one I would really recommend you to keep in mind is this third one is
avoid borrowing money, which means avoid taking
up debt from the bank, for example, or from the broker to invest into stock markets. Why? Because and I have had investors and
students who came to me, even on this platform
like demi and Skillshare, who said, I lost my shirt
because I've been speculating. On top of that, I
raised money through debt in order to accelerate
or to compensate for losses. And I have been wiped out. So that's really something, and maybe it will
take you longer. I have to be very honest. It will take you longer
to build up your wealth, but at least it's just your money and not
somebody else's money. So pay attention
to those things, and I would strongly
recommend that you never raise debt in order
to grow your wealth. And if you're just able
to add $500 whatever, every quarter into stock market, well, so shall be it right. But just pay attention
that you are not being wiped out
because as I said, you cannot perfectly
time the market. And if you're raising debt, maybe the stock
price will go down, and you're going to have a
call of the bank that will oblige you to sell shares
at the wrong moment. So that's the type of thing
that you want to avoid that the bank is making what
is called a margin call. Discipline is the fourth
one. Very important. So being disciplined is that you need to have your
investment process, and part of the
investment process is knowing what is your circle
of competence amongst others, and then I will share
my investment process with fundamentals
valuation and mode. And I think that sticking
to a discipline process will give you a frame that
allows you to perform well, like a sports athlete and become more and
more, let's say, fluent and efficient in the whole investment
thinking process as well. So, um, you'll also avoid that you start speculating because it's going
to be real money. And, of course, without depth, that's really my
strong recommendation. Always remain humble but
also remain disciplined. So have a repeatable process
that you go through without any emotions and trying
to be factual because I don't I don't have the time
to speak about biases, but humans tend to become biased at a certain
amount in time. And this is where the repeatable
process will help you to at least reduce this type
of biases. And patients. So don't go for the quick buck, as they say in the
US, or don't think that it will always be easy. So as I told you,
I had sometimes, let's say, opportunities where after six months I
doubled the wealth, and I had let's say, the longest holding I had was Telephona Spanish Telco Company, where I sticked nine
years with this company. Second longest was Mercedes, where I was invested
with them for six years, for example, but they were
paying out nice dividends. Then I had other ones like BSF, which is the largest
chemical industry or company industry
in the world. Also there, I think I was at least four or five
years with them. So yeah, so if you
think that investing tomorrow will allow
you to double that amount in a week later, it will be luck, right? So always keep in mind that
you will have to be patient. And when I say patient is consider that it takes the
market sometimes two, three, four years until, I will
give you the data point, so that until the market
actually comes back. So this is something that I learned also from Charlie Manga, and I have to say when COVID happened a
couple of years ago, we had the Russian
Ukraine situation. We have now the
geopolitical situation between US Israel and Iran, and I will not go into
geopolitics here. Right? I'm a very
peaceful person. So, of course, I
don't like I mean, there are wars across the
world, but unfortunately, it looks like we cannot
avoid those type of things. The point is that geopolitics
will also drive markets. And I mean, we are April 2026. It's just a couple
of days ago that the ceasefire on
the Strait of Ormos has been announced
between Iran and the US. And, of course, markets,
so first of all, markets went down when the first let's say bombs were
striking Tehran. And then, with that ceasefire announcement,
a couple of days ago, markets went crazy up
with plus seven plus 8% on many stocks for within a day. So so one of the things that you have to learn is
that if you're not willing because you will not be able to time the
market perfectly, if you're not willing to
see your portfolio go down by 50%, stay away from it. I think, honestly, the mistake
that a lot of people do, and this is even
sometimes taught in courses is what is
called a stop loss, is that sometimes
because people have not analyzed the
fundamentals of the company, they don't understand
the business. They just see the
price going down by -20% because obviously, nobody can time
perfectly the market. Otherwise, we would
have already a lot of people who would be able
to be perfect investors. Is that people then exit, but people are exiting, in fact, too early, and sometimes they also so
they're exiting on losses, and they're also exiting
on gains too early. And I have to even
say even on gains, it happened to me
as well, in fact. So so you have to consider that if you become
a stock market investor, and you understand the business that you're investing into. You think as a business
owner, without debt, Investing small
pieces of your wealth to build up your muscle
that if you are not willing to see the
market because there is a geopolitical conversation that just happened that
you cannot control, but the company that you have invested into has not changed, and the market is going
down by 10%, 20%. And this makes you nervous, and then you would have to sell. Well, that's probably a mistake, and you should then not invest
into stock markets, right? Because I'm always saying, if there is geopolitical situation and the market is overly reacting and stock
price goes down by 20%. If the fundamentals, I
will teach you this. If the fundamentals
have not changed, it's maybe an opportunity to buy a fantastic company
at a very cheap price. But you need to be able to
screen the fundamentals, and that's what I'm
trying to share here with you in this training. And this is where Mr.
Market comes into play. And this was a persona so
it's a fictive persona that Benjamin Graham
created in his book in 1949 called
Intelligent Investor. So what Ben Graham was speaking about or when he
was referring to Mr. Market, he was saying that
basically Mr. Market has traits which are being very
emotional, not factual. One day, Mr. Market
is super excited. He's going to give you
companies at very high prices. And the day after
maybe because of geopolitics and
nuclear accidents, COVID virus, that suddenly
the whole world collapses, and markets then go
down by minus ten -20%. So you will have to deal with
Mr. Market and Mr. Market, and story has
repeated many times. I'm going to give you the stats. So this is where we speak
about bull and bear markets. And I'm just taking here the SP 500 as an average measure. So when I look at Bull
and bear markets, you have here until June 2025 a statistic where you see
that across the last, let's say, even century, we have seen bull
and bear markets. What is a bull market?
The market is, in fact, growing a lot. And you see that bull market
periods, they depends. They may last for
a couple of years. So of course, we
had seen between 19 Rough cut 2087 and the year 2000 before the
Internet bubble collapsed. We had a bull run of
12 years with plus 841% in average on
the SSP 500 Index. And what are bear markets? So bear markets are, in fact, the market comes down
by more than 20%. And we have regularly bear
markets. This happens. And again, now, a
couple of days ago with the geopolitical situation that nobody was expecting
between the US, Israel and Iran and
the Middle East, we have had also
market correction. So what is a market
correction is at least a -10%
correction of the market, and a bear market is -20%. So if you think that
as I very often hear, this time is different. So in the sense that, yeah, the market is collapsing, it will not come back or
the other way around, that the market is
growing like crazy and it will not collapse this
time. That's wrong. History has taught us and
has told us that there's going to be always at a certain
amount of time let's say, an event, something
that will happen that will push markets up
and push markets down. So if you are not willing to deal with this and you will not be able to
perfectly time the market, you don't invest
into stock markets. But this is where
the opportunity lies when everybody is selling, this is actually where
I tried to buy I did it a couple of weeks ago when
just to set the context, anthropic, so the AI company in the US had been
announcing something. So everybody became
super nervous about, let's say, tech
related companies. And I actually bought into
some companies where it was total nonsense why the market was pushing down the
value of the companies. And very, very quickly, after just a week later, I was already making plus 20% on some purchases because what
the market was reacting on is they were not understanding
what anthropic and their AI component was versus than punishing some companies that had nothing to do with, let's say, AI related impacts that we are
seeing currently. So you will always have
bull and bear markets. You need to be prepared for
it. One of the things that I do as well in order to be
always prepared for it, I always have more or less 10% of my wealth that
is ready in cash. So so that if at a certain time, there is a market
correction or bear market happening that if the company fundamentals
have not changed, that, in fact, then I will be buying more when
everybody is selling. So that's a little bit
of contrary mindset that I do have sometimes. And then I will
add the six habit. The six habit is what the
six habit is being able to read and grow your education and your knowledge about things. For example, Warren Buffett, he always mentioned
that he was spending 80% of his time reading,
reading financial reports. One of the things that
I learned as well is that I tried to read facts, not opinions because opinions, well, nobody and there's something I learned
from Warren Buffett. Nobody knows exactly what
who's right or wrong, and you're going to hear
1,000 different opinions. I think where it is
important is to read facts, facts about an industry, facts about a company, and to build up
your own mindsets, knowledge, and muscle about
an industry or a company. That's definitely
something. Even me personally, every quarter, I read financial reports of the companies I
have invested into. This trains my muscle as well. I mean, you may see behind
here in the video I have been reading tons and tons of
books over the last 27 years. I'm a bookworm, I
have to be honest. But this actually has
always helped me to develop my muscle also as a value investor and even as a business manager
of companies. One of the videos I would recommend you to
watch is this video. I've put you the link on
YouTube video from Peter Lynch where and I've put you
even the minutes between minutes 1504 and 18 50, he's explaining the
typical, let's say, emotional things and
mistakes that people do. And I think it's very relevant. Still nearly, it's
more than 30 years after I still see
that people, indeed, they invest into companies
because they have been reading an opinion of somebody in the newspaper or their
neighbor or their, I don't know, the postman, with all respect for postmen, was saying, Did you invest
into Nvidia, for example? And they have no clue. They don't understand
the business, but as everybody is talking about it, they think
that they should also. So what is called the
fear of missing out to form or they should then invest into that company as well. Not understanding the
fundamentals of the company, not understanding the
industry of the company. I'm not saying that Invidia
is a bad investment. I'm just saying that if
you invest into Invidia, which is currently one
of the most hot stocks, you need to understand why
you would invest today. Do you understand the business? Do you understand the
dynamics and what could actually completely kill the
business of that company? So that's a little
bit the mindset that Peter Lynch is
explaining in this video. I was at the New York
Economic circle, if I remember, well in 1994. So I strongly recommend
that you watch this video. It's a very nice video and specifically the
parts 1504-1850. Right. So just wanted to
tell you that I mean, I have been writing this course. The first version of this
course was written in 2019, had been published August 2020. And at that time, I
was speaking about the same things that bull
and bear markets happen. And even after the
first publication of this course, it
happened again. Look at 2020. So Peter Lynch is right
that story repeats. And in average, you're going to have a market correction
every two years, and you're going
to have average, a bull market every four years, sorry, a bear market
every four years. This will happen in average, but nobody can
exactly predict it. Even the US Federal Reserve,
if you would listen to them, they're going to say
we may be able to predict interest rates
three months in advance, but beyond that, and I tell you, they have thousands
of mathematicians. Beyond that, they cannot predict how interest rates
will look like in six, 12 months in advance, because there are elements that
they don't control. So those are these external
systemic events that they cannot know who is going to push a button
or what will happen. 2020, we had COVID. Look at what happens.
So everybody panicked, and you had a first wave, a second wave, a third wave, a fourth wave of people
selling, selling, selling, selling to
cover their losses. And actually, and
I remember because I was discussing
this with my wife, I did the other way around. So I waited for the second, third wave because it
always goes in waves, a first, a second,
and then a third. So I cannot perfectly predict
the bottom, I promise you. But at least, after the second, maybe after the second wave, I do a first purchase.
Then I wait. Then maybe if there is a
third wave, I do, again, cost averaging, but it happened during COVID.
Let's be very honest. 2022 with the Russian Ukraine
situation happened again. Now with the
geopolitical situation in Middle East happens again. So, and the AI conversations, the private credit
conversation in the US, there's
going to be events. You don't know where
they will come from, but there will be events
that will happen that will make Mr. Market, as Ben Graham was mentioning it, will make Mr. Market
very depressive. And that's something that
you have to factor in. I believe, honestly, and after 27 years that with
the right attitude, value investing is, in fact, something pretty
simple and easy, but you need to have that frame, that mindset as a business
owner when you invest into these companies
with the attribute that I was telling you in the mindset that
you need to have. It is, first of all, the
circle of competence, but then courage, being humble, no leverage, so no debt. So being able to read and to
develop your knowledge in the companies that you
are investing into or at least the markets and industries that you're
investing into. That thanks for your attention. In the next chapter, we will in fact be going
now into the first pillar, which is a fundamental pillar, how to analyze how companies, in fact, do are they
somehow solid and I will teach you like the
main elements related to fundamental screening
before then we go into variation and mode. Thank you for your attention. Talk to you in the next one.
10. Reliability of Financials: Mac Investors, welcome
to this lecture. This lecture will
be the start of the chapter around
fundamental screens. So just to set the
scene where we stand, so we'll discuss the key
concepts and money fundamentals. I shared with you over, I think, two, three lectures,
the investor mindset, and now we are really
going to the value investing method that I've been applying for
the last 27 years. I'll start with the
fundamental screen. So this is the first
of the three pillars that I will be sharing
with you and showing how I apply what are
fundamental screens and how I apply them to my
value investing process. What we're going to be
seeing just very quickly, I'll start with a new one. We are April 2026. I'm re recording again. I think it's the fourth time
I'm recording this course. Speaking about reliability of financial, starting with that. But before doing that,
so you're going to see that we're going to be
looking at reliability. I'll be discussing
Blue Chip companies, how to look at
earnings consistency, solvency and financial strength
of a company, as well. And we'll already look at
relative valuation methods as a first fundamental screen to be able to separate good
from bad companies. So let's go into it. And just one last
reminder in Vinla. So again, this course is
really about value investing. It's not about promoting VN, but we created Vinla for us to make our investment
process much faster. You're going to have actually,
we will be following, if I go back here, in fact, to level one, level
two, level three. So level one being
fundamental screens, level two, intrinsic
evaluation level three mode. You see here, in fact, if
you see my mouse moving, I'm exactly and we have
created in exactly according to the method that I'm applying here in this training. So you're going to see
that the fundamental screens will be immediately available in the
fundamental screen inside Ville with
traffic lights. You can send even a
prompt to the AI engine, and actually, you don't even
have to write the prompt. The AI engine will write
the prompt for you and here see what the prompt is
being sent the AI engine, which says perform a
fundamental analysis of the company I have selected. So again, just by clicking, it interacts with AI. And then even what you have
now since April thousand 26, you even have a side by side comparison
between companies. So you can just select
a couple of companies, and you're going to
see side by side. You see they all have
traffic lights very easy, in my opinion, at least for me as an investor, to compare. Here the example
is I'm comparing ou Vuitan carrying with
Hermes and Burberry. So four luxury companies that are listed on stock exchanges, three in Paris and one
in London, in fact. Let's go into reliability
of financials. So the very first thing, and that's actually something
that we decided to change, even in Vinla because I will speak about
the Danish Ascore, which is a pretty
advanced, I would say. And when I'm giving even
public conferences, I tend to ask my audience, who has ever heard about
the Benish M score? And I ask the audience
to raise the hand. And I promise you,
more than 95%, even in finance, professional
audiences have never heard about the Benish MScore. The very first thing that I
want to teach you is that before you even think about
investing into a company, the very first thing, the very first check
that you have to do is checking if there are any signals of
earnings manipulation, meaning turning it
the other way around, do the financials look
reliable, yes or no? If they don't look
reliable, well, maybe there are so many
companies on the market, maybe you better stay
away from that company. Instead of becoming
a shell of them. Again, I'm not just it's my
touch not to give an adviser, but just to share
with you honestly how I do look at companies. And we have actually added into Vet the reliability
of financials, and this lecture is a new one. I was not teaching this before, but we decided in a
couple of months that we want to educate
all our investors, all our students that the
first thing they have to look into is checking the
reliability of financials. So I was mentioning
the Benish MScore. Where does this term come from? And actually, this
is Professor Benish. He is a professor of accounting
at Indiana University. And when he was teaching
at Duke University, he found so he was teaching
accounting at MBA classes. And he found that it was
very difficult to engage MBA students in accounting
matters and accounting topics. But still, and that's
something that I learned from Warren Buffett, accounting is the
vocabulary of investor, so you need to be a
minimum fluent in accounting terms if you want to become a
serious investor. So what he did, he created
like a proxy, like a shortcut. When I use the term proxy,
I mean a shortcut by that, related to, let's say, compounding or
calculating a couple of metrics that would allow to give in a very
easy way a metric to his MBA students in accounting to detect if there would be
signals of earnings manipulation, yes or no. And this basically
where the whole idea of the Benish score M stands
for manipulation came from. So I have a specific
course on the Benj score. We're not go into
the details of it, but this is the formula
of the Benish Score. And again, I mean,
in the course, I have a specific
course on Benish score, let's say, variables where
I really go deep into it. So if you want to know a little bit how
the Benish score works, so those eight variables that rely on
financial statements. So it relies on
the balance sheet. It relies on the cash flow statement on the
income statement. Based on those three
financial reports, the formula calculates, in fact, score, the famous Benish score. And if the score is below
minus 178, like, for example, a minus two minus two
at five, minus three, the company is in the safe zone, and the calculation is done over a year over
year calculation. So it's comparing, for example, 2025 versus 2024
financial reports. If the value is between
zero and minus 178, the company is in
the scrutiny zone. So that means that you have if you're really interested to
invest into that company, you need to understand where
the signals are coming from. I will show you
how we really try to make this very
efficient also in Vinla. And then if it is above zero, there is a high likelihood of manipulation of the
financials of the company, which is, for me, a red signal. So still, if you
wanted to invest into a company that has a
BanisEScore above zero, so like plus 05 or one, you really should be good actually at understanding what is going on
with the company. So that requires a minimum
accounting understanding. Why is Benish Emsco interesting? And again, I'm not going
to the details of it, but some of you may recall the Enron scandal
a couple of years ago, so the company has
been wiped out, including Arthur Anderson, which was the statutory auditor. And in fact, there was an
interesting study done by the accounting department
of Acra in Ghana, where they were showing, and I'm giving you
the reference. They were showing that, in fact, looking at the Benish
AMSCOe would have allowed to see that something
was going on at Enron. So, as I'm always saying
the Beni MSce is a proxy. It doesn't give you a proof that there is earnings
manipulation, but at least gives you signals that something is not correct. To make it simple, in the
fundamentals, in Winley, that's the very first thing
that you have to look into is check the reliability
of the financials. And here you see for
hiatots and again, I'm not saying that hiottas are manipulating the earnings. Just based on the Benish AM
score, the current earnings. So based on the annual report 2025 and comparing it with
the annual report 2024, it's actually flagging red. So it has a Benish
AM score of 072. So if I come back here, 072 is in the high likelihood
of manipulation. It's not a proof, but
it's a likelihood. What we did further in inle and this is I honestly believe, and I'm saying there's
a lot of humility. This is unique. What
we did is we have a specific forensic
accounting screen where you're going to see
the eight sub variables. I don't want to go
into the details of it because this is
pretty advanced. Do the Benish AM
score training if you really want to understand what
those eight variables are, the minimum that you have to
do as if you are a beginner or intermediate investor is just check the aggregated
Benish score. So this variable.
If this is green, I think you can continue
then analyzing the company. But if it is flagging red, like, for example, iota teles, you will need to look
at the eight values or the eight variables that create the aggregated
Benish score. And what you can see, in fact, here on the so we have
separated between the variables that are real direct earnings
manipulation signals, not approved but signals, and other ones which
are more what I call earnings
management variables. So with a traffic glass, you will immediately see
where the issues are, then if you're interested in analyzing deeper the company, it will allow you, in
fact, to go deeper. So here, for example,
if you would be interested investing
into hyatt hotels, currently, we are April 2026, based on the latest
annual report of 2025, you would need to
look at the accruals versus total assets
and why, in fact, the earnings are relying
a lot on accruals, which means that
that is cash that has not been collected yet, which is a way of
manipulating earnings. It's not approved, but
it's a way of doing it. That's again what I
wanted to share with you on reliability
of financials, giving you a first insight that the very first thing
rule before even thinking about putting your
money into a company is, are the earnings
reliable yes or no, or are there any signals of potential earnings
manipulation? If that is the
case, you will have to investigate or you just walk away and you go to
another company where maybe the Benish
AMScOe is green. Hope that this was useful. Again, it's an intro lecture to forensic accounting
with the Benish AMSCOe. I cannot, and I don't want to
go into the details of it, but just as a
fundamental screen, check the reliability
of financials. With that, thanks
for your attention, talk to you in the next one.
11. Blue Chip Companies: Mac Investors, welcome
to a new lecture. So we are still in
Chapter number three, speaking about the
fundamental screens. I've introduced a new lecture, just a couple the
previous lecture, which is reliability
of financials, which is something new that was not existing
in this training. So now I'm re recording
it by April thousand 26. And the next fundamental screen, I'm going to share again here, my method is looking at
Blue Chip Companies. And I will also justify
why me as an investor, actually this is one of
my fundamental screens. First of all, what is
a Blue Chip company? Maybe you have never heard about what a Blue Chip company is. So Blue Chip, the
Blue Chip term comes, in fact, from the poker, from the card game, where Blue Chips are
considered to be the chips that have the
highest value as easy as that. And in the investing,
let's say, vocabulary, we consider that Blue Chip Companies are
the companies that are the highest or the companies that are
carrying the highest value. So there's and you will
see what it means, in fact, in terms
of highest value. So today we're April 2026, probably Nvidia, for example, will be considered a
Blue Chip company. I have no doubt about that. You may have companies like Prop Dan Gamble that will be considered the
Blue Chip company, Google, so Alphabet, because that's the name of
the company. Meta platform. So those are
probably, let's say, common Blue Chip companies
that you would hear also, that would be covered a
lot also in the press. What is the reason why I invest
into Blue Chip Companies? So this is all about modes, in fact, and I will speak about
modes and what modes are, but just to explain to you
the reason and giving you a quantitative element why I do invest into
Blue Chip Companies. So it has been proven, and Interbrand has also
a graph about this. Brand Z is confirming the same that the largest
or let's say, the most known from
a brand perspective, companies in the world, if you are investing into them, you have higher chances of being able to
overperform the market. It's as easy as that, and they are tangible elements. So when people don't want
to become stock pickers, what they do, they sometimes
invest into an MSCI, which is an ETF with around, I think it's 600 stocks that represents the overall biggest companies across the world. Some people invest into SP 500. That's also something
that Warren Buffett said, If you're not into investing
into specific companies, just invest into the SP 500 ETF, and probably you're going to be performing in
a pretty good way. And remember that the
SP 500 has generated a little bit more than
10% for the last decade. But again, time is something that you have to
consider but I have been discussing already a couple
of lectures ago that that performance is only applicable if you time
the market perfectly, but you will never be able to
time the market perfectly. Please remember that.
Brand Z is, in fact, in brand management company, so they assess the largest
brands in the world. Interbrand is doing the same. We do have Interbrand information
in a in Vinla as well. So it has been
shown that I mean, brand investing into
very big brands will not protect you from financial crisis consequences or from even the consequence
of the pandemic. But the recovery time will be this has been proven and has been shorter for strong
companies and also the downturn, so how much you lost in terms of value if you had
invested and there is a crisis happening
is going to be smaller compared to maybe less
strong companies. So just to give you an element, so quantitative element, why I invest into
Blue Chip company? So I was speaking about mode, and how can you determine that a company is a
Blue Chip company. So normally Blue Chip Companies
can be easily observed. And I'm not saying that
any Blue Chip company is the right company
to invest into. So again, that's going to be something that
you're going to hear me being repeating
this many times. It's not because a company is a Blue Chip company
that first of all, it is cheap and that the
earnings are not manipulated. You may have Blue
Chip Companies where the earnings are
shaky, in fact, right? So again, I'm just
telling you that this is a little bit my
investment universe. I tend only to look at
Blue Chip Companies. So Blue Chip Companies
can be easily observed. First things first
is, for example, just look and speak with
your friends and family. What are the drinks or
the food that they love? What type of smartphones? I mean, when I'm teaching
at business school, I've been teaching at ASCA, which is one of the best French
business schools as well, and also University
of Luxembourg. When I discuss with my
students, for example, about the switching costs, which is a way how you
can observe modes, and you can also observe
Blue Chip Companies. So I'm always taking example. I have an iPhone, so
this is my iPhone. I tell my students, Okay,
you have an iPhone, as well. How much do I need to pay
you to switch to Android? And I'm pushing them to put
me a price tag next to that. And there's going to be some students who
are going to say, Yeah, maybe 4,000 euros, they're going to be switching
from my iPhone to Android, but other ones are locked in in the ecosystem of
Apple, which is my case. And even for 10,000, I would not switch to
Android, maybe for 100,000. So the switching cost would be very high if a competitor would need to buy market share
from Apple, for example. Those are ways you can, in fact, observe beyond blue
chips that you can, in fact, even observe modes. And I will speak about modes
in a couple of seconds. For example, ask,
maybe you have kids, what type of brands do
they love to purchase? Maybe they love to
purchase Adidas, or they love to purchase vans, or they love to
purchase Zara clothes. I have no clue, but those are the type holly
ster, for example. Those are the type
of things where you go it's easy to
observe this, right? The type of pasta that you
are buying all the time. If you are a pasta
lover, you probably uh, not every brand is a
good brand for you. So you will potentially be buying always the same brand
because you like the brand, you expect certain results
from buying that product, and probably you less sensitive to price
fluctuations on the product. So that's the type of thing. I'm always taking
the last example of shaving so I
shave with Gillette, which is Proc Dan Gamble. I even owned Gillette, also Proc Dan Gamble in my
portfolio cup just a couple of weeks ago. And that's the same. So I tried Wilkinson Sword, was unhappy with the results. So now I just test it once, and since I mean, I'm
shaving what now? 35 years, at least. And I never went back
to Wilkinson Sword, and I would not do it again. So I stick to Gillette,
whatever the price is. So that's something that
is easily observable. If somebody would ask me, which brand do you use to shave, I would say, I shave with
Gillette, and that's it. And they would ask me, what's the cost of, for example, five shaves of Gilatte I would say,
Honestly, I don't know, and I don't care because
I just want that brand, and I'm willing to pay
any price just to have that convenience of being able to shave well with Gillette. With mineral water, for example, when we were in Luxembourg
before I moved to Spain, we had a specific brand of
water that we were buying, which was Ivan, which so
it's part of Danuno company. Now in Spain, we have
one, which is fond Vella. We tried various brands, but we want to buy font
Valla and that's it. And we don't look even
at the price of it. So those are so Blue
Chip Companies are easily observable
and very often, if they're not messing it up, they're going to carry
elements of modes. And what is a mode, in fact? So a mode is and this is you can run these questions
through your friends or your famili like how resistant
will they be to change? And this is an
example I was telling you about my students at University of
Luxembourg and also at ESCA School of Management, where I'm asking them, how much do I need
to pay you that you switch from Apple to Android? And of course, I mean, it will depend from
every student. That's basically the mode.
So what is the mode? That's why I've put this
Japanese castle here. A moat is the water that
surrounds a castle. The wider the mode, the more difficult it is
to attack the castle. That's the whole principle
that Warren Buffett has been teaching me how to
look at modes, right? And if you have modes can
come from cost advantages, if you look at Ryanair
EasyJet, they have a mode, but it's a mode on
being extremely efficient on turning
around their assets, or turning around the airplanes much faster than
other companies. They are cheaper and they
have very clear options. Probably even they are more fuel efficient than other companies. And they address a specific
segment of customers, which maybe other
companies they try to mix between first
class business class, economy plus and economy, which EasyJet and Rana
probably does not have. I'm pretty sure that
they don't have Frost class in business class. So modes are observable, right? And very often, when the
modes are observable, you're going to have
the customers of those companies that will be resistant switching
to other companies. That's something that is
very, very, very observable. This is something
that allows actually those companies to
charge higher prices, which means that their profitability is
kind of protected. And if there is inflation,
they're going to charge even higher prices to their customers because
they know that customers, and I'm looking at Procter
& Gamble, Gillette, Gillette if the Gillette
shaves increased by 7% and I'm paying I'm just
saying now, let's say, maybe ten euros for five shaves, and now it becomes ten dot three I mean, I don't care
about this or 107. I don't care. I will be
paying for this, right? And I'm willing to pay for
this because I want to have my expected results from shaving with Gillette and not
going for another brand. So that's really the
whole idea of modes. So here, I've put
somehow together all the companies that
either now or in the past, I was invested into
and I took, I mean, I could have updated
with the 2025 Interbrand, global brands. This is a little
bit an older slide. But the dots have been updated. As I said, we are April 2026. So I have had all
types of companies. So Mercedes, I still have Nike in my portfolio.
I have Louis Voutan uh, Gucci with carrying
Nestle, I still have. I had Pampers, Gillette, which was pork and Gamble. I sold it very quickly at a very nice profit when the market became depressed
a couple of months ago. I had three Kelloggs as well.
At a certain amount time. I had ABF, which also
distributors of Corona, I remember, well in South
America, at least in Brazil. So a lot of those
companies, Porsche, for example, I do have
Porsche currently in my portfolio since
more last two years. If I would sell now
my Porsche position, I want to be very
honest, I would be losing money, but
I'm not doing it. What I'm doing is I mean, if the market is becoming depressed overall and not
directly related to Porsche, I'm going to be buying
more of Porsche, and I'm hoping that at a
certain moment in time, that the market and Porsche will come back as a
very strong brand. So that's the type
of companies that I, in fact, invest into. Last but not least, I mean, when I will go into
the third pillar, which is speaking about modes
and intangible metrics, I will mention I will really go a little bit
deeper into what are the type of metrics that you can find in Vinla related to modes. But indeed, I will
be sharing with you that there's going
to be brand information. There's going to be Casman
employee satisfaction, and you can even ask Vin. You see it here on
the right hand side, asking the Vina AI agent. To show, for example,
the top 20 brands, Vinla has, I mean, we have loaded Vinley with
this type of information. So this is one of
the reasons why I invest into Blue
Chip Companies. So it's actually this one. That for the time being, and I'm doing this now for 27 years, that if the market is cheap, again, not every even here a top hundred
company is now cheap. But if it becomes cheap and
the financials are reliable and I'm going to tell
you more about this as I develop and I go
through intrinsic value, if there is an
opportunity to buy, well, chances are high that
I'm going to buy a company out of this
investment universe. Remember, when I
was speaking about the mindset that I like to buy companies that are in my circle of competence, and
investment universe. So, for example, you
would have here, and I'm saying there's
a lot of respect companies like JP Morgan. I'm pretty sure that
there are other, let's say, financials,
Citibank, for example, is here. HSBC, I will not invest
into those companies. I don't understand
financial service industry. AXA probably is also
somewhere here. I would expect the
big insurance company from France or Visa. I will not be investing into
those companies, right? But that's my
investment universe. But generally speaking,
the first set of my investment
universe will be like the top hundred
brands in the world. And then out of
those top hundred, I will exclude everything
that is biotech, everything that is pharma,
everything that is tech as well, finance and
insurance companies as well. But then for the
rest, I'll try to understand the business
of the companies and see if there is a
cheap opportunity to buy those companies
at a very nice price. Rona, so thank you
for your attention. In the next one,
we'll be speaking about earnings consistency. Thank you very much, talk
to you in the next one.
12. 5-10 years earnings consistency: Alright, next lesson in
chapter number three will be discussing the
next level one test. Remember that level
of one tests are in fact very easy to understand. Tests that do not require a
huge amount of calculation. That would be more the case
for the level to test. The next level one
test after having discussed blue chips is in
fact earnings consistency. So what is the
earnings consistent? It's very easy.
The main question that you have to ask yourself is the company being profitable
during the last ten years? And if not ten, at least five years, consecutive, a profits of the company
without a single loss. And I really mean
here, yearly profits. So for me it's acceptable. The company may have
a quarterly lost. That can happen because of seasonality, those
kind of things. But really here the intention
is that you only invest, or at least I only
invest into companies that have been printing out positive results at
least five years in a row, if not even ten. So how can you see this? There is, I mean, I'm
showing you an extract from a company on Morningstar. The test is very
unsophisticated, um, but you would be
surprised, in fact, how many companies do fail on this test and the
strong companies, and it's true, it's a little bit also the case for
blue-chip companies. And very often those companies, whatever happens in terms of
economy, even during COVID, they in fact continue
having do certain extent, more or less the same amount
of economic activity. So in terms of top-line revenue, and they're able
to have that cost on a control in
order at the end to still be able to generate profits from their operations
and even in general, to generate the profit from the overall economic activity. So as some people say, these tests may be
very unsophisticated, but it really spreads
the cone from the crop. So what I really recommend
you is that, I mean, here I give you the example of morningstar.com
extractive accompany. You can do it also, I think
on Yahoo financials is really if you're interested
in a company first test is the
company blue-chip. Second test. Does that company that you potentially want to
invest into have a track record in terms
of positive profits. So in terms of positive
results in fact, and not having
written a lot over the last at least five
years, if not ten. In fact, what happens if
there is a yearly loss? Remember we speaking about annual losses are
annual profits. Well, for me the
rule is very clear. One single annual loss
over the last five years, if not even ten years, will automatically
exclude the company from the selection process. It may sound extremely harsh, but that's really the case. And I'm very strict about this. As I said, I do accept temporary
losses on the quarter. I'll give you a very
concrete example. I currently have in 2023 events,
Vanity Fair cooperation. So VFC, which is the
holder of North Face vans, D keys, etc, premiums. Well, they had because of a change in
inventory management, they had a quarterly loss, I think two quarters ago, if I'm not mistaken, and that's really
acceptable for me. But I want the company to be
able to print out money from their operations
every single year for many years consecutively. That's really a very
strict test that apply to the
investments that I do. Here. I mean, let's, let's
practice a little bit. So here you have an
example of a company. I don't remember
which company it was with a certain
business revenue. What I want you to comment
here is the revenue evolution versus the net income available to common
shareholders evolution. And do you see any
kind of risks? So I will just very rapidly
walk you through the numbers. So you see that 2014-2020. So the company had like 2,789 billion, 28 dot 1,000,000,027, 25, that's 72825,
that's 7.25 or three. So that's the business revenue for the last, let's
say 20142000-20. And you see at the bottom, in fact, you can use a
pre-tax income if you want. You see it here
in the red frame. You can see that the
pre-tax income has been to 29 to 3916 to
809-51-5011, 42.0 73. So what I want you
to do is to comment, to think about how do you
compare the evolution of business revenue
with a pre-tax income? So when you have done that, some maybe pause the video
here and then resume. And when you resume, you will hear me in fact give the explanation how I
would look into this. Alright, so if you
have looked into and you have competitive
business revenue versus the pre-tax income. As an example, you
could have also used. The net income from
continuing operations and net income available to
common stockholders. What you see in fact is that the business revenue has
decreased more or less. There is a tendency to
decrease by around 10%. So rough cut from 28
billion to around 25. So they lost like 2
billion of revenues. It's like seven to ten per cent reduction in
business revenue. Does that mean something? Well, it depends. I mean, it could be that the
company has sold off part of its business
to a competitor, e.g. so it's normal in such situation of the business
revenue would go down. What is more
interesting is when you look at the net income available to common stockholders or
even the pre-tax income, the tenancy is the same. You see in fact
that there there is an issue on the cost side of the company from
what it looks like. You see in fact that
the proportion, so let's say the minus seven
to ten per cent decrease in business revenue is in fact stronger on the net income
or the pre-tax income. The company. To make it simpler
in 2000, 14,015, making a 28 billion of revenues was printing more or less. The net income to
common stockholders, 1409153, so
one-and-a-half billion. And you see now in fact that the revenue
tendency going down, but the profitability, in fact, it's decreasing at a faster pace from compared to the
business revenue. So that's the kind
of thing that you need to understand in such situation where
you need to be careful. We will discuss value
traps later on. But it could be, That's one of the signals that it could be a valued traps. So the profits are still there, but the business
revenue is decreasing and the net income is
decreasing as well. If there is no good explanation
of the company has sold part of its assets
and it does not have, or at least not reducing,
optimizing its cost. This could be potentially a value trap because there are certain point
in time the company will no longer be able
to remain profitable if the business revenue
continues to go down in fact, so be attentive to
those kind of things. Alright, that was
already everything for the earnings consistency,
pretty short lesson. But remember, as I
mean, in a nutshell, their earnings consistent
is really about the test set you have
to do is the company I want to invest into
hasn't been making profits over the last
ten years consecutively, or at least the last five years. If that is not the case, I would read a refrain from
investing into it, right? Our next lesson will be about
price to earnings ratio, which is a very common
ratio that a lot of even traders actually use. But as we will see, it's not just about, you should not use
shall nots in fact, make one single
investment decision just based on one single ratio. So it's a combination
of a lot of things and that's why I'm showing
you here with level one, level two, level three tests. So level one other
fundamental tasks. Level two is more like
calibrating the intrinsic value, knowing your margin of safety. And level three will be about the modes and how to make
them mowed more tangible. So, talk to you in the next lecture about the price to earnings ratio. Thank you.
13. Low Price to Earnings ratio (P/E): Alright, so we're still
in Chapter number three. We are. And I'm walking you
through the level one fundamental test or
screens that you have to do. At least I'm showing you
how I look at those tasks and various ratios attributes of the companies I
want to invest into. So just as a quick rehearsal, the first test in level number one
fundamental screens is the company blue-chip. The second one is
the company making profits for five
consecutive years, if not ten, at least. The third test that we will be discussing now is
very common in fact, ratio that is being
used overuse in fact, which is a price to earnings. And I promise you, a lot of people put huge
amounts of money just because the price earnings
ratio appears very good, very, let's say cheap. In fact, the price to
earnings ratio will give you, let's say a signal. It's one of the many signals, will give you a signal
if the share price of a company versus its
earnings is cheap or not. But you need to pay attention. It's as, and I will
repeat this all the time. It's not because one ratio
appears very green, very good. And this one is one
where too many people, just by having a very low
price to earnings ratio, put a lot of money
into investment. It has to be combination
of multiple things. So let's go into the
price to earnings. So abbreviated as
you have understood, it's called the PE ratio, price to earnings ratio. And it's a measure in fact, that calculates the share price relative to the
annual net income that is earned by the company. And this on a
per-share perspective. So the formula, in fact,
it's pretty straightforward. The price to earnings
ratio is calculated. You take the current
share price and you divide it by the
earnings per share. If you don't know
the earnings per share, this may happen. You can also calculate
the price to earnings ratio by taking the share price, dividing it by the
total earnings divided by the total amount
of, remember, use the diluted
amount of shares, which is the higher
number nominee. Because if you remember,
diluted amount of shares, outstanding, shares includes all
potential stock options that will be printed
in the future. So this is how you
calculate actually the PE, you're going to see
a lot of websites, financial websites,
they present this, they precalculate this for you. If you go in Yahoo
and Morningstar, etc. On Phineas, you will
find those ratios. But if you do not know, and if you want to calculate
it yourself, you will see, of course, in the
actual file that of course I'm calculating
this as well. But you need to put
in the share price and then the earnings per
share or the share price divided by the total
earnings divided by the total amount of diluted
outstanding shares, right? One of the things that a lot
of people actually do not realize is how to interpret
the price to earnings ratio. So in fact, you have to think that we are
dividing annual earnings. So let's use the latest
annual earnings. So it is giving us a ratio based and we're dividing
by an annual numbers. So the current share price divided by an
annual number, e.g. the annual earnings per share. So actually, what does it mean? How shall you interpret the PE? In fact, as an investor,
you are buying. So this ratio There's multiple, is telling you how many years of earnings that you
are buying in fact. So I'll make it simple. If you have a price to
earnings ratio of ten, it means that the current
share price is in fact ten times higher than
the latest annual earnings. So you are buying the
company with a multiple of ten times its
current earnings. Alright? So P examples could be, I've taken the exams
like Amazon P. I don't know exactly
where it stands now, but it has always been extremely high at something around 80 e.g. very probably towns come
down now since 2020, 1022. So maybe we are here at
the price earnings of 60. We will discuss Amazon
electron rich small when I bought it was at
the PE of around ten. So I was buying in fact, I think it was at the
stock price of CHf57. I was buying a really
small conglomerates at ten times its
annual earnings. So let's continue the interpretation and
what does that mean? It means that if I'm
buying a company, adds ten times its earnings. If I keep the company and if the earnings remain
constant and I keep the company more than ten years, having bought at a price
to earnings of ten years. In fact, after 11 years, I've seen the whole amount
of investments back. In fact, that's
basically what it means. So my personal investment style and I'm going to put
here rule into place is I tend not to buy companies that have price
to earnings ratio above 15. And I like to buy
companies that have even price to earnings
ratios below ten. In fact. So of course you
need to be aware of value traps because just
looking at one single ratio, it may be at the price. Earnings is extremely
low because the market has already reflected a low
price on current earnings, but the market is
seeing a decrease, e.g. that will happen in the future. So that's the kind of
thing that of course, that's why we're
investing isn't odd because there is
judgment required. But if the company
revenues are growing, if profitability remain sounds and you have a price to earnings
ratio that is below 15. Their chances in fact that the market is the
present about the company. And potentially it's a, it's a bargain, so it's
nice opportunity to buy. So that's the kind of thing
that you have to think about. So again, the formulas price to earnings is share price
divided by earnings per share. But if you don't know
the earnings per share, EPS is just called. You can, for the
price to earnings, you can take the
share price divided by the total earnings. And the total earnings in
probably billion US dollars, million US dollars or euros
or whatever the currency is, divided by the total amount
of outstanding shares. Remember to take the diluted
one which is the bigger one. So if e.g. the share price is at $100 and the earnings
per share are at $10. You will have a PE of ten. You're going to be
buying $100 per share. If you would buy today, you wouldn't be buying ten times the latest annual earnings of ten years dollar per share. This is what it means. Okay? So of course, the conversation
is how predictable is the amount of years of
earnings that you are buying. And of course, this
is something that you have to take into
account depending on your investment horizon. So of course, if you're buying
a company and we're going to go into the example
of Amazon as well. If you're buying a number, just putting a theoretical example, if you're buying a company with the price earnings ratio of 100, means that the company
you are buying today, 100 years of earnings
of that company. Of course, some growth
investors will say, Yeah, but you know Canny, now
this earnings are small. You're going to see
that the company will really grow at an
exponential rate. So the current earnings
have to be corrected back. So maybe you are
buying, I don't know, 50 years, maybe 35 years. But I simply that buying
a price earnings of 100 and that even growth
investors would tell me, yeah, I have a crystal ball and you're going to see
the earnings grow a lot. That's what a lot of people
have been thinking about. Amazon with all due
respect for Amazon, we are going to be discussing
this in a couple of slides. In fact, That's a risk. In fact, that's speculation. So that's the kind of
thing where you need to be attentive, is like, do you really feel
comfortable buying so many years of
current earnings, even if you would add growth assumptions
to those earnings. But again, for me, having a growth assumption of 25% for the next 25 years,
that doesn't exist. And just look back at history. And history has always been
right about those things. So assets PE, below 15, even better below ten. Well, that would pass this test. But again, remember that I'm not investing based on
one single task. It's a combination
of all the towns I'm sharing here with you. We have is the
blue-chip company, is their earnings consistency is currently the market
price of the company. Cheap. So with giving me at a 50 into ten times its
current annual earnings. Why I'm giving you another
reason why I don't like to buy companies
that have price to earnings ratio of 100s, of 50 or even 35. There is one statistic which
is not discussed a lot. In fact, by investors, which is the average. I'm a lifespan of
companies on the S&P 500. And there has been a thing, It's Professor Foster from, I think it's the New
York University. There has been doing an analysis and has been showing that
over the last century, the lifespan of companies
and big companies in the S&P 500 has in fact been decreasing
very, very strongly. So likely decade ago, you had companies
like in the 1920s, 1930s, accompanies had an
average lifespan of rial. It's probably like 90 years, 80 years if they were listed on the Dow
Jones or the S&P 500. Now we see over the
last year is that this has come down to
like 15 to 20 years. So it means that you
have a very high chance. And if you look at in
the last 15 years, 52% of the S&P 500
companies have disappeared. If you're buying a company
with a PE ratio of 30. So you're buying 30
years of earnings. You're buying two
of those companies with similar price
earnings ratio, there's going to be very probably one of
those companies that it will have this appeared
in the next 15 years, but you have just bought
30 years of earnings, but after 15 years the company
disappeared, disappears. How do you think that you
will get your money back? Sorry, that doesn't
work except if somebody has acquired a company
with a premium price. But that's the reality. So that's why I believe
that also taking into account the price to earnings
below 15, below ten. Not only is this
something that I learned from Benjamin Graham
and Warren Buffett, what is what it means
to buy company at a cheap price versus
its earnings. But also, I think it's
in line with what Professor Foster from
New York University has been in fact, studying, which is that the
average lifespan of company has come down to 15 to 20
years, maximum in average. And we're speaking
here about SAP 500 companies which have
huge amounts of capital. They can easily raise
money from the market. But at the very end of the day, it appears that
even though with, even though they have firepower, they have strong brands that
still after 15 to 20 years, half of the companies in the SAP for foreign,
they have disappeared. Alright, let's go to
the example of Amazon. So you remember that I'm currently re-recording
this training. We are April 2023. So the first time the
training was published was August 2020 as I've been starting to write
this because in 2019, what I've updated here
is the following. So discussing about
Amazon because Amazon has always been considered
as a growth stock. You see on the bottom left, I extracted the financial ratios at that time from Morningstar. So you see they are
dated March 31, 2020 when I was preparing
and writing the course. And on the right-hand side you
have the latest one as Q1. 23 is not out yet. We have the December 31st, 1022 in fact ratios. What is very interesting
is that you see, and I can share
that at that time, the current price to
earnings ratio of Amazon was at 119 times the current
yearly earnings, which is absolutely
huge if you would look today in 2023 based
on the latest, let's say based on
latest figures. In fact, even Amazon had
the negative earnings, which was a little
bit, Let's say, complicated for them to explain. And of course, if you
have negative earnings, how do you calculate
price to earnings? Price to earnings will
be negative in fact. But over the last
couple of years at price to earnings has come down. And in 2022, e.g. and the price to earnings went down 119-76, approximately. So you see that there has been a correction on the stock of Amazon and Amazon has
not been able to grow, let's say the growth expectation that all those growth
investors hats. So imagine that you would buy, let's say, based on
the 2022 figures, 76 times its yearly earnings or even 2020
you would have bought at was what I was discussing
because you would have bought at 119 years of earnings, even if the company
would grow like crazy, you would still buy
four years of earnings. Don't you think that you
would have overpaid for that? Do you remember what Charlie Munger was saying in
the BBC interview in 2012 that there may be
great companies out there where all the
tests are ticked off. But maybe at the moment that
you have cash available, they're really too expensive. And Charlie Munger
was saying, I mean, even if the company
is fantastic, It's not worth an
infinite price. And with all due
respect to Amazon, I believe that in 2020, the company was really, really overrated and that's why you still had
people that were buying the company and the price to
earnings ratio of 119 years. So the price that
you will paint was 119 years of its latest
annual earnings. I mean, just think a
second about that. That's just huge. Some people will say,
but I'm okay with that. I would say, well, I'm happy for you if
you're okay with that. I believe it's really,
really extremely high. And that's for me really in
the area of speculation. I could I mean, you would tell
me I'm buying the company the price to earnings of 17 because their earnings
will grow in the future. So basically if I adjust the
earnings for the future, it will not be 17, may be 12, So it's
cheap, I would say. Okay, you are close to the 1510. I don't understand. Understand the
average lifespan of a companies blue-chip company. Maybe the company is around for 60 years, has strong brands, strong pricing power, has even strong
earnings consistency. Okay, Understand. Got it. But here, it's not
the case for Amazon. And you see on the
right-hand side. So the price to
earnings today in Morningstar is in
fact not showing anything because in 2022 they printed a
lawsuit has in fact been negative earnings
here for Amazon. So just again, here history
again, repeat itself. Buying company at 119 times, its earnings is really
for me speculation. That's what I want to
share here with you. Alright. One of the conversations as
well that people are asking me is about what about permanent versus non-permanent
stock positions? You may remember in one of the previous lessons I
was sharing with you, my investment portfolio and specifically the holding period. And again, you can see
this very transparently on the 36 squared
capital.com website. And if you listened
to Warren Buffet, he has always been
saying by companies, and you want to
keep them forever. And even if the market
would be shut down, you would still have faith that the company would
still be around after the market comes back in fact and it becomes
operational again. The reality to me, very fair with Warren Buffet or at least with
Berkshire Hathaway. It's mixed bag. I mean, if I take the latest investment, that's Berkshire Hathaway did
on Taiwan semiconductors. I think the after one-quarter, they have been throwing
out the company. What was the reason why? Maybe I mean, of course, with the firepower that
Berkshire Hathaway has, when they buy a stock automatically the
stock will go up so they're able to push by themselves through their
purchasing decisions. Stock market prices up, which is obviously
not the case when I'm purchasing a company. But it's true that's the
attitude that you need to have. You remember we discussed about patients is that
when you have done all your tests and all
the tests appear goods. While you need to
think that if you bind with a margin of
safety of 25 to 30%, maybe it, maybe you want to
keep that company forever. And think about consumer
defensive brands like Danone and Nestle, Procter and Gamble,
Colgate-Palmolive. And again, later on in
the training share with you when is the right
moments to sell? And again, I will
already share a chair, already said in one of
the previous lectures, of course one, the market is overvaluing the
company by too much. Well, for me that
would be signal maybe to sell and to taking the profits even though I liked the company would like to keep it forever in my portfolio. On the other hand,
with all due respect for and buffer as well, and to be fair
towards him, I mean, he has positions like Coca-Cola
that he has for probably like more than a decade in his portfolio with 400
million of shares. So as I said, it's a mixed bag,
foreign buffets. Just keep in mind that indeed the attitude
that you need to have per default is that when you buy a company that you would
love to keep the company, because you're buying
at the price earnings of maybe 151010 times its annual earnings that
you're thinking about keeping the company at least for the amount of years
that you are buying, the price earnings ratio. So if the PE is 15, are you feeling comfortable
keeping the company for 15 years at current
earnings until the market than
potentially shows the real value of
the company through its share price, right? That's basically what
I wanted to say here about the PE ratios. One last thing before
wrapping up is looking at there is also a PE
ratio for the market, which is, you have one which
is called the SAP 500 PE. I've put you the URL, and some people call it also the Schiller ratio
doesn't matter. But if you look here, there is, there is some, there is a say around
this ratio that if the market ratio is around 15, you can expect an annual six to seven per
cent return every year. In fact, just because the
overall market ratio is low. And you see on the
left-hand side, of course we had
the tech bubble, we had the pre subprime crisis, let's say economical environment
that was extremely hot. I mean, P ratios, they go up and down,
they fluctuate. And that's why I'm saying
if you are buying, if you don't want to be a
stock picker juice want to buy an index by the S&P 500 ratio when it is low because you will see written
on this and this is basically what
I'm showing you here on the right-hand side. In average, when the
PE ratio is below 15, you will for sure gain at
least six or 7% every year. But of course, you need to be
patient because not all the times the market average ratio. If if let's consider the S&P 500 would be for the US average, market ratio will be below 15. So you need at a
certain point in time, maybe just to wait until really there's a
crisis situation. That's why there is
an attribute called patient's in the mindset of
value investors as well. Alright, so let's wrap
up here this third test. So we have been discussing, is the company
blue-chip company? Yes. No. Does the company have earned consistency at
least for the last five, if not ten years? Yes. No. Is the price to earnings
ratio below 15 or below ten, okay, so those are
the first three tasks that you have to go through. Next task will be the
return to shareholders. Because if you remember, I said in the introduction, while we will be
sitting on our money, we need to be patient
because maybe it will take some
time until the market realizes the real value of the company that
we have invested into that we were able to
buy cheap during that time. We want to have a return to
shareholders and this is what we will be discussing
in the next lesson. So talk to you in the next one. Thank you.
14. Return to shareholders : dividends, buybacks & payout ratio: Welcome back investors. We're still in
Chapter number three, which is the first chapter
we have been discussing various tests as well invested
that you have to know. So if you recall very quickly, we have discussed first task
is accompany blue-chip. Second task is their
earnings consistency if after ten years in a row, third test is having a low price to earnings
ratio below 15, below ten. That's at least what I recommend you to do on the
first three tasks. The fourth one is returned to show us what we will
be discussing now. And so whenever we are
discussing returns shallows, we're going to see
various types of returns to shareholders and
how they affect in fact, the, if it is the book price of the share
price of the company. So first things first, let's just very
quickly come back to the value creation
cycle that we had when we were discussing
what happens with capital. Capital comes in with some
cost of capital expectations. The capitalists invest
in real assets. We hope that the
company would generate profits from its assets. And then basically if it is senior management
and all the board of directors and shareholders, depending on, let's say, the delegation approvals
that exist in the company. The company has in fact, four options if profits
have been generated, either reinvesting into
assets or paying off debt and all paying off debts and are providing a
return to shareholders. And this is what we
will be discussing. In fact, we will mainly be focusing on the flow number six, which is a remunerated
shareholders, by either providing dividends
to the shareholders, are increasing the book value of the company by executing
share buybacks. But let's go into it. So the first thing I did not mention it
for the time being when I was discussing how does management or the board of directors or share,
Let's take a decision. 45-6 are just a couple
of lessons ago, mentioned that, well, I mean, it could be that 60%
of the profits are allocated to buying new assets, buying a competitor,
going into new markets, flowing into research
and development to develop new
products and services. And maybe 20% is
going to paying off debt and 20% is going
to shareholders. But there is one element
I have to add here, which is not directly
linked to value investing, but you have to understand
it in the context of company management and strategic capital
allocation decisions. Which is in fact, if you recall, I introduced the term return when I was discussing
the investor's dilemma. If you recall the
investor, he or she, the dilemma that the person has is there are a lot of
investment classes, investment vehicles that the
investor can invest into. And of course, the written has to be
higher than inflation, has to be risk-adjusted. If you remember what we were discussing a couple
of lessons ago. So the decision, in fact, if you look at the flows 45.6, that will be taken will be on Fiverr to be
very precise, on five, if the company has promised a yearly coupon to
the credit holders, the company will
not have a choice, but the company
could potentially accelerate paying off debts. How will it take the decision? How will it take the decision going into flow number four, and we're investing
to the company or potentially are going
to flow number six, which is giving the cash
back to the shareholders. It's, it's the concept of cost of capital
that I introduced. This is what is called
the hurdle rate. So basically the
company has a couple of choices that you
have understood, 45.6. And in fact, with
every opportunity, if you look at for basically you're going into
a business plan. Management will promise a
certain written by e.g. acquiring a competitor. It means that, that
promise of acquiring a competitor comes with a
cost of capital expectations. And management has to
make sure that the written is above the
cost of capital. This is what is called
the hurdle rate. The same except of the annual committed
repayments of depth. So the coupon that has to go
back to the credit holders. So the company could decide to liquidate the depth in
an accelerated way, instead of waiting
ten years, e.g. of five years remaining to
pay off the debt holders. Again, this would be interesting thing to
do if the company does not have a better investment
opportunity either in four, in the front number four
and flow number six, when does the company, when is the best option
for the company to provide a return
to shareholders? Well, when there is no good opportunity
on reinvesting into real assets and potentially accelerating the
paying of the depth. So 4.5, in fact carry a lower, let's say return versus six. So to make it simple is
you have really to think that the flows 45.6 will
depend on the return, on the cost of
capital expectations of the company and
companies management. So if I now give you an example, if the company is a growth
company or startup, why are those companies not providing remuneration
to shareholders? Because in fact,
for shareholders, the return on invested
capital, the return. On the capital that it will be invested into
the flow number four, which is a buying new assets wouldn't be in fact much
higher in the future. The now providing e.g. a. Cash dividends to investors. That's a strategic capital allocation decision
that companies are in fact taking for very mature companies,
it's the other way around. I mean, if the
company is present in all markets and it
doesn't make sense, there is no opportunity to buy a competitor or even
buying the competitor. The efficiencies that
will come out from merging both operations
together will provide a lower return on
capital invested versus e.g. paying of depth and compare
it to the hurdle rate. Well then maybe the
company is better off and the shareholders
will be happy. Because otherwise, if
buying a competitor, the written is below
this hurdle rate, the company is in fact
destroying wealth. So it's better than to provide a written to
the shareholders, e.g. that's the kind of thing
that you have to think where senior management CEO CXOs was typically it's a CEO
and CFO conversation. This strategic capital
allocation recommendation that is then submitted to
the board of directors, that is then
potentially submitted to the shareholders for votes during the annual
shareholder meeting. The typical returns
that company have is indeed to provide. So to have those flows 45.6. But just keep in mind
that the decision, one of the strong elements
that will come into the equation into the decision
process of going for, for R5 and R6 is really
this hurdle rate. So I hope that this is clear. Alright, so now we're going
to be in this lesson focusing purely on the return
to shareholders. So remunerated
shareholders because the return on capital
invested in flows 4.5, in fact, do not make sense. And actually the company
would be destroying, let's say, value to
its shareholders. And the company
says, we will not acquire an, a competitor, e.g. if we think about
flow number four, we will not expand into new market or develop new
products because we don't have a good business
plan and we believe that we will not be able to grow and to generate the
profits from those assets. So with that, I mean,
the shareholders, you need to understand
that we prefer an effect to give you money
back and you do with that money,
whatever you want. So that would be an
outflow of money from the company's balance
sheet to the shareholders. And I will be
discussing this now. Why don't we discuss
return to shareholders? I mean, inflow number six
are always mentioned. It's a cash return
to shareholders, but there are various ways of doing returns to shareholders. And I'm only speaking here about equity returns to shareholders. So there's going to
be in fact three. The most common ones are cash dividends and
share buybacks. And we will discuss scrip
dividends very, very quickly, but scrip dividends
is not something that is very, let's say common. They do exist. I mean, it happened to me
as well on Telefonica e.g. which is still one
of my holdings after more than six years. There are certain moment
in time actually, Telefonica was providing
scrip dividends, but let's focus on cash
dividends and share buybacks. What has happened as
well over the last, let's say two decades. And you have here a graph
from Standard and Poor's. You see in fact that the amount of dividends has
steadily been growing, while the amount of share buybacks has
in fact accelerate. And then today,
companies on the SAP 500 are actually doing
more share buybacks versus paying out
cash dividends. The reason for that is, in fact tax reasons. I will explain to
you how it works. So you have those two vehicles, one vehicle which is providing
a cash dividend to I mean, to you as a shareholder, to me as a shoulder and you're
going to see an inflow of cash after-tax is to
your bank account. So imagine that the company is paying out the gross
cash dividend of $1 depending on where
you are sitting. You I mean, the company
will all your broker will remove very probably the taxes from the gross cash dividends. And you will then see
on your bank account, you're going to see
the net cash dividend flowing in at a certain
moment in time. And it would be e.g.
in this example, if the gross cash
dividend was $1, you're going to see one minus the tax rate that
you are exposed to. The share buyback is
the other way around. In fact, the first
thing is you will not see any money flowing
into your bank account, into your broker accounts. So what is happening is in fact, is that the company is
employing cash that is sitting in its balance sheet to buy
back shares from the market. The effect that you
will have is you will see in fact the book value. And I will explain
this later on. I will start first with a
cash dividend explanations, but you're going to see
the book value increase. And normally, except if we
are in a depressed market, but you're going to see as well the market share price that will adapt an increase when
executing share buybacks. So it's the very end of the day. It's interesting
because in fact, if you have bought a
company at a share price of $100 and the company is
being shared buybacks. And because of that, your share price is
going up to $105. You just have. Earned a capital gain
of $5 per share. We will be discussing
share buybacks later on. So let's start first
with the cash dividends. So remember that when we're
looking at those effects, you need always to keep in
mind simplified balance sheet. So remember that
on the right-hand side of the balance
sheet you have the sources of capital
which are adept or equity. And on the left-hand side is the employment of capital
that is typically represented by tangible assets like property, plant
and equipment. So that's buildings, trucks, airplanes, office space,
manufacturing plants, and intangible assets,
which is like trademarks, intellectual property brands, those kind of things. Alright. One supplemental concept that we have to introduce
here when we will be discussing and practicing returned
to shareholders. And we'll start first
with cash dividends is the concept of basic
versus diluted shares. I was already mentioned in
a couple of lessons ago, but I want to hear very
precisely mentioned what's the difference between basic shares outstanding and
diluted shares outstanding? If you recall what I said, basic shares out
the total amount of basic shares outstanding
and we are continuing that we only have one
class of share is in fact the number of
common shares that you could buy on the market, and that would represent 100% of the total amount of
shares outstanding. The diluted amount of shares
is in fact the basic shares, but you add to the basic shares potentially outstanding stock
options that the company has been promising,
e.g. to employees. And those, let's say
stock options are in fact can I say being vested and maybe they're
investing over five years. So the diluted actually calculates a higher
number versus basic. So it's already showing
in the future what will be the total amount
of shares outstanding, including those effects of stock options warrants even
convertible depth, e.g. you have those hybrid adept
instruments where e.g. a. Shareholder is providing a loan as adapts to the company and the shareholder has at
his or her full discretion, the opportunity to
transform that, the amount of depth
or the amount of dip remaining into a
shares for examples, that would in fact increase
when that would happen. That would increase
the amount of shares. So it's always better when we will be doing the calculations, you should always use
the total amount of diluted shares versus
the basic charts because the diluted
one is higher. So we're going to have
a higher denominator. Alright? So we'd have to bring in a
couple of formulas here. So the first one, as we're
discussing, in fact, return to shareholders
and we will starting with cash dividends. So I need to bring
into formulas. The first one is
dividend per share. So in order to calculate the dividend per share,
you would take in fact, the total amount of money
that has been paid out to shareholders and
you divide it by the total number of
shares outstanding, diluted, always take
the diluted one, it will always be
the bigger one. We will be practicing this on the McDonald's
financial statements. Then as well as
second concept or formula that we
have to bring in. Because of course and
settlement in time, we want to see what is
our return on our money. In fact, that we have
invested by buying shares of that company is what is
called the dividend yields. And that's a value that is expressed not in currency
but in percentage. In order to calculate this, you calculate the dividend
per share divided by the share price is or the share price when
you bought the company. Or the share price,
if you would think, or the current share price if you're thinking of
buying the company. In fact now, e.g. from the New York Stock Exchange or European Stock Exchange. Just to give that as an example. And of course, dividend per
share can be substituted by the formula total amount paid out in terms
of cash dividends, divided by the total amount of shares outstanding, diluted. And you're dividing them that by either your purchase share price or the current
share price, depending if you're
looking at historical, let's say purchase
that you did or you're thinking about by now. In fact, very quick
comments here. That's why I added awesome
dividend tax rates graph on the right-hand side. So remember that
when you're doing your calculations in
terms of dividends yield, which is kind of a return, a passive written that
you are getting from a company that per
default the company. When you will be doing
the calculation, you will be calculating
this pretax. And of course this will
be country-specific. You may have countries
whether amount of taxation on
dividends is extremely high and you have other
countries where maybe the amount of dividends or taxes
on dividends is low, then of course it
depends as well. If e.g. if you're buying a company that has
headquartered in the US, and you are living
in Spain, e.g. and Spain and the US do not
have a double tax treaty. You will be taxed twice. So that is what is called
the DTT double tax treaties. If the country has, I mean, if those two countries, so the country of who is issuing dividends and the country
where you are residing, they do have a
double tax treaty. You shall only pay once
an amount of taxes. That's why those double
tax treaties exist. In fact, mine personal
investments start as well. I briefly mentioned it a
couple of lessons ago, is I really want to
have at least 4% per year after taxes on dividends. Of course, I need to calculate
my pre-tax exposure. And currently and I shared
this a couple of lessons ago when I was sharing my
current portfolio, I do earn a6.02 percent after-tax per year in terms
of dividends is of course, with the assumption
that the companies are not stopping paying
out cash dividends. And then we'll explain to you
afterwards one of the test, which is the payout ratio, how you can I have
a better level of assurance that the
company will still have the opportunity to continue paying out dividends
in the future. That's a very important
test to do as well. Alright, so let's
practice a little bit. So here I've extracted the income statement
and the cash flow statement of McDonald's. And this is the
fiscal year 2016. I have not used the balance sheets here
because we don't need it. So what I want you
to do is a couple of things from what
we just learned. The first thing is I want you to spot the number of shares. And of course I want you
to spot the amount of total shares diluted in one
of those two statements. And I want also you to spot the, which is our flow number six, if you remember in the
value creation cycle, I want you to spot the amount
of dividends that have been paid out to regular shower or so to come and shareholders. I want you to do a
manual calculation of the dividend per share. And I want you to make a minor calculation of
the dividend yields. So for the dividend yields
and what you will need, of course, you will need to
know the current share price. So use for the time being as an assumption that
the share price of McDonald's is sitting
at $186 dots $0.10. So that's the assumption
that you can use for your calculation when
you are ready to, I mean, stop here, look at the financial
statements. So the cashflow
statement and the income statements and spots
asset the diluted the total amount of shares and total amounts so
that flow number six, how much stock dividends
have to be paid out? So of course you have to think and you have to read the lines. I mean, the information is on those two financial statements. You have to look at
the income statement, the cashflow statements, and try to find out, I want you to practice
your eye, as I said, on looking into
financial statements. Alright, posterior, because I will now when
you will be resuming, I will give the
explanation, of course. Alright, so I will
be resuming now. So when you look
at the McDonald's income statement at
the very bottom, and this is something
that happens very often. Not always, but I
would say 95% of the companies at the bottom of the income statement
they provide with the earnings per share, basic and diluted,
and below that, very often they provide the
total amount of number of shares that are outstanding
basic and the diluted one. So you see in fact,
for McDonald's, we are speaking about 2016
at the amount of shares, total amount of
shares diluted was 861 dot 2 million of shares. On the second question, which was the total amount of dividends paid out to
common shareholders. That's an outflow of cash. It's a financing. If remember the three
sections of the cash flows, the operating, non-operating
thing, is it investing? Know that's flow
number four here. Flows number 5.6,
if you remember, they are sitting in
the financing activity or section of the
cashflow statements. So you see in fact, when you look at bullet point number two, that the company has been
paying out a little bit more than $3 billion of
common stock dividends. And you also see, in fact the line above, which is called treasury
stock purchases. That's the share buybacks. Oh, they did 11 billion, 171 million of share
buybacks in 2016. So those are the two
numbers that you, in fact, what you have to spot on
the first two questions when you do a manual
dividend calculation. So again, we are making a dividend calculation
per share pre-tax. So in fact you take the number. So common stock dividends paid out 3,000,000,058, dots two, and you divide it by
the bigger number, which is diluted total amount
of shares outstanding. So you actually divide,
use the formula here, 3058 dots 2/861 dots 2 million. So always of course be attentive that you
use the same units. So we are dividing
millions by millions. And this will give
us a three to $5 of cash dividends pre-tax per
share in the year 2016. So I just want to, very quickly, you can
read it for yourself, but just to show you the effect of using the wrong number, which would be the basic number instead of the diluted one. You see that is,
it will generate a three-center difference
between the two because you are dividing by a smaller number, so it would be $358 on 355. Does it change the world? No, it's not. It would be a smaller mistake. But still, if you want
to be on the safe side, if you don't want
to be defensive, always take the bigger number, which is normally
the diluted one as it adds to the basic number, the amount of, let's say
promises in terms of vesting. I've stock options warrants and even potentially convertible
debt that has been added. Alright, so now continuing
the calculation, we are calculating
the dividend yield. That was something I
was asking you as well. So of course, if you
have generated over, the company has paid out a three dot 55 years dollar per share pretax cash dividend 1016. You divide that number by
the current share price because we are thinking here, we're taking the assumption that we are thinking
about potentially buying into McDonald's
at that moment in time. So that will provide
us a one dot 90 per cent dividend yields
on the price of $186.10. Is that great? Well, it's not nothing. But first of all, it's pretax. And you remember your written
has to be above inflation. If at that moment in time inflation is sitting
at three per cent, you are destroying wealth. So it's maybe that's
why I've put it in red. That's not maybe the
best thing to do. And this is why just coming
back to what I said, this is why I'm always
thinking about having at least a 4% after-tax
return because I believe that long-term
inflation will not be above that four per cent. Remember monetary policy of the US Federal Reserve and
European Central Bank, that should be long-term,
mid-term at 2%. Alright? So that's one thing how you can calculate the dividend cash. So the cash dividends
per share pretax, and then the dividend yield. And you have to think about
what's the written that I'm getting versus
my cost of capital? Alright? One of the things, one supplemental task
that you have to do, and you will have this
in the Excel file, which will be pre-calculus, pre calculating it
for you as well, is in fact what is
called the payout ratio. So the payout ratio is in fact, is there a margin of safety
not on the share price, but really about what
is the safety that the company has to
continuing ping out the cash dividend
in the future. And so the payout ratio in
fact goes the following. You take in fact
the total amount of dividends that
have been paid out. So not per share, but really the total amount in the currency for McDonald's was a little bit more
than $3 billion. And you divided by
the total net income. And this will calculate
that the payout ratio. In the case of McDonald's, in fact, the payout
ratio was 65%. So what does it mean? If I go back to the flows 45.6, it means that from the profits generated and if you take
the flow number three, number three is telling us the company has
generated for dot $686.5 billion of
profits from its assets. So 65% of that profit will be in fact allocated to
the flow number six. So 3-665% is being allocated to the return
to shareholders. It's, it's not very complicated, it's just common sense, but you need to understand
how to read this. The 65%, and I will
share with you, what is my honest
feeling about it? 65 per cent for me is a mature. We are speaking about
blue-chip companies where the expectations are
written off capital R, Let's say fair. So in that sense, 65% is fair. So I consider that. And this is part of my tests. First of all, I want to have a more than four per cent
dividend yield per year. But at the same time,
or I could say, and at the same time, I want to have a dividend
payout that is sitting 30-70%. Why? Because I believe that if
the company is providing less than 30% to shareholders, for me, at least as
a value investor. I believe that I'm not getting enough return from the
profits from the company. And if it is above 70%, what could happen is that the
company will not be able. I mean, it would require just a small
fluctuation in profits. So in net income that
the company would no longer be able to pay
out its cash dividends. So that's why I believe
that having also here, a margin of safety is
also something goods. And of course, we don't want
companies to raise dept, I mean, let's be very clear. That would be totally
unacceptable. That management would raise depth to pay out
a cash dividend. That's just crazy. So that's the kind of thing, of course, that you have
to pay attention to. But the tests are very clear. You need to have some
kind of cash return. For me, it's more
than 4% after taxes. And I want to make sure that
the payout ratio is 30-70%. And this is automatically
included in the Excel file that
I'm using when I'm doing valuations
and that you will have access through this
course as well. Alright. So then the second, I mean in the flown number six, a second type of written
to shallows that can happen is really
the share buyback. And I want to explain to you
how share buybacks work. So remember that share buybacks. In fact, the company
is buying shares that are available on the
market from the market. And what is the effect of that? Then you can see it in, in various examples
that I've put in here is that it's imagined. I start with a very
simple example. If you had a company
that had an equity of 100 K US dollar and the company that equity was represented
through 50 shares. One book value per share
was in fact $2,000 if the company would buy five
shares back in the equity. Technically speaking, that
equity will remain at 100 K US dollar and
the book value, because you would divide
the same equity amount by less shares outstanding as a company has bought
back five shares, your book value will increase. So technically speaking,
means that in this example, you would get a gain of 11% on the book value
of one single share. Because the company has
spent a certain amount of money on reducing the amount
of shares outstanding. So here I want to be very
precise because there are effects that you need to be attentive to allow me to be
a little bit more technical. So as I said, you have
this balance sheet. The company in this example
has a balance of 240 million. I'm taking another
example to explain the things that are important
here to understand, the company has same amount
of debt and equity, just, just an assumption that
to do a balancing is 240 million and the company is spending $20 million for doing a share buybacks at that time. And you have the company has 100 million
shares outstanding. The book value of one
share would be $100,120 million of equity divided by 100 million shares outstanding, which would be one dot two. Technically speaking, they
are doing a share buyback. There are two steps to it. The first step that
you're going to see in a lot of companies is you're going to see in the equity portion of
the balance sheet, you're gonna see a line, a negative line appear, which is called treasury stock. Treasury stock is in
fact the amount of shares that have been
bought back since they won, because we are looking
at the balance sheet. In this example,
you will in fact see the equity go in step one, go down to 100 million. And here there is a
very strong assumption that it depends on
which moment in time the company does
the share buybacks. And I've been discussing
this in a webinar as well. If the company is
buying back shares from the market at a very high price, actually the company
may be destroying too much cash versus the amount of shares
that are bought back. Here, I took the
assumption that for 20 million of US dollar
spent on share buybacks, The company was able to buy back those shares
at $1 per share. That's why the amount of shares
on the right-hand side of the graph has come down to 80
million shares outstanding. But imagine the
company will in fact, by the sheriff's back on
the market for $2 a share, the amount of shares
would only then go back to 19 million, 100 million shares outstanding. Before doing the share buyback, the company spent
20 million and is buying each share at
US dollar per share. So the company is buying 10 million shares
from the market. And instead of having 18 million
on the right hand sides, the company would
only have 90 million. So you need to be
attentive that that can have bad effects. And Warren Buffett
is speaking about this bad effects
and the timing when the company is buying
back the shares from the market is
important, as well. As a general remark, I like share buybacks, Warren Buffett Live
Share buybacks as well. I'm just very attentive to when the company is buying the
shares from the market. If the company is buying the
shares from the market at the tip of the share price,
that's maybe not good. Maybe the companies
should spend the money at a reasonable price
in order to buy more shares back
from the market. In this case, as the company
was able to buy back the spent a 20 million
at $1 per share. The amount of shares outstanding
is at 80 million shares. And you see at the book
value has in fact increase. The equity has
raised 120 million. Monitor treasury
stock is 100 million, then divided by 80 million
shares outstanding, and you have a book
value of N of 125. And this is what you have. Also hear from McDonald's. You see in fact that
they are, in 2016, they did treasury
stock purchases for $11,171 million,
11,000 $171 million. And you see in fact that it's nearly four times or
three-and-a-half times the amount of cash dividends. What I want you to do
here is really to comment evolution of stock
buybacks between the two. In fact, on McDonald's between
the years 2014, 15.16. Pause here and then resume
when you are ready. So when your resume
you see in fact that McDonald's has been, let's say, pretty flat on the amount of cash
dividends spans. So they have been
spending rough cut 3 billion in 1,415.16. Why the amount of share buybacks has doubled 14-15,
3000000198-6000000000099. And then again, they added another 5 billion between 2015, 2016 to end up at 11 billion spent on
share buybacks in 2016. Of course, this has
an impact on cash. So you need to think about
what's the impact on cash? Of course, you hope that, you know, that cash
would be destroyed, but the company has generated higher profits to
be able to do those shampoo phi of x and those stock dividend payments as well. So always think about looking at the end position of cash. While the company is
spending huge amounts of money on doing those share
buybacks and cash dividends. So what you then need
to calculate as well, and this is where we
will be finishing here, what I want to share with you
is you have to think about total share buyback and not just about cash dividends yields. Here you need to be
able to calculate that. In fact, while you were
only getting a one dot 9% cash dividend yields, while the company has been
spending more than 11 billion. If you make the calculation, the company has spent
$12.97 on a share. So basically the company on your $186 has been adding
to the one dot 9%, a 69% share buyback healed. And so your total year, and this is in the actual file, is also precalculated
automatically calculated your total yields is the cash dividend yield plus
the by the buyback yields, which is the amount of
money spent on the top. So you divide the total amount of treasury stock purchases divided by the total amount of shares outstanding diluted. And you take that amount and you divide it by the
current share price, and this gives it a 609
per cent share buybacks. So look at the formulas here. So at the very end
of the day in 2016, McDonald's was providing an eight dot eight per cent
total shareholder yields, one that nine per cent
cash dividend yields and 609 per cent share
buyback yields. But of course it's 6.9%. You will not see it
in the bank account. So before we move
on, you can see in this summary slide
also aware in fact, if you remember the
dividend per share and the dividend yield formula, you actually substitute
dividend by buyback. And you can calculate
the buyback per share and the
buyback yields, but isn't important assets. And as we saw in the
example of McDonald's, is that you then I able to calculate the total
shareholder return per share, which is basically
the dividend per share plus a buyback per share. And you can calculate the
total shareholder yield, which is dividend yield
plus buyback here. And this is how we
ended up having a more than 8% return on a McDonald's or return to shareholders for
McDonald's as a company, at least in the year 2016. So remember it was a cash
dividend yield of one at 9% plus a share
buyback heel up 609. So before moving on,
keep in mind that the share buyback
heal normally will reflect in an increase in the share price because the book value will
artificially be, let's say, increase by having less outstanding shares that are free floating on
the public markets. But if there is a
button that you will not see the share
buyback yields and land in your bank account will only be the cash dividend
yield that you will see after-tax landing in
your bank account and your broker account. Alright, two last things before
wrapping up this lesson. The first one is when we
speak about dividends. And I believe that dividends
are a very, very strong, let's say, element
for building up this snowball effect
and building up wealth. You have some companies
and in fact are called dividend kings or
dividend aristocrats. And what is the definition of dividend king
given aristocrat, it's in fact a
dividend aristocrat is a company that is listed on the S&P 500 for more than 25 years and
has been increasing. In fact, the payouts, the cash dividends to shareholders
for the last 25 years. Dividend king is the same, not necessarily in the S&P 500. It's a company that has been
increasing the payouts, the dividend payouts
for the last 50 years. How is this possible? Well, because of
inflation in fact, and very often you're going
to see dividend kings and dividend aristocrats be inflation resistant
companies, e.g. I, remember I had
nestle in my portfolio unless they had been paying
out dividends since 1959. What has been increasing that
dividend year over year? I had the same for BASF, which currently pays
€3 dot $0.40 per year. And that dividend has been
increasing year over year. Of course here,
the payout ratio, the dividend payout ratio
plays a very important role. But as long as profits, as long as the company
is profitable and it can potentially charge inflation
to its end customers. Chances are very high and it's the same for Unilever, e.g. that I had in my
portfolio as well, or the nonna that in
fact those companies are in fact increasing
the amount of dividends. So the cash dividend
year over year, and there are some so I have currently 03:00 A.M.
in my portfolio, which is one of those, but they are more so this is a very strong snowball effect. Why? Because maybe the
day you bought in, let's imagine you
bought in six years ago and at that time you are already having like a five to 6%, let's say dividend yield. Well, without doing nothing that dividend yield will
increase year over year. And maybe today you're
already at nine or 10% of dividend yields by
holding that position. So that's something
that is extremely powerful and not
enough people in fact, look into those things. So if you look at my
portfolio, in fact, I do have some of those companies that are dividend aristocrats,
dividend kings. Because not only do I want
to have passive income, but potentially I want to have
15. Profitability (ROE & ROIC): Welcome back investors. We are nearly at the end
of Chapter number three in the next fundamental
task of a metal screening, be discussing
financial powerhouses and also the measure of profitability will be
discussing ratios, return on equity, return
on invested capital, and written that
tangible assets. First things first.
Remember when company is created at
the moment of inception, the balance sheet of the
company looks like this. There's gonna be no dept. And very probably there's
going to be equity return. Another form of shareholder paid in capital that will vary probably sits at
the very beginning as a cash assets in
the balance sheet. Of course, remember
the intention is to use that cash that
has been brought in by showers and to transform that
cash into assets that will in fact generate profits through the operating
cycles of the company. So very probably the
company or supplements hum, of the balance sheet of the
company will look like this. You're going to have
the capillary that has been paid in by
the investors in the very beginning and in the
first cycle you're going to have some cash
remaining to pay off, let's say short-term debt, e.g. like supplier salaries,
those kind of things. And the rest of the
casual probably have been employed to transfer or be transformed into tangible
assets like property, plant and equipment, and also intangible
assets potentially, if the company has been
buying, I don't know, trademarks, right of
use, type of assets. What happened also very often is that the company at a
certain moment of time needs supplemental external money
and will then consider either going back to its
shareholders and raise money, fresh money from
those shareholders. And all can go to
moneylenders like a bank and borrow money
from the bank, e.g. something that I can already share here with
you very quickly. And it's something tension
in the value investing, trading to go deep into it. But the high risk investments
normally are funded by cash and low-risk investments are typically funded by adapt. One of the main reasons
is that in fact the cost of depth is normally lower than
the cost of equity. And the reason for that is that depth told us,
if you remember, when I was introducing financial statements
and specifically the order of liquidation, the balance sheet on the liability side, the
orderly liquidation. In fact, lambdas come first
versus equity holders. Hence, their risk is smaller
than the equity holder risk. And for that reason normally, the cost of, let's say, borrowing money from
lenders should normally be lower than the cost of
borrowing money from capital. So from equity holders
are from shareholders. That's the main reason
to make it simple, and this is why high risk
investments should be funded by cash and low-risk investments
should be funded by that. Alright? What we want to achieve if we come back to the value creation cycle
inside the company. So remember that I've split it, the balance sheet into two. You have on the right-hand side, the source of capital with debt and equity on the
left-hand side, you have the company operations that are reflected very probably through an amount of cash
and cash equivalents, tangible assets and
intangible assets. What we want to measure here is the profits and how
good the company is generating profits
from its assets. So by doing that performance
measure, of course, we're evaluating the
performance of the management. That is in fact, normally converting
economic activity, so revenue, sales into profits. So we will introduce
the three measures of looking at the
performance of a company. The first one will be
written on equity, the second one will be
return on invested capital. Then you're going to
see there are some, let's say, variations to that. Some people like to look at
return on invested capital, including goodwill and other people like to exclude goodwill. Goodwill to make it short, is the premium
that has been paid on top of the book value
during an acquisition, during a merchant acquisition. In fact, my preference is to keep goodwill
in the calculation because I want to
see if the company has been overpaying
for an acquisition. And I'm comparing a company
I'm thinking about to invest into with another company
that has less goodwill. Well, maybe the other
company is better at generating profits with
a smaller balance sheet. So I tend to keep goodwill in my performance measurements are in my profitability
measurements. There is another one that also Warren Buffet has
been talking about, which is written on
that tangible assets that we'll be
discussing as well, which basically
excludes all goodwill and intangible assets
like trademarks, property and those
kind of things. So it isolates the
performance measure and the profitability measure purely on tangible
assets in fact. Alright, let's go into
the definition of it. So in order to
calculate the return on equity and what is
written on equity, in fact, you take the profits and in fact are going to
be very precise here. Typically, we use net
operating profit after taxes. Why? That's because it's
revenues minus expenses. Of course, you need to
remove the costs from the economic activity
operating because we're only considering operating
revenues and expenses. Profit is we want to see the bottom line of the
measure, an after-tax, because taxes are costs that
the company has to incur. And potentially there
are tax differences between one company
and the other because maybe one company has a better tax treatment
versus the other company. Typically when you calculate
the return on equity. So you take these net
operating profit after taxes, you exclude non-operating
revenues like revenues that are generated
from a cash investments e.g. and also you remove in
fact interests, expenses. It's arguable to be very fair. Some people consider that you could keep the
interests expanse in the calculation because as cost is a tax to the companies, so our interests
expenses as well. In fact, you can
discuss about it, but to make it simpler, consider that in typical
financial circles, return on equity is
net operating profit after taxes divided by equity. So I see on the right-hand side, which portion of the sources
of capital that I'm using. When you look at return
on invested capital. In fact, she was still using the measure of no pants or net operating
profit after taxes. But this time you
divide through, you divide by the
invested capital, which is in fact, you're adding to
equity the adapt. And to be very precise, Typically, again,
this is arguable. You're going to see through
a couple of examples, why does arguable typically
you could also say that cash, in fact sitting in the asset
side of the balance sheet is money that has
not been employed. And because of that, it's not considered
invested capitals. So when calculating
the return on invested capital, you could say, the formula could say that
it's no pants divided by depth plus equity
but minus cash, because cash is not
being employed. And even if cash would be
employed into generating interests revenue,
so finance revenue. In fact, you remember that in net operating
profit after taxes, that is in fact excluded. Here, judgement is required. You're going to see
how I tend to use it. I tend to in fact, to leave cash when you looking at invested
capital because I believe, I believe that cache
that is sitting in a bank account is an asset
as well to the company. And if the company has not
been deploying it or using it, well, that's a problem
of the company. So when I'm bench-marking to companies where I
will be comparing also how good they are
at employing cash as well from adapt perspective. And you're going to
see this is how I have set this up in the actual file. I'm only looking
at long-term dept. I could consider current assets
and current liabilities, so the net working capital. But to make it simple, in the other value
investing training, I consider that
invested capital is equity plus long-term debt. And I keep cash in, not removing from the
invested capital, the cash position in fact. Alright? So if there will be
one measure, I mean, I mentioned now here 33 versus four measures of
performance or return on equity, return on invested capital, return on invested capital, and you're removing cash and also return on
net tangible assets. If there isn't one that you have to keep in mind, it's RIC. It's as easy as that. Everybody when I mean, when I'm talking
to shareholders, when I'm talking to people about how to measure
the performance of a company in the sense
of how good the company is at generating profits
from its assets. I mean, 99% of the cases you have to think ROIC, that's it. Full stop. There
is nothing else. I will explain to you
why RIC is important, but if you wanna go
a little bit deeper, I mean, I recommend you
either looking at McKinsey. Mckinsey has a very
interesting papers about how to look at total
return to shareholders. Why growth is not a
performance measure by itself, because you can also generate growth in an unprofitable way. So growth has always to come at a profitable way and again, underwritten that is higher
than your cost of capital and your cost of capital has
to be higher than inflation. You see that how things
come together here. On the right-hand
side here you see the Berkshire Hathaway
2007 shareholder letter or letter to shareholders that Warren Buffett has written. And in fact, I've extracted a couple of
interesting elements. I mean, he's speaking
about three types of companies that generate profits. And what is very important here, he clearly says that a
truly great business must have an enduring mode that protects excellent
returns on invested capital. So for him as well, the most important
performance measure is return on invested
capital, full stop. So keep that in mind. It's very important, but keep in mind that good companies, they will have sustainable ROIC. And one thing, just to
be very, very clear, why we do not look
at return on equity. There are a couple of reasons. The first reason
or the main reason is that ROIC is a
better number than ROE because in fact you are adding all the sources
of capital into, let's say, the
profitability measure. And we will be practicing
this in a couple of slides. So I think it's fair
because you, I mean, at a certain moment in time
and what you had is you had companies or let's say
maybe two decades ago, people were maybe
looking more at return on equity as a
performance measure. And you may have had CFOs
that liked to raise Dept. And of course, that does not
appear in the written on equity performance measure
because return on equity, you are dividing the
notepad only by equity. So this is where return on invested capital is
a better measure. Because even if the company
will decide to raise capital through debt
holders or through depths, you will include the
dept as a source of capital in the
performance measure on how good, I mean, comparing at the
profitability of roses, it's total amount of
invested capital, which will be the depth plus equity holders and not
just the equity holders. For me to be very fair. Not later than four
or five weeks ago at INSEAD in San Francisco when I was doing model2 of my
inset RDP training, we discuss about that and
the professor was asking, is it ROE ROIC? And of course the answer
was ROIC as well. So I was absolutely
not surprised when we were discussing the financials
of corporate companies. The performance measures that also the Insert professor was, of course, and I would say, thanks God, because otherwise
it would have a problem in interpretation of
corporate finance and financial statements. Of course, confirming
something that was already clear for me since
many, many, many years. And again, something that
Warren Buffett mentioned in his 2007 letter to shareholders, that ROIC is the right
measure of performance, where you can argue is
if you keep cash or not, I tend to keep cash
in it, but okay. That's a matter of judgment that you have to
take into account. Alright, so I'll start with the very simplistic
example and then we will look at a couple of real companies with
Kellogg's and Mercedes. Here what I want you to do as an exercise is the following. So you have here two
companies and it's a fixture. So it's a theoretical but easy
to understand model where you have company a
balance sheet of 2001 company band of 2001. Company a has generated
a no pan of $1,000. You see it's a very
small operation and company B has generated a notepad for the fiscal
year 2001 of $1,500. Do you see that in the
balance sheet of company a, it has ten K in cash, five K in PP&E, and 200 in goodwill, again is a theoretical
example that is zero, so no leverage and
equity is 15 k dot two. So total balance
sheet is 15 k dot t2 on the companies be a
company B's balance sheets, you have the company
has cash 20 K, PP&E is 7.5 K and
goodwill 150 K for total asset side of
27 650k US dollars. And on the liability side, when you look at the
source of capital, and again, it's a simplistic
way of looking at it. You have adept at ten
K and equity at 17650. So what I want you
here to understand, that's why I'm using an
extremely simple example is you couldn't not
just say, I mean, if the question is, I want you to be able to comment which company is in fact a
better at generating profits. You could not just
say company B is better at because they have
generated a higher profit, that company a, that would be an unfair statement and that's
what sometimes people do. They do Just compare
profitability versus profitability without
taking into account, let's say the size of
the balance sheets and, or the, what is called
the capital structure. So how much debt and equity
the company carries? This is what I want
you to practice it. So what I want you to do
is that you calculate the return on equity with
the formulas that we saw. So the NOPAT divided by equity that you
calculate the ROIC. So that you calculate our IC, which is the formula notepad
divided by equity plus debt, you can decide to
remove cash or not. Here you're going
to see how the, how this impacts
the calculations. And then I want you to calculate the return on net
tangible assets. The net tangible
assets over total assets minus Intangible Assets, and then the total liability, so minus total
liabilities. Alright? So when you do the
math, in fact, you have, if you
look at company a, that has generated
one key US dollar of profit for the last
operating cycle of 2001, you have an array which
is of 658 per cent. That's one thousands of NOPAT divided by equity of 15 K12. The ROIC, if we keep cash in its remains the same because
company has no depth. Now what I want you
to do is compare the R0 E for company B. Company B has generated
more profits. So $1,500 on a little bit
higher equity, $17,650. And you see that the ROE, In fact for company B is higher than the ROE for company a. So the return on equity of
company B sits at H dot 50% while the ROE on company
a sits at 06:58 per cent. So if you would
only be looking at return on equity, indeed, he would very probably common, That's Company B is better at generating profits
versus company a. So I'll probably invest
intercompany be right. Okay. You would need
to do the valuation of the company versus how much you would need to pay for the shares of the
company, B versus a. But that's another story. We'll discuss that later on
specifically in chapter two. Now what I want to show
you here is that ROIC is a better performance measure
because you probably have already understood why I've took this very
simple example. That in reality, company
B is not as good as company, sorry,
generating profits. The reason for that
is that Company B, while only having 17,650 K of equity and without
generating $1.50 per cent. So $1,500. In fact, it would be unfair
to do that comparison, comparing return on equity of company B with return on
equity of company a. Y, because company B has
$10,000 of depth, while company a has zero depth. So when you do the math and you calculate now ROIC
and let's keep, for the sake of simplicity
of the example, you keep the cash in it. In fact, you would see that
the 1500s or the ROIC, the 1500s divided by the
total liability side. Debt to equity of company B
is only five, that's 42%. And we already calculated
the ROIC for company a as accompany a does
not have any depth. Well, the ROIC is equivalent to return on
equity of 658 per cent. And that's what I
wanted to prove you. That in this, again, it's very simplistic example, but it's really that you get. The point is that ROE is not
a good performance measure. It has to be ROIC. And for me, cash,
unemployed cash, I tend to keep it inside because I consider that
that has also a cost. And this should be part of measuring how good the company
is generating profits. I like to use, in fact
that total assets. So also keeping
in the cache e.g. so you see a said that they are ICF company B's only five dot 42% or the RIC of
company a six or 58%. Why did the ROIC
of company B goes down compared to the return
on equity of company B, which was sitting at
a top 50 per cent because the company has raised through debt holders
10,000 K. So in reality, with a bigger balance sheets from a proportionality
perspective, it's unable to generate as
much profit as company a. The right interpretation here is that company a is more
profitable than company B. Alright? You could do the same for, of course, real companies. And of course, in the axon file that has been the
companion sheets, the ROIC will be calculated
and I will be using in fact, the formula of total
equity and long-term dept, I leave current liabilities
aside because I consider that current
liabilities are covered by current assets, I could add net
working capital to it, which is different
between, between the two. But I decided for the
sake of being simple, that the RIC performance
measure is in fact net operating profit after taxes divided by long-term debt plus equity and I keep
cash in the calculation. So here, when you look at on the left-hand side
of our citizens and Kellogg's for the same
operating cycle of the fiscal year 2000 or
the calendar year 2022. You see in fact that Mercedes
has generated 3 billion, €627 million on a
total revenue of 154. So if you would just
divide those two numbers together and you would even
keep the interest income, interest expense. It's not. Those figures are small. You would see that Mercedes had the profitability
of four per cent, while Kellogg's at the
same moment in time, has generated 1 billion, $251 million of profits on a total net sales
of 13,000,000,717. So the profitability is
nine per cent in fact. But this is on the
income statement. Of course. The better performance measure
is looking at the ROIC. So if you would calculate
the ROIC for Mercedes, you would be adding
up at an ROIC. And I'll make it
very simple here. I would just take three. So you remember that in the
income statement and we have a net profit after
tax of 3,000,000,627. And I would divide it by the total amount of
equity and liabilities, and that would give me an
ROIC of one dot two per cent. If I would do the
same for Kellogg's. Kellogg's has a total equity
and liabilities of 17996. And again, I'm taking
here a shortcut. I could remove the current
liabilities on both sides. But it's a little
bit more complex for Mercedes because they are
also playing the role of a bank or financing their financing their customers for the purchase of their own cars, which is arguable as well. So I decided here to
make a judgment call and just for the RIC calculation to take the net income attributable to the
shareholders and I'm dividing it by the
total balance sheets. But I could adjust this
a little bit down. But if you see already here, if I'm just doing the same, I'm comparing apples and apples. Kellogg's 1,000,000,251 of
net income attributable to the Kellogg's shareholders
on a total balance sheet of 7,996 billion US Doris
is generating 695. So you see in fact from
this that it looks like that Kellogg's is not
better run company, but is able from its business to generate higher profits at
least for the year 2020. But again, as I said
in the Excel file, it will be automatically
calculated. The main purpose of this lesson is really
that you understand that the main
performance measure for company is
looking at it's ROIC, not on return on equity and not unwritten on that
tangible assets, really, you have to look at the ROIC and judgment
is required. As I said, I typically
look at RIC, I take the full
equity and I take the long term debt and I keep
current liabilities side, which would mean in fact, if I take an easy example
here for Kellogg's, if you look on the
right-hand side, if I leave the total
current liabilities aside, I do see that the long-term debt is sitting at 6,000,000,746. And I see that
equity is sitting. I would need to do
the calculation. No, it's here at 3112. So I would then probably have
to divide to have this is how it is calculated
and the axon far the ROIC would be
one to 51/6746, which is long-term
debt plus the 3112. So that would be a rough
cut, 9,000,000,858. So you see that you have a Kellogg's is having our IC which is close to ten per cent. So the one last thing, just to understand also why RSA is important to
management and where management can or if you are setting up the board of
directors or if you are a shower that where
in fact you can push management to improve the
performance of the company. In fact, the formula of ROIC, and we'll go now a little
bit into corporate finance. But just to give you a glimpse of how you can look into this, you could in fact, the formula, net operating profit divided
by invested capital. You could multiply it
by one and dividing the notepad BAR revenue
and multiplying the invested capital
by revenue as well. So you have not changed
the RIC calculation. What is interesting
when you do that is that you have in
fact various ways, various options where
management and board of directors can
push the needle. If you look here on
point number one, it's really about cost control
on the input prices, e.g. raw materials, and also
cost control on e.g. sales general administration. So the expanse of the
people in the company. When you look at bullet
point number two, of course, you could push the company
with the same amount of assets to generate more
revenue, more sales. Of course, this
will increase ROIC. And bullet point
number three, in fact, which is revenue divided by invested capital is the
efficiency of the resources. So potentially you
could through that also reduce the amount of assets
that the company has. E.g. as well reduces the
cost for raising money if the company has a big dept position
in its balance sheet. So that's the kind of
thing where management can improve the performance
of the company by really, you see that taking the initial RIC formula notepad divided by
invested capital. And now I've divided know
pepper revenue and I multiplied it by revenue
divided by invested capitals. So I'm not changing the logic
now the calculation of it, but this allows me to push
the needle if I would be the manager of the
company on various ways that I have to increase the performance and
of course increase the ROIC because that's
basically what investors wants. One thing that I learned
from Warren Buffett as well, and you're going to see
this when you will be analyzing companies, is that. Companies that have strong
modes, they have ROIC, which is close to 10% and
this for many years in a row. So that's in fact the
performance measure, that's the test that
you have to do. Does the company have, first of all, positive ROIC? First of all? And secondly, is it
somewhere close to 10%? And for a couple
of years in a row, if that is the case,
you are in fact, observing a company
that is able to charge a high price
is very probably to its customers or has modes like a monopolist
situation or duopoly situation where
prices can be charged high and through that
profits are in fact high. And remember when? And this is something
that we already discussed that
every investments, so when will bring us there is depth dollar of shareholders bringing capital
into the company. And that capital is
transformed into assets. That, that transformation
of capital into assets is carrying an
implicit cost of capital. What you want to achieve is that if you remember that
the return that you get on your assets is higher than the cost of
capital expectations. And of course, if
you want to avoid destroying value and
destroying wealth, your cost of capital has to
be higher than inflation. So when you bring
all this together, now going to be adding one technical term that is important to know as
well in your vocabulary. Because corporate finance is
the language of business, It's what is called the WACC, the weighted average
cost of capitals. So first of all, before I explain to
you how the WACC works very quickly
through an example. So the right formula
that we have to think is you remember that you
start from inflation. So everything. I'm not speaking
about philanthropy, but when you invest
money into something, your written has to be
higher than inflation. So we need to know
what is the cost or what is the amount of
inflation that you have? Depending on your
investment horizon? Of course you could if
you want to be on the safe side investment e.g. a. Us 30-year Treasury bonds, which is yielding e.g. at three dots 6%, if I'm
not mistaken lately. And of course, if you're
taking more risks, you want to have a
return that is higher versus the risk-free rate that is provided by
the US government, which is more or less
covering inflation. So by doing that, and remember we mentioned, and I mentioned the
term capital spread. It would be great if
you would be able to generate three investments, return on invested capital that is higher than
your cost of capital. But we will be speaking about weighted average
cost of capital, which is higher
than the risk-free rate of the third year, US treasury bonds, which
is higher than inflation. This is how investors and this is how
companies create value. They're gonna get cost of capital expectations
from their shareholders. And management has
at least to be on par with those cost
of capital expectations. But in corporate finance, we don't use the term
cost of capital. We use the term WACC, which is weighted
average cost of capital. What does it mean? I mean, if you just look
at the balance sheet, remember that on the
sources of capital, we have two sources of capital. I mean, we were
discussing this return on equity versus return
on invested capital. Return on equity is only considering equity as
a source of capital. Return on invested capital is
considering the credit told us plus the equity holders
as sources of capital. What happens very often
in companies is what we call the company has a
specific capitals structure, the capitalist structure
to make it simple as a proportion of how much of capital has been brought in by equity holders
versus depth told us, the WACC in fact is a
weighted average of, let's say, calculating the
cost of equity versus depth. And I will not go too
far into the details here because it's not a
corporate finance course. I wanted to just
that you understand that those terms exists. So when I was
initially mentioning that your written has to be
higher than cost of capital, has to be higher than inflation. Now I can say that
your return on invested capital has to
be higher than the WACC, has to be higher than risk-free rate and has to
be higher than inflation. How do you calculate the WACC? Well, it's pretty easy. I mean, depending on
the amount of money that you are raising from
equity and from depths. And of course the cost
that comes to it. I mean, if you want to
know the cost of dept, just go to your bank and ask for depending on what you would
like to have for 100s, thousands, million, 10 million. And they're going to tell you
versus your risk profile, what will be the cost for
you of raising that amount of money from or to borrow that amount of
money from the bank. So, I mean, let's
make it very easy if you are an investor
and in this example, you want to invest into
the market with you. Remember I said
that you should not raise DHAP to invest
into the market. You should only invest
your own money. But in this example, if
you would raise 63% of your investments through adapt and 37% through your own money, which would be equity. You could. In this example, let's
consider that the bank is giving you a 4% return or cost. In fact. On the depths. And you're considering
that's the cost, that your cost of capital
is 12% because maybe you're investing into more high
risk investment vehicle. In fact, as the 12% cost is representing only
37% of the inputs, which is an equity inputs. And the 4% is linked to 63% of the source of
your investments. In fact, the weighted average
cost of capital would be 696 per cent. Of course, your investment
has to match this, so you need to have a
return that is above this cost of capital
of 696 per cent. Otherwise you will be
destroying wealth, of course. But if you're able to earn e.g. 896 per cent and
you having a cost of capital of 696% while you have a capitalist
spread of two per cent. So you're actually creating more value to yourself by this. And this is how it works. Also this financing mechanisms, this is how it works
for companies as well. If the company has to go to
the bank and raise money from the bank versus the company is raising money from
its shareholders. Both half Cost of Capital expectations
for the shadows will be the cost of
equity expectation. And for the bank,
it will be the cost of debt expectation. And of course, the cost
of that will depend as well on your risk
profile as a company. And last but not least,
because, I mean, I remember many, many years
ago, I wasn't thinking. And you remember that I said in the introduction of this lesson that the cost of
depth normally is lower than the cost of equity because depth dollars half or they carry a lower risk versus equity holders,
which is true. Why then in fact, raising money from
equity holders, it's matter of equilibrium, what is called the
financial gearing as well, which is linked to in fact
with the capital structure if you're only raising
money through depths. In fact, the example
I was giving on the WACC was a
theoretical example. If you are financing
something with 63% of depth, very probably you will not get a 4% cost of depth
expectations from the bank. Very probably the
bank will consider you with a higher risk. Depends. Maybe, of course, if you're borrowing 1
million and you have already having 10 million
in cash in that bank, while they may be
considered that lower risk. But if you have
nothing from them, then maybe the cost
of debt will be 15% while the cost of equity
will remain at 12 per cent. So you see that then the
effect than the WACC, because of that, will be higher
than the cost of equity. So this is where in fact, at a certain money time this what is called the
gearing ratios, the debt to equity and
we'll be discussing debt to equity in the upcoming
chapter as well. And the solvency and the interest coverage
ratio just need, you need to keep in mind that it does not mean
that per default, the cost of debt is lower
than the cost of equity. That you should think. That you can finance everything
exclusively through dept, the people that you want to borrow money from
the depth TO loss. If you are not adding any
equity to the investment, they will then consider, you're asked as a
very, very high risk, and then they will
raise the cost of debt to extremely high levels. This is what I'm showing here. In fact, at the bullet
point number three, where if the amount of equity that you're
bringing in is really low at a certain time. The cost of depth, in fact, is skyrocketing and it
becomes exponential. So there is a right that
equilibrium to bring so that the cost of equity remains higher than the cost of debt. And this one I'm showing
here in this curve, but that's little
bit more technical, but just wanted to share this with you because
lot of people, when I speak about cost of
debt and cost of equity, they think that's because I said that because of debt is
lower than cost of equity, that they should
only raise money from external credit told
us and that's wrong. You need to finance something
with your own money. I mean, if you are
buying a house, the bank will expect
that you bring in a certain amount of your
own equity into it. And then depending on your
risk profile than they will provide you or make your
proposal for the cost of depth. So the interest rate
that you will have when investing into house e.g. that you do not own, but you need some kind of
depth for that. This is a gearing ratio that
we're speaking here about. Alright, so wrapping up here, so we are nearly at the end of the level
one fundamental screen. So remember that first test is, are we having blue chips? Is the company that you want
to invest into blue chips? Yes. Yes. No. Does the company have
earnings consistent for the last five if not ten years? Does the company currently, on its current share price
provide your price to earnings ratio that is
below 15 or even below ten. Does the company provide a
passive written two shells of at least four per cent
passively after taxes. Does the company
provides a return on invested capital that is
above 10% consistently? If that is the case, it looks like already starting
to look at a good company, you have not yet been
able to calculate what's the intrinsic
value that will be part of the next chapter. But the one last thing is, as we have been looking into financial powerhouses
and the debt to equity conversation
is also look at the solvency of the company
and how too much depth, in fact, can kill a
company's business in fact. So we'll speak about that in
the next lesson. Thank you.
16. Solvency, debt to equity & interest coverage ratio: Right, value investors. Last lesson of
Chapter number three. We are still, we are in fact
wrapping up the level of one fundamental tests
that we have to do. So in the next one will
be discussing solvency, debt to equity and
interest coverage ratio. So remember when we're looking at a balance sheet
and we have been now extensively discussing this in the previous lecture as well about the sources of capital. And that you have, again, you see how the pencil
comes together, that you have that as
a source of capital and equity as a
source of capital. One interesting measure as well. Then I like to look into is
the debt to equity ratio, which is basically the
ratio you calculate. In fact, you take the external liabilities of
the company and you divide it by the equity and
liabilities of the company. And this allows you, in fact, this ratio is a measure
of performance, but also of risks and
also of benchmark, of comparison with other
companies as well. One thing that I can
already share here is, of course, debt to equity and
it's the same for the RIC. I mean, you may have
industries that are more capital intensive
than other ones. So there are, in fact,
it's interesting to compare the ratios within
the same industry, but for you, nonetheless,
as an investor, if you're interested
in three to four to five different industries, while you need to
take into account that may be industries
that are less capital-intensive and
provide similar returns are in fact more
interesting for you. Alright, so coming back
to the wag very quickly, remember that the
cost of capital, or what we now call the weighted
average cost of capital, is a measure that is
averaged by the amount of equity that is brought in
versus the amount of depth. So in the table below what
I'm showing you here, e.g. if you would have a
cost of debt sitting at five per cent of cost of equity is sitting
at nine per cent. As a theoretical example, if the amount of debt
that you would bring into investment would
be zero per cent. The amount of equity that you would bring into
investment would be 100%. Your WACC would be equivalent to the cost of equity
at nine per cent. Of course, if it is half, half, you have half of the investment that is coming
from depth at a cost of five per cent and half of
the investment that is coming from equity at
the nine per cent cost, then of course your WACC is perfectly balanced
between the two. You're going to have a
WACC of seven per cent. If e.g. you have
1990 per cent of investment that is
covered by depth and that has a cost
of five per cent. And only 10% is
covered by equity. Equity has a cost
of nine per cent, while the WACC would be a
five, not four per cent. So keep, keep this in mind
that now when you speak about written has to be
higher than cost of capital. In fact, I mean that
return on invested capital has to be higher than the weighted average
cost of capital. This is where we
need to bring in also ratios like
depths to equity. So of course, when you remember
in the previous lecture, we were looking at a very
simple balance sheet of company a and company B, where I wanted to prove to
you through a simple example, the ROIC is a better
performance measure than return on equity. In fact, I did not show you, but I had already precalculated
the debt to equity ratio. Of course, debt to equity
ratio for company a is zero because if you
take depth divided by, so you take 0/15200, it will always be zero because
the company has no adapt. If you look at
company B, in fact, they're, the debt to equity
ratio is still okay ish. It's below one, but
it's 10,000 in terms of depth divided by 17650
in terms of equity. So it would not be now dramatic. And you will see that
afterwards at the end, I will conclude that having
a debt to equity ratio, of course it depends
on the industry but adapt to equity
ratio that is below three below to even
below one that five is in fact great to have because then the company
carries a lot of equity and has not too much
external leverage. What you can do, of
course, as I said, is you will find on a lot of websites on
morningstar.com, e.g. they will have already precalculated debt to equity
on the latest quarter. And here I was analyzing, I think it wasn't
thousand and 1,900,020. I was analyzing and
debt-to-equity of the latest quarter for
the car manufacturers. And you see in fact that
you have really, I mean, it goes from, I think
the highest one was Ford Motor Company with
the debt to equity of 309. And porch at that time, person has a very
specific structure. In the meantime, they have
IPOs and the ticker is P9 11. It's very funny,
in fact what they have chosen as a ticker. But I exclude Here Porsche
automobile holding. But you have like Ferrari
handed up to equity of 141 key I headed up to
equity of zero dot 14, which is extremely,
extremely low. Daimler Ag. So that's a Mercedes. In the meantime,
they had a debt to equity of one dot six c2, which is still not a lot, but it means that they
have more equity, 62 per cent more equity, sorry, 62% more
depth versus equity. That's what the debt to
equity in fact means. So a very concrete example, how in fact you remember
we are having this cycle, this value creation cycle, where capital comes in is
transformed into assets. We hope that those
acids generate the profit from the
operating cycle. Then company management and board of directors
and shareholders, depending on what
our reserve methods to those three,
let's say bodies. What has been delegated
to those bodies, they then have a strategic capital allocation decisions flow number four, if you remember reinvesting into assets flow number
five, ping of death, flow number six, giving are providing a return
to shareholders. This example, in fact, we are looking at
flow number five, so we are in fact reducing
the amount of that. So on the left-hand
side and we'll expand the example we're
having and we use this example of simplified
balance sheet a couple of lessons ago where the company has in terms of
sources of capital, a depth of $120 million
sitting in the balance sheet, and an equity with
the same amount at 120 million years old as by
pure coincidence, of course. So when you calculate
the debt to equity ratio, it's 120/120. So the debt to equity
ratio is of one. Now, the company has
generated profits. Let's imagine to make it simple at the company
has generated $20 million of profits and is using 100% of the
profits generated. Just, you know, they're
going to flow number five. So we're going to be reducing
the company management has decided we want to reduce
the amount of depth. So what happens is that
20 million of cash are burns from the balance
sheet and the balance sheets. So on the left-hand side, there is an outflow of $20 million from
the bank accounts. That outflow of
cash is going, e.g. to the debt holders. So to the lenders, let's
measure would be a bank. And the bank now has received
a payment of 20 million. What remains in the balance
sheet of the company is that the total
amount of depths, as you see on the
right-hand side, has been reduced 120-100120 -20. The equity amount has
remained unchanged. The company has allocated 100% of its profits to
the flow number five, so the equity there are
no retained earnings and have increased
the book value. So the amount of equity remains
the same, $120 million. Do we like that? Well, yes, we do like that. Why? Because the debt to equity
ratio has just decrease. Look at just make the math on before doing this
reimbursement of depths, it was 120/1 attendee, so the debt to equity
ratios of one. Now, in fact, we have
20 million lines of depth and the debt to
equity ratio went 1-083, which is a calculation $100,000,000 of depth divided by the same amount of equity, which is $120 million. This is deleveraging
as it is called. I do like those things as
well because I prefer that the company has less depths to carry in its balance sheet. That's always great.
But of course, in some industries you
will need to raise depths. And that sentence is
cheaper than equity. But nonetheless, the debt to equity ratio has to
remain reasonable. So in this theoretical example, you see at the debt to
equity ratio once down. So when we look at
corporate dept in fact, and you're going to see that I'm not speaking about it too much in the other value
investing tuning, I'm speaking more about it in the other reading
financial statements is when you do what is
called a vertical analysis, you look at what
are the substances but other bigger items
in the balance sheet. In fact, very often
if it is equity, but also the finance
liabilities of the bigger portion in
the balance sheets very, very often and of
course it varies. I mean, it's an car manufacturer that has huge
manufacturing plants, has to invest a lot
of money into R&D. It's something
different if you have pure marketing business
like Nike, e.g. where you outsource
a lot of things. So your capital intensity
is probably much lower. In fact, offer a franchise,
franchiser, e.g. so what the investors, what you have to look into is, of course, the size, the amount of debt
that the company has. And this is typically done by looking at debt to equity ratio. Also what we'll see is the
interest coverage ratio. So that's really the
cost not reimburse the adapt because the data has some reimbursement timeline set, what is called the maturity. And if you look into the other reading financial
statements course, I'm explaining how to
read the timeline of the liabilities because it's
not necessarily linear. So you are able already to
see what is the amount of money that has to flow back into flow number five
over the next e.g. six to seven years, there's gonna be a timeline for reimbursement of the depth that the company carries
in its balance sheet. And it's not linear. As I said, there may be peaks
in there as well. But for me, the two most
important ratio that I like to look into the debt to equity and the interest
coverage ratio. So with that, I'm introducing in fact the term that I
have not discussed yet. So you have understood how
to calculate debt to equity and I will tell you how
to test up to equity. There is another one, which is the interest coverage ratio. But before doing that, we will be discussing
this in chapter number five when we are looking
at external stakeholders, how they perceive the company that you're thinking
about to invest into. You have in fact, rating agencies like
Standard and Poor's, Moody's and Fitch,
you have other ones, but those are the three most
known ones that in fact rates the solvency of companies. And you gotta have those, let's say, ratings that go e.g. for what is top grades. Investment level is always considered AAA you have is
also for sovereign bonds. So four bonds. So for depth that is raised
by countries as well, countries also are
getting ratings, e.g. Luxembourg has a track
record on triple a ratings. Then of course, if the
solvency is going down, it goes from triple a
to double a, triple B. So that's still
investment-grade investments. And then when you go below, then it becomes speculative and you will understand
how to calculate it. So the source I'm using here, and I've put it
here on the bottom. I'm using a guy. Maybe you see the
book behind me. It's about company valuation. The guy is called us what
does move around and it's like really the experts
on a company valuation. In fact, he has written
a couple of books, is a professor at the Stern Business School
at New York University. And what is interesting
is that he in fact provides at publicly, I mean, you can download it. He provides in fact, how the ratings are linked, in fact to the risk
of the company. And what does that mean in
terms of cost of capital? And cost of capital
increases or premiums that you need to add depending
on the risk of the company. So let me explain the following. So we are discussing depth here. So when we're looking at depths, the first thing that
we want to test is what is the amount of
debt versus equity? So that's the debt
to equity ratio, very easy to take both numbers. We divide that by equity
and you have a ratio. What is great is
when that number is somewhere below
three below to even preferably below one dot five so that the
company does not carry too much depth, right? But that's not enough the
company in order to serve that depths as also
to pay interests. And that's the
interests expanse cost. So what we want to do
as investors to look as well is how much of
the profits I in fact, eaten up just in order to service the existing
debt of the company. And this is what is called
the interest coverage ratio. So typically what we do is we take the earnings
before interests and taxes and we divide it
by the interest expense. That is the interest coverage
ratio and that ratio. And you'll see on the
right-hand side on the table, depending on how that ratio, what the result
of that ratio is. If typically you are having an interest coverage ratio
that is below one dot five. Well, it means that.
What does it mean? It means that most
of the profits are in fact going to servicing just the
cost of the depths. Of course, if you have an
interest coverage ratio of one, that's the easiest one. Let's imagine the company
has generated 100 million of EBITDA earnings before
interest and taxes. And the interest expense
is 100 million as well, where nothing is left to do 45.6 because interests expanse isn't that reducing
it's not flow. Number five is not reducing
the amount of depth. The amount of depth is there. It's just the cost to
service the depths. And that's of course
dramatic because nothing is left even to
reimburse the adapts. So that's why you need to have an interest coverage ratio. Typically that is above, I would consider
above 105 about too, that's really,
really the minimum. So when you have an
interest coverage ratio that is below one,
not five or lower. I mean, I tell you the
company will vary, probably struggle a lot too. So we'd probably have to
restructure it stepped in fact. But if you're having, I
mean, you have companies that have interest
coverage ratio that are sitting at 13 times
or even ten times. It means that when you have an interest coverage
ratio of ten, 10% of the profits are in fact consumed to
serve as the depth. At the same time you
have 90 per cent that remain maybe to reduce
the amount of adapt. So with that also the
amount of interests, expenses may be going down
in the next operating cycle. This is how I have to
think about what that was, what the model
around says Through his tables on the
right-hand side, depending on the market cap. But if you look at large, I mean, I invest into
blue-chip companies. If you look at large
non-financial service firms that they have market
caps about 5 billion. I mean, he's considering that an interest
coverage ratio above H dot 50 is in fact
triple a rating. So the risk premium that you would need to add
to your cost of capital is only 69% at that time when the
calculation was done, that was January 2021. If you have an interest
coverage ratio of e.g. one of one, which
is 0-1 dots 25. You need to add to your
cost of capital a risk, let's say a risk premium
of 940, 6%, that's huge. And it's normal because asset with an interest
coverage ratio of one, I promise you the
company is struggling, seriously struggling,
and it's just surviving and taking all
the profits to reimburse, just service, to end to pay. In fact, the interest expense, not even to reduce
the amount of depth. So that's the kind of thing where you need to be
attentive and that's why you see how osmotic
neuron is matching. When you look at the 90814999, is considering that
as a triple C rating. And if you go back to
the previous slide, a triple C rating
is considered a very high risk investments. So that's speculative. Let's say zone. If you're having a
interest coverage ratio of H dot 50, e.g. he's considering this as AAA. Aaa is investment-grade,
top-level. Our premise of the
company will not go bankrupt just by its
interests expense. So that's the kind
of thing that you have to also understand and this will be calculated in
the actual file as well. And to make it simple, is the debt-to-equity ratio, the lower the better and the
interest coverage ratio, the higher the better. And this is something
that's when you will put in the actual file, the values. And we will be discussing specific appendix
that explains how to input the various how to
input the various numbers. You will see in fact, through color codes if
the debt to equity is low and also if the interest
coverage ratio is giving enough margin of safety on the amount of interest expense versus total amount of profits. To, to last very quick tests
that you could add as well, which sometimes are forgotten, is what I call the cash to market cap in the
context of depth. So it's interesting because
when markets are extremely depressed, it happens that. And here you have the example of Ford Motor Company at that
time when I was doing the analysis that the amount of cash versus the market cap. And remember what
the market cap is, the number of shares outstanding multiplied by the share price. I mean, you will nearly buying the whole company's
cash account only. This is how much depressed and Margaret was about fourths. So they were only
adding, I mean, if, if you would consider banning the total balance
sheet, the markets. So if you would have
the firepower to buy all the shares of fourths, you would actually buy. When you wouldn't be
buying one share, you will be buying 82% of
the cash account of fourths. And the rest of the
balance sheet was only representing 18% in one
singular share price, which is crazy low. So that's something that's, of course you need
them to compare with the amount of debt that
the company carries. But that's also a measure
that from time to time, I like to look when markets
are extremely depressed. It happens that
markets are giving me the company at a cache
to market cap that is, in fact very close to 100%, which is like crazy cheap. In fact. You have to calculate
this, of course, and I think it's calculating
the actual file as well. So this is what I
want you to do here, is that you estimate that you comments if you look
at Ferrari specifically, if you look at at that time when I was doing the analysis, the cash to market cap was
of 2.5th, nine per cent. And I want you to make
the interpretation. What does that mean? I'm wondering when you
are ready to resume. First of all, you pause
and when you're ready to resume, I will explain. So similar to Ford, where you were looking at 81, 97% while a Ferrari having a cache to
market cap of 2.5th D9. A. That means that
Ferrari is overvalued, or it means that it carries an extremely low
amounts of cash. It means that when you buying
one singular shelf Ferrari, that only 259% of the
share price is linked to their cash position
and the rest is linked to the other assets
in the balance sheet. In fact, this is how you
should do the interpretation. Alright, wrapping up a level
one fundamental screen. So let's just rehearse
very quickly. So first test is the
company being a blue-chip. So the company that you
want to invest into is2 blue-chip company is a big does it have strong brands? Seconds test? Does it carry
earnings consistency for at least five to
ten years in a row? Third task is the PE
below 15, even below ten, returned to shareholders
at least four to five per cent passive income, four per cent for
me, after taxes, you could say five
per cent pre-tax. Does the company generate profitability on its
invested capital at a rate of around 10%
in a consistent way. Does the company have a debt to equity ratio that is
below three below to even better below one dot
five so that the company does not have too much
debt versus equity. The interest coverage
ratio we want to have at least an interest
coverage ratio of three, which means that less than or let's say a third
of the profits I in fact allocated to servicing
the cost of the depths. Of course, the
higher the battery. Remember that on the
interest coverage ratio, if you are above a dot five, you are having in fact, only a ninth or tenth of the profits that are allocated to servicing
the cost of the debt. What are wrapping up here? Last, let's say
conclusion message that I want to share
here with you before we move into chapter
number four, which will be the evaluation
process will be calculating. And we wouldn't be
able to look at a share price that the
market is giving us versus how much In fact you value the company will be using
various methods for that. But here, one last thing
I want to share with you. I mean, we have seen
a couple of tasks, blue chips or inconsistency PE, returned to
shareholders, return on invested capital debt to equity and interest
coverage ratio. Please, again, do not
put your money into the stock market based on
one ratio. That looks good. It's a combination of
all of them, right? Of course, judgement is required because
maybe debt-to-equity will be tougher for
pharma industry, maybe tougher for, I
don't know, utilities, those kind of things that
are more capital intensive versus a pure franchisor, e.g. so you need to think about that. But with those tests, if you combine those tests together, you're going to see in fact that how the corn spreads
from the crop. And I mean, it's very interesting to do that,
but please again, do not invest your money into the stock market just
based on one ratio, that looks good, that
would be foolish. And as I told you, a two-month, too many people actually invest into the market
just by looking, e.g. at the price to earnings
ratio that is low in fact, but that's not good enough. You need to take into account
the other factors as well. Alright, wrapping up here, talk to you in the next
lecture and next chapter. In fact, which is the
valuation process, we're going to be discussing
couple of methods, how to value the share price of a company and comparing
it with the market. And if we having
this famous margin of safety of 25 to 30 per cent,
talk to you the next one. Thank you.
17. Case study : Performing a fundamental analysis with VingeGPT: Alright, the investors. So now, having finished the let's
call it the theory with some practical examples about
the fundamental screens, what we're going to
do now as we have now labs that are included
in the trainings, I'm going to show you how
to use VNGPT to, in fact, be very productive and efficient doing the fundamental
analysis of any company. Allow to access Vin GPT, I'm showing you can
here go to the website, you just type vingbt.com. You're going to see
the website loading, and after having loaded, you can immediately either
click here on GT Ving GPT, or if you go to Get Started, you go to another screen
where you also have the user guide that you can
download and also there, you can go to Ving
GBT as you wish. So if I go back to home, I'm just clicking
here on GoTo VingBT. We open a window on
the Open AI store. So you see you're having
now access to VN GBT. And so this looks very familiar
if you're used to ChanBT, but this is our
own IGBT that is, in fact, built on top
of the Open AI engine. As I'm always saying to people, it's not a wrapper
because you have a lot of custom GBTs that pretend to have their own data,
but they are not. It's just a facade on top
of the Open AI engine. I want to show you that this is actually so this is curated with more than 150 pages of our own knowledge, very
interesting knowledge, which is coming from
the courses that are available on
platforms like Udemis, Giulia skill,
success, et cetera. And the data points that are behind are coming from our own backend you're
going to see this. So we are practicing now
the fundamental screen. So the intention is
that you are able, let me just increase a
little bit the Zoom here. So the intention is that
you are able to very rapidly perform
the various tasks that we saw on the
fundamental screen. So the first thing
that you should do, and again, I'm doing it
now here in English, but any language
that is supported by the Open AI engine,
if it is Spanish, Chinese, Russian, Korean
and any language, French, German, you can, of course, interact with VNGBT
in those languages. But first, let's
take an example. Let's look at, for
example, I don't know. Let's compare Microsoft
with Apple, for example. So first, what you
have to ask is, as it is a new
conversation is do you have Microsoft in
your companies. So I'm submitting
a simple prompt. So you're going to see that winch what's
going to be doing. It's going to first
search in its knowledge. And so I'm saying, Yes, I would like you to perform a fundamental
fundamental analysis of the company as an example. So here what you're
going to see. You see, it's talking to the connector. So it's talking to our back end. So this is where we have millions and millions
of data points, and it's showing you
here because I'm doing the recording on June 26. It's actually structuring
the response as we have been teaching this course, as this course is structured. So you start with
relative valuation and elements like price earnings,
price of free cash flow. We look at dividend yields, dividend payout
ratio, share buyback. We look also at solvency
and financial health like debt to equity,
interest coverage ratio. The Altman Z score, there is a specific more advanced
training on the Altman Z score, which is a metric about
the risk of bankruptcy. And then we look at
profitability like RIC, for example, and
return on assets. And we have in VNC
for the time being, so we have 35,300 companies. We have 361 companies
who have mode, either white mode or
narrow mode information. In the case of
Microsoft, I mean, we have fueled, let's say, the VNGBT data back end
with mode information. You see that what is nice, as it knows the method of the
very interesting training. I immediately suggests
if you want to do a level two analysis of
the intrinsic value, which is part of the lesson
that you have not done yet, or even the Level three about Cosmo sentiment and brand value. But what I'm going to ask is, I would like actually to have Microsoft
compared with Apple. Can you analyze now
Apple and then do a side by side comparison of
both fundamental analysis? So let's see what it does now. I mean, I'm doing this life, so I'm just typing
the prompts as I think I should
submit the prompts. So you see it's again,
talking to our back end. So first, it comes back with the fundamental analysis here
now of Apple with a ticker. You see it comes with
the same structure. It comes with passive income. It comes with solvency, data, profitability, and efficiency,
and then also the mode. Then because I ask in
the same prom to do a side by side comparison,
you see, in fact, here that you can
easily have a side by side comparison between
both companies. So you can then, of course. And again, inch knows
that the next step would typically be a
level two analysis also called intrinsic valuation. Last prompt that I'm
going to submit here, I'm going to take another
company like, I don't know. Let's take a for example, Pepsi, and I'm going to
actually show you that you can have even
a quicker way of prompting VingPT is calling the L one or level one analysis. So I'm going to ask
now Vingch is perform a level one analysis for Pepsi. And the name of the
company is not Pepsi. It's I think Pepsi Co,
if I remember well. So it's again, talk
into the back ends, and it fetches, so it
searches for the data. And when it has found the data, it will then come back and
provide you the results. So I mean, it has to do also
the level one analysis. So you see it has talked, so it means that it has
received information back. So probably it has found Pepsi
in the 35,000 companies. Then you see it coming
back with a ticker name, the dates of the latest updates, and you see it comes back
with price earnings, price free cash flow, and
then again, same structure, passive income, shelter return, solvency, profitability,
and efficiency. So all of this is already
prepared for you. You see again, it has a white
mode and we have fueled it with the type of
information that is needed for value investors. And it even is now
suggesting to do side by side comparison between
the three companies, which is something that
we will not do now. So this one I wanted
to show you with a couple of simple prompts, and following the structure and the learnings that you have seen here using Ving gPT very, very rapidly, you can
have a quick analysis with one prompt about the fundamental
screens of a company. So let's move now into the
next part of this training, which is going into the
intrinsic iteration. Thank you.
18. Book value & Price to Book: Right, value investors. We have finished
Chapter number three, which was in fact the first
chapter where we're really discussing various fundamental
tasks that you have to do, which are more used as
a screening mechanism to filter out from your
investment universe. Already I'm some kind of
companies that could be cheap looking at those various ratios that we discussed, blue chips, earnings consistency,
price to earnings ratio, return to shareholders, ROIC, debt to equity debt and
interest coverage ratio. Remember that the analysis
of one ratio shall never be enough for you to invest into the stock market on
a specific company. Right? Now, we are starting
chapter number four, which is a very important
chapter as well, because we not do remember
when I was much younger. In fact, I'm now 50 plus, when I was much younger, I was always intrigued by
Warren Buffett when he was speaking about intrinsic
value and mean many, many years ago, I didn't not
really have a clue how to calculate the intrinsic
value of a company. And that's basically
what I tried to, all the learnings
that I was able to, let's say compound
and gather over the last more than two decades. Then I'm bringing up here
in this chapter number four and how in fact giving you various methods and
how to calculate the intrinsic value of
a company from there, in fact, that you
can compare it with the current share price and then decide if you have
this margin of safety. So remember this is again, what I'm showing
here in this graph. I told you in the very
beginning of this course, there is one graph
that I want you to keep in mind is this one. So typically what you
want to have is you want to be able to determine
the intrinsic value. So the real value, the accounting value
of the asset that you are potentially
willing to invest into. Being able to compare
the intrinsic, the underlying value of the
assets that you want to buy versus what the
market or a seller, if it will be private equity, is giving you and
what you want to have a margin of safety of
at least 25 to 30%. This is what I learned
from Warren Buffett and Benjamin Graham. Alright, And for that in fact, we will of course use various
approximation methods. Remember there is
no silver bullet, there is not one signal methods. There is. I mean, let's be very feather as one method is mostly used
by most of the people, which is a discounted cashflow, discounted free cash flow
to the firm calculation, but it's not the only one. And we will not be discussing
startups here we are really in the investment universe
of blue-chip companies, of mature companies that
are normally profitable. So I will leave the
Startup Valuation aside. That's something there's
a specific course on sort of valuations here. In fact, I'm gonna share
with you a couple of methods that you
could use in fact, to determine the
intrinsic value. So the first one we
will be discussing is the price to book. In fact, the price to book is something it's very
easy ratio to calculate. And it's basically
comparing the markets. So the firm's market
capitalization to its book value and to find
undervalued companies. Of course, as always, the price to book ratio as a
single ratio should never be used alone as a single
valuation of a company. And what I mean in terms of
interpretation, we will be, will be discussing this
through concrete examples of first very simple
theoretical example and then a concrete example on
Coca-Cola that I didn't 1,020. So what I can already say here is the lower the price to book, very productive means that
the company is undervalued. Why you need to, of
course, to be attentive is why is the market of the potential seller Providing
a price that is very low? Is it's related to the
company yes or no. And sometimes it can just
be that Mr. Market is depressed in general
above the market. And to be very fair, it happen to me multiple
times over the last decade, two decades that I was able to buy companies that were in fact having a price to book
ratio below one in fact. So here there's an important statement
I want to make here. So when we speak about the
book value of the company, it's basically the
equity value that you have in the balance sheet
to make it simple, right? So basically what
a company is worth and that's why I'm showing here very simplified balance sheet is you have the assets on the left-hand side of the assets are the conversion of the capital that has
been brought in, either through death tolls or through equity holders
into the company. And that's the assets
that are there. In fact, don't know, of
course, if the company has been generating profits, remember this flow number three. Then if the company has
decided to reinvest part of its profits in its own assets. That's flown number four, then of course the book
value will increase. I mean, we have been
discussing this, right? So the term book value of
the term equity value of a company is basically
what remains after. You are removing from the total amount of assets,
all the liabilities. That's basically the book
value of the company, right? So what I'm sharing here, It's the assets minus
the debt holders. So one very important thing
when you look, I mean, when you look at
how to calculate the book value of a
company, it's very simple. Again, you don't need a PhD, you don't need, I mean,
this is not rocket science. It's very simple,
but you need to understand the logic behind it. One of the things that
I always share with my students is that when you are willing to buy and assets, typically, like we're
speaking about, investing. So assets that generate profits, I'm not speaking a car. A car is not for me
and investment because the value of the car will
depreciate over time. But if you're investing
into company that has assets that are
generating profits, normally you don't buy a company for its
book value, right? And this is where we
will be discussing the methods of discounted
future earnings, discounted free cash
flow to the firm. Normally you buy a
company for what the assets will
generate in the future, then you decide on your
investment horizon. Is your future ten years down the road is it's 30
years down the road, as I tend to do for
very mature companies, because I believe
those companies will still be around in 30 years. That's very important
when you will understand. This fundamental thing is that you never buy a company
for its book value. So imagine that the market
is giving you the company at a price to book ratio of one
will be explaining this. In calculating this, it means that basically the
market is giving you the company just for what it is worth, removing
all liabilities. It means that the
market thinks that those assets minus
liabilities that remain if you're buying
them at a ratio of one, those assets will not generate
profits in the future. That's not logical, right? But it happens
from time to time. And this is where I want you as value investor to
understand this ratio. Because again, don't
buy a company for its equity or book
value by the company normally for the
future earnings, the future cashflows
that the company will generate on its book value. And this is where we
then discuss what is the ratio or the
multiple between, let's say what those
future earnings and future cashflows are telling
you versus the book value. But we will speak about that. That's another method
that we'll use later on for doing
the evaluation. That's the one I was using
the term discounted cashflow. The real term is discounted
free cash flow to the firm. That's really the one
that's typically is used in fact to do
valuation of companies. But we will discuss that in, I think it's in
the fifth, fourth, and fifth lesson of this
chapter, in fact, alright? So price to book ratio,
as already said, basically you take the total
amount of equity and you divide it by the total amount
of shares outstanding, diluted, of course, remember
you take the worst, the biggest figure that
is the diluted one, the price to book ratio of this because first we need to
determine the book value per share because
the market is giving you a per-share price. So you need to bring
it to the same unit, which is a book value per share. And then you compare
the market price to the book value per share. That's the PB ratio. So the price to book ratio. So you take the
current market share price and you divide it by the book value per share that you have in
fact calculated. Let's practice this first, first things first, a very, very extreme simple example. And then we go into Coca-Cola, which is a real-world example. So price to book ratio.
Remember the two formulas for us to calculate the
book value per share. We have here very
simplistic balance sheet. The company has 100 million of assets on the left-hand side, has 50 million of liabilities
on the right-hand side. And has, because of that, obviously the equity or book
value of the company is 100 -50 in terms
of liabilities on hundred million of assets
-50 min of liabilities. So the remaining book
value is $50 million. Imagine this
theoretical example, the company would have 25
million of shares outstanding. So the book value per share
is the total equity number, which is $50 million
in rats here on the right-hand side of liability divided by the number
of shares outstanding, That's 25 million of
shares outstanding. So it means that your book
value per share is 50/25. So it's true. In fact. Now, of course, what you
would need to think is, what's the current share price? And let's imagine that the
market would be, let's say, pricing this company
or one share of this company at
a price of four. So your price to book ratio, which is the current
market share price divided by the book
value per share that we just calculated being
of $2 would be four, because let's imagine
that would be the current share price for dollars divided by
the book value by $2. So price-to-book ratio
is of two infects. So what does this mean in
terms of interpretation? It means that that if you
would have infinite power, firepower, and you
would be able to buy the whole company basically. So from an accounting
perspective, the book value of the company
is worth 50 million, right? But with the price-to-book
ratio of two, it would mean that you
would have to spend $100 million to be able to buy 100% of the share
capital of the company. So let me again re-explain this. So if you would be able
to buy the whole company, that's just the book value. You would need to
buy the company and the book value per
share of $2 per share. So $2 multiplied by 25-minute
of shares outstanding. If you would have the
firepower with 50 million, if you would put 50
million on the table, it would be worth
at the book value of the company is worth. But the markets not giving you the company at the
price to book ratio of one. The current share
price is of four, so it's two times the book value would mean that in
order to buy that 25 million of shares outstanding and the current
share price of four. So 25 multiplied by four, you will need to put on the
table $100 million to buy 100% or so to become a 100%
shareholder of the company. So you're basically buying with a multiple of two
versus the book value, which is a 50 million. And you can bring this
back to a per-share thing. If you want to buy one share, you would need the book
value is worth two, but the market is
giving you at force. You need to pay twice the
amount of the book value. It's a book value of price to
book ratio of two low yes, it is because it would
mean that, I mean, of course we will
need to understand how much the company is, has been generating
profits in the past. But I mean, very probably let's imagine
that the company has been generated 10 million of profit on a normal
operating cycle with those 100 million of assets
would be an ROIC of around, let say ten per cent. Well, after five years, in fact, you already have, Let's say if you would
have spent $100,000,000, 50 million on top
of the book value. So five years of 10
million of profits. In fact, after the sixth year, it's full, full
profitability for you. This is how you need to think about this price to book ratio. In fact, I hope it's clear how you need to interpret this. Right? So the price to
book ratio typically was also very often news by
value investors for decades. And even Warren Buffett
has been speaking for very long time about this
price to book ratio. And very often value investors
have been considering that a good price to book
value would be in fact the price to book
ratio of below one. Again, as I said, when
markets are super depressed, you have great companies
that indeed are being sold below the book value. I'll give you a
concrete example. I have the case with BASF. I think I bought
a settlement time the company at €40 or share. I think at that time the
price to book was at zero dot seven BASF and
not go bankrupt tomorrow. So I was actually buying just the balance sheet of the
company at a 30% discount. So that's just crazy cheap. Of course. Again, one
ratio is not enough. You need to know that
the track record of the company as a company
good at generating profits. How much are you paying
versus its current earnings to avoid being trapped in what
is called the value trap. So those kind of things. So value investors
today consider that stocks that have price to
book value below three, cheap and even
below one dot five, it starts to become very cheap because you are buying nearly if you would have
unlimited firepower, you would buy the full price to book ratio of one
that five does with 50 per cent on top
of the equity value, you would be able to
buy the whole company. So the multiple is very, very low in fact. So of course the
ratio depends also. I mean, it depends
between industries. I mean, if you look
at tech companies, you will look at the
price to book value. I'm just speaking
about that ratio. Now, you may have companies where the
price to book value, and I'm considering
that you have an equity value
that is positive, otherwise the price to book, you may have a book
value that is negative. So imagine that, that
happens as well. But typically, in tech industry you have price to book
variations that are very, very, very, very high. We're speaking about Coca-Cola in the next slides
and then we'll share with you why Coca Cola's
stands today as well. So again, I just want here to repeat that one single ratio is not good enough to take
an investment decision, but the price to book ratio
is a very interesting one. And it allows to compare what is the market valuation
of the company versus what is the
accounting value of the balance sheet
of the company. But remember again,
you're not buying a company for the value
of its balance sheet. You're buying a company
for its balance sheet, but the earnings that
will be generated in the future on that
balance sheet, on the assets that are
sitting in the balance sheet. That's really the
logic behind it. Alright, a real-world
example after this, very simplistic to explain the interpretation
and how to calculate book value per share and
price to book ratio. So it's Coca-Cola. Coca-cola has been a
blue-chip companies since many, many years. I even think they are. Consider the dividend king
on dividend aristocrat, I think they have been for many, many decades
increasing the amount of cash dividends
being paid out. And when I did the analysis, I think today Coca-Cola
is rough cuts valued at 63 or $69 in April 2023. When I did the analysis in 2020, it was worth 40 eight.06. In fact, what I want you to do, so I've put here at the balance sheet on the
right-hand side, it's a US gap balance sheet. So we have the assets first
from very liquid to illiquid. Then you have the
liabilities of foreignness, short-term liabilities,
long-term liabilities, and then the equity part
on the left-hand side, we have the income statement. So what I want you to
do is I want you to calculate the price to book
ratio and to comment it. So in order to calculate
the price to book ratio, you need first to calculate the book value of the company. In order to calculate
the book value per share of the company, you need, in fact, take the total amount
of equity and divided by the total amount of
shares outstanding, take always the diluted one, which is the bigger denominator
that you will be using. So it will actually reduce
the book value per share. Then you compare it, compare it with 4806. Let's imagine it would be
the share price at that time because we're looking at it
2019 balance sheet as well. Alright, when you have
done the calculation, please then suppose
you are now try to look here in the balance sheet
and the income statement. Where are the figures
that you need? And then pause and
when you're ready to when you have done
the calculation, then please resume
because I will be explaining how to
do the calculation. Alright, so resuming here. So in fact, as I said, the first thing that you need to calculate is the book
value per share. So the book value per share is the total amount of equity. So in this case, 21 billion 098 divided by the total amount of shares outstanding diluted, which is a bigger number at which you're sitting
at that time and if 2019 at 4,000,000,314. So with that, in fact, if you do the
calculation, you have, in fact the book
value per share, calculate it at four
dots, $89 per share. And then you compare the photo, the 1800s dollar
per share with at that time it was April 2020. The market was, let's say, evaluating or selling Coca-Cola
shares at 40, eight.06. So take those 4806, that's the market price, the current market
price, at least at that time when the
analysis was done, and then divided
by the book value per share that you calculate on the 2019 full year
balance sheet, this gives you a ratio of 982. This is your price to book. Is it? Hi, Molly us. It means that you
would be buying ten times the balance sheet if you would buy
into the company. One detail here that, I mean, I'm really speaking, but there's much more in the art of reading financial statements, which is already more
advanced training for value investors. But one thing that I want
to be very clear here, I said that in order to calculate the book
value per share, that you take the total
amount of equity, you divide it by
the diluted amount of outstanding shares. In this case in Coca-Cola. When you look on the red
frame on the right-hand side, you see in fact
that Coca Cola has a total amount of equity
that is bigger than the equity attributable to the shareholders of
the Coca-Cola Company. You have a line in-between
that is not in bold, which says equity
attributable to non-controlling interests
sitting at 2,000,000,117. So this is now, let's say accounting technique, but I'll put it in a simple way. It happens that those big
companies like Coca-Cola, they have subsidiaries
that they do not own 100%, they may own them at 90%. 9085 per cent. Accounting rules allow
the company, Coca-Cola, group level to consolidate
100% of the balance sheet of the subsidiary into what you're seeing here in the balance
sheet on the right-hand side, for the remaining ten to 15% that are not
controlled by Coca-Cola. In fact, you will see in accounting terms in
the equity side, in the equity, let's say
items of the balance sheet. You're gonna see this line. This is equity, there's
attributable to shareholders that are
outside of Coca-Cola, e.g. the remaining 15 or ten per
cent of that subsidiary, e.g. so in reality, when
you have this setup, you would need to recalculate. And this is what I'm
doing in the next slide. So the book value per share, you should not take
21 dot $0.98 billion, but you should take
18000000981/4000000000 of shares outstanding, you would end up at the
book value per share of photo 39-year-old
zeros per share. And you see the effect
on the price to book. So before it was 982. Now as you are dividing
by four dot 39, in fact, you are ending up at a price to book ratio of 1094. So nearly ten per cent more, which is normal because, I mean, from 201098, I have removed basically
10% of the equity of minus 211 $7 billion, which are attributable to shareholders that are
outside of Coca-Cola. And you are in fact, if you're
buying a Coca-Cola share, you are Sharona of Coca Cola. You are not an non-controlling
interests shareholder. I mean, just be
attentive to that. It's a small detail. But you see that here in this case of Coca-Cola,
That's smart. I did it in a two-step approach. If you take the total
equity, in fact, you keep the non-controlling
interests inside, you're going to in fact, let's say overvalue
the book value per share on what you need to do
is really to think, well, there is a portion of Coca-Cola consolidated that if I
buy a Coca-Cola share, I'm not owning, So
we'd actually need to remove non-controlling
interests over total equity. Alright, so this is
a concrete example. So just wrapping
up here, I mean, as I said earlier, I think that Coca-Cola
is today April 2023, valued at 63, $70 per share. And I'm very quick looked at Morningstar on the
latest price to book. And indeed you see
at the price to book of Coca Cola
has been pretty constant at 11 to 12 times
over the last years. And how you interpret this? Well, it's expensive. So if you would just
consider the price to book and we'd consider
that all the other tests will be ticked off the price to book of Coca-Cola
with a multiple of 11 times buying
the balance sheet is for me just too much. I will show you in
the next lesson how potentially you could adjust the book value either by looking at intangible assets like
the brand value or e.g. property, plant, and
equipment that is very often carry it at cost in
the balance sheet. But we will discuss
adjusted book value and you will see how this
will impact in fact, the price to book of Coca Cola moving forward versus
what we just calculated. So talk to you in the
next lesson about adjusting the book value of the Coca-Cola Company
or not so general how to do the adjustment on
a book value. Thank you.
19. Adjusting Book value & Price to Book: Right, next lecture in
chapter number four, we are in the level
to course content. So this is more
technical one and the intention is
after having shared the fundamental screens
which are used in fact to filter out already on
your investment universe. Here we are really looking
into valuation of the company. We started with price-to-book. And I'm going to show you
in fact the how I do adjust the book value of companies
which obviously will have an impact on the price
to book ratio of, we're going to be practicing
this on Coca-Cola as well. So the first thing, I mean, mostly when I'm in something I learned also
from Warren Buffett, there are two main elements when being able to potentially review just the balance
sheet of a company, specifically the asset
side we're gonna be discussing about
brand valuation. We're gonna be
discussing the valuation of property, plant,
and equipment. So I started with brand first. And I in this course are really focused
on the brand thing. I will very quickly address the property plant
equipment readjustment. So remember that we were
discussing in the beginning, and I've been defining
what is Modes and modes, as you have understood are. So it's basically
brand strength. Those are companies, the
companies that have modes. It's, they have
an empire that is very difficult to attack because either it requires
huge amounts of capital that some people are not willing to put on the table. Or the brand is so strong that people will
just stick with the brand. Remember the example I was
sharing about Gillette, e.g. in the world of shaving
for men amongst others. When one of the things we will be discussing these in
level three as well. Another thing that
I like to look into as I do invest into
blue-chip companies. And you remember when I was
discussing my blue-chip, I was showing you how I set up my monitoring
investment universe. And I take, amongst others, the top 100 brands in the world. And I'm lucky there
are a couple of brand agencies like
Interbrand, Brand Z, etcetera, who in
fact provides on a regular basis the
valuation of those brands. And when you see about
valuation of the brands, you may ask yourself, well, how does this relate
to the book value? Well, in fact, in the balance
sheets, if you remember, so if I take a US
gap balance sheet, you have like the very
liquid assets like cash, cash equivalents,
inventory, then you go into more long-term tangible
assets like buildings, office space, so everything that is
property, plant and equipment. And then you have the
intangible assets and then you have to make it very simple. Two categories, goodwill,
the premiums that are coming from acquiring companies and the other intangible
assets are trademarks. It could be R&D as well. That would be potentially put into would not
be expanded but capitalized and also so
everything that is trademark. So this is where brands sit. They sit in the long term intangible assets of,
of the balance sheet. And IFRS remember, it's
just the other way around. So it would be the first long-term intangible
asset category. In fact, the main, the main question for
value investor is, how is the strength
of the brand? How can that be reflected
in the balance sheet? And is the company
already reflecting it? And what is the standard
that the company is taking? Is the company taking more defensive stance
or is it taking more aggressive
stance on valuing the brand and the strength
of the brand of the company. And as I said, we'll be discussing very quickly
the property, plant, and equipment
undervaluation that you typically have
in balance sheets, which will, of course then have an impact on the
price to book value, the book value per share. And I will also discuss
the brand valuation, which is an intangible
long-term assets. So a key question,
and actually it's a question I've been asked in a webinar that I've
been recording, sorry, that is not out yet for new, let's say training platform
in the US where they one of the one of New York
option trader asked me. But when you do the adjustments of a brand and we were
discussing Spotify, e.g. which is for me know,
the blue-chip company, but they have a strong brand. He was asked me, but are you
not counting twice when you are adjusting the balance sheet
with the brand valuation. And if you take the value
of Interbrand, e.g. and that brand value
is ten times higher versus the brand value that is carried in the balance
sheet of the company. I think that it requires some clarity and it's
something that I've only been adding now in this
course in 2000 2023 update, which is when you
discuss brand valuation. In fact, you have two ways
of reflecting and adjusting brand valuation in the financial statements
of the company. The first one is that you
would potentially in, because the company has a mode, has a strong brand, you would apply that to the
financial cash flow models. And we will be discussing
this in this chapter when we will be introducing you
to discounted cashflow, discounted free cash
flow to the firm, and discounted future
earnings as well, which is basically linked to
the income statement while the discounted free
cash flow to the firm is linked to the
cashflow statement. There. In fact, you could decide that in terms of
brand valuation, if the company has a strong
brand that you would adjust the revenue
and sales velocity, you would adjust revenue growth. You would adjust the
margin levers and investing expenses in those cashflow and future
earnings projections. The second way of, let's say, let's say integrating
the brand valuation is looking at the
intangible asset side of the balance sheet. And I have decided that's
a personal choice that I will focus on adjusting the
book value of the company. So adjusting the
balance sheet of the company for the first, let's say option that would
exist which is adjusting the cashflow and future
earning matrix, I consider. And it's a judgment call. That's why value investing
isn't odd as well. I consider that the
brand strength, if the company has already mode, is already integrated in
the current earnings, in the current margins, in the current revenue growth, in the current return
on invested capital for the last couple of years. In the consistency of profits for the last
five to ten years. There are indeed, and
that's my choice again, if I would then adjust
those variables, like revenue growth, margin levers the
amount of investing. I think then I would in
fact calculate twice. I've decided only to look if the balance sheet is
undervalued on property, plant and equipment, and intangible assets sides of this trademarks,
those kind of things. So that's a choice. You can agree, disagree to it. I'm just explaining why. When I'm taking the
value of a brand, I'm taking property, plant, and equipment that
is carried at cost. I'm only adjusting
the book value of the company and not
the discounted cashflow, discounted future
earnings because I believe that's
already integrated because you're basing your future assumptions
if there's a 1020, 30-year investment horizon
on already existing modes. So that mode already is
producing high profits. That's why you
have a high return on invested capital, e.g. which is basically showing high profitability,
the asset turnover. Alright, so I'm gonna give a concrete example on
Coca-Cola and Coca-Cola. This is the brand valuation. I think it was 2019 when
I did this exercise. And the logic you can take
the 2022 numbers is the same. So Coca, Coca-Cola in that year was position number five of the top 100
brands in the world. And it had Interbrand
Institute was estimating the brand value to be at 66,000,000,066, $341 billion. So I showing you the example, I took the balance
sheet of 2019 of Coca-Cola and you
can do the same today with the 2022
into brand valuation. You can do the same with
the 2022 balance sheet. If Coca-Cola, it
remains the same, just the figures
we change in 2019. In fact, when you look at the balance sheet on the
left-hand side of Coca-Cola, you see that Coca-Cola was referring to trademarks
with indefinite lives. That will carry it a valid
in the balance sheet at nine dots to $66 billion. Okay? So it means that I'm taking
maybe a shortcut here. I don't believe it's a
shortcut, but I mean, it's the only line that kind of mentioned there could be
other intangible assets, but that's just 62,017
million, so it's not huge. I've considered that
the trademarks with indefinite lives,
those nine dots, 2 billion, that's what interbrand has valid
at 66.3 billion. So basically, when I do this adjustment of the
book value of a company, if the company has
a strong brands. In this concrete example,
just do the math. I take the difference in order
to avoid counting twice. I take the difference
between what interbrand is giving me $663 billion, what the company carrots in its balance sheet so they value, let's say indefinite trademarks
that NANDA to Bill and the difference is 57
billion between the two. And I add this to
the balance sheet. So it's basically,
technically speaking, I'm increasing the amount
of trademarks 9-66. 606341. And I will show you how, what's the impact on the
calculations on book per share and also the price to book ratio versus what we just
saw in the previous lecture. You have the Simon Property
Plant and Equipment. And of course, if you
don't read the footnotes, will not know that
typically lands. If it is IFRS companies
or US GAAP companies, that land is first of
all, not depreciate it. And very nearly all the time, land is carried at cost. But we all know, I mean, if you bought, if you bought a piece
of land 30 years ago, just due to natural inflation, that piece of land is worth
much, much more today. And I'm going to show
you it's an extract from a more advanced course that is called the art of
company valuation, where I've did a
precise calculation how to readjust the
book value of Reshma of this luxury brand
holding by really looking at the land
that they were carrying in their balance sheet. This is what I'm showing
here. Those are three slides. Again, it's not the
purpose in this course. The other value investing, I'm purely focusing on brands and Mode Adjustment
on the book value, not an adjustment of the PPE, but I mean, to be completing
the explanations, there is an
opportunity to adjust the book value of companies in their balance sheets
book value by looking how much land they
carry and then potentially readjusting
because that land, except if I mean, if the soil is contaminated
and there would be a cost to, let's say, clean that up. But if it is normal land, that land has increased
a lot in value. And now what's showing here? I show you the three
slides very quickly. So really small in
fact has rough cuts. Property, plant equipment
worth 99 to 10 billion. To make it simple. With accumulated
depreciation, It's like net PP&E is like 6
billion rough cuts. And in fact, the land that
they carry, of course, need to find out what
has been the cost of inflation where they
are having the assets. You imagine that this takes
more time to evaluate. And in fact, I
looked into it for the other company valuation
advanced training. I looked into all the
balance sheets of the company since 1989 to 2020. I estimated that there wasn't 148 million undervaluation on
the land assets of Reshma. So of course what did I do? And I'm going to
show it now here on the brand because
it's the same thing. It's an asset that
I'm readjusting, that I'm increasing,
not artificially. It's just that I'm
making a judgment call on the asset that is carried
in the balance sheet, how it is reported
by the company, and how I believe it
should be reported. If I mark the lands to
the current market value, and if I mark the brand value
to its market value on the, on the balance sheet only, not on the discounted cashflow, discounted future earnings
for what I was explaining before he ended concrete
example of Coca-Cola. So we have a balance
sheet of Coca Cola. And remember I was showing this in the
previous lecture that Coca-Cola has 2
billion rough cut of non-controlling interests. So that's, let's say percentage of
scholarship that is outside of normal shareholder. And those are minority
shareholders. But Coca-Cola has
fully consolidated their assets and liabilities
in the balance sheet. The equity book value of
Coca-Cola, if you remember, was 189814, rough cut
photo 3 billion of shares. So total amount of shares
outstanding, diluted, right? So you remember what I just mentioned a
couple of minutes ago. So I'm adding 57 billion
because Coca Cola is carrying its trademarks with
indefinite lives at nine was at $9 to 2 billion. Interbrand is telling me what the brand of Coca-Cola is worth. In fact, the asset, the intangible asset
is worth 57 billion. Sorry, it's worth,
that's the difference. It's worth 66 dots 3 billion. So I'm adding just a difference between the two to
avoid double counting. So I'm adding to
the trademark line. I'm adding, I'm going
from nine dots to, to infect those six
is six to 3 billion. So I'm adding 57 billion of us dollars of
trademark value. What is the impact of that? Because remember on my balance
sheet has to be balanced. So i'm, I'm changing, I'm increasing the asset
side automatically. I'm just increasing the
equity side because that's the only way I can
reflect in fact, the change addition
in brand values by recalibrating the balance
sheet on the equity side. And of course, this has an impact because I then have to recalculate
the price to book. You remember that we were
having a price to book value of 1094 in the
previous lecture. And by increasing the
book value by 57 billion. So my total equity becomes
76 billion instead of 189. So my adjusted book value
per share is now 17, $63 per share at that, I mean, taking the
fingers of 2019. If I was thinking about buying
the company early 2020, in fact, I would then do
an adjusted price to book. So what has changed is just the value of the
equity that has changed. I'm no longer on the
book value per share, taking the equity
of 189 billion and dividing it by the total amount of shares outstanding diluted, which was photo three. But now I'm taking
the $76 billion and dividing it by the same amount of shares diluted, outstanding. And then I have a
book value per share, which is 17, not 63. Then I adjust, of course, the price to book because I have a new book value per share, my market price has not changed
at that moment in time, keeping the figures
constant so that you can compare with
the previous lecture. So at that time the
market was giving me a coca-cola shared
Fourier dot $6 per share. Now I'm dividing by the
adjusted book value per share, which is now a 17, 63 years dollars per share. And suddenly my adjusted price to book
ratio came down 1094-2, the value of 72. So you see how brand companies
that have strong brands, you can in fact adjust
the balance sheet and at least on
the price to book, it will tell you, I mean, having a price to book of 11 versus a price to
book of two dots 72. It's a different
story. You remember that I said that value
investors like to have price to book value
that are below three. I'd love to have
them below one dot five and even to have them below one because it's telling
me that the market is giving me the company at a discount just on
its balance sheet, not even looking at
the future earnings in the future profits
that the balance sheet, so the assets of the
bank to regenerate. That's, that's what I
wanted to share with you. So you may argue that you
agree or disagree with this, but that's also something
that I learned from Warren Buffett that you have, at least from my learnings
over the last two decades, you have those two elements that are typically undervalued for blue-chip companies is
the string of the brands. And it's very often the land
and sometimes the buildings, but the land very
often if you read the accounting policy footnotes, it mentioned that the land is
very often carried at cost, but if that land has been
bought 40 years ago, sorry, just because
of inflation. If that land was bought at 100 million and that
land is valued at 100 million without
depreciation in the asset side of the
balance sheet, it says 100. Of course it has an
impact on the equity, but it's maybe worth 300. So you would need to add 200 million to the
equity side as well. So those are I will
not say tricks, but this is judgment
which is required. And this is the beauty of
cost of having strong brands. Because if you have
a small company that doesn't have, let's say, pricing power towards
its customers and customers easily switch from
one brand to the other. Well, there, I mean, you will
not have the opportunity to adjust the book
value of the company. So to adjust the balance sheet, maybe you can adjust it on
the land very probably, but on the brand, on
the intangible asset, you will not be able to do that. So this is something so the adjustment of the book value
on the intangible asset, It's by the way, is something
that you can do as well for growth companies
at something e.g. that I did for Spotify in this webinar that I recorded
a couple of weeks ago that will be hopefully
published very soon by this new US investment
learning platform. But, but that's
something that is applicable as well
to growth companies. But remember, we're
not looking at just one ratio to take
an investment decisions. But here I'm giving
you ways on how to do the intrinsic
valuation of companies. And first, I've started with the book value of a
company per share, and then also now the adjusted
book value per share. And through the multiple that comes out of
that calculation, the price to book or the
adjusted price to book. It gives you an indication if the market is considering
the company to be expansive of the
market is giving potentially the company
way at a bargain. So that's the kind of
thing that you need to know as well and you
need to read this. Of course, this is reflected in the Excel file in
the companion sheet. So you will have
the opportunity to, I add in fact the brand value. Then depending on that, there's
gonna be an adjustment. So you're going to
have the calculations of adjusted book
value per share, an adjusted price to book
next to the book value and standard price to book as well in the companion sheets. So wrapping up on this one and in the next one
will be discussing dividend discount
valuation models with growth, without growth. But we will discuss in the
next lecture. Thank you.
20. Dividend discount valuation models, growth model & total shareholder return: A comeback investors
chapter number four. So you remember we
are in the level two part of the tests
and level two-week. Remember, we are discussing valuation methods or
calculation methods to estimate the intrinsic value of the company that we are
potentially interested in. So in the first two
lessons of this chapter, we discuss price to book, so we were able to determine
a book value per share. And also I showed
you how to adjust as well the book value per
share take into account e.g. brand valuation and or
property plan and equipment. In this third lesson, we'll be discussing dividend
discount models. In fact, it's not just one. But you're going to see
that I will be introducing three ways on how to
in fact calculate, approximate the valuation,
the intrinsic value of company by looking at its dividends and share
buybacks as well. So something that I already shared with
you a couple of times, but I will repeat it. Sorry for that. I will
continue repeating this a lot of times is when
investors buy companies. If you are buying a share of
a publicly traded companies, typically, you should have two type of cashflow
expectations. The first one is while
your money sit still, if you remember what I said, that you get dividends
or some kind of passive return while
your money sits still. From the moment you have
bought the company until potentially the day you are
selling of your position. And a second, Let's
say kind of return is when you are selling your stock at the end
of the holding period, of course you're hoping
to sell the stock. So you hope, I hope
for you that you have both the stock
with a margin of safety it wasn't versus intrinsic
value 25 to 30% below its IV. And the second cashflow that
you will receive is in fact, the moment you sell
your position that you will see written
coming in there. So when selling the shares of the company that you bought, maybe one to three years ago. So those are the typical two
types of caches that you have to think about when. And in order to determine
the intrinsic value, you can actually on the
first type of cashflow, use the dividends during
the holding period to estimate the intrinsic
value of the company. And I'm introducing
here what is called the dividend discount model. And why, why can we use dividends as a way to determine the intrinsic
value of a company? Well, it's pretty easy. In fact, let's say
pretty straightforward. Not necessarily easy,
but it's pretty straightforward as it is. One of the only two caches
that you will see is in fact, you could make the sum of all
the cashflows that you are expecting from the company in the future, of course,
risk-adjusted. So we have to adjust that to the amount of risk
that the company, in fact carriers, remember
this risk versus return. If it's a small cap company, the risk premium will
be higher if it is a big cap company,
omega cap company. And potentially you
have also learns how to look at the solvency like if the debt
to equity ratio, interest coverage
ratio, or goods, probably the annual
returns have to be brought a little bit
lower, of course, always above the cost
of inflation and above you're expecting
to have written that is above your
cost of capital. So basically what
we will be doing and we will be doing this
in the next lesson as well. We will be bringing into
its present value of expected future cash
flows and discount them at a cost of capital or return expectation that you have related to its riskiness. So the two initial models, I will be introducing
the third one later on. But the two initial models
that we will be discussing and practicing is in
fact the first one is a stable growth
dividend discount model. So it will be
abbreviating it TDM, where in fact the
company in the future. I mean, what you can expect is that the dividend will not grow. We're speaking here really
about cash dividends. And we are speaking about them pre-tax to be precise,
not after-tax. You need to take into
account that you may lose maybe 15 to 25%, 30% of the amount
that we're discussing here just because of
your tax exposure and this is country dependent. So what I'm saying is that the first model
being introduced is the stable growth
dividend discount model. The formula for
that is pretty easy as we are thinking about valuing the share of a company by bringing
to its present value, the sum of all the
expected future cash flows discounted at a rate which is appropriate or
which is risk-adjusted. In fact, the formula for
the value per share of a stock using the dividend discount model
method is basically. You sum up all
expected dividends per share and the future, and you divide it by
your cost of equity, which would be your
cost of capital. But as you're not raising debt, and typically dividends
also linked to equity. If you would look at the
Guatemala Iran valuation books also is always dimension
of cost of equity, but you could say its cost
of capital, it's the same. So that's the first formula
that you have to know. And of course, in
the companion tree, this is being calculated
automatically, but you will need to
tell the model in the excellent companion
sheet is what is the amount that the company has been paying off
in the latest year? And this will be taken as an assumption then to estimate
the future cash flows. And of course discounted
at the rate that you will have decided to put it
in the companion sheet. The second model is called
the Gordon Growth Model. And you may recall that we discussed briefly already dividend kings and
dividend aristocrat. So you have companies
that for the last 25, last 50 years have been increasing their
dividends year over year. So the dividend discount
model would not be able to reflect this in, let's say in the formula. So the Gordon Growth Model has, in fact is an extension of the EDM model and the formula
goes the following way. So the value per share of stock for Gordon
Growth Model is in fact the expected
dividends per share over time until infinity. And you're dividing
your cost of capital, but from your cost of capital, you are in fact removing
or subtracting, in fact, your
dividend growth rate. And we will be practicing this. Let's see a concrete example. So you have on the top
here the two formulas. So you have the value
per share of stock, which is then tagged as the DEM, that's the dividend
discount model. No growth on dividends
in the future. And the value per
share of stock. This tag, g, g, m, That's Gordon Growth Model. You see that there is
difference in the formula. So if we take a
stock share that we provide is zero dot
$5 per share pretax. And let's imagine
that your cost of capital expectations
are of six per cent, no growth, the value per share of the stock using
dividend discount model. So no dividend
growth expectations. The calculation you will
provide as a result of $833 per share. Of course, now you would need to compare what is the market at? What price is the market
giving me that share? And do I have my 25 to 30%
safety margin, yes or no? And I will show you how to do that in a couple of minutes. The second, so the value
per share of stock. But following this time, the Gordon Growth Model,
let's assume again, it's an assumption
that that company has been growing and we expect
that will continue to grow. It's a cash dividend per share pretax at a yearly rate of 3%. And the amount the latest
dividend that has been paid out has been zeroed out five years dollar
per share pretax. And you consider that
we can live with a cost of capital or cost of
equity expectation of 6%. You see that your zero dot
five-years dollar per share, in fact no longer divided by 6%. So by 006, zero.06, but this time it will be thorough five-years all
appreciate divided by zero.06 minus 003,
expressed in percentages. So it's zero dot
five-year-olds dollar per share divided by 003. So it's in fact twice as high as accompany the same company
that would pay out the same amount of cash
dividends on the road, five years on a per share, but without dividend growth. So here you, of course,
you see the power of the dividend growth because it allows you to value
in this example, the value of the
company is in fact multiplied by two for
one single share. This is not part of
the companionship, but I'm just showing here
for educational purposes, if in fact you would
bring this in turn, you can do this for yourself
into a table where you have, in fact the years one to 50, you have the discount rate. So if I just quickly come
back to the formula. So the discount rate is
basically when you are bringing to present value a
monetary amounts. In fact, you're
taking that amount, you dividing it by our cost of capital exponential, the year. That is a wave from now. If it is, you are discounting zero dot $5 per share next year, you are then dividing by zero.06
exponential one in fact, which is then
divided by zero.06. This is called the
discount rate. If you are looking
at an amount of zero dot $5 in two years time, you are in fact, your discount rate will be
6% exponential Tussaud's. So six per cent square. In fact, this is what I'm
showing here on the table. So of course, I mean, you don't have to, let's
say do this manually. In the companion sheets. Those calculations are done
manually. So you see e.g. with a discount rate, the discount rate evolves. This is normal between the
years one to ten to 15, 20, up to the 55 years
I've calculated. So of course you
see here the effect of calculating the present
value and discounting. Also the discounting the
cost of equity depending on how far that streamer
of money will be away. Because you remember from
the inflation conversation, That's the value of
money changes over time and you see that next
year, I have decreased it. I mean, you see that the
discount rate is 94. But you said e.g.
in 50 years time, of course, because of inflation, bring into present value, the same flow of
money is actually extremely low at that
moment in time because 50, $0.50 in 50 years time is
nearly with nothing it's worth. In fact, then you
see the calculation, the third line, the present value of the
dividends per share. So in 50 years, this 50 cent is
in today's money, in today's purchasing
power worth $0.03. So you see how the discount rate works next year, the $0.50. So you take the first column, which is year one. So we have gross dividends
per share of zero dot 50. But this countered,
it will be zero dot 47 worth because in
one year's time, the purchasing power
will have been reduced. If you do the intermediate sum, you see in fact that
after 50 years I've been adding in fact all
the present values of the dividends per share. You see in fact that
after 50 years I have an accumulated sum
of seven to 88. That's what you see on
bullet point number three. We are again speaking
about accompany you have this again
just repeating here on Britain number one, we have, we're simulating
a cost of equity of 6%, growth rate of 0%. The latest dividend per
share has been 050, and we believe it will
continue to remain at 00:50. And you will see, I just estimated the payout
ratio at 50 per cent, but that's not necessarily
hearing potent. See that on bullet point
number two in the red frame that the dividend discount
model without dividend growth, as we have put in zero, It's giving us this eight, 33%. And what is interesting
when you compare the value of the bullet point number two and the bullet
point number three, is that remember that this
dividend discount model is actually calculating
this to infinity. What is the share price worth under the assumption that dividends will be
paid out forever. And you see that the dividend
discount model formula is giving us a value that
goes beyond the 50 years. So it's giving us $833. So 11 share of that company
would be worth a dot 33. While you see that after
50 years, I was Let's say, only able to accumulate
valuation of 788. What you see on the
bullet point number three at the very
right hand side, which is actually I'm adding
the dividends of your number 409-40-8407 up to one. So this is adding up. In fact, you'll see that even after 50 years, the BDM formula, which is normal because DTM
formula goes to infinity, is in fact beyond 50 years
of accumulated dividends. Now, when you do now, the same, but we are now using the
Gordon Growth Model formula. So remember that we are taking an assumption
in the future. The company would continue
to grow its dividends. And so we keep the cost of
equity uses on the right, on the left-hand side, sorry, on the bullet point number one, we keep the cost
of equity at six. We have the growth rate
of dividends at 3%, latest dividend per
share being at 00:50. And the Gordon Growth
formula in fact, is calculating us that
that company is worth 16 $67 per share. So remember we saw this
in the previous slide. And you see in fact that
when you compare this value with the accumulated sum of
dividends after 50 years, we add 13.08, which again is now because the formula is
calculating to infinity. And here we're only calculating
and making the sum. So we're stopping at, if you would come
back to the formula, we're starting at, T is one. So t is year one up to n, which is the amount of
user will be counting. We would stop at 50. While those formulas, the
n is in fact infinity. So it's normal that
both values in fact, beyond what I've been
able to calculate up to 15 years or
two, sorry, 50 years. Alright, One of
the things as well that I wanted to
show you here is, of course you are. You have to think about, okay, So I was able to calculate with the dividend discount
model formula and with the Gordon
Growth Model Formula, an intrinsic value of that
share of one single share. Here I'm making assumptions because we want to determine
the margin of safety. And I said already couple of times you typically
buy a company with at least 25 to 30%
of margin of safety. So what I did is if following coming back to this
famous payout ratio, I just considered,
Remember that I want to be in the payout ratio,
cash difference 30-70%. So I just said here, for the sake of the trainee, making it simple is that
the payout ratio is 50%, but 50 per cent of what? Of the earnings per share. So this is why you see in the frames can stay now here with the Gordon
Growth Model formula. You see that below
the GM formula, you have the EPS
earnings per share. Obviously, if the company is paying out in
flow number six, remember the flows 45.6, if the company is paying
out on flow number six, 50% of its profits, It's total profits
are $1 per share, and 50 per cent of those profits are going
back to shareholders. Another form of cash dividends. Here, the share price is
a pure assumption, okay? So, um, it's just for the
sake of the training. Just imagine that the share
price of the company, the publicly traded chapters of this company
is sitting at 14. Okay? So the question is now, you remember that
we have calculated that for the EDM formula, one share is worth 833 years dollars and
for the Gordon Growth, one choice with 16.67. So of course what
is interesting is that I mean or not
interesting is that the dividend discount
model formula is calculating the
intrinsic value of the company below its
current share price of 14. 14 has been taken out of thin air is just for
explaining here. But what is interesting is
that the share price of the company in the Gordon
Growth Model formula is worth 606071 of the publicly traded share
price of the company is at 14. So basically the Gordon
Growth formula is telling you that you
have in 19 per cent, so that's the dollars 67. So it's the difference 1667-14. So you have $2.67 of safety, margin of safety, and
that is the equivalent of 19 per cent. So it means that the
market today if you're only using the Gordon
Growth formula. And again, that's an assumption
because of equity is 6% growth rate of
dividends to infinity 3%. And we expect that the
latest dividend per share is the right base. And this will in fact
only grow in the future. And you'll see this
on the second line, gross dividends per share. Next it will be 0 525-035-5506, etc, etc, up to $2 1950
years with that assumption. If that assumption is correct, well then in fact, the market is giving you
the company at 19 per cent discount using dividend
cash flows, right? And you may now challenge, but how can this be? Of course, it's easy because we clearly see that the Gordon Growth Model formula is kind of making the K is
super positive versus dividend discount
model which does not carry dividend growth
in the future. But does Gordon Growth
in reality exists? And you remember, I was already mentioning couple of times different kings and a
dividend aristocrats. They do exist. So dividend aristocrat is
a company that has been more than 25 years increasing its dividends and
is listed in the S&P 500. That's typical definition of
an aristocrat and the King is a company that's
for the last 50 years, has been increasing its
sovereignty over here. And it's not necessarily
in the S&P 500. Do those companies exist? Yes. And that's the reason
also why I have or I tried to have them in my in
my portfolio in fact, so e.g. 3M, the first listed company or they're listed
in alphabetical order. I was able to buy them
at a certain point in time when the market was
little bit depressed, about 3M Company has
always been listed at around 100, $130-150 a share. And the company, because of
legal litigation, et cetera, has in fact bringing it down, but the dividends
remain very strong. But again, it's not a service station for
you now two by three m, but RAM is one of the
companies that are alike. I was never able
to buy Coca-Cola at that time when I was even writing the training and have been publishing
in August 2020. But when I was writing
it in 19-2020. Coca-cola was around
at $48 a share. And I said to myself, it comes below 45 because I didn't my intrinsic value
calculation, I would buy it. But there are other companies
like Johnson and Johnson, Procter and Gamble,
Colgate-Palmolive. Those are companies
that are like as well. They are part of the top 100
brands in the world as well. So is there a correlation between one and the
other? A little bit. There is a correlation
between companies that have strong modes and are able to grow the dividends
year over year. In Europe, e.g. you
have Nestle e.g. that I had in my portfolio. I started with a
profit because it was then listed above
its intrinsic value. I'm BASF, I will share with
you in a couple of slides. It's one that I still have. It's one of my biggest
positions with 3M. I mean, they are growing their dividends is what I'm showing in the graph on
the right-hand side, they continue to
grow the dividends. So we have now two formulas for companies
that pay out dividends, cash dividends, I mean, to calculate the
intrinsic value, this is likely with the
holy grail for investors, you want to be able to
calculate a price and a Capet that your calculated price with what the market
is giving you. Do not forget that
you need to apply level of tests and not just blindly buying a company because you having
a margin of safety of 30% on a dividend
discount model, the company has to pass the
level one test as well. So it's like low price to book, low price to earnings, low debt to equity, high interest coverage ratio. So it doesn't get into
solvency troubles. For me. At least it has
to be blue-chip company. The company has to have
a mode in the sense that it's a profitability
powerhouse with return on invested capital consistently close to
eight to nine to 10%. The company has to generate profits consistently for
510 years in the road. Do not forget that it's
about that as well. So with those tasks, you're going to filter
out already companies that are in bad financial shape. And then you will be
using this model is the level two screens or the level of two methods to then determine if the market
is currently attractive, is giving you the company
at a good price or not. This is what we are discussing and so please do
not forget that. Now you may wonder, are you or maybe you
would like to ask me, but can you, not all companies pay out cash dividends rights? And you remember that I
mentioned also in the past, in one of the previous lectures that in the past, in fact, dividends became less attractive because shareholders
are exposed to attacks treatment on their
cash dividends that they are receiving on this
cash inflow that is coming to that broke
or bank accounts. The company is in fact, to avoid having
shareholders pay taxes. They turn in fact to
doing share buybacks. So basically what
is a share buyback, as already mentioned
in previous lectures, is the company is
in fact buying from the market this same shares
that you are holding. In fact, what is
the effect of that? Well, it's actually artificially increasing the book value
of one singular share. If you do not remember that, go back to the price to book, Let's say evaluation lessons where we have been
discussing this. So basically, this is
a way of increasing the value of one
single shares by reducing the amount
of shares that are in fact dividing the whole equity. And because there
are less shares out there as you're dividing
the equity by last shares, the equity per share. So the book value per
share is going up. In fact, it's very easy
if you have an equity of 1000s and you're dividing
by 1,000 shares, your book value is worth one. If you're having 1000s
of equity and Nevada, by half of that, your equity just has been multiplied by two. In fact, the book value per share has been
multiplied by two. Alright? So as I said, this has been become, let's say, more regular for, I mean, specifically for a
big tech companies, they tend to do more
share buybacks and spend a lot of money on share buybacks versus
cash dividends. But not only. And this has become more attractive over last
two to three decades. In fact, I would say before. I mean you, if you
read old books, share buybacks were
in fact not existing. So what I want to share
here with you is the following is that
basically a share buyback, Can we consider likely yield
in terms of percentage? So you could actually, as we have been calculating that a zero dot $5 per
share dividend on, let's say on $115 share. Well, that is a yield
that is returned. And you remember when
we were discussing passive income that I am expecting at least to have somewhere around
at least four per cent of passive income
of cash dividends, maybe share buybacks as well, but at least after tax, That's what I want to have. So here I'm showing
you how in fact, the dividend discount
model methods and Gordon Growth Model methods
have to be adjusted. To bringing a notion
that did not exist like very weakly 50 years
ago or 60 years ago, which is adding
to those formulas are mobilizing the
share buybacks as well. So here I'm introducing
and I'm calling this the total shareholder
return model, because that's the total, let's say if you're looking at the flows number
six, That's a total. It's the sum of all the
cashflows that are going somehow directly cash dividends or indirectly share buybacks
to the shareholders. So basically I'm adding supplemental variations to
Dividend Discount Model, gone growth model, which
are the following. I calling I'm abbreviating the turtle shell are written
as TSR to make it short. So we have DTM to GM and TSR. The TSR one is mobilizing the share buybacks
spanned by the company. And we are in fact
considering that the share buybacks will be increasing at the same rate
that dividends in the future. So if it is zero, it's zero. If we expect in
dividends to grow at 2%, we can take the assumption that the company is also a will be, let's say, a growing
to share buybacks at a rate of two per cent
in the future as well. Does this make sense? I mean, of course it's arguable. It's risky as well
because I mean, it's huge amounts of money
that has to be spent. But it's one way of looking at things and always
keep in mind. Here we're doing a
modelization, right? So it's not the silver bullet, but it gives you an approximation
of the intrinsic value of the company between
the DDMS, the Gmail, and the TSR one model, the tears are two mole is a more reasonable approach where you could actually use
the Gordon Growth Model. So the expected dividends per share in the future
divided by cost of equity minus the
growth expectations. And you add to that value the expected share
buybacks per share. And we will be practicing this. And you're dividing this
only by the cost of capital. But we are considering
that the amount of share buyback will
remain constant. That's the TSR to model. So let's just for the
simplicity here of the model, consider the Ts are one model. So the Ts 1 mol, as I said, is expected earnings per share plus expected share buybacks. Prussia, expressing
amount of US dollars per share divided by cost of equity minus the growth rate for both. We are considering that
the growth rate is linear. So let's imagine that company a that we have been
analyzing so far is providing a pre-tax even
pressure of zero dot value as our Prussia has a
cost of capital of 6%, that's your expectation
in terms of return. And we can use the assumption
that the company will grow its dividends for
3% up to eternity. Assumption here in 2019, we're looking at 1900's
simulation in 2019, the company spent $100 million. And at that time
the share price, as we already saw, was $114. The total amount of shares
outstanding diluted at that time was 500 million. So how much shares
was the company able to buy back with 100
million of cash spent? Basically the company was
able to spend, in fact, or TBI back 100 million of cash expense divided by 14
years dollar per share. Let's imagine that the spans
the whole 100 million on one day on the market was giving the shepherds
of the company at fought in US dollars. So this is giving us in
fact a certain amount of, it's seven dot 142
million of shares. And so the new number of
shares In fact outstanding, diluted is no longer having
done this 500 million, but 500 million minus 7142 because the company has just remove 7 million
shares from the market. So the total amount
of outstanding shares diluted has come down from 500 million
to be precise, found at 92 dots, 86 million of shares. That's one dot 42 per cent
less versus the previous year. So with that, in fact, you already see this is
a return of one dot 42%. In fact, the total amount
of outstanding shares. And if you do this, you can bring this figure. And this is something I, the first time I heard
it was during a podcast. So it was one of the annual
shareholder meetings of Warren Buffett. I did not understand
to be very honest, how it was calculating the buyback per share
on the monetary basis. I understood how it would be calculated from a return
percentage perspective. There's something I
learned from him, So I mean, kudos to him because
he was able to read 22, I would say to make
it clear to me how he was bringing this on a monetary basically is
also currency basis. Euro, US dollar,
whatever, yen, etc. How this is calculated, the buyback per share in currency terms is you
take the share price. Let's imagine it was at $14 and you multiply
it by one dot 42%. And this is giving you a
monetary currency value of 019, $88 per share. So this is what we need. It is this one dot for it to present written on
one single share. That is worth 019 $88. Now, coming back to the turtle shell or written
formula number one, we can in fact ads. So we have the
expected dividends per share that will
add zero dot 50. We are now adding the 01988 and then dividing
by the cost of capital or by your
written expectations minus dividend growth,
that was sitting at 3%. And this is where we will
be in fact ending up. I'm showing you here the
value of the stock T as R1 in black bolts. So we are in fact
landing at a 23, $29 value per share. In fact, with this TSR one, because if we are leaving
aside share buybacks, in fact, we're not
looking at the total written that is
provided to shareholders. Again, it's true this
return of zero dot 1988 will not hit
your bank account, will not hit your
brokerage account. It's fictive. But normally what happens
is that the market will see this and
the market will adjust and the share price should actually be growing from 142 more because there are less shares outstanding that are dividing the total
amount of equity. So if we express this in terms of yields in percentage value, so the cash dividend
yield is $5 on $14, the company is providing a pre-tax dividends
yield of three, 57%, so pre-tax, so it's still below my four per cent that I want to have after taxes. But I could add in fact the
one not 42% share buyback. And oh, interesting, my total shareholder return expressed in percentages
is sitting at $4, 99%, which is 3.2, 57 cash dividend yield plus a one-node 40 to
share buyback yields, and that is giving me a
return pre-tax of photo 99. You see how this is calculated
and this is extremely powerful and not a lot
of people are in fact, considering that dividends are an extremely powerful tool, not only to get passive
income from the company, but also to be able to estimate what is the intrinsic
value of a company. Alright? So basically now
we can wrap this up because we have
been able to create or to define intrinsic
valuation models for no growth coming from dividends for no growth
dividends in the future. That's the dividend
discount model. We have the Gordon Growth Model, that is value of a stock
with dividend growth. So it's the expected
dividends pre-tax per share divided by cost of equity minus the growth
assumption to infinity. Then we have the value
of the stock with dividend growth plus
share buybacks. And then I'm using the TSR one just to give me
an approximation. Even though of course, it may say provide even a
better figure than this 16, 67 years that we had on
the Gordon Growth Model. But still, it's afterwards, of course, to me to be able to judge if that makes
sense or not. Here you have. So I've extended
the first two tables to the third table with
the TSR one formula. And you'll see in fact how by using those three
valuation methods, a dividend discount model, no dividend growth
and share buybacks, is calculating us
an intrinsic value of one single shell
that company at 08:03. Three Gordon Growth Model with a 3% growth assumption with
the cost of equity of six, is calculating us the value per share of stock for the
Gordon Growth formula at 16, 67 years dollars per share. And the TSR, we are adding
the share buybacks to it. And with that, in fact, you, we are actually other models are calculating an intrinsic value
of the company at 23:29, of course, at the
share price of 14. With those valuation models, the margin of safety
is of 66 per cent. What you can do with the
TSR formula as well. You can just put growth to zero. And then of course
it has our formula. We'll consider that
there's linear, Let's say dividend per share. And there is a
linear flats share, buyback per share and
met considering that those two values will remain
constant over the future, the tiers of the formula
is able to calculate this if you bring in a
growth rate of zero, e.g. or maybe you want to be a little bit offensive, a
little bit of gold. You put in zero dot five
per cent return a t 1%. But this will be automatically calculated in the
companion Sheet. Alright, good. So now as I said, you need, not only, I mean, it's great that you have
now already a first set of formulas that is
able to tell you. The company is worth. So this intrinsic
value calculation. And of course, what
is important is to understand what is
your margin of safety. And this is what
I'm showing here. At current share price of $14. Dividend discount
model is not giving me the right margin of safety. I'm missing 40%. So I'm in fact, the market is giving me
the company at 14% above. It's valid, it's real
value, its intrinsic value, with the assumptions of no dividend growth zero dot
five-years or a pressure. And of course, the
cost of equity of six, if you would change
the cost of equity, if you would bring it down, the intrinsic value would
go up if you're dividing by a higher cost of capital
because the risk is higher, intrinsic value will go down. In fact, this how the models work. With the Gordon Growth. We're having 19% of margin of safety and with a t
as our one model, we have a 3% growth to eternity we're having
and cost of equity of six, we're having 66 or 36%. One thing here then
our n already can drop because it's a question
that comes up often. Also when I'm doing the
webinars from time-to-time, is the conversation about what should my cost of equity
and my cost of equity, cost of capital actually be? I do believe that in a
2% average inflation, That's something 6-7% should
be your cost of capital. I made ones oppose the couple. I think it was like You're
a one-and-a-half years ago, where, I mean, we're still in
high-inflation environment. Even though the inflation
is coming down. Also due to monetary policy of the central banks and the
US Fed Federal Reserve. Probably today, I would say
maybe factor in something 7-8% just to reflect a little bit the short-term
peak in inflation. But again, that's your choice. I mean, I can, of course, this has to
be above inflation. Again, inflation related
to investment horizon, inflation will not stay at
7% for the next 30 years. I promise you that that's not
work, that will not work. Then we're going to have
other kinds of troubles. So basically you could
then say and bring this visually into what I have set up here on
the right-hand side, like what is your
margin of safety? And basically you
have three zones. You have one zone where the current share
price is in fact, too high versus intrinsic value. We have a zone where in fact,
the undervaluation zone, where the share price is that you could buy today the
company is attractive, but it's not giving you
this 25 to 30% margin of safety that you would like to have as a
value investor. And then the last zone, which would be the bias zone, is where indeed the share, the current share price on
the market, is in fact, much lower than
what you were able to calculate in terms
of intrinsic value. This is basically
what we have with the tiers or one model. That's an, we are in the zone of undervaluation
where in fact, we are estimating that
the price is at 23:29, but the market is giving us
the company at $14 per share. So we have a huge
margin of safety. Remember, with the
level one tests, which are the ones
that are filtering out the already companies
that have bad financials. Please keep that in mind. The Gordon Growth
Model is putting us somewhere in a zone
where, well, maybe it's, I don't have enough
margin of safety today, but I will continue
to monitor In fact. Then here in this case, the linear dividend
discount model, it's not giving us the
right margin of safety. So that would be
either a no signal or even potentially
a sell signal. Because it could mean that Today the intrinsic value of the company is worth 833. And imagine that you
have bought a year ago and the market is giving
it at a share price of 14. Well, that's 40, 40% above its intrinsic
value on this methods. Please wait Also for the next lesson where
we'll be discussing discounted free cash flows to the firm and discounted
future earnings. But here, at least with
those three models, the DTM model would be a sell signal because the market is
overvaluing the company. Again, it will not
be a combination of the 31 company will
either do dividends. Maybe it's doing share
buybacks than you already immediately in
the tiers, our model, if yo
21. Case study : BASF : Concrete example of share buybacks & treasury shares extinction: All right, well
investors, welcome back. So this is kind of, I'll call it the
supplemental lecture. And because I think
it's important that also I share with you
how to practice your I, I think I mentioned this a couple of times
in the training. Being good at investing
requires practice. Like being good at
a specific sport, it requires, high
performance athletes to regularly practice. So here what I'm trying
to share with you is a concrete example how to read and understand
share buybacks and treasury share
extinction, in fact. I'm using for that, and it's actually a topic
that was discussed in one of the very
first webinars that I have been organizing. And so remember also that
I'm organizing and I'm sending educational
announcements more as every two to three months, there's going to
be a webinar where you can actually propose make suggestions
about topics that you would like me to
cover, for example. Here, I mean, on the concrete
example that I'm using for share buybacks and
treasury shares or bought back
shares extinction, I'm using BASF, the
chemical company, where I'm also a shareholder
since a couple of years. So we'll not go
into the details. I mean, you can look
this up by yourself. Who is BASF? Go to the BASF website, and you're going to see that
they're into materials, agricultural, nutrition, surface technologies,
and chemicals. It is interesting enough put
you the URL is that in 2022, they actually brought out and it's something
that I mentioned also in the course
that when you're a shareholder of a company, you should subscribe to the shareholder letter
newsletter so that you get first hand information when they are obliged
to communicate things. So here I received the
communication being a shareholder, of course, a very, very small shareholder, but
still a shareholder. Where they were mentioning
2022 that they had taken the resolution
to the decision to perform a share
buyback program, and they would be allowed by the shareholders and the
board of directors, actually. So management would
be allowed by the shareholders and the
board of directors to execute up to or to spend up to 3 billion
euros until so from January 2022 until end of 2023 on buying back
shares from the market. And what they also mentioned, and this is what you see is the second line in the
red frame on the left, is those shares would
be then also canceled. Because remember that when
companies buy back shares, those shares are carried
as negative value as treasury stock in the equity section of the balance sheet. But the risk is always, I mean, technically speaking, the company could always
bring those shares back to the market and sell them at a certain
moment in time, right? Until the treasury shares, so the shares that
have been bought back that are carried as treasury shares in
the balance sheet, in the equity section of the balance sheet
of the company, until those shares
are not cancelled, there is always a risk
of equity dilution, in fact, just to be
precise on that. So here, I mean, again, I mean, I'm mentioning this
and I've created also other trainings
like the out of reading financial statements. It requires practice. So I'm giving you here the
screenshots so you can see that BASF has been in the
annual report of 2022. They have been mentioning
that until December 31, 2022, that BSF had
acquired 24 million, 623,765 shares for purchase
price of one dot 3 billion, which was representing
rough cut 260 8% of outstanding shares. The 260 8% is actually
the yield that they have. So it's kind of a passive yield. It's not the cash
dividend yield, but it's a share buyback yield
that they have generated. I remember, go back to the lecture about return
to shareholders level one where I'm speaking about
that actually you can calculate on even in the Level
two intrinsic valuation, for the dividend
valuation models like dividend discount
model and Gn Growth Model, you could actually add the
share buyback yield to it, as well, and not just
the cash dividend yield. So, and they say, so they have spent
1,000,000,003. They put it back
somewhere else in the financial report where they explicitly
mentioned 1,000,325. So 1 billion 325
million, 486,177 80. So and remember that
they are allowed until the end of 2023 to spend
3 billion on that. So in the year 2022, they just spent like
rough cut a third of the authorization
that the shareholders were giving to
management, in fact. So one of the things that would be interesting to
know, and that's a comment. I'm not sure if I'm making
this in this course, but I already have
made those comments even during conferences is, of course, and that's
something that we have learned from Charlie
Mong and Warren Buffett. We don't want company management to buy those shares
at a premium price. We want company management
to be reasonable and buy the shares of the company
at a reasonable price. So I could ask you, can you calculate the average
purchase price for BASF, having the two numbers,
the money spent, 1,325,000,024 6 million. So maybe pause here the
video and just think, can you calculate the
average purchase price for BASF in the year 2022? So pause here and resume
when you are ready. So the calculation is
pretty straightforward. You take the amount spent, you divide it by the
amount of shares, and it tells you that
rough cut BSF has bought shares at around 50
nearly 54 euro per share, which is still at that time, a little bit
expensive, I must say. And so that was the
calculation that I did, but actually it was
mentioned explicitly in the financial report of BSF in another section.
You see this here. So they said again, they repeat how many shares they have purchased
from the market. They mentioned that this is
260 8% of the share capital. That's like your yield, your share buyback yield. And they are actually coming to the same conclusion
that my calculation, which is they brought
at an average price of 53 dot 83 per share, in fact. Um, this is already
a little bit, I would say a little
bit more complex, but you know that I want you
to practice your eye reading also cashflow statements and financial reports
and balance sheets. So we see, in fact, so there is a section
that is called key BASF share data in
the financial report. Where we see the number of outstanding shares
of the company. When you look at the
difference between 2021, 2022, that's what you have
in the Rt frame here. You actually see that in 2021, so December 31, 2021, they had 918 million, so 918.5 million
shares outstanding. And on 31st of December
2022, they have 8939. Make a difference
between the two and Oh, is that a coincidence?
Of course, it's not. But you again see here
confirmation that they have, indeed, repurchased 24
dot 6 million shares. So that's really the
intention that those shares actually are removed
from the market, and by that, the price
to book actually, and normally, even
the share price should go up because there are less shares
outstanding available dividing the same
balance sheet amount. We see here as well, you
remember that they have spent rough cut one dot 3 billion
that was mentioned earlier. And we see in an aggregated way, so there is a small
difference, but you see in the cash flow statement
in the financing section. So remember operating,
investing, and financing. So you can see in the
financing section of the cash flow statement, you see actually again,
the number of one.331, so one dot 3 billion. That's the money and
euros they spend in the year 2022 on share
buybacks, in fact. This is, again, I mean, I'm just showing you that you can find this information in various sections of a financial
report if the company is, of course, respecting the financial
statement requirements. But also, and that's
something that I'm discussing in the At of reading
financial statements course. That's not part of the
ATO value investing. But in the statement
of changes in equity, which is one of the five
financial statements. So we will here
in the Audi value investing only discuss
income statement, cash flow statement
and balance sheet. And remember that
I like to start reading the balance sheet first and the cash
flow statement, and then only I look at
the income statement. But there are two other let's
say, financial statements. One is the statement
of changes in equity, and the other one is everything that is comprehensive income. But again, that's
really more advanced. I will go will not
dig deeper into that, but you see even in the
statement of changes in equity, you have the amount of 1325, which was mentioned earlier, but you can see here 1325, bullet point number two
that is mentioned in this statement of
changes in equity. So so I could actually ask you, where does the share
extension have an impact? And what will be the
effect on the book value and the intrinsic
value of the company, in fact, and even
on the earnings per share, I could ask you. So maybe take those
questions in and pause here. And when you are
ready to resume, I mean, resume the video, but I will now explain why share buybacks
are interesting. So as I said earlier, when
share buybacks are done and when also shares
are extinguished, so they are actually
destroyed, void, it's very interesting
because, of course, all the ratios will go up. I mean, you are dividing all those ratios by a lower
number of shares outstanding. So by that, obviously, the share price should go up. You should actually
have an appreciation of the share price
on the market. Same with book value when you calculate the book value per share when let's just take a
very quick short cut here. If book value means equity value and you divide by
a smaller number, your book value will
grow automatically. So those are the nice effects and the same on the
intrinsic value, you are dividing by
a smaller number. So automatically, the
intrinsic value of one single share is
increasing. It's a way. Some people consider this it's financial mechanisms that are artificial to increase
the value of a share. I would say, yes, I tend to agree on that, but the company is
spending money to do this. Remember the cycles
four, five and six. So they are spending money to provide some kind of
return to the shareholder. So it's not artificially done, but there is real money that is invested into increasing
the share price, also or let's say the book value per share of the company. So last but not least, I mentioned this already
in the Blue Chip lecture. So again, just repeating
here that in the past, also in the course,
the At Val investing, I mean, you would have to use an Excel file and you would
have to look up yourself, the numbers in the
financial reports. Now, everything is available in this artificial
intelligence tool that is called VNC and there is a specific training on EU
Demi about how to use VNG. So VNG is a large language
model that is so it's a fine tuned large
language model that is powered by open
AIs Chan JBD plus. We have been working. I mean, we have started this
project November 2023. We are now May 2024, so that's why I'm
also doing an update of this lecture because, in fact, you can actually chat. Like with Chan GBD plus, you have the
financial information currently at launch dates, which was May 1, 2024, there are 1,100 plus companies that are part of the Investment Universe of Vinch. So you could
actually, and you see here on the right hand side, you can prompt and you can
ask Vinch Can you calculate the price to book value of BASven thousand 22 using
the following numbers? Can you also tell me what
would be the price to book if, for example, the number
of outstanding shares would have been
reduced by 280 6%. Can you recalculate the price to book ratio with this price? So I mean, I will not go
into the details here, but you have now a very handy tool that
is available to you that allows you actually
to be much more efficient in the
investment process versus what I had before, which was actually
providing an Excel file, but you had to fill those
numbers by yourself, and you had to look those
numbers up by yourself in the financial
statements of the company that you would
be interested in. Now you have this
tool which includes 1,100 companies,
includes top brands. So I think currently we are at nearly 1 million data points
for all those companies. And yeah, I mean, I mean, we did this project
with my partners already ourselves
as value investors, and I'm using this,
and I'm gaining a lot of time by being able. So I got rid of my Excel file, and I'm using now this
tool to calculate intrinsic value to perform the
level one test, et cetera. But I will show this to
you in the bonus lecture. At the end, I will show you
a full valuation using Vinch as a artificial intelligence large language model
for value investors. And of course, you can see
here another screenshot that it can calculate the
intrinsic value per share. And of course, if you change the amount of
outstanding shares, it will, of course, adapt. You see here the result of
me prompting the model. It shows you the original
number of shares, 918 million, and I've
told Vin Well, now, if I would reduce the number of outstanding
shares by 280 6%, can you recalculate
the intrinsic value? On the discounted cash
flow per share method. And you see that actually the intrinsic value
is increasing. Again, this is what I
was asking you before. What is the effect of doing share buybacks and
share extinction? Is that all those
intrinsic values per share are increasing
because you are dividing by a smaller number
of shares outstanding. That's it for the
BASF, I would say, specific example, and I
hope it was useful for you. And yeah, looking forward to talk to you in the
next lecture. Thank you.
22. Discounted free cash flow & earnings valuation model: Alright, in Leicester us. Welcome back. Last lesson already in
chapter number four, where we're discussing the
various valuation techniques. So we saw in the
previous lessons how to calculate the book value. The book value. In the previous one, I was sharing with you three
models that can be used for calculating the intrinsic value of a share of a
company in general, which are the dividend
discount model, the Gordon Growth Model, then the total shareholder
return which adds in fact share buybacks which
have become more, Let's save. Recurring over the
last two decades. The last part of the last
method in this level two methods and is in fact, we'll be discussing
discounted cashflow, which is basically
the method that everybody is using
even for startups. Just looking at
the business plan and drawing assumptions
on the valuation of the company by looking at promises that are laid
down in the business plan. And I will be discussing also discounted future
earnings as well. But first things first, why has been
discounted cashflow? A method that has been
used a lot for valuation. First thing that I'm
not writing here is because not all
companies are paying out dividends and not all
companies are paying out or doing share buybacks. So very often the dividends
related valuation methods actually do not work. I mean, this e.g. does
not work for a startup that doesn't have
money to provide a cash dividends to
its shareholders, nor even do share buybacks. They're only if you
remember the flows 45.6, they only if they have,
they're generating profits. Very often is not the case. They are generating losses in their flow number three out
of the operating assets. But if they are the first
profits will always be in the first year is
reinvested into the, into the operating assets. In fact, to expand the assets in the balance
sheet that they have. So outside of that, so as you understand, is that dividends
variation methods do not apply to all companies just for very mature companies, discounted cashflow methods are discounted cash flow
valuation really captures the underlying fundamental
drivers that are in fact driving the profitability
of a company. If it is growth, the
cost of capital, how much the company
is re-investing. So this famous flow number four, and very often
discounted cashflow is considered as the closest
estimation to valuing or two, to capturing the intrinsic
value of a company. And unlike other
valuation methods, and I've put here the example of discounted future earnings. Why a lot of people who prefer discounted
cash flow methods to discounted future earnings are discounted future income methods is because in fact, if you remember
when I was sharing with you the difference between income or I'd say accrual
accounting and cash accounting. You cannot make up the
numbers with cash accounting. So caches cache, while
in income you can start thinking about
being creative on how you recognize
revenues, e.g. you can also be creative on how you report on expenses, e.g. research and
development expenses. You could in fact
say, and this is a typical red flag
that I am discussing. And another training
which is much more in-depth on reading
financial statements. Where in fact, when a company is incurring expenses related
to research and development, they are allowed in fact, to capitalize those
investments and show them as an intangible asset in their balance sheet and not categorizing them as
an operating expense. That's kind of a way of I
will not say in a fake way, but it's a way of making things
look better as they are, but it's allowed by
counting measure. So I will not say that
all capitalization of expenses are in fact manipulating
the income statement, but nonetheless, I wouldn't
need to be attentive on that. So the advantage of
discounted cashflow, of free cash flow to
the firm as we call it. Is that a true measure of how much cash is left
to the investors? Why is it discounted? Because we remember we
are trying to estimate the intrinsic value of a company over a certain
investment horizon. You remember from what we were discussing and you
have seen this slide. That's inflation is out
there and inflation has an impact on the value
of money over time. You remember I was giving you the example which wasn't
Investopedia example, where a generic cup
of coffee and 1970s, you would have to spend
$0.25 for having this, for buying this
generic cup of coffee. If thousand 19 fact, you would have to spend $1.59
for the same cup of coffee. The difference between the two, if you remember what we were
discussing is inflation. In fact, one of the things
when we discount so to bring back to the value of
money to its present value, we are using a discount
rate or discount factor. And again, now, I didn't not do it in
the previous lectures, but here as we are doing more, let's say mathematical
calculations. I want to share how
this is calculated. So when you look at the
typical DCF calculation files, also the ones that I was using, discount factors I was using
in the previous lecture. So in fact, the
discount factor is 1/1 plus the cost of
capital that you have. And then exponential to
the year or the year. That is a wave from where you're bringing it now to
its present value. Let me give you a
concrete example. So e.g. here on the
specific coffee, generic coffee, cup
of coffee example. If you think in terms of
discount factor 1972000-19. So the power, the purchasing
power in 1970 with $0.25, $1.49 years later is actually reflecting a three dots 84
per cent yearly inflation. That's also pretty interesting, Let's say figure to know the discount factor between the two is in fact zero dot 15. Or if you calculate
in terms of multiple, it's one divided by this
discount factor, it's 636 times. So it means that from
the year 1970, 2019, that's the two by the same to keep the same
purchasing power. In fact, your amount of
money would have to be multiplied by six times
over the last 49 years, which is a lot in fact. So you see here how the discount factor is
in fact calculated to bring the 2009 value down
to the 1970s values. So this is a way also you can actually calculate
it both sides. I can calculate the
discount factor. And this discount factor
will be then multiplied by the monetary value like
25-year-olds dollars, or the other way
around, it would be one dot 59 multiplied by 015 and you end up
precisely 020 $5. So this is how you can move between years in time horizon by using those discount
factors back-and-forth. In fact, from 025, you would multiply by
636 to end up at 01:59. And from 2019, you
would multiply one dot 59 by zero dot 15, in fact, to end up at 00:20, $5 in fact for this
cup of coffee. Alright. So remember again, I will not go into the details about it. But when I was explaining to you the differences between income or let's say accrual accounting. And when we will also introducing
the cashflow statement with more specifically the
cash accounting methods that there are differences
between the two. We need in fact, to be able to do discounted
cash flow methods we need to use and we need to know what is the free cash flow
to the firm in fact, and for that, you
remember this scheme, this is the cashflow statement. Remember the cashflow
statement has three sections. Operating activities, investing activities,
financing activity. I like it very easy. Today, most of the companies, when they report on the
cashflow statement, they start with the profit
before income taxes, which is basically the earnings before interest and taxes. Then they RE correlate or the reconcile the non-cash
items with that income. They do report on the changes in working capital from
one year to the other. So this is basically you
end up with a cash provided by operating activities are
the operating cashflow. And then of course they
report how much this is a flow number for how
much has been in fact, flowing back into the business in the sense of how
much has been invested, but also even long
lived assets have been sold out, so divested. That will also reflect in the cash flow from
investing activities. So basically, it's very easy
if you know the company is providing a cashflow from operating and net cash
flow from investing. You don't need to have
the financing one. You will end up in fact, with the free cash
flow to the firm. So it's the sum of
the two figures. Okay, so that's really
important to understand. Now a question to you is, can now operating cash
will be negative? Can an investing
cashflow be positive? Because typically, I mean,
for mature companies, operating cashflow will be positive and the
investing cash flow will be negative. Why? Because we are
expecting to generate profits from our assets. So the operating cash
flow will be positive. And typically we're
going to spend some money in the phone number for to reinvest into assets
into the operating cycle. So that's why typically
the investing cashflow would be negative. But can't operating cashflow
be negative? Yes, it can. If the company is not, it's not generating profits from
his operating cycle. Can invest in cash
will be positive. The answer is yes as well. When the company is selling more fixed assets versus
reinvesting into the business, then potentially the investing
cash flow can be positive. It's a warning signal. It would be for me a red
flag, but it's possible. So that's why I'm saying, and when you will be
calculating this as well as just make the sum
of the two figures, whatever the sign positive or negative is in front
of those two figures. The two figures out the
operating cash flow and investing cashflow. Alright? I've put here, I
mean, you already have seen this probably sounds familiar with the
dividend discount model. Basically the discounted
future earnings and discounted
cashflow is the same. I do both because I'd like to see as I consider,
I mean, you know, that earnings or income has to reconsider with
cashflow over time. You remember this limousine
that has been bought has been spent to disband out
in year 11 -100,000. But his expands as rate
of -20000/5 years, which is the useful
lifetime of this asset. I do calculate and you're going to see in the extra
companionship that we have the discounted
future earnings and discounted cash-flow. And you're going to
use this to estimate the intrinsic value
of the company. So one of the things that
I like to do as well, having also learned from Warren
Buffett and listening to his annual shallow meetings of Berkshire Hathaway
with Charlie Munger. While I'm doing an
intermediate calculation as well of what is the company worth if it would
die after ten years, after 20 years and
after 30 years. And the second thing is that something that's
my personal choice is nothing to do with Charlie
Munger, Warren Buffett. I do not use a terminal value because I
believe, generally speaking, when you look at what
I was mentioning, the average life of SAP 500
companies that is around, let's say 15-20 years. I believe that first of all, it's interesting to know what the company is worth
after ten years, 20 years, and third years. And adding a terminal
value, in my opinion, is not in line with the fact that maybe the
company will not be around in 50 years,
in 100 years. So I'm taking a more
defensive stance because if you add
this terminal value, it will just make your
business case better. So your intrinsic value, in fact, we just increase. So I'm taking more defensive stance on this and this is what you will see in the
extra companion sheet. So here, we can do here
quick calculation. So if you have a
company that has 1 billion of outstanding shares, the latest annual earnings
were rough cut 4,000,000,499. Current share price 43
$94 cost of capital. We assume at seven per cent. Also in the model
you're going to see in the actual
companion sheet, you need to decide. So that's why you need to judge. You need to decide on
your growth assumptions. And so I've, in the companion
sheet you can actually, you don't need to decide for
the same growth rate for the next 30 years
because the model is calculating and he's
stopping after 30 years, so no terminal value. And you can actually define a different growth
rate assumption for the year is one to ten, different ones for
the years 11 to 20. And the last one, the third one for
the years 21 to 30, it could be the
same if you'd like, then you have to put in, I don't know, e.g.
three times 3%. But in this example, in fact, I've put a 3% growth
rate assumption for the first ten years
than two per cent for the next decade, 1% for the third decade. So this is an calculating
those growth, growth rates and
intrinsic value. And automatically
you're going to see in fact when doing
the calculation. So the intrinsic
value calculation, ten years of 20 years
And of 30 years, that with a share
price of $43.94. In fact, and this is
automatically calculated. The sum of the
discounted cash flows or earnings is in fact, it depends which figure
you are looking into. So here we can I mean, I was speaking about
latest yearly earnings, but you're going to see
in the companion to that, you have a section
that is calculated the discounted
future earnings and a section that is calculating
the discounted cash-flow. And what I recommend is
that you compare both if there is a big
discrepancy between the two, you need to understand
why there is such a big discrepancy between the cashflows and the earnings. It may be explainable, but be attentive, normally, should not be too far away, except that the company
has been spending this specific year a lot
of money on investments. So you see, in fact, that's similar to the
dividend discount model. That's the model that the sum of the discounted cashflows
with a cost of capital expectation
of seven per cent with this 3% growth rate
for the first decade, two per cent for
the second decade and 1% for the third decades. And with an earnings
of four dot, let's say rough cut folded $5,000,000,000 per year
with a certain amount of outstanding shares
because we need to bring the value back to an amount. Share valuation per share as we did for the dividend
discount models. So you see in fact
that after ten years, if the company would just go bankrupt and would nonetheless generate profits until then, the one share is worth $33 that you can
compare with the 43, 94 that the market
is giving us today. On the 20-years calculation, we see that the company is
worth 50, 95 years dollars. You compare it with the
43, 94 years dollars. We're having a ton two
per cent margin of safety the third years. So it's the sum during 30 years of all the earnings
taking the assumption of the latest current
earnings with specific growth
rate assumption and cost of capital assumptions. The intrinsic value
calculation on the earnings of the discounted future earnings related IV intrinsic
value is 67, 71, which is compared to the
current share price of 43, 94 is giving us a margin
of safety of 35 per cent. So practice with this, going to the exit
companion sheet and start playing with this. But you will need is the latest net income and you will need the free
cashflow to the firm. So the free cash flow to
the firm is the sum of the operating cash flow
and investing cashflow. So with those two numbers, you're going to actually receive an extra
companion sheets. Of course you can
do it manually. You will see in fact how the intrinsic value and the one that we're
interested in is the IV 30 based on discounted
future earnings and the ID3 based on discounted
free cash flow to the firm. So discounted cashflow, how much margin of
safety do we have there? I will say the
same and this will be my closing remarks
for this lesson, I will say the same what I said earlier in the previous lesson. Of course, the company has to pass first all the
level one tests. And you can not only look at the intrinsic value of a company if it is
through dividends, valuation models of earnings
or cash flow models. And you put aside the level one test that
you're taking risk there. The level of mountains
are there to filter out already bad from
good companies. And then you have to
do these calculations. Before wrapping up this lecture, I want to bring the
whole story together. So we have seen in this chapter a couple
of variation methods. The first one, the
two first ones, which were the book value per share and the adjusted
book value per share. You're going to use them
as a ratio interpretation. So you're going to actually take the current share price and divide by the book
value per share. And, or if there
is an adjustment possible as you have seen, e.g. on brand valuation or
property plant and equipment, you may then calculate an
adjusted book value per share. In fact, the comparator, it
will calculate it for you. And the companionship
will then also provide you an adjusted
price to book ratio. So on that ratio, you'll remember that I said
that we want to have the racial somewhere below three. So buying three
times the size of the balance sheet
starts to get cheap. In fact, it's a relative
valuation methods. But the other methods
that I introduced, the dividend discount
model and methods. So the no growth dividends, DTM, the width growth dividends, the Gordon Growth Model. And we also defined a total
shallow return which adds to the dividends as
well as share buybacks with or without growth
as the TRS R1 model. And in the last while in
this lecture actually, we have also provided on, I have provided two
absolute valuation methods which are the discounted
free cash flow to the firm, which is the preferred method, and the discounted
future earnings, which is based on the
income because it's random, It's good to be able to
compare the two if there are no two big discrepancies
between the two and the companion sheet
will calculate this for you. In fact, you will have to bring in the net income
and you will have to bring in the free cash flow to
the firm that you have seen is calculated by summing up the operating cash flow and
investing cashflow, right? So I'm going to share this, how the whole story comes
together on a really small, so small is accompany
that I had in my portfolio border
around 50 something. I think I bought
at CHf57 and solid like 93 or CHf95 like 12, 18 months afterwards, plus dividends that are
received At that time. You see here on the screenshots, I was looking at May 2020, whether current share
price was around CHf55. And so again, I'm in
this summary table, I'm not bringing in
the price to book, an adjusted price to
book because that's a relative valuation methods. You just have to test if the price to book and
if you can adjust it, the adjusted price to book
is somewhere below three, the further away from
three, down to 1.5. That's at least for
that single test, is it's an, let's say vibration signal that
the company is cheap. And as I told you, it
happens from time to time. That the markets are so
depressed that they're giving you the company at the relative valuation of price to book
that is below one. I had a situation e.g. for BASF, the largest chemical company in the
world, e.g. right. Outside of that, if we bring now the other methods together. So dividend discount model, the growth, so the
Gordon Growth Model and the total
shareholder return. And we add to that
the outcome of the intrinsic value
calculation for discounted free cash flow to the firm undiscounted
future earnings. In fact, you are ending up with potentially five
different figures, which is the figure
that you have to use to compare it to the
current market share price. And here I'm giving
you the example. And the assumptions are not important but the
example of Reshma. So when I was analyzing
very small before taking the decision to buy the
company and remember, and I will repeat this again. Enrichment have to pass
all the level one tests. Right? And if one of the tests
would not be passed, I would exclude from potentially investing into Reshma prolapse. I use the leverage to
tasks which are the, which are the relative
valuation tasks, price to book, adjusted price to book and
the absolute valuation tests, dividend discount model,
gone growth model, total shareholder return, discounted future earnings and
discount is free cashflow. Those last five are giving me an intrinsic value per share. And you see her on those
five values that in fact, depending on the methods, I'm ending up at an intrinsic
value per share of between CHf68 and CHf76 at that time
for what we smell was worth. So receiving rushmore at a share price of
around 55 CHf56? When I was doing the analysis, I think at the end I
bought it at around 57. It was giving me a
margin of safety that was for all of those intrinsic value
calculations above 25%. So you need to judge what is the right value is
at 68, is at 76. Something that I learned
from Warren Buffett, listening to one of his
annual shareholder meetings, he said, calculating
the intrinsic value of a company is not
something precise. It's giving you a range. What is a reasonable,
fair assumption? This is what you see with
the various methods. The various methods will not give you the exact same number. Why? Because there are potentially assumptions that
vary in those calculations. Example, the dividend
discount model, you are considering
that there's gonna be no dividend growth
in the future. In the Gordon Growth Model, you assuming there's gonna be some kind of growth
potentially in the future, in the future earnings, the figure is maybe
overstated versus the free cash flow to
the firm or vice versa. So you see that flourish more, you end up in a valuation
range, CHf68-76. For all of them, you see that? Well, buying it at 55 or CHf56 for all of the tests is giving me the right level of
margin of safety. That should be the
minimum of 25 per cent. Remember, while your
money sit still, you want to receive
passive income through cash dividends and
share buybacks. So this is very important that
you are able to understand after it's in the
companion sheet what the intrinsic value, so the absolute intrinsic
value calculation is giving you as a result, if it is for the
dividend cash flows. So DTM g, GM and Ts R1. But also then for
discounted free cash flow to the firm, discounted
future earnings. If you have big discrepancies
between the two, normally you should
first of all, favor the discounted
future earnings. No, sorry, the first one is to favor discounted free
cash flow to the firm. The second one is counted
future earnings and in the hope that they are not big discrepancies between the two. If there are big discrepancies
between the two, it may just be because
the company has been largely investing and spending cash in the last year, e.g. but remember that
cash and income, so accrual accounting and cash accounting
we will correlate at the very end over a
longer period of time. You may need to adjust
the investments to make a judgment that at
the very end of the day, the discounted
future earnings is more reflecting the
real intrinsic value, the discounted free cash flow to the firm because the company has short-term span at a lot
of money on new assets, but those assets would generate new earnings in the future. If the company is
paying out dividends, then you can also look at what is the dividend discount models, the three telling me
in terms of sorts, the intrinsic value
of the company. Then you have to make a call. You have to make a
call saying, well, yeah, it's true that I mean, it's giving me for most of those tasks is giving you
the right margin of safety. That's my value investing
is an odd because a judgment call will
be required by you. Alright, so I hope
that this is clear. So you have multiple methods, relative methods, price to book, adjusted price to book. And you have absolute
valuation methods, three for the dividends, cashflows, and true for the earnings and free
cash flow to the firm. I hope that you're
able to understand how you will have to judge which methods
is the right to, the right one to use for than taking an investment decision. And please do not forget, that is not enough. You have to bring this together with a level of one tests. Not just looking at
intrinsic value, but also adds how good the company is at
generating earnings, how good the company is, e.g. at providing passive income
and those kind of things, That's something that you
will use for that level. One task on top of this level to relative and
absolute valuation methods. Wrapping up here
this chapter and in the last one that's more
like an ongoing research, are going to share with
you how I tried to quantify the mode and
intangible metrics that are learned from
Warren Buffett without having to talk to
management of the company, employees, of the company, supplies of the company. So we'll be sharing with you, at least for the big brands, how to potentially get some
interesting signals to, let's say, strengthen or not an investment decision
that you would take. So talk to you in the
next one. Thank you.
23. Case study : Performing Level 1 & Level 2 analysis on Apple, Chevron, Sirius XM: Vengpt.com. Welcome
back, Investors. Welcome to a new video. This video will be actually, so we are August 2024, 15th to be precise. And I mean, for the
investors in the room, you know that every 45 days
after quarterly closing, Warren Buffalo has to publish
a 13 F report as they have more than 100 million
assets under management. So I'm going to give
you an update on latest movements on
Berkshire HeawaysPortfolio. Actually, the video
has three parts. So the first part will just
be about the movements in out and new positions that they have taken in their portfolio. The second one will
be actually on those companies or
some examples of the companies that
you're going to be seeing where they have
sold the securities, where they have
bought securities, is how to use in GPT and to
the analysis using Vin GPT. And then the third
part for those who like to read
financial reports, they're going to be
showing you how to read the latest financial report
from Berkshire Headway, so the latest quarterly report. So let's go into it
and do not forget to subscribe to our YouTube
channel, as well. Alright, so let's start with the positions that
have been sold by Berkshire Hathaway since
in the second quarter 2024. So we're looking at the period April 1 to end of June 2024. So I've put you here a, I hope, comprehensive table
that summarizes the main negative movements, so what they have been selling
in terms of positions. In the portfolio. So what you see actually, and that's the highlights
of this quarter, you see that Berkshire
Hathaway has been taking capital gains by
selling rough cut 50%, actually 49 or 33% of their Apple position
in the portfolio. So they have sold for rough cut $84 billion of market value. So that's actually
the biggest change. You see below the Apple line, so I've sorted this table
by percentage change, so from the biggest to
actually the smallest one. You see that they sold some
positions on Capital One, floor and Deco holdings, T mobile US, Louisiana
Pacific Corp, which is a railway company, if I'm not mistaken,
and Chevron, which was also one of the
positions that they have taken in the utilities or
energy and utilities sector, I think already a
couple of quarters ago, so that they sold three to 55%. But the main highlight
here is that they sold 50% of the Apple position. In terms of movements, so what has been added. So I'll start first with what has been
increased because they had already those companies in the previous quarter, at least. So you see that I mean, here it's sorted in
ascending order. So you see that occidental
petroleum, which was again, another one in the oil and
gas industry like Chevron. So there they have increased
a little bit like 290 3%. I will not read
through all the lines, but the main highlight of what they have
increased in terms of position in existing securities or in existing companies is actually serious XM holding
which is this satellite well, satellite radio
provider in the US, which is very well known
in the US, in Europe. Most people do not
know serious exam. So they have increased
the position by 262%. So in terms of percentage,
it's the biggest change. But you see that the
value in US dollars is, let's say, relatively small compared to other
let's say movement. So we are speaking
about $376 million, which is for Berkshire, that's small money, actually. So that's the
biggest change here. Then in terms of new
companies that have appeared in the portfolio that were not existing in ir quarter, 2024, you have two
new companies, one that is called Alta
Beauty Incorporated. So they are kind of a
marketplace for everything that is beauty products,
those type of things. You see on the left hand side, a screenshot of their
latest website. For example, they are selling SoliGenera which is
a brand that I know from my daughter because she loves the
brand, SoldiGenera. I had never heard
about this brand, but young people
like this brand, so they're apparently selling
that type of stuff as well. And then Berkshire Hadway
has also added position. So they bought one or 2% of the outstanding shares of
the Class A shares of HCO, which is kind of an
engineering company that is also doing stuff in flight
operations, flight support. So you see that the percentages that they have taken are small. So it's for ULTA Beauty, they have taken one 4% of
the outstanding shares. And for HCO, so HCO has two types of shares
or classes of shares. So they have taken one or 2% of the outstanding class A shares. You see the amount in terms
of the value of US dollar. They are relatively small compared to the
size of Berkshire. It's $185 million for Haku
and 266 million for ULTA. So that's for the movement
in the portfolio. Now, I mean, what is interesting is not just to
know about the movement. Okay, we have seen Apple has been sold for
50% of the position, and we have seen serious
exam increasing by 262% and two new additions. But what is
interesting as I mean, if we are serious investors, is to understand what are the fundamentals
of those companies. So what I'm showing you here, is actually how to use Vine GPT and how to prompt VN GPT to do analysis on a couple
of those companies that we have been
just enumeraating. So the first thing
is we're going to be looking at out movements, so movements of selling securities in the portfolio
of Berkshire Hathaway. So here you see the
prompt that are going to copy paste into Ving GPT, where I'm actually
asking Vin GPT to do some people call
it a chain of thought. So it's a sequence of prompts, but structured under
one single prompt, you see that it's like seven
or eight lines of prompt. I'm asking Vin GPT to do a fundamental
analysis of Apple and Chevron Corp. Those were two companies in the portfolio
of Berkshire the way, where the percentage
has been reduced. And I want actually
VNGPT to show me side by side the fundamental analysis of those two companies in
a comprehensive table. And I also want
VNGPT to calculate the intrinsic values for those companies using
various methods. You're going to see this in
the results in the video. And also, I want VNGPT to
calculate the margin of safety. I mean, for those who did the Audit value
investing training, you know that we should
buy companies at 25 to 30% of margin of safety versus the
current share price, so that the intrinsic value is 25% to 30% above the
current share price. And also I want Vin GPT to
calculate the percentage immediately comparing
the intrinsic values versus the current
market share price. So let's go into it, and
let's roll the video here. So you see, so well, first, I'm starting with inch, so just saying good morning to Vinch. And then what I'm going to do, you're going to see me actually
copy pasting the prompt. So by copy pasting the prompt, you're going to see
now me submitting the prompt and so this
chain of thought. And you see that,
of course, Vn GPT is talking to our back end. So here is the Vn GBT four.com
Band, because, I mean, in order to avoid
hallucinations, you know that Vin GPT has been created on
top of HGPD plus. We do have many, let's say, processes and calculation
stuff that is being done in our
back end just to avoid glitches in the analysis. So here you see, let me
just pause here 1 second, the video before continuing it. So you see here, actually the results of the
fundamental analysis. So for those who did the Adder
value investing trading, you see like price
earnings ratio, price of cash flow,
dividend yield, dividend payout ratio, ROIC, return on assets as well, debt to equity ratio,
that type of stuff. And then, in fact,
afterwards, you remember, in the prompt or in
the chain of thought, we ask, actually Vin GPT to calculate the
intrinsic value. Let me also again
stop here the video. And you see how Vin GPT looks at the current share price and then calculates the three
methods that it has been, let's say, fine tuned. So it calculates
dividend discount so discounted cash flow, free cash flow to the firm, and discounted future earnings. And you see actually
that it then calculates because I
ask in the prompt, it calculates actually the
margin of safety between the current share price and
those three intrinsic values. So you see that
actually for Chevron, is a positive margin of safety. It means that the current
share price is 20 dot 87% and 24 dot 71% below. So the intrinsic value is
below the current share price. So it means that basically
there would be and again, I'm not now soliciting
you to buy Chevron Corp, but it looks like
that Chevron Cp is currently undervalued, according to our value
investing methods. And again, I will speak
later on about what are the assumptions
that are being used to calculate
those intrinsic value. So that's for the
first two companies. Let's go into serious XM. So serious exam, in fact,
let me just go back here. So here we are just submitting a single prompt to serious
exam, which is now, can you now perform
a fundamental ys of serious exam and please also
calculate intrinsic value, discounted casuals counted future earnings
for the company, and calculate the margin
of safety for both IV. So you see that's a
different type of prompt. You see here in the sequence
of the Appohevax analysis, I'm just copy pasting
the prompt that I just shown to you on the
screen, and, of course, Vin GBT is pulling the
data from its back end, doing the analysis, doing the intrinsic value calculations
to avoid hallucinations. Of the large language model, and it comes back with
the calculations. So fundamental analysis,
again, I mean, for those who did the A
value investing training, level one, fundamental analysis. And then it calculates
the intrinsic values, looks at the current
share price, and then provides
the intrinsic value. I just asked DCF and
discounted future earnings, and it calculates the
margin of safety. Just one thing here because the margin of safety looks
very interesting 42, 46%, which could explain why Berkshire has been buying
more of those companies. Just one thing is
nonetheless that I do not like about serious M, is that the company
has negative equity. You see it here in the summary of the fundamental analysis. It's something that
I've been asked up also related to Starbucks. I mean, I love the
Starbucks brand, but it has negative equities. There would be for
me a KO criteria and I would not invest
into the company. Just wanted to
highlight this to you. Again, I'm not
telling you to buy serious M. I'm just showing you productive you can be in your investment process
by leveraging Ving GPT. Okay, the third analysis, and we already discussed
about Alta Beauty, which is one of the
two new holdings that appeared in the
outer 13 F repot. So here I'm showing you
actually a sequence of various prompts with VnchGPT. So let's go into the video. So you see here, I started
a new conversation, and I'm asking,
well, first of all, I'm asking because
I never heard about Alta Beauty before
seeing it in 13 F repot. I'm asking Vin if
it has la Beauty in its companies or in its
investment universe, you decide how to
prompt the model. It says, yes, it has it
under the Tika Yelta then I'm asking actually perform a fundamental
analysis of the company. You see that I don't
need to repeat la beauty because VNGPT remembers the
contacts and the prompts, and I'm asking also to calculate intrinsic values
for the company. Again, as always, it goes to the back ends, performs
the calculations, pulls the right data from the latest investment
Universe update, and then it provides a analysis
related to the company. And we see that the company
does not pay out dividends, and you see that it provides
a certain value for the discounted cash flow
intrinsic value and discounted future
earnings intrinsic value. And one of the
things that again, I want to emphasize here is, of course, I did not provide any further assumptions when calculating the
intrinsic values. So I'm asking now the
model here as you can see in my prompting is, which assumptions have you
used to calculate the IV? And Vin GPT is answering because it has been
preprogrammed with that. Answering that it
used 3% growth rate, 7% discount rate and a
time horizon of 30 years. And I'm asking no basically
Vin GPT to recalculate. I'm changing the
growth assumption, and I'm asking Wing to recalculate
with a 4% growth rate. And you see that, of course, it will adapt the
intrinsic values if it is a DCF or DFE with
a new growth rate. And also, I mean, and I've been discussing
this a lot with my students is what is an appropriate cost of
capital for any company. Per default, the model uses 7%, which we believe is
a good average cost of capital for any type
of company long term, valuing on 30 years. But here, I mean, I mean, if you have followed me, you know that I've been adding together with the Vin GBT team, we have been adding industry
specific cost of capital, and you can ask the model, What's the industry
cost of capital? And here it has replied
that it was nine dot 82. And I'm asking now in GPT to recalculate the
intrinsic values using this nine dot 82 percentage
in terms of cost of capital. So I'm just here again, you see just reconfirming what growth rate it has been
using because I did not, let's say, tell again to in GPT, which growth rate to use. So you see that
it capped the 4%. So just another example
on how to use VNG GPT, in fact, to do the prompting. Right. The third part of
this video is having a look, and you know that
me as an investor, I always read financial reports, and it's very important
that you train your eye and that you practice on reading financial reports. I'm just showing you
here the main highlights of the latest financial reports. So the ten Q report, which is an unaudited quarterly report of Berkshire Hathaway. So the holding Company
of Warren Buffett. So here I'll start. I mean, you know that
I always start with the balance sheet
and then the cash flow same and then income sim, but I know that a
lot of people they like to start with
the income same. So let's start with
that, but I will come back to the cash flow and
the balance sheet later on. So on the income
same and you see that with the red bullet
points one and two, that's so if you compare
quarter over quarter, the second quarter of 2024 with the second quarter of 2023, you see that the company made rough cuts the same
amount of profits, so it's 33 billion. This year, while
last year was 359. What is more interesting
when you look at the first six months of
last year versus this year, you see that the company has, in fact, generated 43
billion of profits, and so the first six
months of last year, they had generated 71 billion. So the performance was a
little bit better last year. For whatever reason, that's
now at the point here. It's interesting
as well, when you look at the cash flow statement, you see actually at the
cash position so that Warren Buffett's
Berkshire company has a cash position
of 43 billion. So that's really cash
and cash equivalents. And what we want
to understand as well is how has the
balance sheet evolved? And again, I have started reading the Berkshire
Heaway ten cry pot. I started with the balance sheet because the balance sheet, as I always tell my students, it shows in a consolidated
way at any moment in time, it shows what has
happened to the company. So here, you see, and let's zoom in here on the equity side of the liability side of
the balance sheet. So what is being compared here is the
balance sheet position at the end of December
of 2023 versus the balance sheet
position of carter 2024. Again, unaudited figures.
When we zoom in, actually, there are three
things that we can call out. The first one is a
retained earnings. So we see that and
you know that I hope that you know that when
profits in companies happen, they normally appear on the liability side of the balance sheet as
retained earnings. So there we see that
the retained earnings have increased by $43 billion. We see that Berkshire Hathaway, compared to last December, has spent $3 billion
on share buybacks. So that's the treasury stock
that is carried at cost. And again, remember,
that's a negative value in the liability side
of the balance sheet. Net net, when you look at
the bullet pot number three, the balance sheet has
increased by $39 billion. When we look on the asset side, because you remember balance
sheet has to be balanced. So what are the main
movements that actually reflect the plus 39 billion that we have on the right hand
side of the balance sheet? So basically, we see
and remember that Berkshire Hathaway
has been selling for $84 billion of Apple
shares amongst others. So, of course, we see that the investment in
equity securities, so that's bullet
point number two went down compared to December 2023. So we see that rough cut, they carry $69 billion, less in equity securities. They carry 7 billion less in
fixed maturity securities. Did they do with
the cash that they collected from selling
Apple amongst others? And it was not just about Apple. Well, they have invested
into US treasury bills. So you see that compared to six months ago,
the balance sheet, so the asset side of the
short term investments in US T bills has grown from
$129 billion to $234 billion. So, I mean, this is really
high amounts of money. So you see that
net net, actually, when you just make the
sum of those positions, you see, actually
that rough cut. Remember that the balance
sheet has grown by 39 billion. You see that rough cut
from those 39 billion, 30 billion already
explained just by those three position
and movement as well. So that's basically what
I wanted to show you. And in terms of conclusion, what can we say that
Berkshire had the way, again, as very often has
provided solid results. And they have taken in some
serious capital gains, selling rough cut 50% of the
Apple stake that they had. So that was the 84
billion share sale that took place last quarter. So that thanks for
your attention. Talk to you in the next video, do not forget to subscribe
to YouTube channel. Thank you very much, See you.
24. Moat & intangible metrics: Alright, well Investors,
welcome back. We are finishing nearly
this whole training. We're gonna go into
a shorter chapter, which is Chapter number five, which is a little bit
of ongoing research. And I'm gonna give you, if
you remember an introduction, I set some elements
how to measure, in fact, the perception of
stakeholders of the company. And how this can in fact adds
to a mode in the sense of, you remember that in the
level one test we discussed about the mode being the
return on invested capital being like consistently around ten per cent or above eight per cent for a couple
of years in the row. But there is a little bit more. And actually I came
across a book from Philip Fischer that
was called Commons or that is called common stocks
and uncovering profits. You have here the first
page of the book. And in fact, but Philip
Fischer, we're saying, is that when reading printed
financial statements, but a company is never enough
to justify and investments. One of the major steps in prudent investment
quoting here must be to find out about a company's
affairs from those who have some direct
familiarity with them. So basically what he's saying is that it's not enough to
look at the financials. It's not enough. I mean, you coming
back to what I have been showing to you so far, having a level one, level
two perspective on things. But we can augment the
level 1.11 two tests perspective by adding
some attributes that not a lot of investors
actually look into. And that's basically what I
want to share here with you. So when he's
speaking about that, you need to talk
to people that are linked to the company that have some direct familiarity with it. I mean, let's be very fair. This is not easy and specifically it's not
easy for small investors. I mean, if you're, if your
name is Warren Buffett, it's easy to call up the CEO of JP Morgan and have
a chat with a guy. It's probably you have the scale to ask
marketing agency to do some analysis and very
thorough analysis about customer sentiment, e.g. of JPMorgan, all about Unilever. That's something that's frozen. Small investors. It's actually pretty
difficult to do. In fact, here I'm trying to
share with you in this level three tasks, some elements, how you can scale this in a way just sitting
using internet and just sitting behind your
desk without having to do an even you would not have the opportunity to talk to the management of those
big companies that potentially either me or you
want to become an investor. The scatter but
method or technique, as it is called, is a method that actually
looks at various perspectives. It looks at customers, suppliers,
competition, employees. And when you look at
it, it's pretty close. In fact, the five forces
model of microbiota, if you look at, let's say
a strategic definition, strategic assessment methods to see how the company is
positioned on a specific market, on a specific customer
segment, e.g. what I will be sharing
here with you is specifically the
customer and employee, which is pretty easy to gather on supplier and
need to be very fair. I was absolutely unable to
find for the time being, any kind of platform or
website that actually provides a feedback from the suppliers about the company that you're thinking about to invest into. And I'm gonna give a quick
perspective on competition because of course that's pretty
important as well, right? So when we go into
customer sentiments, and I'll try it for each of those two angles of
this customer sentiment and employee sentiment. I've tried to share a little
bit of research backgrounds, what the academic world or the consulting
companies are saying. In fact, for each of
those two categories. So when you look at
customer sentiment and I've put the various URLs, you have, of course, the big consulting
company, Mckinsey. And also there were
some articles in the Harvard Business Review that will actually saying that improving the customer
experience is increasing the overall shoulder written
by seven to ten per cent. And HBR was also mentioning. So they did an analysis a
couple of years ago for airlines I think was for car
rental and also for the, remember the third
category what it was. And they also saw a strong
correlation between, I will introduce the
term net promoter score, the NPS figures and accompanies
average growth rate. So I mean, it feels, of course, common sense then if you
have customers that are happy with your
products, your services, with the after sales
service or your company, that's probably
they will come back at least for me,
it happens to me. We just bought a car e.g. couple of months ago. We like the garage. We're gonna go back
to this garage because the service
is really great. So I will not I mean, at least if I would
have to choose to go for another car company, of course, I wouldn't
be expecting the same level of service. So and by that it's
probably I mean, at the current garage, if I would have to have a conversation
about buying a new car, etc, maybe you're going to be a little bit less pushy
because the service is good. So I know what I would be
losing if I will be switching. So that's a famous
pricing power and switching costs that we're
discussing here in fact. But the point is, how can you, through the Internet have a perspective on the
watts without having to pay marketing agency and spending a lot of money
on your investments. How can you get an
idea about what is the sentiment of the customers about the company that
you're about to invest into. Of course, the first one that I already
mentioned when we were discussing modes on
top of the pure, let's say technical
financial measure, which is return on
invested capital, was in fact, I showed you the Interbrand top 100
brands in the world. There are other agencies that are doing this
like brand z, e.g. and we're going to look at the example of Mercedes
when I will be sharing with you how to look at the customer sentiment for
Mercedes. So here e.g. on Interbrand, you see in fact, here we are not discussing
the value of the brand, but the movements, the variation year over year
and what you see in fact, not only do you see that Rosetta us is on
position number eight, you see that the brand
value has increased by ten per cent from the
previous year, 2021. What does that mean?
It means in fact that customers are happy
and the company has pricing power and has actually increased the pricing
power from one year to the other nodes by
ten per cent because that's the 10% is
about the brand value, the monetary or the
financial monetization of valuation of the brand value. But just by having this is at
least how I interpreted it. Just by having an increase
in the brand value. I consider just by
looking at Interbrand, that the perception
of the customers, of the bias is better. I'm gonna give you two other
examples here on this slide. If you look at position 17.19, you see that Facebook
has gone down by five per cent and Intel
has gone down by 8%. This is for me, just by
looking at the Interbrand, TOP 100s brands in the world. So this ranking that
comes out once per year, I have the first perception about what is the
customer sentiment, but that's not good
enough for me. So I will develop this. Introducing what I mentioned already a couple of seconds ago, the Net Promoter Score. So the Net Promoter Score is
a very maybe you know it, but if you're not, if
you're not aware of it, it's a very easy measure, in fact, of how people are, what is their sentiment
about e.g. a. Company? So we're going to see this also for the
employee sentiment, you're gonna be using the
employee Net Promoter Score. The calculation is pretty easy if you're doing
a survey 0-10, the people that are responding
nine to ten or promoters, the people that are responding seven to eight are
considered passive. And the people that are
responding 0-6 means that they are detractors. The NPS score is calculated. You take the percentage of promoters and you
subtract from that the percentage of detractors and that will give you a score, in fact an NPS score. Let me give a very
concrete example. We were discussing Mercedes and here I am sharing also the URLs. So you have today, at least from my
research, to have, to websites like customer
gurus and comparably. There are providing publicly, you don't need to pay for it. Maybe you need to reduce it, but you don't need
to pay for it. That actually provides
an Net Promoter Score. You see on the left hand
side for Mercedes Benz, the Net Promoter Score
on customer guru is 39. So they have by
far more promoters and detractors on comparably. You see that at least
for Mercedes Benz USA, they don't have it for
the overall company. You have a net
promoter score of 44. So you see that there
are 64% of promoters, 16 per cent of passives, and 20 per cent of detractors. So you see how the
NPS is calculated. It's 64% -20% that
gives a score of 44. Nodding percent is
an, a score of 44. And you see also on
those sides what is interesting is
that you can see, you can compare e.g. here in the manufacturing space. You see e.g. on the
right-hand side that Porsche customers by promoting more the brand
than Mercedes Benz, even though Mercedes Benz
comes seconds for the US. And you see, I was commenting this to my
wife yesterday as well. It's very interesting
because you see Tesla having a net
promoter score of 35, which is like the
lower, let's say, a promoter score
that we have here on this six-seven car
manufacturers. So nonetheless, 35 is positive. So I always tend to
say when you have a net promoter score that
is getting close to zero, the company probably, I mean, customers are not happy about
something at the company. But when you have such high
promoter scores are above 20, that's normally that you have more promoters and detractors. Just for, I mean, as you maybe have heard in the
previous lesson that I have in re-recording this very
first training that I wrote in 2019 that was
published August 20th. So we are now April 2023. I've been fully
re-recording this training. Also, of course,
I asked Chad GPT, if they could tell me the net
promoter score of Mercedes, why why having to look
for specific websites? And tragic PT does not
provide that information. So they provide the
definition of NPS, what it means, but
they will not provide the Net Promoter
Score of Mercedes. That's just for a
little, a little joke, but just a little
cliche about GPT. Alright, So for
customer sentiment, so keep in mind
that you can have a perspective on the overall customer
sentiment by looking at the brand movement
year over year that is being done by those
marketing agencies like Interbrand, like brand z. But you also have websites like comparably or customer
guru that do provide some sense of Net
Promoter Score of customer sentiment
about the company that you are about
to invest into. I would recommend you
that before investing, maybe as a level three tasks, you have to check what is the customer sentiment
about the company. But if you remember in
the scuttlebutt methods or even in the five forces
model of Michael Porter. It's not just about customers, but it's also about
internal people. So because one thing that
is not necessarily shown in a financial balance
sheet and that's a conversation that
would take us too far. So just let me make another
comment is that in fact, talented people are in fact not reflected in the balance sheet and the financial balance sheet. So, but it is important
that you have, I mean, if you're investing
into company as a shareholder, you hope, and you are expecting
for management to treat the people
in a correct way. And you hope that
people are motivated, that they will go a
supplemental mile to satisfy the customers. This is important also from
an investment perspective because this will have an
impact on profitability. This is what I'm showing here. There is an interesting
study that has been done by McKinsey a couple
of years ago. It's not too far away
where they were actually. So the study is called
performance through people. I've put you the URL, why
they were showing that companies that are people
and performance winner. So we're also people are very satisfied that the return on
invested capital in fact, is the highest compared
to companies that are purely performance-driven
versus companies that are only people focus but are not
performance-driven. Versus, let's say
average companies that do not pay really attention
to those elements. But companies as they call it, which are people and
performance winners. In fact, the return on
invested capital is the highest and that's basically
what we want as investors. Because when we invest in
India Company and the market is giving us the company
at a cheap price. What we hope is fact is
that the market will come back and that
the company would generate a lot of profits
over the next two years. And we're gonna see, are passive income coming
in without any issue. And of course, at the
market will see in fact the good performance of
the company, e.g. one. The markets get euphoric e.g. so, um, so keep this in mind. And from, let's say from
a research perspective. Now the question is, how can I, I've showed you how
to look at employee, sorry, at customer sentiment. How can I look at
employee sentiment? And I'm gonna share
with you the side that I've been using for many years, which is called glass or
the glass, the websites, not only surveys, payroll, let's say, feedbacks from the people that are working
in those companies. But they also survey when
people are providing feedback, they also serve a, what is the overall
employee sentiments? If people are happy
with the company, if people are happy
with the CEO. And this is what you see here. And I've taken the example of Mercedes Benz group as we
are taking that example. And afterwards I
gave you the example of Tesla and Twitter as well. So let's see that for
Mercedes Benz group, there are 4,500 reviews. So and there are 7,900
salary feedbacks provided. So I mean, you could
discuss I mean, when you're into auditing e.g. you could discuss if that is a representative sample
the company has. I don't know exactly, but let's imagine that the
company has 100,000 people. I mean, 4,500 reviews. That's nonetheless a lot. So statistically it's
kind of representative of about what is going
on in the company. Do I have to call up employees? So I had to know
somebody who knows somebody who works at Mercedes. No. Gloucester is providing me some insights into that company. And you see here on bullet point number two
at the bottom right, you see that 85% of the reviewers are recommending
Mercedes to friends. 89% approved the CEO. In fact, the overall score for the company is four
dot two out of five, which is a good score. I mean, I think the highest
one is the Microsoft's, which are sitting at
fool dot file dot four. I'm going to deepen that
a little bit further. The conversation I've taken into the extracts from the
Glassdoor Website. So you see that
e.g. for Mercedes, you have an overall
score of photo too. But what's interesting is e.g. when you look at the
trends on the bottom left, you see that the trend actually
is increasing since now, let's say the last 12 months. Even more interesting,
if you click on the CEO approval 89%, you see in fact that the CEO approval trends
is in fact flats, which is a good sign. So people, it seems like from the reviewers that people
are happy about the CEO. So that's the kind
of thing in fact, that provide you
some insights about the company that
you are potentially about to invest into. Glass is not the only one
comparably is doing the same. So not only are they
providing an NPS, So the customer sentiment, but they also providing
an E and P S, which is the employee
Net Promoter Score. And you see e.g. that former cities I did the same research. Here is again only
Mercedes Benz USA. So you had in fact 1132 total ratings, 149
employee participants. So they're providing a
culture score of photo, the one on five. And the overall, let's
say SEO score on this. Let say on a scale of
up to 100 is of 77. And what is interesting
is on the bottom right, you see the NPS score. So that's the, not this time
customer sentiment score, but it is the employee's
sentiment score and it is in fact
of 24, so it's 50, 1% promoters, 22% passives, and 27% detractors from Mercedes
Benz USA to be precise. And you could now, you may ask, Okay, But is this not this
not a beauty contest? Is this not dressed up? And I actually took a couple of companies that are,
I think interesting. One would be Meta and the
other one would be Twitter, which has been taken
over by Elon Musk. And it's pretty
interesting when you look, in fact, if it is on
comparably first, you have the URL
below that meta has an overall rating of 78 out of 100 for Mark Zuckerberg as CEO. And it's interesting
to see that Elon Musk is at 66 other 100s. Even worse for Twitter, you see that the NPS
is sitting at three. So there does a
couple of promoters, but also the amount of promoters is nearly as high as the
amount of detractors. So that's not good. While at Meta you
see that employees, apparently, they, I mean, 56% of the employees are promoters and 25%
are detractors. So you see, in fact, I mean, you read
through the press, we are April 2023 since Elon
Musk has taken over Twitter, that indeed things are not going very well
for Twitter there. I mean, I would say, a lot of, I will not say social plans, but people that are
in fact laid off. And they're like back-and-forth
about the strategy. But Twitter with the, let's say official accounts. I think that yesterday,
two days ago and in Musk announced that he did
not announce, but to, to announce that this is, will be no further official
accounts on Twitter, e.g. so then I compare this also on Glassdoor and on Glassdoor you see in fact for
Twitter specifically, and you just compare
it with what we were seeing with Mercedes. The overall score for
Mercedes, if you recall, was sitting at four dot t2 while at Twitter it sits
at three dots, three. Even more interesting,
when you look at the overall trends
on the bottom left, you see in fact how the
trends really has come down. With all due respect
for Elon Musk. He may be a brilliant guy, but you see that the way
how he has taken over Twitter has had an impact and this is reflected
in Glassdoor. So you could think that Gloucester is not
reflecting reality, but I believe that
this is an example. I will not say that there's
no scientific proof, but this is an example
of signals that you can get from the companies
that you're investing into. Last comment about Twitter, just look at the
CEO approval rate. It's sitting at 13 per cent. 13. So if you compare it
with all our calendars, who is the CEO of Mercedes, he has an approval
rate of nine per cent. So this is I mean, I'm not trying here
now to convince you, but at least I do use
sites like Glassdoor, like comparably to have a
perspective into the company, I do use the NPS score to have an idea about the
customer sentiment if that is being well-managed and if customers are happy
with the company or not, because that will
have an impact. If you have unhappy customers, a premise, your customers,
they're going to switch. Even if switching
costs are high, they will be so
****** off against the company that they're
going to switch. So I believe that this is
something as well that you, at the very end before taking
the investment decision, there will be good that you
do those small sanity checks about what is customer sentiment and what is employee sentiment? Last but not least, just food for thought
here about the CEO and the CEO stewardship and
how CEOs appreciate it. So I'm giving you, you probably know, a couple
of those people we have, Jeff Skilling from Enron, who was involved in a huge
scandal a couple of years ago, and the latest one, with all due respect
for those people, you have the CEO of WeWork, Elizabeth Holmes from
Theranos and our FTX France. Some bank men freed
where I've put you the URLs on YouTube and why I'm discussing this very
quickly here is that, I mean, as business owner, you better know who is
running the business. The problem is, of course, that you do not know if
you can trust this person. And how do you feel about the
person and the difficulty? And you remember Charlie Munger
was stating this as well, that he would like to have
great people that are running the company with a
lot of integrity and also with lots of fairness. And that's something
that is very, very difficult, in
fact, to extract. If you just look at
those interviews from Adam Neumann from we
work through our nose, from SBA, from FTX. It's very difficult. I mean, those people are
I mean, all of them, all the CEOs, they get
communication trainings, they get PR training. They know how to
speak in public. They know how to go around. Difficult question. So I mean, we are not
here now a psychologist, that's not the intention, but I think what you need to be attentive is please do not be fooled by the attitudes of a CEO that is
promising things. You need to do your homework and maybe trust
your gut feeling. How do you feel about
that person being the one that is running your investments
as a shareholder? So this is really
food for thoughts. I know it's not easy, but what I tried to
share with you is, and I'm coming back to
the example of Twitter, that maybe Elon Musk
is a brilliant guy. But when you have a CEO
approval rate of 13%, you have a lot of detractors. I mean I mean, by that you have a negative E&P as employee Net Promoter Score. I mean, you, even though
Elon Musk quotes e.g. during a public interview, speak very well,
be very strategic. B, let's say promising a lot of things at the very
end of the day, if he is making mad, all the employees of Twitter, the best talents will
go away in fact, and that's something that
happened as well at Twitter. So there are ways of
capturing some signal from the overall noise and positive
noise that the CEOs of companies are doing by looking at those
sites like Glassdoor, like comparably,
like customer guru for the customer sentiment. Alright, and then
last but not least, there are other
information sources and I've been asked a
couple of days ago, buy from, I mean, by an investor from the
US from Washington. What was my feeling about the
supplemental information? But first, I will just
want to come back to slides on the role of
the rating agencies. I do consider that
rating agencies are also an overall great source to have perspective about how they
feel about the company. Of course, they really messed it up during
the subprime crisis by providing very high ratings
on instruments that were, nonetheless, that's the
variant exposed to investors. And I think that for
normal companies that have a standard balance sheet where the business
is understandable. I like to look as well, or I consider that the rating
agencies is not just only giving me information about
what is the risk premium. If you remember when we
were discussing solvency, debt to equity ratios,
interest coverage ratios, what is the premium I
need to add to my cost of capital expectations given the
riskiness of the business. But also consider that it gives
me also a sentiment about how these normally
professional people think about the company. And I've put here again
as a reminder, Moody's, S&P and Fitch, they are the
ones like dB, ers, et cetera. She have other rating agencies, but the three big ones are
the Moody as a p and Fitch. In fact, if you
look at Mercedes, the example, you see in
fact, what is interesting. And of course this
comes back again to the long-term solvency
conversation. I see that Mercedes Benz
is categorized as an A2, which is investment-grade,
upper medium grades. That's at least
their perception. Alright, and then to
close up this lesson, I just want to, so coming back to the
question that I was asked by this investor
from Washington a couple of days ago about what is my feeling about
Morningstar in fact, because I sometimes speak about Morningstar and as already said, there is nothing I have no commercial link with
with this company. I'm not a shareholder
of this company. I pay my monthly subscription. That's the only paid
subscription I pay every month. So just to be clear about
the disclaimer here. So when, I mean, just taking a step back, we have been through this
whole course or at least I have been sharing with
your veterans Bradley, how or what are the
tests that are used? I'm using between level one. So those are the, let's say the fundamental
screens, level two, that's the price to book the dividend
discount models that intrinsic value calculations
on earnings and cash flows. And then on every
three, I do look at customer sentiment and
employee sentiment because for me it's important to know
what is going on inside the company
and how buyers feel about the company if
there is or is that buyers would turn away
from the company. And mourning science facts, which is one of the most
known sites providing, let's say, financial
information. They're going to share my
perspective on Yahoo Finance. So in fact, I extracted
for the example of Mercedes has a couple
of elements here. So e.g. on the mornings. So when you go on the
summary quotes page of a specific company,
they provide you. In fact, I will just follow the numbers here on
bullet point number one, they are providing
information how they feel the company
has a mode or not. So you may have companies
that are listed having white mode and narrow
mode, no mode. And then you have e.g. on
bullet point number two, they provide are
certain perspective on from which moment on what they
call the five-star price, from which moment on
they consider that the share price of the company
is really super cheap. And here you see that former sit as they consider at current, let's say fundamentals
and their analysis. I don't know how they
have calculated this, but they consider that
if the share price is below $70 a share, That's, the company is
actually very cheap. This is what they call
a five-star price. And they provide also you
see here a fair value. So they are estimating
that the fair value of one Mercedes Benz share is 117 and at the last
clause is at 76 per cent. So they actually telling
you according to them. So please do not take
this now as a commitment, but according to them, That's currently Mercedes Benz. You can buy it at 34, 34 per cent discount. I need to be very
transparent with you. I mean, you have heard previously
in the course that I've bought Mercedes adds a
little bit below 53, are around 53 a share. So I've did the latest
IV calculations and indeed it's telling me
that it's around 120-130. So I can understand from where they're coming
from in terms of fair value, but I did myself my calculation, looking at the latest
financial statement. What is interesting as
well is that they are providing a price
to book as well. You see that Here's mentioning that the price
to book of Mercedes is 087. They provide the
price to earnings, which is five dot 14. They are providing the interest
coverage ratio as well, which we're seeing is 48 times. So it means that, I mean, it's like a triple a according to the
interest coverage ratio. So the risk premium TV
and it is nearly zero. They also on six, calculate the debt to equity, which is showing
zero dot 99 here. And they also provides
a calculation on profitability on
invested capital. They're calculating
it as of December 31, 2022 at 870 1%, which is basically
our ROIC tests. So you see in fact that
a lot of the tasks that we were looking into, their providing the measures
for that also already my points and then we'll make a comment at
the very end of the day. But let me just make the
pointer on Yahoo Finance. Yahoo Finance is
also public website. You have a lot of inflammation. You see that they provide also an undervaluation
price or for Mercedes, they are saying that
the below 72 is cheap. They provide price to
book unadjusted as well. You see that their
price to book is 086, so it's not the same
number as Morningstar. They do provide trailing
price to earnings. So that's like
trailing 12 month. That's a sliding window
time period of 5008, where if you recall, Morningstar was calculating
four dots, five dots, 14. So it's pretty close with
zero.06 of difference. And they provide up
to equity as well. Yes, it's no, sorry, it's not the debt to
equity they are providing. In fact here also on
management effectiveness, they're providing some
sense of profitability, but they're not providing the profitability on
invested capital, e.g. that's a shortcoming of
the Yo findings website. So now maybe you're thinking, Well, why do I need to
use the companion sheet? Why do I need to read the
financial statements if those guys actually
giving me what I need, which is represented in
level one, level two. And my point is the following. As a series value investor, I want you to be able
to calculate and understand what you
have calculated and potentially using tools like Yahoo Finance mornings
or as conformation. But I believe that
series and vessels, they do their homework, sorry, I do believe
it's too easy just to rely on an external source. And by the way, they are clearly putting a
disclaimer that they're not responsible for what they
are actually calculating. But I must say they
are pretty accurate. For mornings. I must say it's pretty
accurate infant, I cannot say the contrary, and I do use it also when I have to make a
big investment decision. I also have at the very end, after having done my
level 12.3 tasks, I have a quick look
at Morningstar. If they are far away from
my assumptions on that. Alright, so this is wrapping
up chapter number five. So as said, we are discussing that's on top of the level one,
level two tasks. You have things that you have to look into which go
a little bit beyond. Which is in fact a base on what Philip Fischer called
the scuttlebutt methods, customer sentiment and then
pre employee sentiment. So if you are coming
back on this slide, so I tried to show you
how you can cover 1.2. Now you may ask what about supplies and competition on
supplies already told you, I have not found any website. We're actually suppliers
are providing feedback about their buyers
in that sentence. So I don't know e.g. what is the feeling of the
Mercedes-Benz suppliers versus Mercedes would
be interesting. But the very end of the day, it's more important to
be able to monitor how customers and employees
feel about the company now, but competition, and of course, when we speak about competition, we're moving into
the strategic area. Here. We, I mean, for those who are aware, we
are going to be, we should be discussing
Michael Porter and mintzberg, the value stick, pass live ratio analysis,
those kind of things. I need to be very
transparent here and it's not about me now making
promotion of another course, but having a perspective at competition is something
that is not easy. And you would need
really to invest time to understand what
is competition doing? What are the differentiators
that unique selling points between one and the
other company for that, in fact, very quick. Let's say I'm pointing here to cause that also I'm teaching a university that is called masterclass and entrepreneurship and strategic management. When fact, I have a full
chapter why I'm discussing how to make a strategic
assessment of a company. I'm actually also, you see here also the
logo of Starbucks. When I'm actually using
all those tools, the past, let the variety
of the portal and actually explaining to you how to make a strategic
assessment of Starbucks, e.g. so that's something that
would really take us too far. And this other value investing training at the very end of the day and it's not now to
be considered as a shortcut. Of course, competition
is important. I will not say the contrary, but the most important here are the customers and the
employees before competition. And you actually have
people that say, we don't even want to
look at competition, as long as we're able to delight our customers
and delight our employees and our products are good and our
services are good. And now post-sales
service is also good. I mean, profitability
will be there. In fact, I believe
that's a little bit a true short-term perspective on things I believe that
you need to know also. I mean, when I was running the businesses I was
responsible for, I was looking at
competition as well, but of course I was
spending more time on customers and employees
versus competition. Last but not least, that's the last slide for this lecture. So I wanted to also to
share with you what is Warren Buffett's perspective on the scuttlebutt method. And actually in the 990s eight Berkshire Hathaway
annual shareholder meeting, he was asked by a person if he's using Philip Fischer
scuttlebutt method and I'm just reading, so that's a quote from
Warren Buffet was saying, and then I will summarize. So he was saying basically
that I believe that as you're acquiring knowledge
about industries in general companies
specifically, that there really isn't anything like first doing some
reading about them and getting out and talking to competitors,
customers, suppliers, employees, current employees
and whatever it may be, you will learn a lot,
but it should be the last 20 or ten per cent. I mean, you don't want to get too impressed by
that because you really want to start
with the business by you think the economics are good. Quote from Warren
Buffett in 1998. So basically what,
what does this mean? So he's not saying
that the scuttlebutt method, it's not interesting. He's saying indeed, I mean, at that time probably he didn't. I mean, Glassdoor and
comparably did not even exist. So indeed he was
taking a little bit the same productivity Fisher go and talk to the customers, go and talk to the
supplier's go and talk to the employees and
the competitors. But what is important
here, and that's why also, I've put the comparably
glossed or let's say, tools for capturing
some sense of employee and customer sentiment as level of three
at the very end, it's really the
cherry on the cake. I mean, you should
not start with this. You should start with level
one fundamental screens. And if the company
passes those filters, then you go into the
intrinsic value calculation with what we have
been discussing. And only at the
very end you spent a little bit of time
just to confirm a good investment
decision by also having a perception if employees and customers are happy
about the company. That's basically what Warren
Buffett is saying here. He's saying that you
should spend the last 20 to ten per cent on
scuttled button methods. And I'm fully agreeing
with him on that. That's why also this
course is I mean, the whole substance of the
course is about the level one, level two tasks and a little
bit of the level of three. But I think it's good that
you have this perspective. What are those level 3.5. Just by browsing
on the internet, you can find some very
interesting information. Alright, wrapping up here. And the next lecture actually will be the
dominant conclusion lecture. So we add the ends of all
the tasks and I will be wrapping up all my thoughts
in the next closing lecture. Thank you.
25. Conclusion & final assignment: All right, well
investors, welcome back. So you have reached the conclusion of the
Auto Value Investing, which has been
actually the first training I've published on various educational
platforms with the most important
one being Demi. And first of all, I would
like to congratulate you and thanking you for having taken time to or to give me the time to walk you through how I perceive
value investing. And I hope that it was
an interesting journey. I mean, let me just take
a couple of minutes just to conclude on the out of
value investing training. The first thing is, I mean, you can contact me, and I will provide you the
contact information. You have access to Q&A as well. So you can contact me and
do your own valuation, and I would recommend you pick one of the
following brands, BMW, Coca Cola Marks
of Disney TNT. You can also use
another one I had today student who did a
valuation of Google and asked me to have a check if he did the evaluation in correct way or if there were
any mistakes in it. And by the way, I
must say he did it in a very good way, in fact. Um, so, of course, when we speak about
doing the valuation, I'm expecting from
you that you follow the methodology that I have been extensively discussing
with you over those. I think the course is now around 15 hours and that
you do the level one test, level two test, and
the level three test. One important thing, I mean, this is a lecture that I've
been updating in May 2024. So we are May 8, 2024 when I've been re
recording this lecture, a year ago, when I redid the re recording of the whole
Ato V investing training, actually, I would give you
access to an Excel file. The problem with the Excel
file is, okay, I mean, it was worth something to be able to calculate
the intrinsic value. But you had to do a lot
of things manually, downloading the
financial reports, extracting the information,
extracting those variables. So you had 19
variables to fill out. That's not very, let's
say, straightforward. And I do remember, by the way, and maybe some of you have
seen my emails in early 2023. I think was April 2023 when I re recorded the whole the
Auto Val investing training, that there were some
glitches in the Excel file. So I I had not changed the
Excel file since 2020, and I wanted to do a better
improved version 2023. And I ended up actually having to do six
iterations because, yeah, Excel is great, but it follows what you ask
the model to do. And I mean, if you
errors in the formulas. Obviously, it's not correct. So on top of that, and I've already been
mentioning this, and by the way, in
the next lecture, which is the bonus lecture, I'm showing you a full valuation with a tool that we
have been developing since November 2023 that
we just launched May 1, 2024, which is a custom GPT
for those who know chat GPT. So this is called Vine Value
Investing Next Generation. So it's a custom GPT. Specifically trained and fine
tuned for value investors. And instead of using
the Excel file, so I have decided to remove
the EXL file because it's just too risky and there is too manual work involved in it. And we created after six
months of development, this tool that actually allows
you and we have created, first of all, this
tool for ourselves. So I give you the example just a couple of seconds
ago that I had today a student from
Israel that asked me to check the valuation
that he did on a company. And it took me two,
three prompts, and I'm showing this to
you in the next lecture. It took me two, three
prompts just to check if the person had done a correct
valuation of the company. While if you would
be 1.5 years ago, it would take you probably like an hour to do the calculations, the intrinsic valuation and
to the level one, level two, and the level three tests because it was not consolidated, you had to go on different
websites, et cetera. Today, everything
is consolidated in this tool that is called Vinch value investing
Next Generation, and it is available
as a custom GPT on the Open AI I would say store, which is accessible if you
have a HGPDPlus subscription. Some people may not like that, but that's the
condition to be able to use any custom GPTs, not just our Custom GPT,
but for the time being, OpenI has decided
that in order to access those custom
GPTs because they are powered by the latest
OpenAI HGPDPlus model, which is HGPT four, you need to have a HCPD
plus subscription. So sharing in the next lecture, I'm showing you how to do
full valuation with this, but I promise you, and as said, I'm really
insisting on this. We did this for
ourselves, first of all, so we are five
people involved in this project for the time being, maybe the team will grow. But we really did it
already for ourselves because I had enough
of my L file, and it took me too much time for every company to do
a so I would say, even a filtering mechanism on my investment universe
with Morningstar, even though I like Morningstar, but it was just much
time to do this. And then for every
intrinsic valuation, I really had to download
the financial reports or go on Morningstar
and extract the values. So you're going to see
in the next lecture, which is the Appendix
one bonus lecture, you're going to
see how easy it is actually to do a Level one, Level two and Level three. So the methodology
that I've taught you in this chorus how you can actually do this in a very, very productive
and efficient way, and you will not lose a lot of time by using Vinch doing this. So I hope it will be
of value for you. So that's just one thing. So that's just to mention that, yes, I've been re recording
this in May 2024. I've decided to remove the Axl file because
it was just too risky and it was just taking too much time for the
people to do this. Now you have a tool that you
can actually just prompt. It's an AI tool and
you can actually do various variations of
an intrinsic valuation and ask questions about
value investing theory, but also it has at the moment of starting when we launched
it, May 1, 2024, it had 1,100 plus companies and around 1
million data points, including level
three information like brand NPS and ENPS. So, so I recommend
you to go into the next lecture and take
a couple of minutes. I think it's a ten minute
lecture that you see how evaluation is done
with VNG, in fact. So I think I mean,
just to wrap up, I don't want to
controle about VNG. VN is just a tool that will help you in your
investment journey. I think what is really key, and I hope that you will
have understood that what is really key as a value investor is that you don't
act as a speculator, but you really act
as a business owner, and that when you buy companies, as I was explaining when I
was speaking, for example, about Blue Chip companies, that there are companies
that I do like, but they are just too expensive. So I have to wait
patience being one of the potent attributes that you need to have in the
mindset of a value investor, I need to wait until
the market Mr. Market is giving me the company at
a very undervalued price. So and at a certain
point in time, maybe you have to
when the market is overvaluing the company. So I told you that to
me is like when it is 15% to 20% above intrinsic
value that I tend then to throw out and
to take in sort to realize the capital gains
on the share price. And while this so during the period of
time between the moment, I purchased the company and remember that I
said that you can never perfectly time the
bottom of a curve of a share price versus the moment where you
sell the company, while during that
period of time, I want to have passive income through return to shareholders, which is at least cash
dividends or share buybacks, if you remember what
we were discussing in the fundamental screen. So I think this graph really summarizes
everything that I'm trying that I try to teach you in the add
of value investing. So this is, for me,
like, and actually, I mean, I cannot turn the camera around because otherwise
you will not see me. But here, in fact, I
have the exact I do have the exact one
pager on my desk here, and I have here the top 100
best global brands of 2023, and I have here my
three level test, my methodology that I
always keep in mind so that I avoid
becoming arrogant when I'm very successful
investing into the stock market, that I always keep in
mind, what is my method? What is my methodology? So I really recommend
you maybe for you. I know that some people
have been doing this. I had an investor from
Dubai who told me, I like this one page. I've printed out the one
pager, and actually, I have hang it above my
screen so I can see it all the time that I do
not forget how I should behave when investing
to the stock market. And as I said, I mean,
remember that being a good value investor
and just being a good investor and not
speculator requires practice. It requires reading
and understanding accounting data because
it's the lingo, it's the vocabulary of business. You need to be able to know what the value is of
what you are buying or what you are
potentially selling. To have a repeatable
investment process. I think that's really,
very, very, very important. You remember I said a
certain in time that it happened to me more than ten, 15 years ago that I became arrogant because of, let's say, the successes that I had
investing into the stock market, which allow me today. So I've moved now to Spain
since two years Rough cuff, and I'm actively retired
at the age of 50. I'm now nearly 52. So this is thanks
to passive income through dividends and
through value investing. So I'm very thankful for that. I think it's important
that you keep always in mind what is the right
mind that you need to have. And this is something
that I repeat to myself. What is the mindset, and
I stick to this mindset, and I stick to this repeatable
investment process. So, of course, and I think that could be kind of my
concluding message. One course of whatever 14 or 15 hours can
never be exhaustive. And for that reason,
I mean, this course, the first time with
the first version that has become public has
been written in 2020. I think it was August 2020. And in the meantime, I've written more
advanced courses about how to read financial statements,
those type of things. And, of course, what we are now trying to do as well
is to integrate all that knowledge into Vin
as a tool to make it as easy to you to have this
247 advisor or let's say, support agent that can help you instead of having
to send me an email, of course, you can
send me emails. I always tend to answer very quickly within
one to three days, except if I'm on
business travel. But I think it's important
that you have also an AI agent that kind of
concentrates this knowledge, and that's really the whole
idea of this Vingch project. So remember that so as I said, that one course
cannot be exhaustive. There are other courses that are more advanced courses than
the Auto Valley investing, but I believe that the Auto
Valley investing is giving you already a very good layer. And I mean having now
given even conferences, public conferences
about this course, to bankers, to investors, I have received a
lot of feedback over the last four years that
indeed it looks I mean, people like to see a very structured
approach that I have versus value investing, including the Level three, where even some investment bankers
told me that something that is not covered very often, in fact, actually
by banks as well. Remember as well, and be humble to yourself
that you will do mistakes when you
invest your real money. What is important is that the mistakes do
not wipe you out. So please, again, that's
really my recommendation. Do not take up debt to
accelerate your wealth because it may really
jeopardize actually whole, let's say, investment
process and the whole investment
that you did over maybe a couple of
years, a couple of months. So learn from it,
iterate from it, and of course, you may adapt
your investment process. This is just, I would
say, as I said, I'm just giving you
how I'm doing it. I hope it's useful for you, but of course, you need
to make your own choices. I do not invest into biotech. I do not invest into banks. I do not invest into insurance, but maybe you feel super
comfortable investing into insurance companies because you're coming out of that area. Again, I mean, you have to I'm not saying that this
is now the Holy Grail, but it gives you some
kind of baseline on at least how I
invest since now, I think it's now 25
years, and, I mean, I have not been wiped out by following this repeatable
investment process. So again, thanks so
much for having taken the time and the patience for
going through this course. I mean, you can follow
me on LinkedIn. You can follow me
on the website, three sixqua capital.com. You can also follow me,
of course, on Ving GPT, as now this is a new project that exists since May 1, 2024. And we do have also
YouTube channel, but you can always contact me either through
Q&A sections of this course or you
send me an email in case you have questions or
things that are not clear. And I have seen over the last
four years that a lot of students have taken
the opportunity either to post Q&A questions. There are a lot of Q&A questions on the learning
platforms, or otherwise, they send me a private email or sometimes they
just come to webinar, and in the webinars, they
happen every quarter, at least. So their people can also
suggest topics that I will then cover during the
webinar if it is not confidential.
That, thanks again. And yeah, I would say,
do not forget, maybe, to do at least the next lecture, which is about seeing how
Ving does a full valuation. Now, just by prompting by providing a couple of
prompts to Ving in fact. And I think I mean, with that, you will gain a lot of time on the valuation of companies
and your investment process. So thanks again and
talk to you very soon.
26. Case study : Procter & Gamble (PG) - full valuation with Vinge: We'll come back, Val investor. So after the conclusion lecture, this is a bonus lecture, supplemental lecture
where I wanted to share, actually, and this is May
2024, an update that we did. So maybe some of you
who did the training in the past are aware that
there was an Excel file where you could actually
you had to manually fill in all the necessary
elements to be able to provide and to perform
an intrinsic valuation. What we did in the meantime, after the announcement
or an announcement that OpenAI did
in November 2023, so which would
actually allow people to create their own custom GPTs on top of OpenAI's CHA GPT plus. So we have actually created over the last six months
a custom GPT. So it's an AI tool for value investors that has
been fine tuned by us, which has around 100
pages of knowledge. It knows exactly. It has the content of the
value investing. It knows exactly what
the level one level two level three analysis
is, and it has around at the moment that we launch it, we launched it May 1, so it's a week ago that
we launched it. So it has rough cut 1 million data points
for the level one, level two, level three to be able to perform
those analysis. So what I want to
show you here is how a full valuation
process would look like, actually, with Ving. So the first thing, I
mean, I mean, here, it's when I was prompting the model. So I was interested in prompt
and gamble and Mondale. So the first thing
is I'm asking winch. And again, there is a
specific training on Demi about how to use Vinch
if you're interested, that really goes deeper
into understanding Vinch, how to prompt correctly Vine. The risk where hallucinations can happen or what
a bad prompt is. So here I'm asking
Vinch to check if it knows Proc Dan gamble if it has the company in
its investment universe. So it answers,
yes, I do have it, and it's part of the industry household and personal products. And now I'm just very
straightforward asking Winch instead of doing
this manually myself, just perform a level one
analysis for the company. So for Proc Dan gamble. The data points are
updated on a weekly basis, so you don't need to download
the financial reports. You don't need the
Morningstar subscription. You just go there or Yahoo Finance website
consultation, just go in there. You ask inch, perform
a level one analysis, and it provides you.
You see it here. The mode, the price to earnings, didn't yield, divident
payout ratio. The profitability ratios
like return on assets, return on invested capital,
the debt to equity. And what is interesting,
it provides you also an interpretation and
analysis of those results. So what is important here
to say or to highlight or to call out and just look at the price to earnings ratio, you see that the price to earnings ratio for
Proctor is above 22. And actually, inch is
mentioning that it's a little bit higher versus the 15 or ten that we
are searching as a value investor for that
specific fundamental screen. We are here on the level
one fundamental screens. How does Ving know that?
Because we have trained inch? So Ving has been trained with the content of the
value investing, so it knows how to
perform a level one test, but it knows what a good or
bad dividend payout ratio is 30 to 70%. It knows what a good
RIC is eight to 10%. It knows as well what a cheap price to earnings ratio or what a
cheap price to book ratios, what a good debt
to equity ratio. So it has been fine tuned by us. So that's why it already is mentioned that 22 is
maybe a little bit high versus the 15 or ten on the PE ratio that
we are looking for. So here I mean, what
is interesting, compared to websites like
Yahoo Finance Morningstar, they do not really provide
you an interpretation. Vinch because we have Fine Tunit is providing
interpretation on those ratios. Now we are asking because we are not only interested
in Proct and gamble, we're interested in Mondiz, which is not
necessarily competitor, but they are very
close, let's say, serving similar type
of customer segments. So we're asking Ving to perform a level one analysis
on Mondiz and to compare it with the
previous level one analysis of Proctor. We don't like is that
too much tax for us, so the results are
there, but we would like actually to have this in
a more comprehensive way. So we're asking Ving provide us the results and
structure the results in a comprehensive
table and provide the results side by side. And actually, you prompt
the model, you see it here, and Vin is actually
indeed showing both companies with level
one ratios side by side, in fact, and then also
providing some type of assessment of so comparing
both companies together. Now, something that
we also, of course, interested in Level one
as value investors, we want to have
consistency on the ROIC. So we are asking Vinch actually, not just to tell us how was the RIC evolution over
time for both companies, but even showing this to
us in a graph format. This is what you see here, and you see actually how and this is something you can
even download the GPAC file. That's something I mean, that's the power of Open
AI. You can do this. And so you can actually
use this GPAC, for example, in a presentation if you'd be student,
for example. One of the things
that when we discuss, so that's for the
level one part. One of the things
when we discuss the level two part is that, I mean, in the Excel file, you have to decide what are the default values for your cost of capital, for
your growth rates. And one of the things
that we wanted to have because I often receive
that question from students and from
other value investors is so the default value
would be between 6% and 7%. And what we wanted
to have in order to make Winch much more productive
than this Excel file, is that actually we have fueled, we have trained VNC
on various costs of capitals for the I think it
has around 150 industries, and every company, so
when we launched VNG, it had 1,100 plus companies. So every company
is classified in one specific industry
of those, let's say, 150 200 industries, and every industry has its
own cost of capital, and this is updated
on a yearly basis. So it's using Aswadmodarn's public
database of cost of capital. So here you see that
prop and gamble. So you can not only
use a default, cost of capital of 7% in VNG, but you can actually
adapt the calculation and ask Vinch so
either you tell Vinch the percentage that
you want to use or here I've shown you here in this example that I'm
asking Ving to use the appropriate
cost of capital for both companies given the
industries that they are in. So this is actually
what you see here. It comes out, it comes
out actually with ProctnGamble with a
result of rough cut, 7% cost of capital, so 69 or 97. And for Mondes a cost of
capital of 53 rough cut. And now, so that's now the
cost of capital conversation. What is the starting
point for this? And now we are
asking Vin actually to perform the
level two analysis, which is calculate as the IV, discounted cash flow and discounted future
earnings per share. And it will actually
calculate and will provide you so both values for both companies and compare it with the
latest share price. So I think that's
really fantastic. Just have to prompt this.
And not later than today, so we are May it's eighth, yes, 8 May 2024, Wednesday. It's nearly 7:00 P.M.
Malaga time in Spain. And not later than today, I had a student who did the closing assignment
and asked me, can you check if my
calculations are correct? So he was still using the old XL file that has a lot of risk,
a lot of glitches. I remember when I did
the latest update, 2023, I had to do six
iterations because I changed the formulas and
there were errors in it. So I had to apologize
a couple of times before coming up really with a good version of
the Excel file. But at the end, you
still have to do the manual work of retrieving
the information, right? So here, the advantage is that when this student
asked me this afternoon, I think it was a
student from Israel to check if his
calculation was correct, I mean, with one or two prompts. So level one analysis of the company and level two
analysis of the company, done, actually. So it
took me like what, 30 seconds to have
the information. I think that's really the beauty and why we have created inch. I, first of all,
we have created it for us as value investors. So I'm not alone
in this project. We are five people
in this project with other value investors because
we really believe this increases the productivity and the investment
journey by being able to have those data
points by being able to automate level one level two
and level three analysis. So you saw level one,
you saw Level two now. And here you see as well that
you can actually for Vinch specifically ask Winch what are the assumption that
you're using per default? Of course, if you're giving
an explicit indication or information or
instruction to inch, it will use I mean, that will override the
default assumptions. But you could just
ask Vinch perform a level two analysis
on this company, whatever Mondels and it
will use per default, 30 years without terminal value, 3% growth rate for over 30
years and 7% cost of capital. Here, I just wanted to show you through this
prompt that first of all, it's transparently explaining
what are the assumptions. But it's also showing you
that on the discount rate, it has this time specifically
not used the 7% default, but it has used
the discount rate specifically retrieved for
proctanGabl and Mondes. So just to show you
that the model, I mean, you can interact with
the model and play with it. So last but not
least, of course, we have learned in the
Auto val investing level one, level two, and level three, VNG has ten years of
brand data points. It has net promoter score. It has employee net
promoter score. So you can ask, actually, Vin GPT for the
largest companies in the world to provide
brand valuation, brand growth, net
promoter score, employee promoter score,
and those type of things. It has that
information available, and here you see
it concretely on the example of
Proctor and Mondelez. We'll wrap up here. I mean, if you're interested about VNC, you can either go on our
website, vingbt.com, or you have links directly to
having access to the tool. As I said earlier, you will
need a HGPTPlus subscription. That's the condition
that Open AI has set for the time being. It's like this. We don't have the
choice because it's using HGPTFour which is
the most powerful model, and you can only have
access to it if you have a HGPTPlus subscription. It's not a subscription with us, but it's a subscription
with OpenAI, in fact. That's really that's
mandatory requirement, and you don't have a choice
for using any Custom GPT, not just VNC GPT,
but any Custom GPT. And then on the website, you can also see the link to our discord community
where we are also publishing things
about VN release notes, if there are feature requests,
those type of things. That's the place. So go on our discord community and
provide feedback there. Things that you
would like to see in the future development
cycles of VNC of course. And then you will
have also the link if you're on the Udemi platform, and listen to this video, you can directly see that in the courses that are
published on Udemi there is a specific course
on VNchR to go deep into how to use VNC
versus just this very, very quick valuation that I did just showing you level one, level two, level three, in fact. So I hope that this was
useful and that you see, as we see the value
after six months of development by releasing
VNch now since a week, and I hope that
this will empower your value investment journey and give you access to
something that was before, much more cumbersome
to have access to that thanks for your attention and talk to you either
in the next lectures, which are advanced
lectures or hopefully in either a community channel or in one of the upcoming
webinersTk you.
27. Case study : Evergrande : how to analyse its debt position: Welcome to the value investor channel. Hey Val Investors, welcome back to the very investor channel. In this week's episodes where there'll be speaking about the Chinese other grounded group. And more specifically, if the company would pass our debt and solvency tests. So as you may have heard and seen is about ever ground near, there were lately a lot exposing the pressed related to payment issues, specifically on bonds and more specifically their offshore bonds where they were missing a couple of deadlines. Before we go into the analysis of our Grundy. As always, usually financial disclaimer that this communists for informational and educational purposes only and it's not a direct offer or solicitation of an offer to buy or sell. So let's get started. So let's look for us who is of a grandness over grandly is actually the 120 seconds on the Fortunately with I found solace. It's a huge company which serves actually enriches involved in a major industry. So they're active in real estate, New Energy, autos, property services, and even have a theme park. So that is called African and very lands. And they're providing human health services and in a lot of other things. So they do employ around 200 thousand employees in China. And they are linked according to some statistics, to A3 dot-dot-dot 8 million jobs, and they create more than 3 million jobs every year. So if you look at their main revenue pillars, so obviously the property development and this is where the whole depth conversation comes from, is the biggest part of their revenues. So investment, property and property services, those also play some important role, but really, really more than 80 percent of their revenues are linked to property development. And specifically they are mostly present in the east of China. So the Shandong regions, Guangdong, Guangxi, Hunan, et cetera. So there are a lot present day in terms of property development, which other regions that are having most ever a residential projects for sale or that are actually scheduled for sale? The why why are we discussing today? So it's October 2021 way I were discussing this. So there is an issue happening in China and we'll come back to this when we speak about the Chinese government implementing the three red line principles. So that the average house price in China has been growing like crazy since now, half a decade. And it becomes less and less affordable for the people. And some people actually seeing as money is so cheap, which is indeed the case due to low interest rates, that there is a creation of a bubble. And some, actually, some people say actually that ever Grundy is the expression of these real estate bubble that may implodes and we'll have a domino effect on the financial markets. So before we move forward, one interesting point, just to refresh everybody's mind is about this bubble definition or what creates bubbles. So in fact, when we are looking at real estate bubbles and it was the same during the subprime crisis initially, what happened is there was a very rapid increase in the market product property until the process that are suitable in time, they become just or they reach unsustainable levels. And then obviously they're gonna be there's gonna be a decline, so they're gonna be corrected. And you can look into this specifically when you have a gap that builds up between the fair value, so the real value of the asset and the market value when that gap grows exponentially. We're very probably be in a bubble creation scenario. What, and in fact, the Chinese authorities, they, they saw this, they saw the levels of depth that we're growing. They saw the prices of land also that were rising incredibly high in China and also the sales of real estate sales that were booming. And in August 2020, the Chinese government in fact defined and impose three, let's say, three attributes that the real estate developers had to follow in case they would continue, they would like to continue to grow that depth. And three so it's called the three red lines guidance and the three red lines guns actually, and the three attributes later that they are linked to. First of all, that the liability to acid ratio from our balance sheet of the company. So for the real estate developers, the Chinese government is forcing them to have a liability to acid ratio excluding the advanced received. So advanced placement payments of the owners that is below 70 percent and that gearing ratio of less than 100%. That's a second attribute. And the third red line that real estate developers cannot cross is the cash to short-term depth of more than one time. So that's the ratio that they need to follow as well. What is interesting, what the Chinese government in fact has decided it's an imposed on this real estate developers is that if they are matching those three red line, so if their liability to asset ratio is indeed below 70 percent and then gearing ratio below 100 and the cash are short-term. Dhap is more than one time, so they have enough cash to support the short-term adapt so they can continue to grow that depth by 15 percent on an annual basis. And if they do not match one criteria, they can only grow the depth by 10 percent if they do not match two of those three criteria, that annual growth In depth of those real estate developers can only grow by 5%. And if they do not match the three criteria, which in fact is the case for ever granted. We're going to see that later on. They indeed are absolutely not allowed to growth, adapt so that the growth of the dapp is, can only be at 0%. And this is something that also UBS has been sharing an interesting documents in January 2000, 2001. If you look also at the, let's say the price of our Grundy have a grenade being quoted on the Hong Kong Stock Exchange. What was interesting to see is that in after oecus 2020, the share price was at around 28 Hong Kong dollars, and today it's at three. So the obviously the, let's say the speculators, I don't think those are investors, but the speculators, they saw that over ground. It was overpriced at 28 and there was a cell of that happened and the sell of continuous up to today. And so if you're interested, you can look on the Hong Kong Stock Exchange ever Grundy, the ticker is 33. 33. And you're going to see that between August 2020 where the stock was priced at around 28, It's no I mean, the stock price has been divided by ten. So what we are looking here is specifically analyzing the adapts. And for those who are interested, you can have access to a depth value investing course on Skillshare and Udemy platform that is called the art of value investing. But here we're going to look specifically at the upper grounded adapter. And we're going to look at a couple of interesting ratios that are part of our fundamental tasks. One being the low debt to equity and the other one being also how external rating agencies, what was their sentiment about the depth that is carried by other grounded in their balance sheets. So if we start with analyzing the debt to equity ratio already when looking at the annual and quarterly reports of ever Grundy, there is already one thing that is pretty interesting to see is that they are carrying bonds. Not only obviously, I mean, the stock listing on the Hong Kong Stock Exchange with a ticker 33. 33 is obviously listed. But you can already see from looking at the annual and quarterly report I've ever Grundy that they carry senior nodes. So Syria, a senior corporate obligations that are due short-term 2022 and 2023 at a massive cost interest rate of 11, 12, and 13 percent, which already kind of shows if you know how corporate bonds work, that the depth is considered as being very risky. So they need to pay off a high coupon in order to be able to put together a fresh money from those corporate obligations. And what is interesting as well, and there's an interesting analysis that has been done also by Bloomberg is that the amount in terms of millions of dollars that have a grand day has to pay. I mean, there is a lot that has to be paid between now, so end of 2021 and by end of 2023. So if you learn something that you need also to know is that there is in the adapt that ever ground is carrying, there is some onshore tab, so that is debt that is due and that has to be paid out to Chinese credit holders. And there is offshore depths and the option of depth. So this is where the credit tellers are outside of Shanna. What is interesting is what happens as ever Gandhi was short of cash over the last weeks, is that ever Grundy was able to cover and to pay out part of the coupons. That Would you, for the own short absolute to the Chinese credit told us, but some offshore creditors and they would not receive the money that they should have received later to bond coupons because actually there was not enough cash in the balance sheet. So as part of the assets of our Grundy and this obviously created a huge increased the fact that markets became very nervous about it. We'll, we'll have a grantee be able to pay off already the coupons and the payments that are due array now short-term, not even looking at what is the amount of coupons that have to be paid out in 2022 up to 2023. So as value investors, we obviously, and this one of a very interesting ratio that we look. The debt to equity, debt to equity analyses the liabilities. And when you have a look at the balance sheet of F0 grand day, and I've been looking at the consolidated balance sheets of ever granted until end of June 2021. So those those are unaudited figures because it's an intermediate quarterly reports. So half your report, what you can calculate is that ever Grundy is carrying a total amount of liabilities at 2 0, 1 dot 966534. So it's two billions of yuan RMB is, while the equity is only at 411041. And so there is clearly an issue if you would do the calculation between the amount of liabilities and equities, you divide 19, 6, 6 by 4, 11. You, you see that the debt to equity ratio is at 386%, so at three dot-dot-dot 86 percent and even the nuts depth. I mean, there is a problem. Let's be very clear. There is a problem in the amount of adapted that of a ground-up carries towards compared to total equity. And we as value investors, we tend to like to buy into companies where the debt to equity is below 3. So already here, Let's be very clear. It's a fail in terms of debt to equity ratio for APHA Grundy. The second ratio, when we look at depth of companies in general as value investors, is what we call the interest coverage ratio. So the lower the ratio, the mother company is burdened by that expenses and less capital is available. And typically as value investors, and in general, not just the value investors, we tend to say that when interest coverage ratios are below 15 or lower, I mean, what the company generates in terms of profits is being nearly eaten up by the payment of interests. And with that, I mean, the company cannot grow. The company does not have any capital that remains available to be able to expand what they do. So so it's an issue, it's an issue. And if you look at ever granted specifically, again, looking at the consolidated statement of income ending June 30th, 2020, 21, again, remember those are unaudited reports because it's not the annual reports. We see that EBIT or earnings before interest and tax divided by the interest expense. So it's at a 150. So the interest coverage ratio at 150 means that nearly the whole profit that is generated by F0 grand day is used to pay off and to make the payment of interests. So there's nothing nearly left in order to even pay out or reduce the amount of depth is just to cover the interests that are needed, which is pretty, pretty dramatic. Second ratio that is, investors would like to look into is your operating profit before interest. And they are indeed also VM. I mean, if you would add the operating profits and you would add it indeed, with a new divide it by the interest paid. You're going to see you're going to be iteration of one that 73. So again, there is not enough profits generated by the company to cover. Or it's really, really very shorts to pay out what is, in terms of interests needed and what the company has to pay out to the credit totals. So that's pretty problematic here. So again, we would clearly classify the interest coverage ratio as a fail. So that's assigned for us that we would not invest into that company. One of the conversation that is coming up with ever Grundy is indeed, if something happens to have a grand day, that the depth cannot be paid back to those external credit hellos and you have understood there are some onshore, So some Chinese creditors and some offshore, so some external. So it is interesting to understand is who is exposed to the bonds of our ground there. And there has been an interesting articles about this, about who are either the domestic credit holders or the international credit totals. And in fact, there are a lot of banks like the Agricultural Bank of China, the ICC, That's the Construction Bank of China. But also some international banks that have a certain amount of exposure to the ground and bronze, like BlackRock, UBS, HSBC. So, so yes, what happens if ever grounded goes bankrupt? Those banks will be sitting on bonds where they will not see the money coming in because other credit told us because apocrine is just, they do not have the possibility to pay back those, those banks. That's something that we will have to continue to observe what is happening in the upcoming weeks. As you have. What I said earlier is that it's not just now that there are some coupons that are due, but there are many payments that are due between now and the end of 2022 and also into 2023. If one of the interesting tests that I wanted to make as well is also to analyze the three red lines that were defined by the Chinese government in August 2020. So the first one, which looks at the ratio between liabilities and the assets excluding prepayments. And you remember that the first red line asked are requested by the Chinese government is to be below 70 percent. And when you do the math, you see that on the amount of liabilities. If you remove indeed the prepayments, you're at 88%. So clearly the liability to assets is too high compared to the first red line of the Chinese government's already here you have one of the three, which is a fail wherever brand they will already not be able to grow the depth by 15 percent, just by missing already the first red line. They will already only be able to grow the depth by 10 percent, of course, another condition that the other two red lines are not crossed. Let's look now at the second red line. So the second red line is the net, net debt to equity. And so the nap that actually you remove cash. So you, you, let's say subtract cash from the liabilities because cash is available directly, It's very, very liquid asset. But even with that is by reducing the liabilities with restricted cash and cash and cash equivalence and dividing it by the equity, you are again at above 300 percent. And remember that the second red line defined by the Chinese government was asking that the net adapt. So the difference between a debt to equity and net debt to equity is that in that depth, you remove cash to reduce the amount of liabilities. But even here, a grander is at 300 percent, so way beyond the 100% that the Chinese government is asking. So consequence of that already, two out of three are not matched. So the level of growth that ever grown it can have in that depth is already at 5% and maximum because you already do not match two of the three red line attributes defined by the Chinese government. So clearly, again here it's a fail. And if we look at the third red line defined by the Chinese governments, so that's the cash to short-term debt. So obviously looking at short-term debt, you need to look at the current liabilities and removing indeed everything that is long-term liabilities. But even here, you see that the amount of cash, and even if I would add the restricted cash, the amount of cash that is available to cover the short-term debt is definitely by far not above 100%. So the ratio again here, it's a fail. So what does this mean concretely, is that ever Grundy is not allowed further to growth, to grow its depth. So we are here at 0% that will be allowed by the Chinese government. What is the consequence of that? Well, we're going to discuss this, but first of all, I mean, it's not just about every Grundy we need to look also at how the other real estate developers, they match those three red line criteria. And there has been an interesting article that was on, I think that the website was bonds evaluate.com where there wasn't analysis that was done and other Grundy in fact, was not the only one that wasn't matching the three red lines defined by the Chinese government August 2020. But they were in fact three companies who have a Grundy Greenland and select China. While other ones. In fact, what happened? And this is something that's and you see it in the presence of a grantee has started to do the I mean, what are the options that they have? They will probably have to sell off some assets at a discounted price to be able to collect fresh money, fresh cash, or maybe they going to ask to their equity holders to do recapitalization, to bring in fresh cash. Certainly increase the amount of equity available, but they do not have too much choices. And obviously you can imagine that selling assets, what we call a fire sales under emergency conditions. Obviously, if you are on the pressure, you going to give a higher discount when you're setting up your assets like flats, like a car, when there is an urgency and you need the money tomorrow, you will be, I don't know, giving a discount of 50 percent, 40%, 30 percent, but for sure you will not sell it at a premium price. So that's really what ever ground has really to do now is to either recapitalize and find new money, not through depth. So they have to look at the equity holders. If the equity holder, so the shareholders can, and otherwise we'll have to sell off assets. And it's kind of going into a partial liquidation scenario. So we already see that's on the the test of having a low debt to equity, which are fundamental screens that has value investors will look into already have a Grundy is clearly not matching this. So above three. And also when you add the three red lines that the Chinese government has, August 2020, I mean, it's three times a fail as well. What's interesting also to analyze as a value investor. And again, if you look at my training, that is called the art of value investing in my level three tasks, I like also to look at not only internal metrics, but also external metrics. And one of the metrics when looking at depth specifically what it is all hear about. Other Grundy is looking at. External rating agencies, what do they say about our grounding? And you remember that when you're looking at the annual reports of a grand day, they were already listing like in a 10 K 10 Q report in the US, they were already listing that there were senior nodes, do 2022 and 2023, that we're carrying a very, very high coupon rate at 11, 12, and 13 percent, which are huge amounts, which shows that the depth is risky. And it is interesting to see. And from the rating agencies, I like to look at Moody's. I like to look at Fitch as well. What is interesting to see is how Moody's and Fitch Rating have a great day. And until, let's say the summer of 2021, Moody's was rating the adapts. So the corporate obligations of ever Grundy as a B1. But it's very, very rapidly. Just a couple of months downgraded the credit rating of a grand day from B1. It's quickly went to B2, then to CA1, and then to see a. So they actually have in downgrading massively since now a couple of months, the, let's say credit within us of our ground there. Same for Fitch Finch was carrying still in September 2020, have a grand day with a rating of b plus. And then they downgrade it to be minus in June, CCC plus in July, and then CC in September. And by end of September, they even further downgraded the rating to a C. And just as a reminder, when we look at, so typically as I said earlier in the rating agencies, we do have a Standard and Poor's, Moody's and Fitch. And Moody's and Fitch tend to give those fingers available, let's say just by registering to their websites. So before the crisis and all this news and press coverage starting with ever ground day, the depth of our grand day wasn't ready in the category of high credit risk being rated B1 on Moody's and Fitch. So we were already not in, let's say investment grade bonds. And now actually, if you remember that depth a of a ground day by Moody's have been downgraded or has been downgraded from B1 to a CA. And for Fitch from a B plus to a, see, the category actually is a near default with possibility of recovery. So I mean, a further downgrade is that the company has to go into liquidation and the company goes bankrupt. So you see that the risk, as they see it, is extremely high, that the company is very, very close to default. One thing and it's not the purpose of discussing it here. But what could be discussed is why, why suddenly in just a couple of months, let's say in 34 months, adapt that was rated as high, credit risks suddenly went down to near defaults. So that's something that we could discuss. Why the rating agencies only did this over the last three months, but at least what? They did it and I wanted to give it the proof that since June 2021 for Fitch and again, more or less the same time period for Moody's. They indeed have been downgrading the depth of Afghani. But again, remember, if you would have invested into our Grundy, you were already with corporate bonds that were considered as high credit, so we were not in the investment grade. So here again, as a value investor and we like to have investment grades, corporate bonds so that the external rating agencies consider that it's a serious company that will have enough money to pay back the extra credit TO loss. We want to have at least a kind of triple B rating up to an a double or even triple a. So clearly here I have a grantee is also failing. If we look at this from the reading glasses of a value investor, has been failing on this task as well. So one of the things that I always like to do, and because I always believed that value investors, they make kind of a mystery what they have in their portfolio. I always like to also to benchmark and to compare my portfolio, my investment portfolio, with the cases that we're analyzing. And in this case we are analyzing our grand day. And so if remember, if you have been looking at my training or going onto my website, 36 square capital, this is my family fund that is being run where I expose what are the positions when I sell and buy things. So currently I still holds publicist, which is me, I communications, Nestle, diamond or BAs after non-unique and Telefonica, Microsoft and Kellogg's. So I have, you see a couple of seven European companies and to US companies. And you can see from, I mean, if you look at it from an investment grade perspective, all those companies are at least triple B, so considered with an adequate payment capacity to a strong payment capacity. And the resident one company, which is Microsoft, which has a triple a. So they have the highest quality in terms of corporate obligations. And obviously looking at the debt to equity at cash to short-term debt at liability, to assess the interest coverage ratio the companies that I have invested into, they match a lot of those criteria. We want to have as value investment terms of having a low debt to equity ratio. So below three at the cash to short-term them is pretty high that the liability to asset is below 70 percent, that the interest coverage ratio is way above 15, so that the profits that the company generates only a very, very small part is used for paying back debts and interest payments. So and this is a reason why on my nine companies that I currently carried my portfolio in October 2021, all of them match those criteria because I do follow obviously my own rules as a value investor. So if you compare now those ratios and this, what we have been discussing in this session, obviously you can refreshing everybody's mind you that the debt to equity of our ground is a three dot 86. The cash, the short-term DHAP is very low. Liability to asset is way beyond 70 percent interest coverage ratio is very close to one. So nearly all the profits of the company are being used to pay back just the interest payments of the credit of the US. And you have seen, and you have heard through the looking at Moody's and Fitch at the external credit rating agencies have been downgrading strongly of the last three to four months. The rating of the bonds, the corporate obligations of African day. So with that, thank you for having listened in. You can find an in-depth and invest in training called the artifact investing on Skillshare and Udemy platforms. And don't forget to subscribe to my channel and make sure to use the subscribe button below. Thank you.
 Candi Carrera, CEO & co-founder Vinley.ai | Value Investor