Transcripts
1. AI UX Storytelling with Data: Hi and welcome to this
course about telling stories supported by data using
chat GPT code interpreter. My name is Jacob Macneal and I'm a service designer
with a background in product engineering. And I'm also the co
host and producer of the podcast Designing
the Robot Revolution. I have an enthusiasm for
telling captivating stories, and I found that again
and again when I want to make my communication
get across, especially in my design work, one of the most
effective ways is to use data to
strengthen my arguments. Just like a good story makes for a compelling topic easy to
understand and remember. A well made chart or graph can do the same
with complex data, turning numbers into pictures, making it easier to understand. Remember, it can also look really cool in a
presentation if it's done well. However, the process of crafting these charts
can be daunting. Conventional tools like Excel and Powerpoint have their
limits and can be unwieldy. Coding might seem
like a challenge if you haven't done it before. Here's where the power of
advanced AI tools shine. In this course, we'll
journey through creating, engaging,
and impactful, and then tailored charts, transforming raw data into
effective narratives. We'll also touch on chart
design that is informative, visually pleasing, and
congruent with your brand. All the while getting
all the help we need with coding from our
friendly AI assistant. This course is dedicated to
empowering you as a designer, giving you more tools to
talk about your designs. We'll delve into a
multitude of topics, including common chart
types like bar graphs, line graphs, and scatter plots. And how to employ them to weave a compelling
design narrative, avoiding typical mistakes
in data visualization, and discerning when to choose one specific
chart over another. We will customize your
charts to augment clarity, aesthetics, and alignment
with your brand. By mastering these skills, we can better interpret and communicate research findings
and design decisions. Fostering a shared
understanding of where we are and where we need to
go in our design work. Whether you're a US professional,
a service designer, or just someone fascinated by the idea of
storytelling with data, I am thrilled to
welcome you aboard. Let's embark on this
journey together to unlock the narrative
potential of your data. Welcome to Storytelling
with Data, A Chat GPT code interpreter
course for designers.
2. Augmenting Narratives with Data: Why incorporate data and visualizations into
your narratives? Well, consider stories as your means of making
sense of the world. They simplify complex concepts
and make them memorable. When we enhance these stories
with data and visuals, we give our narratives depth, making them engaging
and persuasive. Think of data as the factual
framework of our story. It provides a tangible evidence
that lends credibility. For example, you might have implemented a
fantastic new feature. As a UX designer, you could simply state that this feature improved
the user experience, but that lacks concreteness. If you support your
claim with data that shows a 30% increase
in user engagement, it suddenly carries more weight. Your narrative now has a
solid evidence back core, but data alone can be dry. That's where visuals come in. They transform data into something that's
digestible and memorable. In the US design scenario, a graph showing the
increase in user engagement demonstrates the impact of the design change and
makes it memorable. It's an artifact that
colleagues and management will remember easily and
that they can go back to. To be reminded of your
success as a designer, one of your key roles is to tell compelling stories
that communicate your designs, value,
and intentions. This is best done by
not only thinking about textual and
verbal information, but also involving data and
visuals into your narratives. If you're not used
to working with data or you want to
speed up your workflow, this is where Chat GPT with
code interpreter comes in. With code interpreter, you can explore your data, generate
meaningful visuals, and guide the data
storytelling process in a conversational
and interactive way. Here's how you can make
the most out of it. Identify the narrative, start by pinpointing the
story you want to tell. Usually for a designer, this is based on something you've done or would like to do. What's your message? What action do you want your
audience to take? This narrative forms the
foundation of your story and informs your selection
of data and visuals. Select relevant data. Once you have your narrative, find data that supports it. This could be data that
illustrates trend, compares elements,
identifies an outlier, or even highlights a
counter intuitive point. Crucially, data should
offer compelling evidence that strengthen your narrative and persuades your audience. Gpt can support you in
exploring various datasets and identifying the most relevant and impactful data
for your story. Choose effective visualizations. Armed with your data, you need to decide
how to visualize it. Different data types call
for different visuals. Trends over time are often
displayed with line graphs, comparisons are well represented using bar graphs
or scatter plots. Parts of a whole are effectively illustrated with a
stacked bar graph. Though pie charts are commonly used to show
parts of a whole, they can often be
misleading as humans struggle to interpret
angles accurately. There are many more versions of graphs and charts
that can be used, but these will get you
a really long way. Well, select the
visualization that best communicates your data and
supports your narrative. Which GPT you can
experiment with, different visualization
types and get feedback on
their effectiveness. Finally, incorporate your data and visuals into your story. They should not be tacked on, but integrated into
your narrative. With each piece of data and each visualization
advancing your story, chat GPT can assist in creating a seamless narrative
that combines your text, data, and visuals into a
cohesive and engaging story. Creating narratives with data is an interactive
iterative process. Initially, we
explore our data to get a sense of how to
support our story. This exploration, guided
by our understanding of the data and the
insights we wish to reveal, often leads to
unexpected patterns or insights that
reshape our story. Chat GPT is a fantastic tool
for this iterative journey, enabling you to
continuously refine and improve your narrative based
on your data exploration.
3. Working with AI Tools : A caveat on using Chat GPT for your data
driven narratives. While Chat GPT and
other AI tools are great for exploring data
and shaping narratives, it's essential to remember that it's still a machine
learning model. Its responses are
not always perfect, and in times it might
produce results that are inaccurate or
misleading, or confusing. This is particularly
true when it comes to complex or nuanced topics where context and human judgment
play a crucial role. While chat bots can be invaluable assets in your
narrative building process, it should not be the sole
basis for your story. As a responsible designer, you have a duty to ensure the accuracy and
integrity of your work. This means that it will
need to fact check. You will need to
research critically, assess the information
and insights provided by chat GPT
or other chat bots. Here are a few guidelines
to help you navigate this. Don't rely solely on chat bots. Use them as a starting point, but always cross reference its output with other
reliable sources. Seek expert opinion
when necessary. You need to always fact check the information
provided by Chat GPT. This is especially
important when dealing with statistical data
and historical data. You should find the data in
other places and then use the chat bot to modify
it and you work with it. Information that comes from a
chat bot is not infallible. Be critical of the information that it gives you if it seems contradictory or it doesn't fit with what you've
learned elsewhere. Remember that you
are the storyteller, while a chat bot can provide
assistance and insights, the final responsibility
for the accuracy and quality of your
narrative rests with you. By maintaining a thoughtful
and critical approach, you can ensure that your
data driven narratives are both engaging
and trustworthy. With tools like GPT
at your disposal and continued practice
and experimentation with different data
visuals and narratives, you'll soon become an
adept data storyteller.
4. Data Visualization with Chat GPT : Now we'll look closer at the
core tool for this course, chat GPT and its
code interpreter. Hi future Jacob here. I just wanted to
tell you that in between me recording
the talking head for this video and me recording the video of me doing
things on a GPT open. I decided to rename the Code Interpreter to
advanced data analysis. Every time that I say
code interpreter, the advanced data
analysis works, It's the same thing,
it's just a new name. And you can be pretty confident that open a eye will rename
things as they see fit, as they feel like they need to evolve their product in
order to make more sense. With that being said,
I'm just going to restart the video here and
you can continue watching. Enjoy this tool is like having
a friendly math wiz and a coder at your side
ready to help you create amazing data visualizations
with just a few instructions. It's available in the
pro version of chat GPT and setting it up and
running it is a breeze. What is the code interpreter? In simple terms, the code
interpreter lets us run Python code right inside of our chat instead of just
talking about data. We can play with it, analyze it, and turn it into eye catching visuals like graphs and charts. Setting up the code
interpreter is easy. Open chat GPT, and click on your account name in the
bottom right corner. Click on Settings, then
open Beta features. Flip the toggle next
to Code Interpreter. Now when you start a new chat, you'll notice a drop
down menu at the top. From this menu, select the option that says
Code Interpreter. And just like that, you
have your own assistant being able to code and
help you interpret data. Now for the fun part with
the code interpreter, we can ask chat GPT to
create graphs from our data. Just imagine having
a spreadsheet full of numbers and turning it into a colorful bar chart
or a detailed line graph. For example, you might ask, can you create a bar chart
showing the number of World heritage sites
per country and chat GPT will create a
chart for you to download. This feature is super helpful if you're not a fan of dealing
with numbers or coding. But even if you are, it's a great way to save time and focus on the big picture. That's it, with the
code interpreter, you're ready to dive into the world of data visualization. Enjoy the journey, and remember, I will be here to help
you along the way. If you have any questions, please write in the comments. I would like to see
things that you do, post them into the projects that would make me really happy.
5. Finding Data : Line graphs are great
for showing trends over time or for exploring the
link between two things. But before we make a graph, we need the right data. To have a good line graph, you need at least two
different types of data. One type is your
independent data, which is oftentimes time
or a sequence of events. This data goes on the
x axis on the graph. The other type is
your dependent data, which is the information that you're interested in studying. This data goes on the y axis. The point where these two meet are then joined to form a line. For example, if you
want to see how your plants height
changes over time. Your dependent data
could be the number of days since you planted
it, that's the X axis. Then your dependent
data could be the height of your
plant on each day, that would be the Y axis. As UX and service
design professionals, the kind of data that you will utilize often emerges
from different sources. Including user
research, AB testing, usability tests, and
real world usage. Each of these sources
bring unique insights and their effective use can greatly enhance your
design process. Here are some examples
user research data. This could be qualitative data like user ratings for
different features. Or quantitative data like task completion times or
error rates Shut. Such data can offer
insights into your users behaviors,
preferences, and experience, giving you a rich
understanding of your users AB testing data when you're exploring different
design alternatives. Ab testing can provide
invaluable feedback. You might track metrics like conversion rates, bounds rates, or average time
spent on a page to measure the success
of each variant. Real world usage data, real world usage data collected from actual
users interacting with your designs in their everyday environment can provide the most
direct insights. This type of data includes
elements like analytics, data, log files, customer support interactions, and
customer feedback. It allows you to see
how your users are genuinely engaging with
the product or service, what issues they're
encountering, and what parts of the design
are working well or poorly. As you gather and analyze data, ensure it's relevant
to your research. Questions are reliable and contains the variables you
need for data visualization. Remember, the goal is to use this data compelling story that aids you in
the design process, informs stakeholders, and ultimately results in
a better user experience.
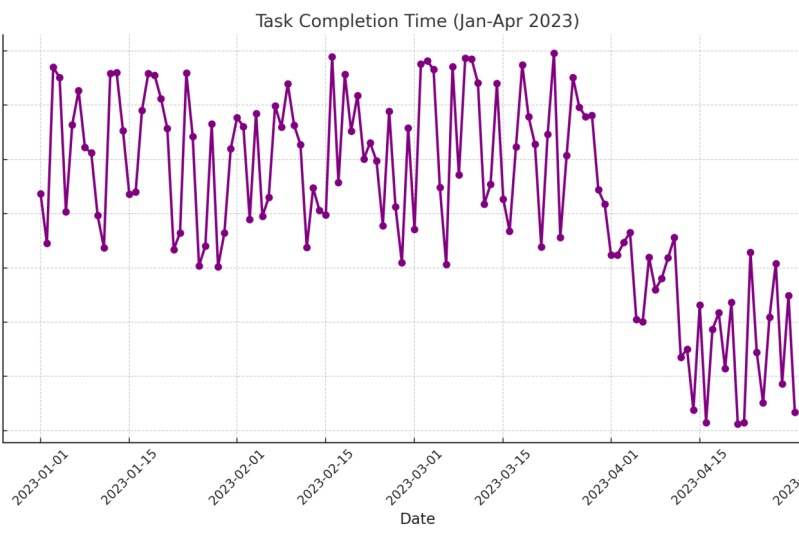
6. Line Graphs: Having gathered your data, we're now prime to venture into the exciting realm of
crafting line graphs. To illustrate, let's
assume that we have some real world
usability test data, where we've tracked the
time the user took to complete a specific task on
a website over six months. This data measured in
seconds can help us see if the website's
usability has improved. To visualize this data, we'll have our AI
friend use a tool. Many Python programmers
adore Matplot Lib. This is a library in the
Python programming language that enables us to generate a wide spectrum of static or animated and
interactive charts. Today we're using it
to craft a line graph. Let's proceed to plot our data. Here's how you might ask
Chat GPT to do this. Could you generate a line graph illustrating the
average time taken by users to complete the task on the website from
January to June. Here's the data and then we insert the data
file into Chat GPT. The x axis should
denote the months and the Y axis should signify the average completion
time in seconds. Please add a fitting title
and labels for the axis. Chat GPT will then analyze your data and construct
a line graph which you can download and
incorporate into your presentations or reports. You can further personalize this graph you needs
by specifying colors, styles, and other attributes in your instructions to the AI. There we go,
Leveraging chat GPT, we've converted our usability
data into a line graph that lucidly explains the trends in average task completion
over a half year. Such visual
representations enables an instant understanding
of the trends compared to pursuing
raw numbers. As you continue to work
with the code interpreter, you will discover that
it's a potent tool for transforming data into
enlightening visuals. And always remember,
practice brings perfection. Don't shy away from
experimenting with different datasets
and types of graphs.
7. Your First Line Graph: Now we're going to get
into your own project, creating your own line
graph with Excel data. First, you need to
gather your data. Find a dataset that
interests you. This could be data
you've collected yourself or you've sourced
from an external resource. For a line graph, you need
at least two variables. One will be your independent
variable, that's often time, and the other will be
your dependent variable, the one that you're
interested in tracking. If you don't have your own data that you want to work with, I will provide you with an Excel file that I've
called Project One, where you can replicate the one that I just did in the lesson. Step two is to
prepare your data. Enter your data into an Excel
sheet or use the one that I provided with each variable
in a separate column. Make sure that the
data is cleaned and formated properly
for visualization. Step three is to import
your Excel file. Just drag the file into the chat and then create your line graph using the code interpreter. Ask GPT to create a line
graph with your data. Step five is to
interpret your graph, look at your graph, and identify the trends and relationships
it illustrates. This is where the real power of data visualization comes in. Ask the chat bot to tell
you what it can about the data and the
graph and look at it yourself and try
to understand it. When you're done,
please write in the project section about how this process was for
you and maybe you can even upload an
image of your graph.
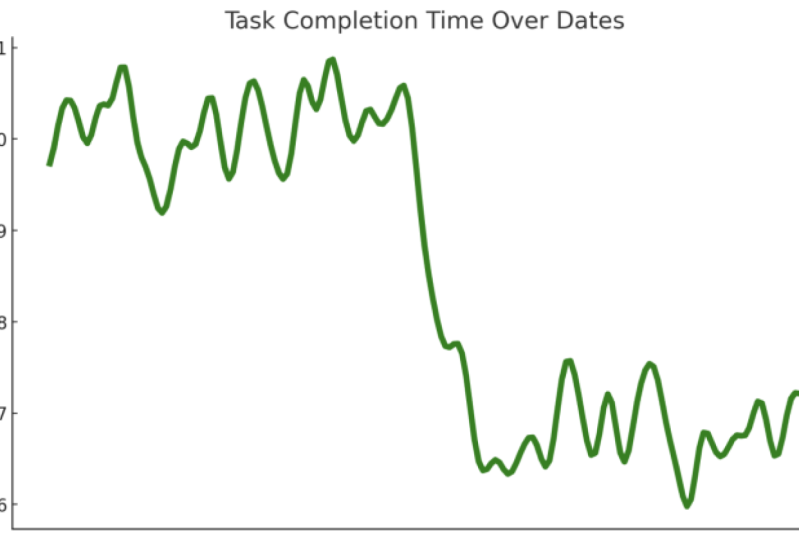
8. Make your Graph Beautiful: Now that you've made your
line graph with Chat GPT, let's make it look even better. As a designer, you
know that looks are important when you
need to show your data. Here are some things that
you can do with a GPT. You can remove the grid
and x axis, just say, remove the grid from
the graph and take away the x axis for a cleaner look. You can change the line color. You can say GPT. Please change your line color
to whatever color you want. You can make the line thicker just to make it easier to see, just ask the chatbot to do that. You can smoothen the graph. This is a little bit technical, but you can use a Gaussian
filter to smoothen the lines of the graph to make it easier to see
what's going on. The bigger trends, you can take away the top and the right
border for a more modern look. You can change the font here. You need to think about
what fonts are available, but you can ask the chat to tell you that so that
you can put it there. One thing that I have done for my example is that I've made the labels shorter by
not having them be the date, 012023, for example. I just have it January or
Jan. Then you can save it. I've chosen SVG because
that works for me. Just ask it to do that.
With these steps, your graphs will not
only show the data well, but it will also look great. Now it's your turn to try these steps on your
own line graph. First, make a line
graph with GPT. Then use these steps to make
your graph look better. When you're happy
with how it looks, save your graph and think about how the changes made it better. Remember, you can modify
these steps to make it more like your
style happy graphing.
9. Impact/Effort Scatter Plots: Now we're stepping into the
world of scatter plots. Scatter plots are potent
visual tools for comparing two variables and identifying possible correlations or
patterns within those. In this lesson,
we're focusing on a very specific type of scatter plot commonly
used in our field, the impact versus effort plot. Before we begin
crafting this plot, let's understand the
underlying concepts and what kind of data
we need to create one. The impact versus
effort scatter plot is a strategic tool used for
comparing and prioritizing ideas or projects based on their estimated impact effort
required to implement them. Impact. This could refer to the potential
benefits value or positive change that
implementing the idea or project would bring to the
company or your group. The effort is the resources required to implement the idea, including time,
money, or personnel. Each idea or project is then plotted as a point on the graph. The X axis typically represents the effort and the Y axis
represents the impact. What data do you
need to create this? The data you'll need
for an impact versus effort scatter plot often
comes from ideation sessions, workshops, or
brainstorming sessions. Each idea or project is
then evaluated based on its potential impact and the estimated effort
required to implement it. The impact and efforts
are often measured on a scale 1-10 or one to 100, ensuring that they can be
compared on the same graph. Now we're going to
create an impact versus effort scatter plot with
the code interpreter. We have our data and we're ready to create
the scatter plot. For this lesson, we'll use data from a recent ideation
workshop where different ideas were evaluated based on their estimated
impact and effort. Let's start creating
our scatter plot. Here's how you
might instruct GPT. But given the file
with the effort, impact ratings, I could have also typed
them into the chat. Now, could you create
an impact versus effort scatter plot using the following data from
our ideation workshop. The x axis should represent the effort and the Y axis
should represent the impact. Please label each point with the corresponding
idea name and add a suitable label for the axis
and the title for the plot. Now Chat GPT will then process our data and generate an impact versus
effort scatter plot. The generated plot can be downloaded and used in your
presentations or reports. You can further
customize the plot as we did with the last
plot that we did. You need to specify colors or other attributes in your
instructions to the AI. With the help of Chat GPT, we've transformed our
radiation workshop data into a scatter plot that visually communicates
the estimated impact and the estimated
effort of each idea. This visualization will
allow stakeholders to compare these ideas quickly and facilitate informed
decision making. As you continue to experiment
with the code interpreter, you will find it to be
a valuable tool for translating data into
insightful visuals. Practice makes perfect. So feel free to explore
different datasets and types of graphs to enhance
your design presentations. Thank you for joining
in this exploration of what we as designers can do
with the code interpreter. I think that this
is a fabulous tool that I will be using a lot. Remember to be a
little bit careful with what you ask GPT to do. If you ask it for a dataset,
it might make it up. But if you add a dataset
that you have verified, you're in good shape to
start working on that and making a good visual
representation of that data. I hope that you've learned
a lot through this. I'm sure that you
have questions. If you do, please write to me in the discussion or add a project
to the project section. I'm really, really curious
what you think about this. I hope that you will
experiment more with this. I have a great day. Thank you.
 Jacob Magnell, Service Designer, Innovation Strategist