Transcripts
1. Introduction : What is the secret to
understanding users and creating value-adding
insights to help you serve them with better
products and services. That's the question
that we will try to answer in this course. When I ask people I know to be really good at analyzing
qualitative data, what it is that makes
them so good at it. I often get a black
box our answer, they are doing something that is consistently leading
to valuable results, but it's hard for them
to take what that is. And almost no one seems
to be able to really explain the process that
takes them from raw data, meaningful insights
after some discussion, the conclusion is usually
that analysis is a craft. You have to practice
it to get good at it. It's not something
you can easily write down or
explain to someone. That in turn results in
everyone having a little bit of their own methodology and
ways of doing things. But I believe that we
can do better than that. My name is Jacob magno. Welcome to this course, qualitative analysis
eight strategies for UX and services
and professionals. I am a service designer,
design researcher, podcast host, and public speaker on automation and design. The one thing that
I've always loved with doing design is research, going out and speaking
to real users and trying to capture their feelings
and thoughts on a topic. Then to go back and
analyze and understand what solutions we
can create that will really make a
difference to these people. If we can understand
people's needs, well, then we can use
that understanding to create a beautiful service or a product that actually helped them and improve
their experience. Many of the strategies that I'm going to present in
this course are based on the work of Joan Americans and Brenda Gladstone and
their research paper, value-adding analysis, doing
more with qualitative data. Other strategies
are based mainly on my own experience
as a service designer, as well as discussions with colleagues and
experts on the topic. Before we get into
the strategies, I want to tell you about
the class project and talk a little bit about the fundamentals of
qualitative analysis.
2. Class Project: In this course, we'll go through eight strategies that
you can use to get insights that go deeper
than what is obvious when you just sort
through data or label it. This course is aimed at advanced practitioners and is designed to start
a conversation. The best way for me to
internalize what I hear and read is to discuss and then
summarize my findings. Therefore, the class project
for this class is based on one or two discussion
questions per strategy. These questions are meant
to encourage conversation, will work best if
you collaborate with someone to discuss them. If that is not
possible, you can, of course, also think about
the questions on your own. After exploration or
reflection on these questions, please write it just
a short summary. It doesn't have to be
much a couple of words. You can post them in the
project section to stimulate even more discussion and get input on your thoughts
on this topic. I will absolutely do
my best to comment on all the class projects
and try to give my input. I'm really looking
forward to this. If you have any
questions or thoughts or you disagree with any of
the concepts presented, please reach out
to me and I will try to give my view
on your questions.
3. Qualitative Data: a Primer: Qualitative research
originates from social and behavioral
science and a spread to more commercial
disciplines such as user experience and services ion in the last
couple of decades. The reason for the
spread is simply that it's really hard
and really risky to develop new products and
services without having a good understanding of what it is that
people actually need. If you couple that with
the fact that people are generally not very good
at articulating means. Well, then you
have that need for qualitative data analysis
within these fields. So what exactly is a
qualitative data property? Well, if we go to Wikipedia, we can see that a
qualitative property is a property that is
observed and can generally not be measured
with a numerical result. In contrast, if we can
measure something, it is likely to be a
quantitative data points. Uh, quantitative data point
could be that the number of pet dogs in Sweden in
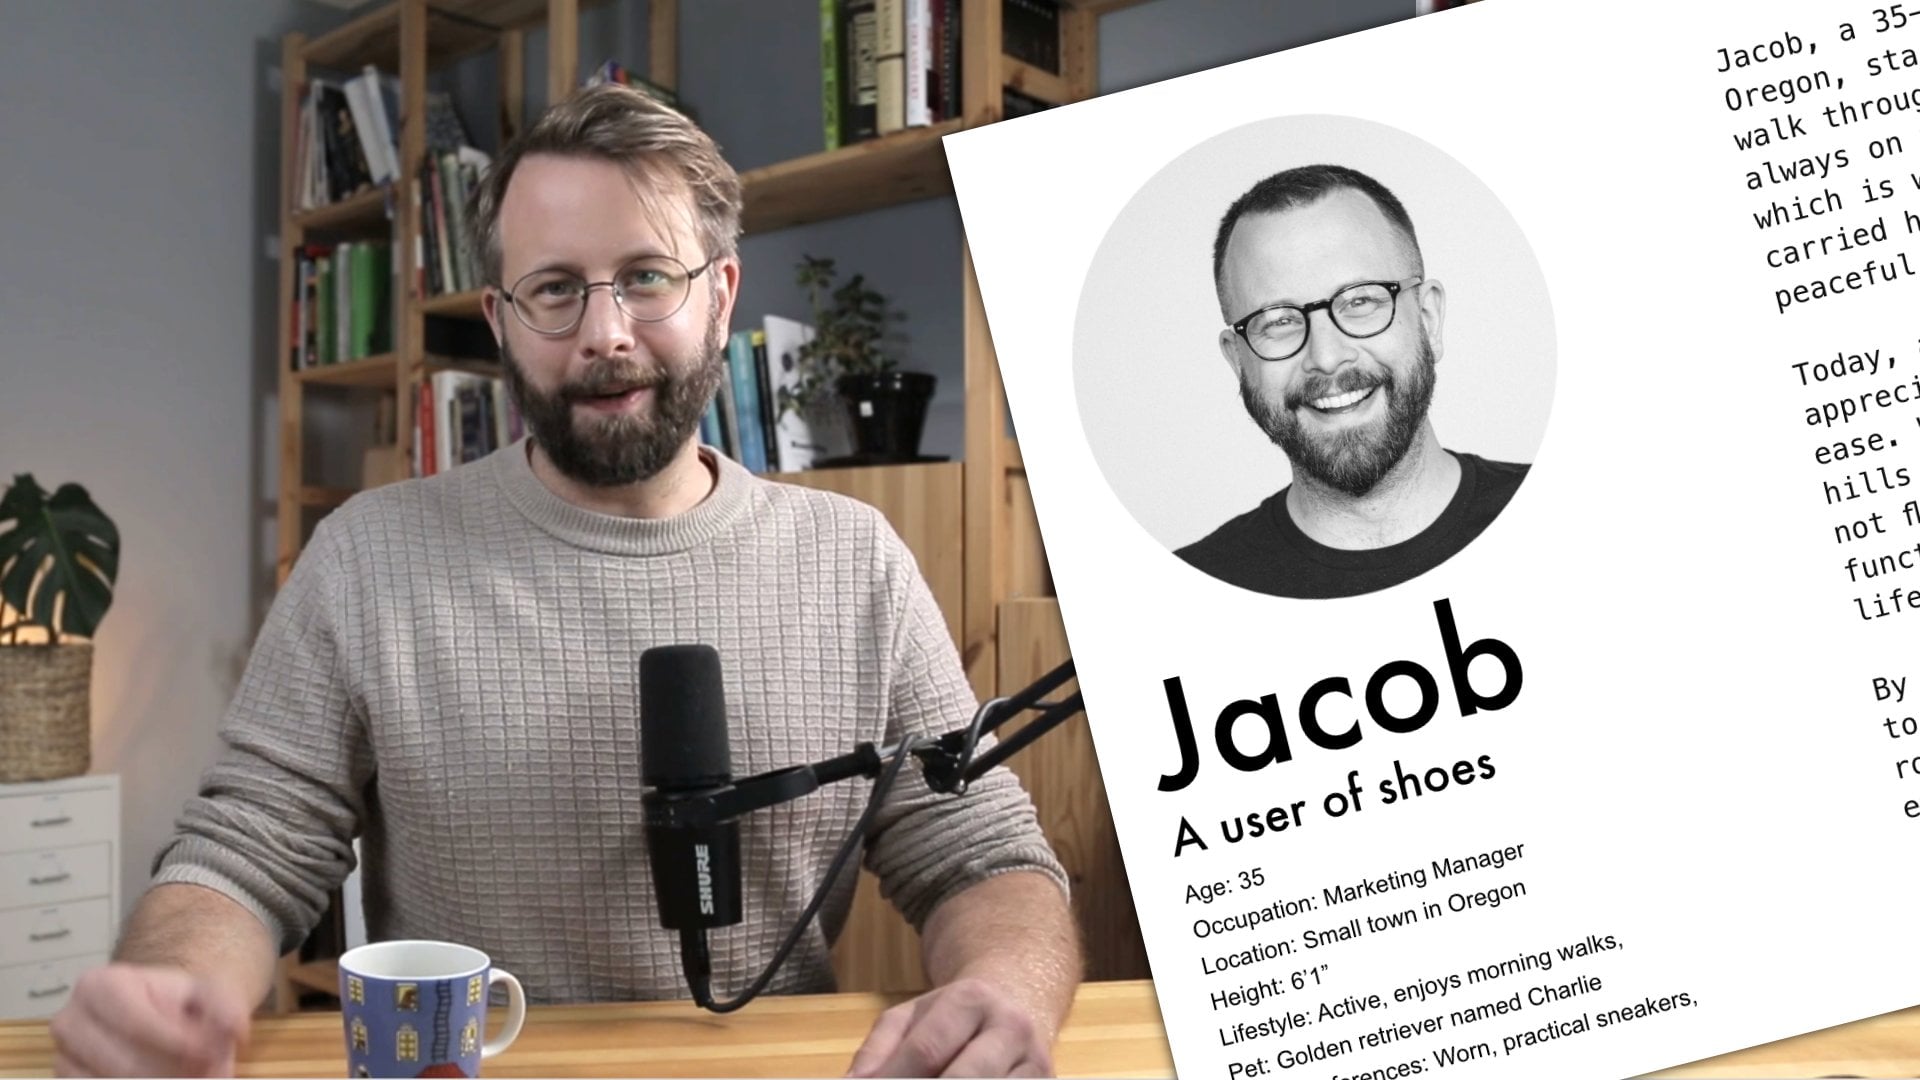
2022 was around 880,000. Whereas qualitative data point from an interview with me about dogs in Sweden could sound
something like this. The participant was surprised that there are so many
pet dogs in Sweden. He would have guessed
that it would be around half that number. So we have a similar topic, different types of data, and radically different
perspectives. If we generalize, we can say
that quantitative data tells us what is going on and
qualitative data can tell us why. So now we know what
qualitative data is and a little bit about how it relates to quantitative
measurements. Let's talk about how
we get access to good qualitative data
in the first place. Methods for collecting
qualitative data ranges from interviews to focus
groups and observations. These ways of collecting data are pretty often quite
straightforward. Sure, you will definitely benefit from practice
and training, but it is relatively easy
to break them down into discrete steps and
then explain to a null is how it should be done
one thing after the other, to describe how to
go from that data to a crisp and clear and
actionable insight that will help us understand
what drives and motivates people is
much more challenging. Some basic methods. Our recurring when
people tried to deal with analyzing
observations. Clustering, e.g. is one of my favorites. It's a widespread method, is the method that I
use as the basis for all of my analysis
clustering and it's basest form is simply taking something
that you've heard or observed and then you group that together with
similar findings. Then you go through
all of your data until patterns emerge
and you're kind of done. This to me is a very
gratifying activity and to my knowledge
and experience, it's the best way
to make sense of large amounts of
observational data. Clustering is an
excellent start. But if we just do that without more systematic and
thorough reflection, if we just label
and sort our data, we risk creating insights that don't add anything
new and that are not actionable or simply
don't add much value. We can do much better
by consciously employing strategies to
widen our perspective. View problems from new angles while we're clustering our data. Qualitative data analysis
is a craft and you will improve with more practice. Also, the more you read and
learn about diverse topics, the more comprehensive
your ability to analyze qualitative
data will be. You'll just know more. Sometimes different steps in qualitative analysis can feel time-consuming, which
can be stressful. If you're under
time pressure from a product deadline or you have
an in-patient stakeholder, it can be tempting to
take shortcuts when doing things such
as transferring data from transcripts
to a clustering space or rewatching videos
from your explorations. But every time you
read through discuss, work on pull apart, put together your observations. The easier and faster it will be to create value-adding analysis. Doing the basics well is key to applying the concepts
presented in this course. If you are new to
serve as design or you want a refresher
on clustering, you can check out my other
course, service design, a practical guide to creating value through user interaction. It's a beginner's course for someone who has yet to
practice services sign, but wants to get into it
and understand it better. Or you just want to
see how I do things. You will learn the
fundamentals of clustering as well as planning, design research
project and how to collect qualitative data
in the first place. Next up is the first strategy.
4. Strategy 1: Work Together: The first strategy is
not so complicated, but it is worth reiterating. For me, this is the single most
important thing that I do in order to
improve my research. And that is to work together on the analysis with other people. Working on these types of problems is always
better in a group. And I recommend finding a diverse group that you
respect and want to work with. Doing this has several benefits. First, it brings new
perspectives and challenges. Any individual
bias that might be present if you were
working on this alone. If you don't have people to
question and check your work, it can be easy to
overlook problems in your findings and then just
miss valuable perspectives. The second really significant
benefit is that it allows for shifting between individual thinking
and group thinking. If you start by internalizing the material and making
just initial clusters and drawing conclusions
until you feel like you have progressed as far
as you can on your own. Then if you go to your group and you present what
you've come up with, you will trigger
the other people to build upon your
understanding. I guarantee that
shifting back and forth between these states will
deepen your analysis. For this to work, you will need to build trust within the group
and make sure that you're willing to challenge your own conclusions based on what your peers come up with. If you e.g. invest really heavily
emotionally in your findings or conclusions and
become defensive, then this could be a
really tough time for you. If this happens, the
best way to handle it is to be open and transparent
with your group members. Then just tell them that
this is how you feel. There might be just an angle
you need to explore before you can drop an idea or
something like that. As with most things, teamwork is a skill
that gets better with practice and it's
worth practicing. For the first part of
the class project. Please think about
how working with other people has changed
our project's outcome. It doesn't have to
be service design, it doesn't have to be research. But how has working together with other
people versus working by yourself changed the outcome of the work that you've done. In summary, work together with people and then iterate quickly. You should make time to work
by herself on the data, but make sure to prioritize running through your
findings with other people. After a few rounds of this, you will come up
with great stuff.
5. Strategy 2: What Does This Mean to Me? : The second strategy is, I think it was for me at
least the most controversial. I call this one. What does this mean to me? When we're sitting
there with our data, thinking about what
the participants has answered and what they did. I want you to consider
these three questions. How am I as a designer, reacting to the situation? What's the eggs do I have
in what's happening? And whose side are my arm? The answers to
these questions can range from you as a designer, just doing this for money, so you don't care one way or the other how the study ends up. It can go all the
way to you being genuinely upset with the
participants situation. And you've personally wanting to go out there and help them. There is no right or wrong here. But the answers to
these questions tell you something about how you are affecting the
results of your study by being affected by what
you are observing. Maybe you're willing to
compromise a little bit, just a little bit
with the results to make sure that every stakeholder in your project is happy. Or you feel very strongly that one person has
a moral high ground. And because of that, you want to make sure
that that person gets portrayed in a
really good line. All these things are okay. They will happen because we are human and nothing more
we can do about them. The tension comes from
the idea that we, as researchers should merely
be neutral observers. There exists a sentiment that it's almost
immoral for us to let our experiences and emotions affect the outcome of
a research study that we should somehow
strive to make it as unbiased as possible to
allow the study to be pure. No matter how we look at it, We will affect the
study's outcome just by doing the analysis. Therefore, it's
much better to be aware that we are affecting the results so that we can ensure that we counteract
it when we need to, or that we simply are
just mindful of it. This is not a bad thing, and it's just part
of the process. If we're aware of this, we can ensure that we don't let our biases creep too much into the data and create
a product that is in turn unnecessarily biased. When I first read about this, I was a little bit
provoked because I thought my opinions and experiences should not be part of any study. But just thinking
about this more, it makes sense to me that just awareness of our biases is much better than ignorance. For the second part
of the class project, I would like for you to discuss and think
about the following. How do you react to
the notion that you being part of this
research project will change the outcome. For me, it's really cool and interesting
to think that someone else doing the same analysis on the exact same data
as I have access to, would focus on other details
and would come up with some conclusions that I just
wouldn't or even couldn't.
6. Strategy 3: Everything is Data: In this third strategy, we will focus on enriching
the data collection itself. What happened outside of what is inside of
the transcript? Can we augment what
the participants said with relevant observations
of what they did? E.g. the participants smile at unexpected points
in the interview. Another thing that
we can look for is what was happening
in the surrounding. What does the
environment look like? These are just some examples of data that can add value
to your research. The important part here is that our interpretation
of What's going on, how things appear does matter. It might give us some clues
into what's happening that isn't immediately apparent
from just what was being said. Look for things
such as are there big stacks of magazines
in the waiting room? If so, that might mean waiting
times can be really long. They're more extreme example. And something that I've actually
seen is that if there is bulletproof glass
physically separating the service providers
and the users, that tells us a very
different story about how the service providers
views its users. Learning to recognize
what things are relevant, what fits into the
ongoing analysis takes practice and experience. It's something that we need
to remind ourselves of. Do many times to get right. Any exploration of user needs aims at figuring out
ways to create value and unexpected
data that can help in that endeavor will
always be welcome. In summary, considered the unexpected and the
environment where your users are as potential sources for insight
for the class project. I want you to think back to when you were last in a waiting room. How was that experience? What were the surroundings like? What does that tell you about how the providers of
that serve as we're thinking of you and
the other users and customers in that situation. Have a quick think about that and write the summary
in the project section. I will see you in
the next strategy.
7. Strategy 4: What is This a Case of? : This one I think is kinda juicy. I like this one and I
use it all the time. It's called what
is this a case of? The idea here is that we want to generalize and make sure that any conclusion that
we draw from what we hear and what we see applies
to other situations. If we can increase the
level of abstraction, we can compare what we have seen and heard two other
things in other contexts, giving us new perspectives
and more profound insight. I tried to ask myself at
all stages of a project, how can this thing
that I have heard about or seen be
generalized explicitly? I asked myself the question, what is this a case of? Another thing to consider is if there are other things
I've heard or observed in some different contexts
that could be applied to the situation I am
researching right now. Lastly, we can take away
all the markers, e.g. if you remove the word Dr. and call them
specialists instead, what does that do to
your interpretation of what is happening for this
part of the class project. I would like for
you to return to the previous example
of the waiting room. Explain that situation shortly and then generalize it in
order to help you along. Here's an example from me. Last week, I went to
pick up a package that had arrived at a
local supermarket. I took a cue number and waited. While I sat there. I had nothing else to do, so I looked at the
other people around me and what they might be doing. Nothing interesting really. They were buying sodas and magazines, not
really unexpected. But finally, when
it was my turn, I was called up but they
couldn't find my parcel, so they had to get a manager to help me
find that package. So now I'm going to
generalize that story. It might sound
something like this. Last week I went to
a service provider. The service was located in a
large commercial building. And I took a cue number and just sat there and looked at the
other people around me. They were buying goods mainly
for direct consumption. Nothing spectacular. When it was my turn, there was a problem. The person that was going
to help me how to call a specialist to provide the
service to me satisfactorily. Now that I have walked
you through my example, please do the same for
your class project. Describe the situation
that you have been in and then generalize it.
8. Strategy 5: Finding the Anomaly: Finding the anomaly,
that's interesting usually for people engaging
in this type of work. We're really good at connecting the dots and sharing
that we find everything that fits
together in groups or pairs. And from that, we can build a cool and coherent story that we can tell
our stakeholders, which in turn will help them
understand what's going on. What we wanna do here instead
is we want to look at what doesn't fit into the
narrative that we're creating. What I can be guilty of is I tend to maybe
not go that deep into those things and perhaps sometimes even discard
them and move on. Sometimes it's because it's
hard to see the connection. And other times
it's simply easier to ignore minor
contradictions in the data. Dismissing it as insignificant. What we should do instead is celebrate the
inconsistencies. It doesn't have to mean that our conclusions or
insights or wrong. It just means that there is
some contradictory evidence. We want to comment on
that so that we can address it and make sure that we don't miss something that
is really important. Contradictions are not
always easy to spot, so we have to look closely and make a real effort
not to miss them. One thing that can insert
inconsistencies in our data is the self-image of the person that
we're talking to. If they want to protect
a behavior onto themselves because
they wished that they would behave in
a particular way, in a situation that
might not align with some other things that
they say or do in the study. So that can make
it so that we get a little bit of
contradiction in the data. This can be really confusing, but recognizing it can make an interview really,
really interesting. So for this one, I want you to tell us about
a time when you learn something that was contrary to your what you thought was true, how did this change your
perspective on that topic? One of the things that humans
generally are really bad, that is accepting
that they were wrong. However, if we want to
understand what's happening, we have to practice
this as a skill, learn from it and
move on together.
9. Strategy 6: Don't Forget About the Gestalt : We're already at
strategy number six. Don't forget about the Gestalt. Gestalt as defined
in the dictionary, is an organized whole, then is perceived to be bigger than the sum
of all its parts. Where we sort through our
clusters and create our labels. It's sometimes easy to forget
that there's a bigger story than the individual clusters of data that we're
looking at right now. So there's a bigger whole. How does everything in the system that we are
looking at fit together? That's the real question. How do we ensure that we capture the bigger story behind all
of the clusters together? One effective way of doing, just done is to consistently
take notes about the overarching themes and insert them in
between our clusters. This way, we remind ourselves
of the bigger story. Doing something simple
like that can really help us zoom out of the details
and see the wider picture. For this class project, I would like for you to think about the concept of gestalt. How would greater attention
to the bigger story around the individual clusters
affect the project that you have been or are
working on right now. So that's something
to think about. I'll see you in
the next strategy.
10. Strategy 7: Read Between the Lines: Strategy seven for better
qualitative analysis is reading what our participants
to see between the lines. This is something
that you can do during your data
collection again, and it's quite similar to strategy three,
everything is data. Write down when
there's a long silence in response to a question. Consider what is not being said. What's the question sensitive
to the participant? Silence can sometimes say a
lot about how things are. But bear in mind
that silence means different things in
different cultures and for different people. It can be a sign that
someone is uncomfortable. It can be a sign of respect or simply
that the person that we're talking to
needs a little bit of time to process
what has been said. We should know
overinterpreted islands as well as we should
avoid ignoring it. For the class project, I would like for you
to try this thing out. You've probably heard about it. But the next time you speak
to someone and you ask a question that is not
immediately answered, just let that silence
drag out a little bit. After 7 s, which is a long time, I can almost guarantee that the other person
will tell you something, sometimes giving that
extra time to think and that little bit of
stress that comes with a longer silence can produce
really interesting insights. So that's something that I think you can try and please let
us know how that went.
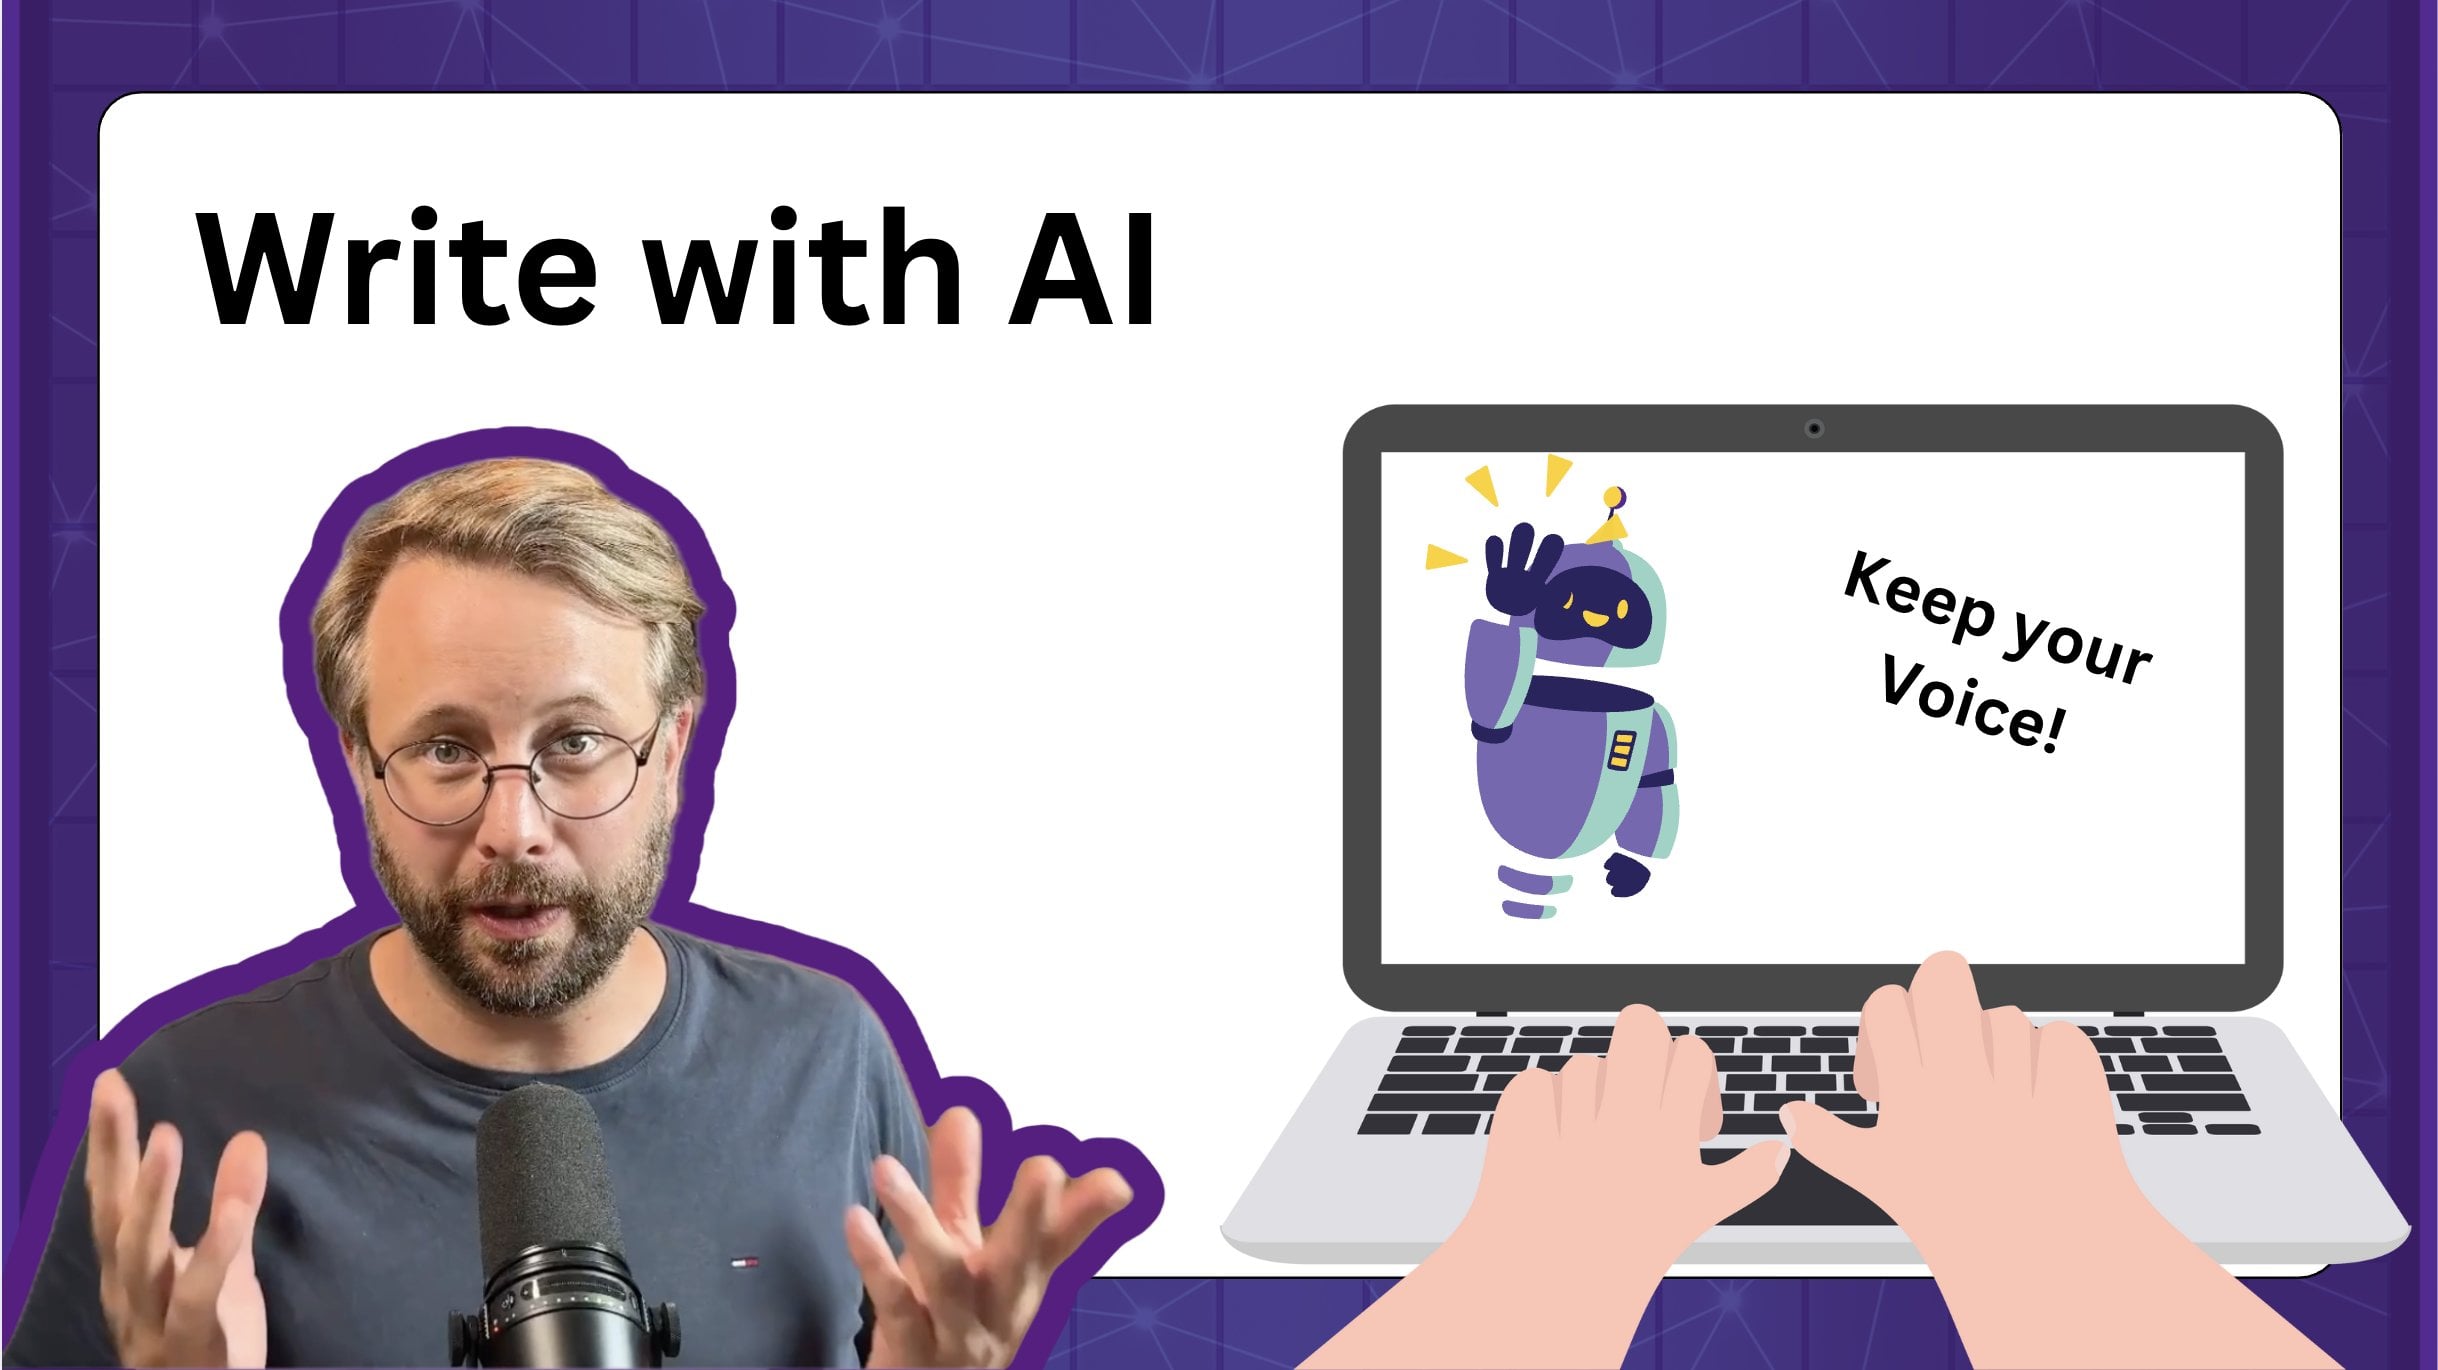
11. Strategy 8: Write More: We have come to the
eighth and last strategy for better qualitative analysis. And that is to write more. We should consider
writing to be part of our analysis process rather than the result of what we've
done as our analysis. This is a really
powerful way to think about constructing new models
around what is happening. We should take care of
that writing process and see it as something
precious and value-adding. There are two simple
tricks that I like to think about
when it comes to this. First of all, I like to
create a working title for a project that describes
what we've learned so far. And then you just update that title as you learn
more through the project, makes sure that
the titles capture that gestalt that we
were discussing earlier. The second thing is to
think a little bit about what changing the language
dust or research. Consider the difference
between writing. The participants claimed
that they did something and the participants
said that they were doing something in
the first instance. Why are they claiming things? Are they not just
telling me the truth? Well, how you write about your research changes how someone will perceive your findings and that can change the
outcome of your results. I would encourage you
to try playing with words like that to
change the meaning of your findings and discuss what's specific pieces
of language does. That is the last piece
of class project that will leave you with
as well for this course, I want you to write about something that
happened today and change the wording while keeping the content of
your story the same. What happened to how readers
can interpret that texts?
12. Final Thoughts: I am so looking forward
to seeing your projects, this is a tricky subject and I for sure do not
have all the answers, but together we can
discuss what it is that we're doing and what
works and what doesn't. Hopefully, this will let
us create better analysis when we dive into our
qualitative data. We've touched upon
this briefly earlier, and I don't want to create a
whole strategy around this, but make sure to
just read a lot. Be curious, and make sure that you have
multiple points of reference that you can bring into your qualitative analysis. That's really going to change
the way that you're able to interpret what you hear and see when you do your
data collection. If you have liked this course, I would be super happy
if you could write a review and rate it
here on the site. I am hoping that you've enjoyed this class project
and that you've learned something
new in this class. Some of it might seem
super obvious to you. Some of it might seem very contrary to what you
thought previously. But I think having the discussion around
this topic is what makes it worthwhile if you're curious about more
stuff that I do, I would like for you to know
that I have my podcast, designing the robot revolution, where we discuss automation that is good for people,
planet, and business. One of the episode is about this very topic is linked
in the course description. With that being said, I really hope that
you've enjoyed this course and that you
have learned something new. And until I see you
have a great day.
 Jacob Magnell, Service Designer, Innovation Strategist