Transcripts
1. Course Introduction: Hi there, welcome to this class on creating infographics with a rebellious shatter, my name associate, and I'm a course instructor for this class. In this short tutorial, we'll learning how to create various kinds of infographics and data visualization in Illustrator by drying weird as charts and graphs. That allows us to represent data in an attractive way where you can add your own visual creativity to convey a message on heritage story with a chart. In this class, you will learning to create var line by stack and area charts. And you will also learn how to make them look attractive. So if you are curious to learn about creating these infographics charts in Illustrator, you start learning like now. See you in the class.
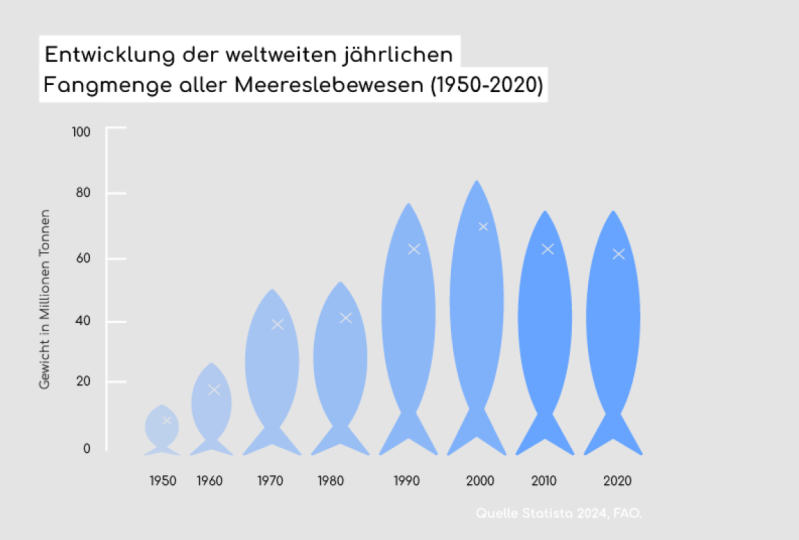
2. Bar chart: Hi there. Welcome to this lesson where you are going to learn about infographics and data visualization with Adobe Illustrator. Here in this lesson, you are going to learn about creating bar charts. And later on you will learn more charge. So let's do it. There are various ways to create some chart. The best way is to go to Charts. Create a bar chart. Here. When you apply, there are various options. The first option is bar chart. The bar chart allows you to represent data using rectangular bars on the two coordinates x and y. Say when you provide any values here, I provided values in one row and three columns. So they will represent like this. So I've provided three random values, 10, 20, and 30. And similarly, if you provide more values, they will reflect back. So here you can perform addition to your value, type any value in numerical value, it will be represented here. So once you press the tick icon, it will generate. You can reverse this graph as well. There's an option to flip the graph. And that way you can get the column. It will be reflected or you can always provide multiple values. Say when you provide two rows of information, they will be two different bar charts placed next to each other. So this way also you can compare a lot of things, say development, GDP in multiple countries and he kind of data that can visualize. You can also import a CSV or Excel file using the same port option. You can add text files and value and arrange them in column, sorry, row and columns. You can also flip the value of column there, these using this option lip, you can change from row 2 column and they will represent that way. So you can either check, you can also provide the shale is space number of rows, number of decimals, decimal point, say if you want some accurate decimal values, you can use it. By Chart. Simple. You do. You can always change the color of each individual. Watch at this, go to the Selection tool. So when you get the selection tool, everything would be changed, selected. So you have to go with Direct Selection Tool or white colored selection tool. And just double-click a single double-click or single click particular component From the chart, and it will be selected the latest, select individual bars and provide any color. You can convert them. So illustrator is for graphic design and elucidation. And if you are trying to create some charts illustration, they must be appealing as well. They must not look like they have been created in Microsoft Word or any other text editor software, PowerPoint or something like that. You must add your creativity to her chart. There could be scenarios that could be used. You can add these charts to your posters, magazines, and different kinds of designs he had. We also used as a component for creating animation. Dad is another part. You're going to, anyway it when you burn. So you want to animate something in After Effects. You may require to create vector with different layers and say these are the bar charts and you can't separate them in different layers and important area in After Effects. And you can apply any mission. So any kind of any machine is always dependent on the vector files. And vectors are created using Illustrator kind of softwares. So you can create a lot of vector. They could be used in different cases. So if you try to create this same graph, we're using rectangles or individually text entry. First of all, it will take a lot of time. This is not a way to create chart in Illustrator. If you want to create any kind of infographics that is not available by default. Yeah, you could definitely try to create accumulate with a different shapes our pen to what? If something is available, you can leverage it. You can always change the font of the text here, say the numbers. You can provide your own font. You can change the font to anything you feel like and provide a numbers. Let's go with any kind of chart. It will also convey the story as well, even change the size, color, and make it bold, italic anything. And once you use or the selection tool, it will select everything as a group. Okay, everything is provided in the same layer. You can always separate them and manage them using differently, yes. And also change the color of your graph. And individual component. You can experiment with a lot of colors to check with her. Whatever you feel like. If your data is related to something, you must use the color related to that kind of scheme. Say if you want to show some data like climate change or deforestation or bio-diversity or some kind of issue. You could use a color of green, blue, and something like that. If you want to show the forest fires, you're going to use the red and orange color. If you want to use any economical data, you could choose any color. You want. Black money, dark money in it in like there. Yeah, The most interesting thing is that you can also create candlestick love using this white chart itself. Although candlestick graph is not available as an independent chart in Illustrator, but you can create. So what is candlestick and realistic, either simple. Charter. You may also already be familiar with this. Candlestick is used for a stock market and such scenarios. So characteristic is similar to budget, but it is different, completely different. You're going in slide bar chart. And you can also use are the rulers and grid provided in the properties. So first, try to complete your graph, add some information. Say, on the horizontal axis we've got year wise train, and on the vertical axis we got demand. So this is Andy's other values. So demand increases as the year. And here we are comparing two different components. So one is shaded in blue color and address and a shade of green or yellow. You could always add some extra text over each individual bars or you could place them right below as some detailed information on the horizontal axis. Say you can say the year wise trend to the number of years. And these are the transform 1970s, 80s, 90s, early 2000s, 2010, and 2020. So these are the decade wise trend. You could add any kind of information that you have, an arrangement or bar chart accordingly. And once you are done, you can rearrange and reposition your thinks. The desert place. So this is a simple bar chart. You can save it, export it, group it, and do anything you want. You could also add some more details that are not available by default. Say, like the color notation, meaning of polar notation, say pick any color, plays to a small rectangular box. And I pick the green layer using the eyedropper tool and just write anything, say cotton. The demand of cotton versus sales. It's the same text. Rename it. So here we got a year wise trend for the changing demand of quoting versus cell. So the demand of cotton has always been higher than sit in this graph, not in the reality. And they came closer in 2010s. And again, the jump in demand of protons. So after that. So here we've got a crane like from 2000 to 2010, the demand of courting decline and they got Jerome afterwards. Earlier it was increasing. So you can select individual bars and one of the best ways to keep all the bars in a similar color. So here we want to do comparative analysis. You can select each component and use eyedropper to match it accordingly. So this is a simple graph using three colors. Black for text and lines. Blue, dark blue and dark green. For notation. You can change the size of the stroke or anything you want. It is a simple graph. You can rescale it, reposition anything. And if you want to edit your information on the graph, you have to just double-click on the bar chart or any other graph. And it will provide you the values in the table format you can edit. Or you can go to the appear as pain from Windows appearance. And there you can edit. So here you can get a ruler grid to transparency mode and you say things are there. One of the properties. So once you want to arrange your data on a particular metric, sometimes you may require graph or IV may add some field. The graph, you have to remember that graph is generally not printed or saved when you convert it into other formats like JPEG or PNG. It is just for reference in lifted. When you save your project in Illustrator file, the graph will retain. It will be available, but it won't be printed as it tried to create a row, visualize your own information, put any random values if you want. I try creating infographics using Illustrator. Keep learning and keep moving. It.
3. Line chart: Hi, welcome back friend. Here in this lesson, you're going to learn about creating a line chart in Illustrator. So let's start. So just below the bar chart, you've got to various options. You have to hold left-click for long. And you can select line chart. You can drag and drop it on the screen and to define the area. And next you have to provide the values for your points. If I provide five or six different values, 1, 2, 3, 4, 5, any value. And once you are done, just press Enter or click the button. Here. These points are created, but they on the same horizontal point. And you can transpose this value to create a line chart. So just click on the transpose row and column to flip the values from row 2 column. And here is a simple line chart. To make it more attractive, you can do various things. Say here are these points can be enlarged. Just select any individual point, go to stroke and make it a little bit bigger. Say 20 points, and change the color of your stroke from black to any color you want. It may get red. As you are a creative person, you could leverage your creativity to add some things to infographic. So graph data or infograph you that these charts have never been that much interesting with that has converted these days. Because earlier it was created by financial Persian person's our mathematical data to represent something. But these days, the graphs and infographics are used to convey something, some message. These are widely used by marketing people and creative people. Designers like you can present your data into beautiful story, how you match. So here's just a select any point and make it a little bit big and change the color. Or what you then do is do automation. Select multiple points at same time, use the eyedropper tool. And then it's reflected. Here. When anything goes up or any value increases, there is a growth that the color changes to green. And once it is decreasing, we can change the color to red. There it is. This simple notation. Just use the eyedropper to select the same format. I've bought, change the color this time. So here we have created a simple line chart that represents some kind of trend increasing or decreasing. You can go to Properties and add rulers and grade. The background. Grid allows you to add some mathematical information, be accurate. Refurbishing your graph values on the graph, on the grade. And you can add some more texts to add the details. Say it represents a stock price over the time. This is not the actual stock price, but you can use write anything to represent your data. Remember, infographics are used to convey some message to your audience. They does not is not simply represent data, but data into a visual format. So earlier, if you have to look at these values on the Excel sheet or anything like that, there will be lot of boring stuff. It would be very boring. Difficult to visualize the train. But with graphs, you allow them to visualize. You can also create multiple graphs and I test him one over another. Recreated. Say if you have to represent two different line charts at was, don't place them side-by-side. You could place one chart over another or do something like that. Try to think out of the box here. These things are followed everywhere. This is a stock price and that is the smaller one is forecasts for the future. So the real value, current value, and the forecast for the future. So similar kind of history can be created. You can also create a combination of bar line pie chart. You can use multiple chars and create a better infographics. You try to create your own chart. Keep learning, and keep moving ahead.
4. Pie chart: Hey, welcome back friend. Here in this lesson, you're going to learn about creating pie charts with Illustrator, select star. We have to go to the bar chart option and expand it to get the pie chart. You can drag it on the screen and then you can provide the values for your pie chart or pie graph. The pie chart will represent your information or data as a segment of a circle. So you can provide information is form of rows on. Once you transpose, they will be converted into a smaller circuits are provided by these values. So here it is. So you can also provide multiple rows and multiple columns to represent a pie chart in different ways. So here you can create two columns. So these are the two columns. And once you hit the done button or a tick mark, it will be created on the screen. So here we are interested to create two different pie charts. One is smaller and bigger. So for that case, we need two rows with different values. So for COG, four columns and two rows, you can zoom in a little bit and use the direct selection tool to separate each individual components and add some creativity. So regular, generally these are enclosed tightly together. What you can drag each segment out. This is the power of Illustrator, but it is very commonly used. You could add some more creativity to this. But if you want to highlight a particular segment, so the best thing is to separate it, keep it a little bit outward. So here we want to highlight the growth of one corporation from early 1990s to the college. So we are going to add some more information. So using the same Direct Selection tool, change the color of each segment. So provide the four different colors on either of the chart, pie chart, and just copy the same color over the next year. So this blue color represent any company or anything, any entity. Green color may represent different entity and so on. So you can also note that the entire pie chart has also increased in size, noise ratio. So the earliest component may have different ratios are percentages. The share of each entity may have changed, but the overall value of each entity have already increased. So you can see the graph has converted, getting bigger. So you can convey a lot of beautiful stories. Using infographics in Illustrator. So here we've got four beautiful colors. You could have a choice of your own colors. Be creative, be innovative. And now just add some text information just below these pie charts. Reposition them properly on the screen. Say write the ears, say 1990s. And on the right-hand side, you can write 2000, 20 twenties. Just write it. This decade and the 3D case earlier. You can also increase the size of the text of the later year. Because not just a pie chart has increased in size, but also the value and a weightage of the ERS VM. So these two informations provide sink and synchronize. It will also convey a strong, weak or strong message to an audience without actually representing any values. So here we didn't represent any numbers. We just represent the visual part. We have not provided any percentage value or any numerical value. Here I've created for a small box, represent each segment of the pie chart. And using the eyedropper tool, you can get colors and you can add a detail of each individual component. So there are different ways. You can also write the text right above the segment within the segment, or it is better to provide them outside the segment using this is small boxes. This will clearly convey the message that you want to show. So this is a James Corp or anything like that. These are the imaginary names. We have a comparative analysis. Use the selection tool and duplicate the same text layer and rename it to provide any other names. The spacing must be done clearly. If you are in a doubt, you can use the rulers and degrade to properly place everything the way you want. Just provide a name. I'm providing this random names. Just to show you how you can add some information. We could also add a combination of line chart, pie chart you get also the in-place of a line chart points. You get placed bar charts as well. It depends on the information you want to convey. So here we've got four different entities. And over the years we've got this trend. The blue color, GM's car has emerged as a big market cap, and others have lost their share, but overall value of each entity has increased. So this is the case here. Similarly, you can represent more data. Keep learning and keep moving ahead.
5. Area graph: Hi, welcome back. In this lesson, you're going to learn about creating area chart infographics with Illustrator. So let's do it. You can find area chart or area graph right below the bar chart options, you've got different charge to V. Area chart is similar to a line chart, where you provide the values for the points and it will create a line. So you have to provide values in a single column, not on rows, but if you provide in rows, it will be little bit flip. Okay? So let's do it. Here. We have created two different areas. It will cover the area or the segment below the actual line graph. And till the horizontal axis. You can represent various things using this heavier chart. Because when you want to apply some weightage or show the quantity or the magnitude of something, not just a point. Area chart is used in that scenario. So we will be creating this area chart for the average rise of global temperature and climate change. This is not a real data, it is just two. Represent enter teach you how you can create this area and graphics Infographics. It has a both axes, x and y coordinates. And you can always provide multiple values for the area. We can provide different roles and different columns. So when you provide them in rows, it will create multiple areas, say 1, 2, 3, 4, 5, 6, six columns. Each column are treated as separate entity. So if you've got six columns and two rows, each line will have two different points. But when you write in column, well you get first. You can always change the color of your segment, underlying segment using the that selection tool, the white colored selection tool. You can change the opacity of each layer because one layer is overlapping the other. So if you make the front side little bit transparent or translucent, it will show the color of the background image. So let us add some more detail. You can always turn this segment a little bit outside or you can shift it to have some effect on you, how you want to represent your data. Be open to creativity. Try making it a little bit more attractive. You're going to add various elements and a combination of colors. Say if you want to show the average rise in global temperature, it is better to use warm colors to represent their area here. Without a warm colors are orange, yellow, and red. These are the orange LDs at the warm colors. And cool colors are blue, green. These are the cool colors. So if you want to show some kind of heat or temperature or some NLG kinda of 10 petroleum petrochemicals. You can use this thing. Say if you want to create some chart comparing petrochemicals and fossil fuels and electrical energy. Electrical energy or greenhouse. Men. In 19 tells saving energy forms like wind and solar. You can represent using the green or the blue color. The color conveys a lot of meaning, not just shape and size of your design. The color is useful. You can also add the grid and reposition your text and everything accordingly under artwork. Now you can shift some things little bit leftward because we want to add one more graph. So we are not going to create anything new. We're just copying the same graph and pasting it over for the actions. Let's try to change the color from hot to cold color. Little bit. I change this orange shade too blue color. Use the direct selection tool, hit the selection and then choose a color of blue, shade, light and dark blue. So the first temperature of first graph shows the heatmap of annual global temperature rise in annual global temperature. And second graph will show the requirement of actions, our measures to be taken by the governments and the people need for action. So if there is a rise of one degree, so people must be taking some access to reduce the global climate by one degree by going carbon neutral. Green. In the similar way, it is increasing at a rapid rate. We have to increase our actions towards climate, towards a conservation of the climate and reducing greenhouse effect. By that. Much. So the power of creative artists and designers like you is immense. So if it has to be printed on some magazine or web article, if it has been a little bit to data only with values, people would get a little bit of motion. But if you have, add the color and creativity to very much useful. And so keep learning and be creative.
6. Stacked charts: Hi, welcome back. In this lesson, you're going to learn about creating is stacked charts in Illustrator. So let's start. There are two types of charts, one horizontal and vertical. So stacked chart is similar to bar chart, but here the bars are, individual values are placed not just next to each other, what on the top of each other. So this way, once you create a single column, it will create multiple charts on when you create multiple columns, the second and the third and the fourth columns will replace right over the previous ones. So these are, these are used to show some more sophisticated amount of data. At simple bar chart. Can't easily show off or fancy info-graphics. You can create these kind of charts. So you can provide values using this value, a provider option. Or you can import Excel or CSV file. Once you're done, press. And now use the direct selection tool or the white color selection tool to change the color of each individual bars. So just take any color, say green folder first value, blue for the second value. It must be little bit different. The color tone should be clearly visible. How you can get some darker shade as well. And what you can do here is add some creativity. Put this segment little bit outside. You can turn it. Move it with your selection tool. No need to keep them in their default position. You can turn them anywhere Is this way we have colored our graph. You can use the direct selection tool to keep them a little bit, say, provide some gap. You can, this way you can highlight that these are the chunks. We will be using this graph to show the broken twice. So the broken toys are gone off in different chunks. So why not? We should also turn the graph into different pieces. Well, it will add some more meaning to this ear information. So infographics when it is done by simple mathematician or someone who is not from a visual background or creative person. They will represent a data. But as you are a creative person, you are not responsible just to display the data. You are also responsible to convey the meaning desired with your data. You have to add your storytelling ability here. So these represent the broken twice. So the text broken two eyes will impart some meaning. But the graph itself is broken into pieces. So in that case, you can convey the meaning so you are getting it. So you could be creating any kind of infographics, charts or you can create your own vectors as well. But try to get the philosophy or get the real meaning of what you are representing your, you have to understand that data and make it very simple and very visual for your audience. In the similar way, we can create a vertical stack chart. And you can create the same way, the columns and rows. You provide user selection, direct selection tool to change the color. As we have done previously. And this time we will be showing it as a repair costs. So don't use the same color for everything. You have to change the color a little bit to make it more attractive. So the broken twice are represented with green and blue colors. So the repair cost could be represented with warm colors like orange and red. Here it is. So you can get it. Use the eyedropper tool and select multiple segments at once to change their color. At the same time. No need for repetitive operations. Try to reduce the number of clicks that you do. This will come with practice. Don't try to do it as a starting point. The starting, you must be ready to try new things. So the repair cost is also represented using the bro broken technique. But this time your objects are little bit higher. They are not offset from the path, but the broken twice are separated by both direction x and y. They are inclined a little bit left and right. You can say they are broken and repair costs would be represented with this name. You can add a grid to get an emphasis and you'd be calculated value. You can also use a combination of different charts to convey some meaning. Try creating these infographic in a creative way. Keep learning and keep moving here.
 Harshit Srivastava, Developer on IBM Cloud, Bluemix