GDP Per Capita ($) by Region and Countries
Year: I have chosen to go for the most recent year, where the data is available which is 2023. The data set has includes data from the year 1960 to 2023. GDP per Capita by region from 1960 to 1971 are different then from 1971 to 2023, because the US dollar was backed up on Gold and the Fractional Reserve Banking System was not introduced in that era. Back then Central banks could not print money out of thin air, which they can today.
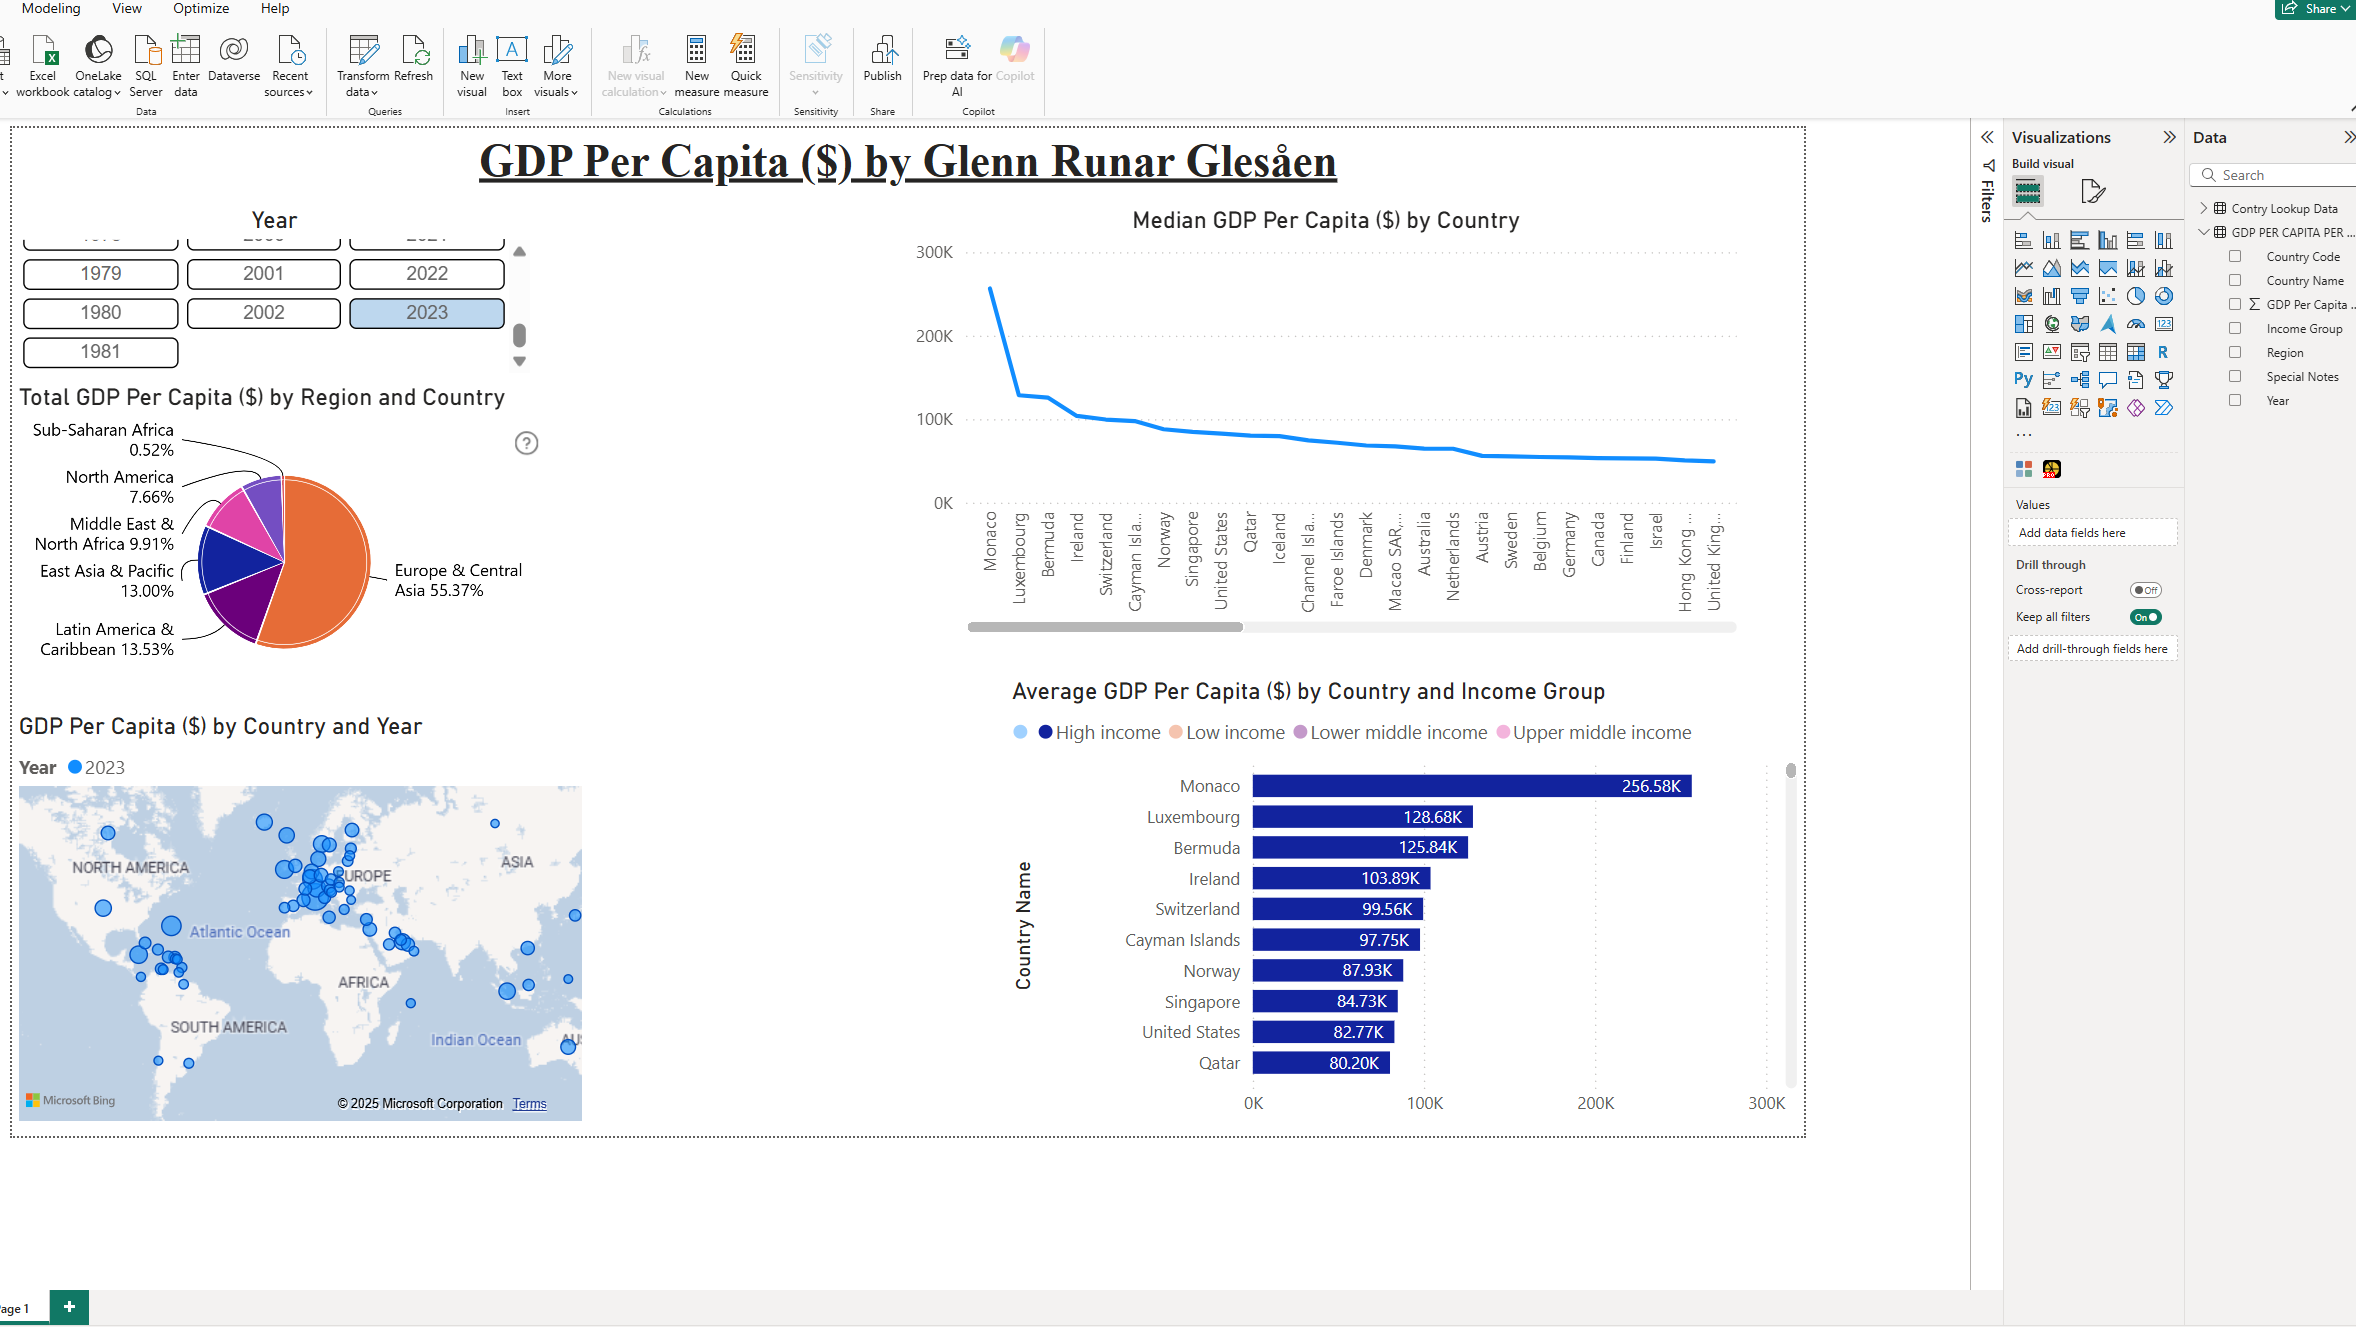
Total GDP Per Capita ($) by Region: From the data set it is clearly that Europe and Central Asia stand for 55,37% of the worlds GDP Per Capita, while Latin America & Caribbean has 13,53%. This is because the median and average GDP per capita for Bermuda is 125,84k USD.
Median GDP Per Capita ($) by country: As seen on the graph Monaco is the country on earth with the highest median GDP with over 250k USD, followed up by Luxembourg, Bermuda, Ireland, Switzerland, Cayman islands and Norway. To be very clear the GDP Per Capita for Norway is higher than the actual value because the The Norwegian Pension Fund is Included. By excluding the Norwegian Pension Fund, the GDP per Capita for Norway would go from 87k USD down to 60k - 65K USD.
Average GDP Per Capita ($) by Country and Income Group: The difference between Median and average is that Median stands for the observation in the middle, while the average is skewed, because few people with a really high salary is pulling up the average. For this reason it is always better to look at Median observations when it comes to GDP Per Capita.