Transcripts
1. Learn Microsoft Visio Now: Hi, welcome to master Microsoft
Visio diagram basics. So you're starting out
within Microsoft Visual than this is for you. Here's what you will
learn from this course. Create flowcharts from scratch, use templates and characters, transform processes into
diagrams fast and so much more. So what are waiting for? Master Microsoft Visual
now and see you inside.
2. What is Microsoft Visio: Hi, This is Bryan
Hall and we will be talking all about
Microsoft Visual. So what is Microsoft Visual? It is a diagramming and vector graphics software
from Microsoft. So you can design network
diagrams, flowcharts, floor plans, use cases, and even music shifts, so pretty much you name it. So there are whole lot
of diagrams that we can work with and I'll walk
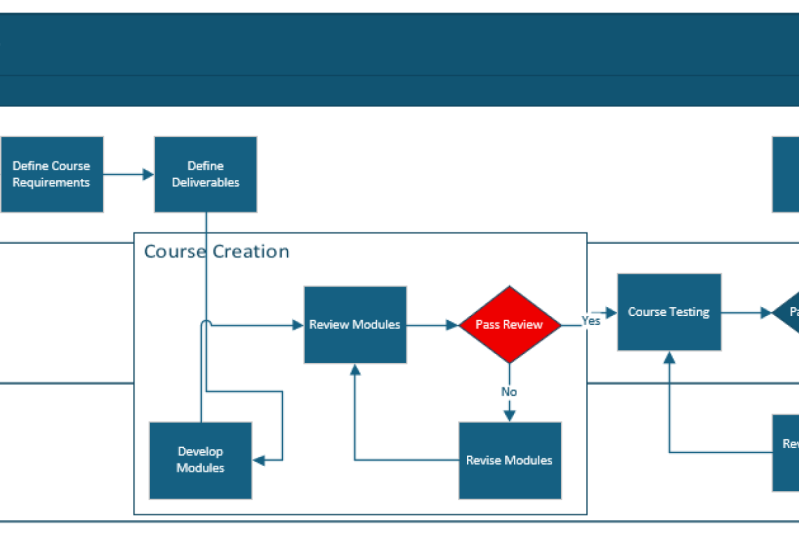
you through step-by-step. So over here, this
is what we're after. This is what we will be
creating from scratch. And you will be doing that as
well throughout the course. So what we have
here is pretty much a flowchart of creating
a course for beginners. So I hope you're excited because we will be
working step-by-step from the very first
blank visual diagram until we have this
completed work.
3. Where to get Microsoft Visio: So where can you get
Microsoft Visio? So it's fairly straightforward
to get visual. You just do a quick search
on visual and it will lead you straight to this
Microsoft page on visuals. So what I'll do right now is
let's click on See Plans and Pricing so that we can have a better idea on what
the options are. So what do we have
here is pretty much subscription plants on the left. And then the next one is
the onetime purchase. So for the subscription
plans pretty much it's a monthly costs that you can use visual wetter on the web or on both
the web and desktop. So it really depends
on your needs, but I'll be walking through in this course the
difference between web and desktop so
that you can have a better idea on which
works best for you. Then if we have a look
at the onetime purchase, pretty much it's a
more expensive option because what we have here is pretty much visual standard 2021 and Visio
Professional 2021. So pretty much it's
a onetime purchase, but it pretty much
locks you in to this specific visual version depending on which
one that you choose. And then pretty much on. My personal recommendation
is the easy way is to just check out the visual plants
on the subscriptions, right? Let's say e.g. if you want to
try out the visual desktop, then that would be this plan
over here, the second plan, because if we just scroll
down over here, right, it includes the visual
desktop as well. So e.g. if you want the desktop, I would recommend to just try this out the visual plan to, and then select the try free for one month option because it's a really easy way to see
if it works for you. Then if it's good, then
you can simply subscribe for the duration of your
project to save on costs. So e.g. if, Let's say
your project runs for three months and then that's the only time that
you need visual, then that would cost
you around $45. Instead of going forward
the onetime purchase, then it's a lot cheaper
because if you have any idea on the duration
that you need the software, then just go for a subscription. But if e.g. let's say the web version is
sufficient for your needs, then it's a lot cheaper
at $5 per month. Now another good thing with the subscription plan
is that you are assured of having the latest
visual version all the time with
the latest features. So that's another benefit of going with the
subscription plan.
4. Starting Visio and Templates: Now I have installed the visual desktop software
and I have it open right now. So let's explore what are
the initial options that we have when it comes to creating a visual
diagram from scratch. So over here I've selected
new and as you can see, we can pretty much start with a blank drawing if we choose to. Or we can use templates
to gain a head start. So you might be wondering
what are templates for? Templates pretty much it
has a specific set of stencils for the specific diagram type
that you have selected. The great advantage with this
is everything is set up. It pretty much saves
you time from finding the specific set of stencils or shapes for that
specific template type. And you just can work
straight away when it comes to starting
with a blank diagram. And we'll see this in action. Don't worry about that once we work with templates because
you can see that, okay, it's very easy to work with that specific set of shapes
pre-selected for you. Now, the question right now is, what are the different
tabs that you can use when you're inside
this section over here. So let's just scroll down to office over here
to office tap, it pretty much shows you
the most popular templates. So you can see there's
the organization chart, There's the timeline, There's
the cross-functional chart, and there's quite a number
that you can use when it comes to creating
your own visual diagram. So pretty much that's
for the office tab. But if you need a more
comprehensive list of templates that will just select the Templates
tab over here. And you can see that there's
the categories being shown, business, education,
engineering, a cheddar, ready for you. So let's say, let's just select business and
have a quick look. We have the other
diagram, we have charts. We have different types of
diagrams or chart as well. Alright, even Six
Sigma diagram. Okay. Go back and let's
have a quick look. Let's say for
Madison floor plans. So e.g. for maps
and floor planets, we have even a crime scene
investigation template ready for you. Okay. We have the home plan, we have the floor plan, even for your office,
for plumbing, etc. So there's quite a
number that you can use right off the bat when
it comes to templates. Now, you might be
wondering what is the sample diagrams tab for. So if you need inspiration, so let's say you're stuck. You pretty much know
what template to use. Let's say you want to create
a home plan or office plan, but you're stuck with
it comes to thinking, okay, how can I utilize this? Or what kind of design like
strategy should I use? So the sample diagrams
is a good place to start because it has this
specific template that you might be
wondering on how to use. It has already
applied it in action. It will be useful in
giving you inspiration on how you can go about when it
comes to creating your own. So let's just have a
quick look. So e.g. let's say for templates, Let's say we go to
maps and floor plans. And then inside here, let's say we want to work
with an office layout. So let's just select this. And I'll select Create so that we can now see
the template in action. We have on the left side, we have all of the shapes
already set up on your left. So e.g. let's say officer
accessories, we have plans. You can just simply
drag and drop quickly onto your diagram.
So that's really cool. We have a table lamp, we have the waste can over here. We have coffee machine, etc. There's a number like a really extensive number of stencils are shapes that you can use any place
on their diagrams. So you can see I'm just
randomly dragging and dropping different
shapes over here. But I have no idea on how I can start the office
layout from scratch. But the cool thing with
templates is you have your selections over here,
office equipment, e.g. you have the telephone,
you have the printer, you have the fax machines. So pretty much they have a
lot of options ready for you for your specific template because this is Office
related, right? So if you notice, all of your shapes are also
office related. So that's the cool
thing with templates. Now, let's jump over
to the sample diagram of the office layout as well so that you can have
a better idea on, okay, what's the difference
between the two of them? Now, to be able to do that, I'll jump over to the
sample diagrams tab and so that we can
compare the template. Let's go to maps
and Philippines. So pretty much same
thing over here. And then inside the sample
diagram you can see there's quite a number of completed templates that they
have already done for you. So e.g. for the
office layout plan, we have parking layout. There's quite a
number, but let's just quickly explore
because it's really cool that you can see on what
has been already created. There's even servers
over here, right? The architecture network
diagrams that he can explore on how it is done. So let's just go
back right before the sample diagrams and
maps and floor plans. And then let's say let's try out the office layout over here. Now if I go forward
the template. So let's just minimize this one that we have
created a while ago, but this one is already
finished for you. So this is the cubicle layout. And it can give you an
inspiration that okay, this is where I
can place a plan. This is where I can
drag the chair on. So it's a starting point
that you can play with. A better idea is also to start with this
simple diagram, e.g. and then you can just make
modifications and you can just tweak it based on your needs or your personnel, nice as well. So let's say if you just compare this to what I've been
working with a while ago. This is the template that
I've started, right? There's quite like I'm pretty lost on how
to work with this. So pretty much when we
use a sample diagram, it gives you a good
starting point and then you can just work
from there, okay? Or once you have an idea, then you can just go back
to your template and then continue the
work that you do.
5. Starting a Cross Functional Flowchart: Now for the fun part, let us try working on a
cross functional flowchart. So what I have here is the
screenshot of our goals. So pretty much our goal is
to create a plan on how to work on a visual beginner course from scratch such as this. So this is going to
be the flowchart that we will be creating. So I'm just minimize that. And I'm back here
inside the Visual app. And what we will be
doing is we will be working with the cross
functional flowchart template. So to be able to do that, just select the
Templates tab over here, okay, and then for
flowchart, I'll select that. And then for the
cross-functional flowchart, then we can select this. If you've noticed, there's quite a number of
options as well. If we want to have a specific design or team
that we want to use, right, but let's just start with a blank template, blank diagram. So I'll select Create. And if you notice that since we have selected
the flowchart template, so let me just open this
and we immediately have access to the different
flowchart shapes over here. So you can see we have process, decision, sub-process,
et cetera, over here. So if we started with
a blank diagram, so you will need to add more
shapes one-by-one over here. So pretty much the
basic flowchart shapes and the cross-functional
flowchart shaped over here. They won't be available if
we select a blank diagram as compared to the template
that we are using right now. So e.g. let's say for
more shapes, right? You can just open over here. You can add
brainstorming shapes, e.g. so I'll just select this. And if you notice on the left, then you have the
brainstorming shapes added right now to the left, so that you can quickly
select them for your diagram. So that's the other setup
step that you need to do if you are working with
a blank diagram as opposed to a template. So you would need to search for the shapes are different
categories one by one, so that you can add
them over here. But let's just undo
this one, right? And just close this. Okay? And pretty much,
Let's just focus on working with the
flowchart shapes. So I hope that it provides
you a better idea, right, when it comes to using a blank diagram
versus the templates. But the good thing is
when the templates, not just limited to these
options over here, okay? You can simply add more
shapes, S you need, depending on your diagram or pretty much on your scenario, then you can just quickly
add them as well. But the templates pretty
much would give you a quick starting
point to work with. So as you can see, there are a lot of
time-saving advantages when working with templates
right off the bat. So you can see us well, we also have the cross
functional flowchart tap on the top for this template. And there are different options for us as well that you can use as we create our
diagram step-by-step.
6. Title and Swimlanes: So now we have our cross-functional
flowchart templates. So let's go on the basic steps when it
comes to setting this up. So first things first
is we want to change the title of our visual diagram. So what I'll do first is let me just zoom in a bit
so we can quickly zoom in so that you can see better on the diagram
that we are working with. Let's say, I'll just say
this one more level. I'll double-click on
the title and the title would be visual beginner
course over here. Now, for this type of chart, we want to add the
different rules on who will be working in making
this course a reality. We have different simulates over here. You
could see it right? Which person will be
doing what? So e.g. let's say for this
first swim lane, we will be updating this
with project manager. The project manager
will be overseeing the course creation or
this project, right? And then we have
reviewer as well. And for another role
we want riders as well to be able to write the or create the
course content. To be able to do
that, we need to add another swim lane over here. You can simply select the cross-functional flow
chart tab under Insert. And if I click swim lane, that you can add another
same name as well. Then another way as well
is to jump over to shapes. On the left side, you can just select
the different shapes. And then I'll just
drag the swim lane as well over here
to add another one. Okay, so the cool
thing with visual is pretty much the same
thing that we're trying to do or trying to accomplish. There are different
ways that you can do that inside the application. Now simply click Undo because I don't need
the fourth swimming. And they'll just
double-click on this. And let's just type in writers
for our final swimlane. So now that we have
the basic setup and the next part is to work on the process and start filling up the middle part over here
to black space over here.
7. Add Shapes Text and Connectors: Okay, So now for the fun part, Let's start creating
our process. So to be able to denote
the start of our process, we will be using the
star shape first, and I'll just drag
this over here. And the cool thing
is, you could see, right there are guidelines
and they are there to help me to fix the
layout of our shapes. So let me just drop
this over here, okay? And you can simply
double-click on the shape, which is what I'm
doing right now. And now we'll just type
in start over here, okay, so very easy. You just drag your
shape and then you can start adding information or textual information
to their shape by double clicking on it. So that's continued to
fill up our process and to be able to add
more steps to it. Either you can drag
and drop, right? Let's say we have the
next step to this. We can just simply drag and
drop a specific shape to it. Or you can also hover over
the current step and you can simply select
a specific like. So let me just delete this over here so they
can have a look. Okay, so let me just
hover over this, right? And I can select the arrow, and then I can simply
select the shape or the next shape that I
want to be the next step. Okay, so under stark, right, I've selected the process
shape over here, okay, and then let's say I'll
just hover over this shape again and I can simply select, let's say another process. The cool thing with this
approach is that there will be a connector added right away depending on the direction
that you have selected. So e.g. if I select the
down arrow over here, so I'm just hovering, I'm
not clicking on anything. And then once I select this one, then another one will
be connected over here. So it really depends on the
direction that you have selected and the connector will be added
automatically as well, which is really cool. Because if e.g. let me just delete this, okay? If e.g. I've just dragged the specific process
over here, right? There's no connector, which
means you still need to add the connector manually and to be able to do that so
that you know as well. I'll go over to Insert. And you can see right under diagram parts we
have the connector. I've selected this right now. And I can connect from this
to this shape over here. And now you have your
connector, okay? So if in case you don't have a connector from one
shape to another, then you can simply go to
Insert and select the connector over here so that he can
just connect them together. Okay, so that's the
really cool part. So what I'll do is let's just
undo what we did right now. I'll just delete it debt. And let's work on the next step. So after you start
the project manager, the project manager needs to define the cost requirements. So what I'll do is I'll just hover because it's easier to do so I'll select the next
step over here, right? And let's just type in
defined course requirements. So looking good. And then let's say
for the next step, the requirements are ready. And now we want to select and add the step for
defining deliverables. Okay? And after that, Let's say we have our writers
coming in because once we have the deliverables
ready are defined, we need our writers to be
able to create the modules. So what I'll do right
now is let me just drag this all the way down, okay? Because it has to be our writers who will
be doing this step. And I'll just type
in develop modules. Okay, looking good. And then let's say
for the next step. After they have developed
the modules for the course, then the reviewer will
now jump in and start reviewing the different modules. I'll just type in review models. So as you can see, what
I'm doing right now is simply hovering
over the shape and then just selecting what the next step will be
because it's a lot easier rather than dragging and dropping the different
shapes one by one. Okay, So review modules. It's not gonna be
done by the writers, but it will be done by
dy reviewers over here. Okay, so we have
a review modules. And then after that
review modules, now we can also add a decision. So you can see over here
on the left, right, the diamond shape over
here is a decision. So what I'll do is let
me just go over and select the diamond shape
over here, assayed decision. So for the diamond
shape over here, I'll just double-click on
this and I'll just type in pass for a few. So it's more of a question or a decision to be done
by the reviewer. And let me just go
down over here. Let's say they didn't
pass the review. So which means the riders
now need to revise the modules because
changes need to be made for the specific
course deliverables. And then let's say after they
have revised the modules, we want them to be reviewed
again by the reviewer. So you can see that
there's a flow right now that's happening. But to be able to
do that, right, because we just want to connect, devise modules to
review modules again. Then we simply go to
Insert connector. I'll select this. And then let me just connect
from this point over here, right, to this point. So let's just have
a quick review. Developed the modules, then. Review the modules. Did it pass review? No. Then the modules need to
be revised by writers. Then after the
revisions are done, then it will be
reviewed again and the same decision
point will happen. Now, the question
right now is okay, once it has passed review, okay, where do we go from here? Now? You can simply add another
step to the right over here. Once it has passed review, then we will test the course. I'm adding this right now, here. But there's another
step that needs to be clear for us because if you notice the different processes or tasks that I've
added over here, it's pretty clear cut that from one task to another,
you have the arrow. There's only one arrow that's neck jumping from one
point to the next. Okay. But over here in pastoral view, there's pretty much
two directions or two arrows pointing out. So to be clear, you can also add text to
the connectors as well. So we want to add yes or no
so that if it passes review, yes, then go to the next step. But if it did not pass review, then you need to revise the modules to be
able to do that, what I'll do is I'll just
double-click on the connectors. And you can add the text of no. And I'll double-click over here and I can add the text off. Yes. That's a really
nice thing as well because it's not
only for shapes, but they can also add
text to your connectors. Okay, so let's go over
to the next step, right? Looking good at the moment
we have course testing. And then let's say for
the next step as well, It's going to be a decision
point because we want them to check if it has passed
testing or not. Now, we have passed
testing over here. Then let's say if it did
not pass testing than same, similar pattern, we need to review the course
again by the writers. Okay, and then once that's done, let's select the
Insert connector. And I'll just add a
connector over here, right from this point
to testing again. And then after that, right, it has passed. Then I'll select the
upper portion and let's give it back to the project
manager for signing off. And then once we have signed
off by the project manager, then we can simply
select this shape, which is the start, end, to denote that we have
completed our course. So S, you notice when I was working with this diagram
at the moment, right? Pretty much. There's just a couple
of shapes that I need to familiarize myself with. But the good thing is, once I know the basic shapes
that I need to work with, It's a lot easier now to
just go through the flow, go through step-by-step, and be able to complete
the entire diagram. But there's one step that
I'm missing at the moment, which is over here
because for path testing, There's no distinction
between the two arrows. So let me just double-click on the connector and I'll
add no over here. And then over here, if
it has passed testing, that it will go to the sign-off
of the project manager. So let me just zoom out
so that you can have D and tired diagram in
full view over here. Let me just minimize
this on the left. And pretty much this
is the entire flow that we have designed from scratch when it comes to creating the visual
beginner course. So I hope you enjoyed
this and we will add further customizations in
the succeeding tutorial.
8. Insert Containers: Instead our diagram, we can also use containers for emphasis. So when we say container
is very easy to add one over here, right? Insight inserts diagram parts. There's a container as well. So let's say, let's create a container over some
steps over here. Pretty much the
most important part of course creation. So e.g. I'll just select
container over here. There's quite a number of designs that you can
use or styles, right? But let's just select
the basic one. So what I did right
now is I've clicked on that and you can simply drag
and drop over here right? Over the specific steps that
you want to be emphasized. So e.g. let's say this
four steps over here represent the most
important part of our course creation process. Okay, so I can just
double-click on the container title
and let's just type in course creation so that we can just have
this emphasis over here. Let me just resize this a bit. K over here. We have this pretty
much four steps. Develop modules, review modules, patch of view, and then the
revision of the modules. So pretty much we have
this four steps over here, but you can just set multiple
containers as needed. You can also change the size of your containers depending on the number of steps that
you need to fit in.
9. Shape Colors and Styles: Another customization in visual. You can also update shaped
colors and styles. So e.g. let's say for the
past review step, this is what we consider
as the most crucial step in the entire process or
in the entire flowchart, we can change this color
to a different one. So you can simply
right-click over here, okay? And then you can simply
select Format, Shape, or it can go for styles
as well to change the different colors
of your specific step. Okay, So what I'll do right now is let's just change the field, let's say to call them red. And you have your moles supported step
highlighted over here. But you can also
select this and just go to Home shaped stones. And there's quite a number
of options as well, pretty much similar to what
we had from a while ago. So we can even have a 3D effect
for the bevel over here, can even change that as well. So pretty much any
element over here, you can customize that to
your own choosing as well. So e.g. you can also
select everything. So let me just drag the
entire diagram over here. And there's also what
we call as quick style. So over here at home, shapes styles and then
under Quick Style, so you can simply select like
ready-made styles for you. So that's the really cool thing. You can just have
fun and just hover around just to have a quick
preview of the different, like quick styles that
you can use over here.
10. Themes: Let's talk about teams. So if you want to change the overall look and
feel of your diagram, then it's very easy to do so
we just go over to the sign. And then under Teams, you can simply select
a specific team of your choosing that
would look best for you. You can also hover over a specific teams over
here to give you a quick preview on how it would look like if you select
a specific team. And another cool thing
is inside the team. There's also what we
call us and variance over here and K
that you can also select like further variations
of the specific team. So even over here, there's even a hand-drawn team as well over here,
which is really cool. And you can just select
a specific style to give it like a more customized
look and feel. But it really depends
on your needs. Once you have selected that specific team and
burn that you want, just have fun, and then just see on where your imagination
will take you.
11. Alignment and Spacing: Let's talk about
alignment and spacing. So what I did right now is for this specific step or tests for defined
course requirements, I simply moved it to a misaligned position so you could see the
connectors right now. They're not in a straight
line because I've moved this in a misaligned way. Okay, so under Home and
arrange and a line over here, you can simply select Auto align because the
cool thing over here is through snow
need for you to move the shapes manually, okay, so that everything
will look good. Because over here
there's that option for alignment and spacing to be fixed automatically
by visuals. So let me just select that, which is really cool because there's no need for
me to just drag and drop these specific shapes to just make
everything look good. So that's the cool
thing with visual, because if you need to
make manual tweaks, right, when it comes to the
different shapes and connectors inside
the ER diagram, just make sure to check
out first the options for auto align or even doing the auto align and
space option over here, right, so that he can fix the alignment and spacing
with a single click.
12. Add Pages: So let's talk about adding
pages inside your visual file. Because if you need to have multiple diagrams in
the same visual file, you can simply add
pages over here. So e.g. let's say with our
beginner course over here, I can just add another page. So e.g. if I want to work on
the visual advanced course, so let me just click on the
plus sign over here and you can see that there's
a page to added as well. Then I can just double-click on the page names and rename
them so that we can have better readability on the different visual diagrams
that we have over here. So let me just double-click on this and I'll just
type in advance. And you can just continue to add more pages as well over here. That's the cool thing
inside this show. And you can just select
all, for all pages. And you can simply navigate quickly from one
page to the next.
13. Presentation Mode: Let's talk about
presentation mode. So if you need to have this percentage on
the full screen quickly for your diagram, it's very easy to do so we
just simply go over to view. And then under views we
have presentation mode. So let's select that. So once we select this, we have pretty much the diagram shown over
here in full screen. But if you notice as well, There's a lot of whitespace. Okay, so what we can
do, I'll press escape. And what all do right now is let's make some minor
modifications over here. If you notice on
the jacket line, this signifies that, okay, this is the cutoff
for a new page. So I'll just select everything, the entire diagram
and let's resize this so that we can fit
everything in science. So I'm just dragging
this right now and let's see if it's now a single page. Now it's looking good. Then maybe some
minor modifications. We can just simply move
the container a bit, okay, or just resize this. Let me just undo
that. And let's just move this a bit down
wards over here. Okay, Looking good. Now, let's try again and
go back to View and then select presentation mode and see if everything looks good. Now it looks a lot
better because we have fit everything in a single page. And you can just simply check if your diagram is perfect for you.
14. Visio Web: So what I have right now is
I'm inside office.com and over here we can access the visual web
version very quickly. So once you're here, right, and you have your
subscription all set up, then you can simply
select visual. And this is what we have
as a starting point. So pretty much we have a new blank growing and the
different templates, this will seem familiar to you, but there will be
a lot more options when it comes to the
desktop version. But if this is
sufficient for you, then the web version is
very handy to use because it's pretty much
you can just jump from one computer
to another, right? As long as you have
your credentials, your Microsoft
account, then you can simply access visual
web right away. So what I did right now is I simply select the
flowchart template so we can have a quick look
on how it would look like. So if you notice as well, the shapes are already
pre-selected, right? Ready for use on the
left side. So e.g. let's say we have our
start and you can simply drag and drop and similar options as well when it comes to selecting the process
as well over here. And if we do that, I'm just zoom in
a bit so that you can have a better look. And you can simply
double-click on the shapes. I'll type in, start in K and then let's say
type and do this. And then I'll just hover
and silica decision, right? And then let's say
another step over here. And if I double-click on a connector and then
it'll say this. Yes. Okay. Did it pass? Then
that's a yes. Okay. And pretty much same steps
when it comes to creating our diagram or a flow chart as compared to the
desktop version. So that's really cool. So we can also open
this specific file. If you have Visual
Desktop installed, you can simply select Open
in desktop app, right? And if we just have a
quick look at it and insert pictures on pictures, et cetera, and just see a quick overview on
the different options. There's also teams that you could select over here, right? You also have team
colors that you can just change them as well. So that's really cool. When it comes to working
with a web version, Vireo. Then you have your
connectors as well, right? And then you have your layout as well when it comes
to changing them. So this is pretty
much a quick preview on what the web version
can do for you, right? You could just simply compare
between the desktop and web and which one would best
fit your requirements.
 Bash (BizTech Matters), Online Teaching Excel Expert