Transcripts
1. Course introduction: So MBA in 2023 is expensive and there are very few people who
can afford to do that. And that's why I've
made this course on MBA marketing and
business strategy, where I will help you understand all the concepts that I've
learned during my MBA. If you watch all the
videos and you will complete all the assignments that I'll be giving it to you. Then I'm sure you will have a very strong
business foundation by the end of this course. I have divided this course
into five different section. In section number one, we will build a strong
business foundation. And in this section we
will understand about some basic terminology and
concepts of marketing. So we will start by understanding the
definition of marketing. Then we will understand
about marketing mix. Some people also
call this as the four P's of marketing and
seven Ps of marketing. And we'll be using a
couple of examples to understand both
of these concept. Then we will understand
about STP analysis. Stp is also known as your segmentation,
targeting, and positioning. Then we will talk
about swot analysis, also known as strength, weakness, opportunity,
and threat. And in the end, we
will understand about product life cycle. In section number two, we will talk about
business expansion and growth strategy. If you work for a
company that have dozen of product and
those guys are selling those products into
multiple market than this section will be
super-important for you. Because as a business executive, you need to formulate
deed strategy by using Ansoff matrix, BCG matrix, so that
you can communicate some blue ocean strategy
to your team members. In section number three, we will talk about branding strategy. And in this section we will understand how
companies will sell you the exact same
quality of product at an expensive price using
these planning strategy. In this section, I'm
going to take couple of examples of companies
like Apple, Nike, and Adidas so that
you can understand about concepts
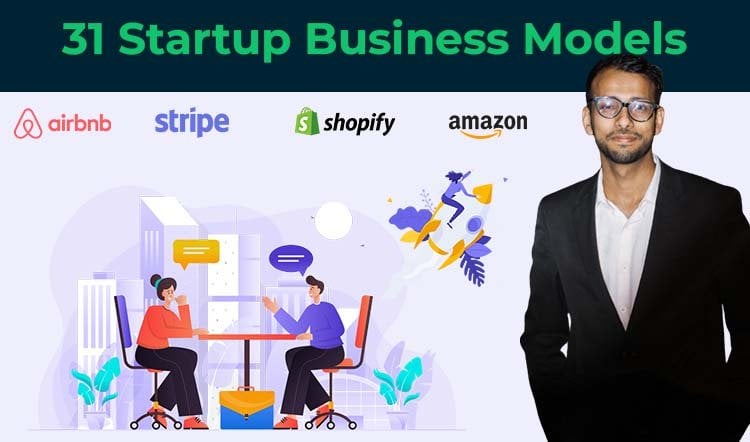
like brand slogan, brand mantra, and BAB Morgan. Then apart from branding, in the last two sections, we will talk about business
model and business strategy. And in those section, we will understand about the unique business model
of all these unicorns, startup and Fortune
500 companies. So I have a lot to
cover in this course. And if you are ready for
that, let's dive in.
2. What is Marketing ?: So let's start this course by understanding what
exactly is marketing. Marketing is the
understanding that we humans are biased and
by using our biases, selling us what companies
wanted to sell. Now I know this definition may sound confusing
to some people. So let me try to oversimplify this by giving you
a small example. Let's say if I show you these
two different images of two different product
and this product have all of these
following details. Let's say product number
one and product number two, both have the exact
same rating of 4.6. Both of these products have
almost the same review. That is 2000s, and they are both selling
at the same price. So my question is, which of these two product
will you purchase? Now, you can pause
this video for a while and think about the logical
reason behind your answer. Now I know many of you
might be thinking, well, product one and product two
have almost the same rating. They have somewhat the
same amount of review. And both of them are being
sold at a price of $5. So I can pick any one of them. I mean, it's not
really a big deal. But still majority
of you will feel that the product one is
having a good design. And that's why I will go
with product number one. Because for majority of people, I guess product number
one looks good. And this is where
you did a mistake because you should have
chosen the second product. And you may ask why. Now if you closely look
at product number two, despite of having a
normal packaging, this product is
still able to get the exact same rating
as product number one. And both of them have the
exact same price of $5. So there might be something
good in product number two. That's why a lot of people
are purchasing this product. That's why in the
marketing definition, I've told you that we
humans are biased and these businesses are using our biases to sell us what
they exactly wanted to sell. In short, a product that
doesn't market well must be a better product if that
product sells equally well, which is product number
two in this case. Now product packaging is one
of the part of marketing. There are multiple
dimensions to it. And that's what
we're going to study in this specific course. So I'll give you a single
line definition of marketing. Then. Marketing is a way of
creating, communicating, and delivering value to your customer better
than your competitor. In this definition, you have three important
thing to understand. The first one is
about creating ten, communicating, and then
delivering values. Now the way you will
create value is by solving the problem
of your customer. And that's why you will see in multiple marketing campaign, accompany will always try
to highlight benefit of their product because they have created something that is
solving a small problem. So the overall product,
the packaging, the product have super-important
in the value creation. Then you have the communication. So in your specific country, there might be people
speaking different language. So how do you exactly
communicate with those people in their
specific language? And third one is delivery. Because in today's world, you have social media. You have newspaper,
and some other media. So how exactly will you deliver the exact same value using
these different medium?
3. 4P's of Marketing in Marketing Mix: Hey everyone, In this video, we will understand
about marketing mix. The marketing mix
is also known as four P's of marketing
for product and seven Ps of marketing for service. But let me oversimplify
this concept for you. So imagine you are
making a pudding. To make a delicious
pudding, you need sugar, flour, milk, and water. And then you have to mix all of these four product in
the right quantity. And then you have to bake this specific product for right amount of time so that you can make a
delicious pudding. Now, if I will give
you a funny example, you can look at this
specific image. So if a company wanted to
have good marketing strategy, they need to ensure that
they have the right kind of product that they're
selling at the right price, at the right place. And they are also giving some
form of promotions as well. So that's what a
marketing mix looks like. You need to have a good
strategy related to product, price, place, and promotion. I'll give you a definition. Marketing mix describes the different kinds of
choices organization must make in the whole process of bringing a product or
a service to the market. Now for the marketing
mix of a product, you need to focus on product, price, place, and promotion. So you have to sell the
right kind of product at the right price on the right place by
giving some promotion. And that's what a marketing
mix of product looks like. Let's start with product. I'll ask you a simple question. Why do you prefer
Starbucks coffee? Well, your simple
answer would be, the product quality
is really good. And if I lost you, what do
you mean by product quality? You may say that I can find different variety of
coffee in Starbucks. The quality of the
product is really nice. They are having
these amazing design inside the store or
inside the coffee shop. And they also have to
use high-quality cup. And it can also highlight
couple of more feature, the brand image starbucks have. They also have nice packaging
and they have all of these different sizes of
cup in their coffee shop. And you can give so many
reasons related to product. So if I'll talk about Starbucks, they have a really nice product. And that's the first
marketing mix. That is the product. That is the first ingredient of
marketing the product. Let's talk about, please. Now, in order to provide a
good customer experience, Starbucks will ensure that they are present across all
the different channels. So in your country,
you might be using a food tech platform where you can order a specific
coffee online. And you might be just walking down the street
to drink a coffee. So they are present on all the different
types of channels. So whether you are purchasing a coffee online or if you're drinking a coffee by
walking into a coffee shop, they are present everywhere. The second one is coverage. Starbucks is present in all major countries and in
almost every single city. And that's the kind of
coverage those guys have. Then we have location. So you may find a Starbucks
coffee shop at the airport, near a railway station, or inside the shopping mall. They are presented
almost all the places where you may need a coffee. The third ingredient
of marketing is price. So if you look at Starbucks, they have a lot going
on in the pricing part. They will list the product
at a specific price. Then you can put some discount
coupon and you may feel happy that I got the coffee
at an amazing discount. And they have all of these
different payment method. They provide payment
flexibility to customer. You can be using your
credit card or debit card. You can also be used in cash. So they have all of these
pricing strategy where you can bundle different
product together and you will get some discount. Or you can buy three
or four coffee together and you will
get some discount. So they have all of these
different pricing strategy where you can bundle all of
these different products. You can get their
loyalty card and you can do a lot more things related to the pricing
of the product. And that's why the
fourth ingredient of this marketing mix is promotion. Starbucks do a lot
more advertisement. They really promote the product where celebrities are
drinking their coffee. And they tried to maintain
their brand image lot on the social media platform
where these celebrities and influencers are drinking
the coffee of Starbucks, starbucks user, interesting
social media growth strategy. So if you go to Starbucks, they will normally ask
your name so that they can write that specific
name on your coffee cup. So even if you spell
your name right, they will still put the wrong spelling of your
name on your cup of coffee. Because in that case, you will take a
picture and you will post that picture on
social media saying that that these guys can't even write the right
spelling of my name.
4. 7P's of Marketing in Marketing Mix: So now that you
understand all the four important ingredient
of marketing mix, that is your product, price, place, and promotion. Let's talk about three
other ingredient that you need to understand
in case of a service. At the starting of this video, we had a discussion
about pudding. If you wanted to make
a delicious putting. In that case, you have
to mix the sugar floor, milk and water in
the right quantity. And then you have to
bake this product for the right amount of time so
that the cake is delicious. And that's what a
marketing mix look like. If you want it to have a good marketing
strategy of a product. In that case, you have to
make sure that then you have to have a good
mix of product, price, place, and promotion. So you need to have
a good product and you are selling that
product at the right price, at the right place by giving
some discount or offer. That's what a good marketing
mix of a product looks like. But imagine you're going on a
date to enjoy this putting. In that case, you are
availing or service. When it comes to service, you need three extra ingredient. You need people, unit processes, and you need physical evidence. And that is the marketing
mix Forest Service. So if you look at
pudding as a product, then you need to focus on the ingredient of this
specific product, that is product, price,
place, and promotion. But the time you started
enjoying a service, let's say you are
going out on a date to enjoy putting
in a restaurant. Or let's say you're
going with one of your colleague to
enjoy a cup of coffee. In that case, you are enjoying
a product and a service. When it comes to service than the company needs to
focus on the people, the processes, and the
physical evidence. If you look at Starbucks, the people in the Starbucks
coffee shop are super nice, normally greet their customer. And they always try to
behave in a certain way. So Starbucks will always
focus on their people. They will give them
a lot of training so that they can deliver the
best customer experience. Apart from people, Starbucks and other restaurant also have
a certain set of processes. In technical term, we call
these processes as SOP, or standard operating procedure. You train your people to perform a specific process in a
specific physical place. This can be a restaurant or
a coffee shop, or a hotel. In case of a service, you have three extra ingredient, people, processes and
physical evidence. So let's talk about three
extra ingredient that we have in case of a
marketing mix of service. That is your people processes
and physical evidence. Let's start with
people in Starbucks. They will ensure that all of the people who are working in the coffee shop
are professional. They are spilled and they
have a positive attitude. Then we have process. So they will normally try to
process your order faster. They will also ask
you for any short of customization If you
need in your coffee. And they will also
take feedback so that they can
improve the process. The third one is
physical evidence. If you go to a Starbucks
or any coffee shop or any good fast-food
restaurant, you may find a good
modern furniture. All of the people might
be wearing some uniform. They also have the
sign board where you can read the price
of the product. They have these
non-smoking sign. There are couple of other things that these restaurant always do. So in case of a product, the four important
ingredient is product, price, place, and promotion. When we are talking about
a Service, in that case, the marketing mix
of a service will have three extra ingredient. That is people, processes,
and physical evidence. So if you are trying
to understand about the marketing mix or the
marketing strategy of a product, you always need to focus on these four important parameters. That is product, price,
place, and promotion. But anytime you have a service, let's say a food
delivery service, or a restaurant, or a salon, or something that is
related to service. In that case, you need to bring these three additional
ingredient. That is people, processes
and physical evidence. And that's all
about marketing mix of a product and a service. Let me give you a
small assignment. And the main purpose of this course is to give
you assignments so that you can solve these assignment and you can
test out your knowledge. Now, I want you to download the PDF file of this specific assignment and you can print out this PDF file, or let's see, you can draw out this specific assignment
on a blank sheet of paper. And you can solve the
specific problem. You need to create a
marketing mix of a service. That's a maybe you can create a marketing mix for Apple Store. And you can write
about the product, the price, the place, the promotion, the people processes and physical evidence.
5. Marketing Management: So now that you understand about marketing mix in this video, let's talk about
marketing management. Because if you
work in a company, then there is a very
high chance that you'll be managing couple of
people and product. So what exactly is
marketing management? Marketing management is the art and the science of choosing a target market and then
acquiring new customer. Making sure that
you are retaining those customer and growing
the customer B's using these creative deliveries and communication
messages so that you can provide superior
value to the customer. Now, if you closely
observe this definition, you will realize that you
have to do a lot of work. So you first have to
acquire these new customer, then you have to retain
these new customer. And then you have to
make sure that you are constantly growing
at a specific rate. And for all of these
process to happen, you have to create new
marketing campaign. And then you have to deliver those campaign to the end-user. And that's what a marketing
management looks like. You have to do a lot of work. Now, if you go to big companies, you may realize that they have a single marketing manager
for all of these roles. There might be one marketing
manager who is constantly looking after the performance
marketing effort. There might be one
person who is looking at the retention and the
growth rate of a company. These role might be assigned to different people based
on the size of company. But broadly, in
marketing management, you are constantly thinking
about how can you introduce new products into the market by picking up a smaller segment? And how can you
expand your business by doing both of
these activities. Finally, you will
convince customers to buy your product with the
help of unique delivery. So you have four major function
of marketing management. Introducing new product, finding an interesting
segment that is looking for a solution and expanding your
customer base. And you will do all of these
three process by delivering your communication with the help of some unique messaging
or unique delivery. And we'll talk about all of
these things in a minute. So let's start with new product. So for simplicity,
in this video, I'm going to take an example
of a company like Colgate. So as you know,
in marketing mix, we had a discussion
about product, price, place, and promotion. So when you're introducing a
new product into the market, you can look at all of these four different
ingredient of a product. So you can introduce a new product based on the quality of the
existing product. You can introduce a new
product based on the price that you are targeting and
also based on the police. In different countries, you can introduce different product. Let's start with price. So Colgate introduce a
most affordable product and that's the cheapest one. In some developing countries, especially some southeastern countries and African countries. Then they introduce a product
for middle-class people. Want a little better
quality of toothpaste. And then we have a product
for upper-class people. They have Colgate visible white. If you are someone who can spend some extra bucks to use a
high-quality toothpaste. In that case, you can buy
Colgate visible white. So they have these
three different product for three different
class of people. And the reason they
did that is because different people have
different disposable income. I mean, if a person is earning less amount of money
every single day, then he may not be
interested in spending a lot in choosing a toothpaste. I mean, he just won the
most affordable one. And same goes with
the people who are in the middle-class
and upper-class. So they have these
three different product for three different
class of people. And that's introducing a new
product based on the price. The next one is
introducing a product based on a specific segment. Now Colgate is a big
company and they have a lot of investor and they
are also a listed company. And that's why their aim is to make sure that they
are growing at a specific rate
every single year so that they can increase
the stakeholder's value. And that's why they
are constantly introducing a new product. By solving a pinpoint
of a specific segment. Let's look at all the
different segment you have in the market. The first segment is for kid. And I'm sure you have seen these different shapes and sizes of these toothbrush
and toothpaste. I mean, the main aim here is
to make these toothbrush or toothpaste or a little
more interesting by using these different cartoons or that kids will enjoy
brushing their teeth. So that's their first
customer segment. I mean, they have a lot more stock keeping unit or SKU or product in this
specific segment. The next one is for you. And we have seen all those
three different products for different class of people. But they have a Colgate
Max Fresh product, especially for youth. So if you are someone
from the age group of 18 years to 25 or 30 years. In that case, you can go
with Colgate Max Fresh. In the end. They have a product for adult people who have
sensitive tooth as well. So they have a Colgate
sensitive product for them. And not only these three
different segment, I mean, they have product
for almost every single segment that
you can imagine. Now they did some research
and they figured out that they need a product
for every single segment. Because normally in a
household you just have one toothpaste and every
single family member is using just that toothpaste. And that's why they
have introduced all of these different
types of product so that people will purchase these products and they will
use different toothpaste. And that's the whole purpose
of maximizing the revenue or stakeholder's value
by introducing a product based on the
price or affordability, Then we have market expansion. So this is purely based on the type of
country you are in. So Colgate have different types of product in
different countries. So if you look into
some African countries, they have this basic
Colgate's strong teeth paste and that's the most affordable
one in African country. They are not really launching these premium
expensive toothpaste. They have this Colgate
strong tea toothpaste. In some Asian countries
like India or Indonesia, they have this toothpaste that is named
Colgate with Shakti. This specific toothpaste have a lot more Ayurvedic ingredient because people are more inclined towards these
Ayurvedic ingredient. And that's why in some Western countries they
have Colgate Max ways. So you can see that in three different
continent or countries, they have three
different product. The reason Colgate launched Colgate beads at t
is because one of the Indian brand was expanding very fast in
Ayurvedic toothpaste category. And that's why they launched
Colgate beads up thin India. So now that you understand
how exactly a brand can launch a different
product based on price, based on the customer segment. Let's understand how
exactly that brand can deliver a unique value with the help of
their advertisement. Let's start with the first
campaign that is Colgate MOM. Now if you look at
a normal household, you will realize that majority of the shopping or products are purchased by women,
especially our mom. And those products are used by almost every
single family member. That means the customer of the product is different
from the consumer. You and me are the
consumer of the product, but the customer of the
product is our mom. And that's why Colgate obsessively focused on
targeting these small. And that's why you may have
seen these emotional ad from these marketing
campaign like Colgate mom, where these different
humans are describing how their kids teeth are stronger just because
they are using colgate. And that is one of their
marketing campaign. And that is a unique
way to deliver value. Because if you are able
to convince The woman that this product is good for all the kids or all the
family members you have, then they'll probably
purchase it. The second campaign
they did was on youth. So they showed the benefit and
the future of the product. Like you will avoid bad breath
if you use the product, a lot of goals
would be attracted towards you and all
of those things. In the end, they had
this unique delivery for their premium product that
is, Colgate visible white. And they use these
different actresses or these different influencer
in order to show them that your teeth
will look sparkling white if you use the premium Colgate visible white product. They use these different
marketing campaigns to make sure that they have a unique delivery and they
are delivering the value to the customer much better
than the competitor. So that's all about the
marketing management. Or if I summarize the video, marketing management
is the art and science of choosing a
specific market and then constantly acquiring
new and new customer by making sure that you
have good retention. And you're constantly growing
in that specific market. And the way you do that is by communicating a superior
value to your customer. So that's all for this video. I have a small
assignment for you, and I highly recommend
you to complete this assignment because that's how you're able to
test your knowledge, whether you are able to
grab this concept or not. So you have to do a marketing
management assignment for a brand like Coca-Cola. So you have to write
about how does Coca-Cola communicates superior
value to the customer. You have to list out all of their product based on
different customer segment, based on different price, and maybe based on
different continent.
6. Intro to STP (Segmentation, Targeting, and Positioning): Hey everyone, My
name is now beep. And in this video, we're going to talk
about STP analysis. Now, there is a famous
scene in the business world that if you try to be
everything to everyone, you will become
nothing to anyone. And that's why in this video, we will understand about
the S-T-P process. Now, STP stands for segmentation, targeting,
and positioning. So if you're
launching a brand or a product into the
market, in that case, instead of targeting
all the people in that specific market, you have to pick a very
small segment of people. And then you have to
target them across different social media or
newspaper or different medium. And then you have to
position your product. And that is the overview
of your S-T-P process, also known as segmentation,
targeting, and positioning. So let's understand
why do we need STP? And I'm gonna give you a small example so that
everyone can understand. So let's say you are an
entrepreneur and you strike up with this idea of creating toothbrush
out of bamboo shoots. So instead of picking a very small segment that
is environment friendly, Let's say you're
planning to target all the toothbrush
user by positioning your product is the environment friendly alternative to
these plastic toothbrush? But the reality is a normal customer don't really care about sustainable living. That's why you have to do an STP analysis
where you have to segment a specific class of customer and then you
have to target them. Because in reality, 85% of your audience doesn't really care about sustainable living. No matter how good or bad
your product or your idea is, you have to segment
your market into all of these categories and
then you have to target them. And that's the whole idea
of doing STP analysis. You first have to
segment your customer. Then you have to
find unique ways by which you can target them
across different media. And then you have to position your product over
the period of time. So if I'll give you a high-level overview
of S-T-P process. You first have to
segment your customer. Then you have to target them by highlighting the
benefit of your product. How will your product
is different from all the existing product
into the market? After targeting, you
have to position this specific product
in the mind of people. And obviously this process can take up two ears
so that people can understand that this is a good alternative to these
plastic tube pressed. And I think I should
give it a shot. That's why positioning will take a lot more time so
that you can convince people that this is a good alternative to the existing product
into the market. And over the period of time, you also have to work on
the implementation side. That means you have
to work on pricing, product, place, and promotion. And I hope you already have a good understanding
about marketing mix. So that's the high level
overview of STP analysis. Now, let's take this
framework of STP analysis and let's try to implement this
SDP into the idea we had. You had an idea of launching
a bamboo toothbrush, which is an alternative to
the plastic toothbrush. So you first have to
segment the customer. Then you have to
find unique ways so that you can reach to
those specific customer. And then you have to position
your product. In a market. You might be able to find
almost 15% people that are really interested
in trying out products that are eco-friendly. But the main problem is how exactly do you
reach out to them? So you have to find different channels and
different community where all the people who are doing some environment friendly work are connected to each other. Then you have to educate them about the adverse
effect of plastic. And that's how you
will be able to position your product
in the long run. Now, obviously, the whole
process can take up two ears or sometime
decades to convince people that this product is a good alternative to the
plastic product that you have. And that's why some people
will always try to find these so that they can
target top 1% people. Instead of targeting
all these 15% people that are interested in
environmentally-friendly product. So if I summarize
the complete video, than STP is a marketing approach where you segment your audience and then you try to target the best-fit audience
segment for your product. And in the end, you
position your product to capture your target
segment effectively. This is all about the basic
outline of S-T-P process. In the next video, we will understand how can you pick these different
customer segment and how can you find different ways by which you
can target those segment? So I'll see you guys
in the next video.
7. STP Analysis: Hey everyone, My
name is now deep. And in this video
we will understand about segmentation,
targeting, and positioning. So in the last video, we had a discussion about
the outline of STP analysis. And in that video we had
a discussion that what exactly is STP analysis and
why do we need to do it? In this video, we will pick a small problem and then I
will help you understand how can you exactly do some experiment in order to target different
customer segment? Now I know I might be going a
little slow in this course. But the main purpose of
this course is to make sure that all of you have
a strong foundation. So in this video, let's pick a small day-to-day
problem and then we will understand how you can experiment with different
sales channels. And in the next video, we will take our industry
specific problem. Let's say you wanted to
sell toys in the market. In that case, you have to find different unique
ways by which you can sell these toys
into the market. Now the false assumption you
took was that these kids have these elder brother and those people might be going to these different universities. And that's why I have to
visit these universities so that I can sell these products with
their elder brother. The second assumption
was that all of the appearance might be visiting these
corporate officers. And that's why I should stand in front of a university
or a corporate office. And that's how I'm able to
sell all of these toys. So basically, in this case, we are targeting a wrong
segment because in case of toys or customer and the consumer are two
different people. A customer is someone who
is buying these products, and consumer is someone who is playing with
these product. Now customer can be the elder brother or
appearance of the kid, but the customer is
the good itself. Just picking the customer is
not sufficient in this case, you realize that I'm
only targeting costumer, but not the consumer. And that's why you changed
your sales channel. Now you're selling in
front of a school, or let's say you somehow
got a permission to sell all of these
toys inside the school. But still you are not able
to sell these toys well, because you're
targeting is not good. So you went back home and you brainstorm this problem
with one of your friend. And your friend told
you that you have to target the customer and the
consumer at the same time. And that's why you decided to
change your sales channel. And this time you are
standing outside of school, especially when the students are coming out
with their parent. And you're standing in front
of a pediatric hospital. And in this case you have the right segment and you're
doing the right targeting. Because when you stand
outside a pediatric hospital, in that case, you have your
customer and your consumer. And the consumer who
are these kids have the emotional influence on these customer so that they
can purchase these toys. Because normally these kids started crying and
that's why these parents have to buy these toys so that they can make
their kids happy. And that is your right
segment and write targeting. You are able to
get a place where you have both your
customer and consumer. And these consumer have some influence on these customer so that they can
purchase the product. So this is the analogy that I have used in
order to explain how can you pick your
sales channel and how can you target your customer
or let's say consumer. So let's understand about the
definition of STP analysis. So STP is a marketing model that redefines whom you
market your product too. And how. Some people also call
this as a step formula. That means if you are able to segment your customer
really well, and if you are trying your
best in order to target those customers at all the possible seams
channel or marketing channel. In that case, you
will end up with a good positioning of a
product into the market. So in short, this step formula will make your marketing
communication more focused, relevant, and personalized
to your customer. So let's talk about the
objective of STP analysis. And then I will give you these different
example and framework so that you can segment your customer and then you can target and position
your product. Let's talk about the
objective of STP analysis. The first objective
is that STP analysis will help companies identify
attractive market segments. Now once you have a
single or a group of market segment, in that case, STB analysis will also help you choose a target
marketing strategy. The last objective of STP
analysis is that it will help company's position their product for maximum
competitive advantage. And we'll talk about all of these objective in
the next video.
8. Segmentation in STP Analysis: So in the last two videos, we had a discussion about the outline and the
objective of STP analysis. And this video will go
deep into segmentation. And in this video we will
understand how can you segment the market based on
the specific attributes. Now, I understand
that I'm going a little slow in this
specific topic. And the reason is
that SDP analysis is the core concept
of marketing. And that's why you have to
have a strong foundation. So segmentation is the
process of segmenting the audience into smaller group based on specific attributes. This segmentation will give you a better clarity on who benefits the most from
your product and how, if you want to
split a big market into these smaller group, in that case, you can do a geographic segmentation or
a demographic segmentation. Or maybe you can go ahead with psychographic or
behavioral segmentation. Let's start with
geographic segmentation. Now to understand
geographic segmentation, I'm going to take an example
of a brand like McDonald's. So if you know someone
who work at McDonald's, they have a famous tagline that you need to think
global and act local. And that's why if you closely observe a single
product in McDonald's, that's burger across these
different countries. So let's say in United States, you will find McDonald's
selling a beef burger. But in India, you may not find them selling a beef burger. Instead, they are selling
our ALU Tikki burger. And similarly in
Philippines they are selling make
spaghetti burger. So you can see that a
single international brand selling a different type of product in
different countries. And that's a really good example of geographic segmentation. Then we have a
demographic segmentation. If you're segmenting a market
based on different age, group of people in
that specific market, or based on their gender
or education level. Or maybe the family size or
ethnicity or income group. In that case, That's a really good example of
demographic segmentation. So if you look at these
different FMCG brands like Unilever or PNG, these brands may launch
different flavors or different types of product based on the income
group of people, or based on their
education level, or even based on ethnicity. And that's a good example of
demographic segmentation. Then we have psychographic
segmentation. If you're segmenting
a market based on the interest, lifestyle, or subconscious motivator than it says psychographic
segmentation. In the end we have
behavioral segmentation. Let's go deep into segmentation and let's solve a
real-world problem. Let's say you started
working in a company and those guys are launching a new product that
is plant-based milk. And let's say you are
in the marketing team of that specific company. Now, obviously the first step of marketing campaign is to make sure that you are targeting
the right segment. So you first have to find these different
customer segment in the market because
you don't really want to target general public. So you have to find
all those segment of people who want to move away
from the database product. So let's say this is
your product and you have to find these
different customer segment. Let's say after doing some market research and maybe talking to these
different customer, you were able to find these two interesting
customer segment are first segment is
Segment number a. And this segment have all
those people who are looking for a daily free alternative
for lifestyle purpose. These are all high-income
group people. Apart from this, you
were also able to find a different customer
segment, that is segment. And this segment have
all those people who are lactose intolerant and they are looking for
some other option. So lactose intolerant are
all those people who are not able to digest dairy
products, specifically milk. And in case if you don't know, the milk is normally digested
by an enzyme called rennin. Rennin is present in
maximum quantity, especially in kids. And as you grow older, the production of renin
goes down in your body. In short, you have to segment
of customer, segment E, have all those people
who are looking for dairy free alternative
for lifestyle porpoise. And these people
have high-income. In segment P, you have
all those people who are lactose intolerant and then
looking for other option. So the first part of a marketing campaign is to make sure that you
are going from undifferentiated mass
marketing campaign to a micro marketing campaign. Because you don't really want
to target abroad segment. You have to target of
very narrow segment. And that's why we
normally go from undifferentiated mass
marketing campaign to a micro marketing campaign. Now, that doesn't
mean that you don't really have to target
a broader segment. If you look at a
product like Coca-Cola. So whether you are
a five-year old kid or a 65-year-old guy. Anyone can drink Coca-Cola. And that's why Coca-Cola
will always try to have a undifferentiated
marketing, also known as mass marketing. But because we are launching a duty-free alternative and we have a limited amount
of marketing budget. In that case, we have to pick a smaller segment and we have
to target them narrowly. And that's why we are
doing a micro marketing. So I hope you understand the difference
between these two.
9. Targeting in STP Analysis: So let's pick the
same example to understand targeting
in STP analysis. Targeting is the stage where
you decide which segment you created during
these segmentation fees is worth pursuing. So let's understand about the criteria to choose
a target segment. So you have to pick a
customer segment that have enough potential so that you can justify the marketing effort. This is because you
might be putting a lot more financial
and human resources in order to sell a
product into the market. The next criteria is difference. So you have to
ensure that you have enough measurable
difference between all of these to different
customer segment. Otherwise you will
be unnecessarily duplicating the effort for these two different
customer segment. The third criteria
is reachability. Reachability means is
your customer segment accessible to your sales
and marketing team? I mean, which marketing
channels will you use to make sure that you are reaching out
to your customer? The fourth one is profitability. So in order to
acquire a customer, you might be spending
some amount of money, and that is your customer
acquisition cost. And once you have a
customer with you, than those people might be purchasing some product
from your brand. And the frequency and the duration of their
porches will give. And the frequency
and the duration of their purchase will lead to
customer lifetime value. And if your customer
lifetime value is more than your customer
acquisition cost, then you are making profit. So you have to check
whether you will have profitability by targeting that specific customer segment. And in the end,
you have benefits. So do you have enough
benefits so that you can target that specific
customer segment? So in our case, we have two different
customer segment, segment E are all those people who are looking for a
dairy free alternative. And segment P are all those people who
have lactose intolerant. For segment a will go with cruelty free
value proposition. And for segment B, we will go with dairy
free value proposition. So let's look at
both of our segment. Segment a is looking for
a dairy free alternative. And all the people
in this segment have high-income and they have
some online presence. While for segment B, these people are
lactose intolerant and they may or may not
have a high-income. So all the people in this specific category
are medium to low-income. And some of them might
be present online, while few of them are
also present offline. That means they might not
be using any mobile phone or they might not have a
social media presence. Now the reason we're focusing on income and channel is because if a specific segment is not using a mobile phone or if they are not connected with internet. In that case, how
exactly will be target? Let's say as a
marketing manager, if you have a choice
that you need to pick just one segment out of these two different
customer segment, then you should choose
segment number e. This is because people
in segment a have high-income and that's why these people can easily
afford a premium product. And also all these people
have some online presence. They might be using a
social media app or they might be consuming some form
of content using Internet. And that's why you can
easily target these people. So to conclude this video, in this case, you have to
pick a customer segment a, because this will have all
the high-income group people who are ready to
pay a premium price for quality lifestyle
change in product.
10. Positioning in STP analysis: Hey everyone. Now that you understand
everything about segmenting your customer
and targeting them. And this video, let's
talk about positioning. Positioning is the
process of thinking about your product from the
customer's perspective. So broadly, we have three different ways by which you can position your product. The number one is
consumer-based positioning. So in consumer-based
positioning, we tried to understand the
pinpoint of the customer. And then we will align those pinpoint with the
benefits of the product. Then we have a competitor
base position. If you already have enough
competition in the market. So let's say if you have multiple brands selling
soy milk in the market, in that case, it's difficult
for you to just highlight benefit and align the
pinpoint of the customer. You have to also highlight
all the benefits that your product have and how it is better
than the competitor. And that's the competitor
based positioning. And in the end, we have a
price based positioning. And in this case, we will try to justify the cost of the product. So let's say if you're selling your product at a premium price, you also have to justify
that premium price, that why we are selling our product at an
expensive price. And apart from these three, we can also have a benefit based positioning and a
prestige base position. So if you're selling
a luxury product, whether it is a clothing
item or a luxury forge, or a smartphone, then you have a prestige
space positioning. So in the end, positioning
is all about performing a competitor analysis
and figuring out the value proposition
of your brand. And then how can you communicate that value proposition
with your customer? So let me give you
a small framework. If you want to position your
product into the market. In your marketing campaign, you first have to highlight
what exactly is your product. Then you have to talk about the job that
specific product do. And then you have to discuss about the outcome
of your product. And finally, you have
to ask yourself, why people should care about that specific outcome and why it is super-important
to take an action. Now, let's start by highlighting what exactly
does your product. So we will pick the
exact same problem that we were solving
in the last video, where we are trying to sell
our soy milk in the market. So let's start by describing
about the product. So soy milk is a great
dairy free alternative. That's a description
of your product. Then you have to tell people what job does this product do? We will be writing things like this product
contains no fat. This have zero cholesterol
and it also tastes amazing. Then we have to communicate the outcome
of this specific product. If you consume or if you
drink this specific soy milk. In that case, you
will get omega-3, omega-6 fatty acid, and this will help you
build strong bones. Now this is a good
value proposition in order to target mom because our mom is really
concerned about our health. And that's a good value
proposition because majority of our moms are
doing grocery shopping. And that's why, if you
highlight the value proposition that this product contains omega-3 and omega-6 fatty acid. And these two are
healthy fat that are super important in order
to build strong bonds. In that case, your mom will end up purchasing
this product somehow. Then you have to highlight why people will
purchase this product. Because normally kids
avoid drinking milk. And that's why, if you highlight the value proposition that
this specific product comes in six different flavor
and your kids will love it. In that case. That's a good way to
tell people that. Why don't you try all of
these six different flavor? In the end, you have to
create urgency so that people will at least
explore about your product. So you can highlight things like buy online on our website, or you can try out this
product on Walmart or Target. And that's your urgency. So when you're
creating a marketing campaign, in that case, you have to go from top to
down and you have to use this positioning framework
so that you will be able to position this product
on the mind of people. So you have to start with giving the introduction
of a product, and then you have to
end the positioning by creating urgency
about your product. And that's your positioning
in STP analysis. So let's quickly
summarize this video by understanding the benefits of
STP analysis in marketing. The first benefit
of STP analysis is that it will improve
your engagement. So you have precisely targeting
a segment and it is more likely to engage and convert from your
marketing campaign. The second benefit is reduction in marketing cost because you have picked up very
smaller segment and your precisely
targeting it really well. In that case, you are not
wasting your budget figuring out different marketing channels and different customer segment. And that is why your customer acquisition cost
will be very less. And if your customer
acquisition cost is less, and if your customer
lifetime value is high, then you are generating profit. The third benefit is that you can create
more robust product. Now because you have a clear understanding about
the customer segment, Those people can give
you instant feedback. And based on that
specific feedback, you can also improve
the product. These are the few benefits
of doing STP analysis. In the next video,
I'm gonna give you a small assignment
and you have to complete that assignment so that you can test your knowledge. So this is the
time you will test your knowledge by
completing assignment. I'm gonna give you a
small assignment where you have to find a
customer segment. And then you have to find
different ways by which you can target those
customers segment. And in the end, you
have to position about your brand in the
mind of the customer. So Marriott Hotel have all
of these different brand. I guess they have more
than 20 different brands. So you have to find out the different
customer segment that these people are targeting
with these brand. And how can they position their individual brand in
the mind of the customer? You have to find out the
customer segment for, let's say Marriott Hotel. And how can they
target and position about Marriott Hotel in the
mind, of course, customer. Similarly, you have to find out the customer segment
for executes t0 and how can the target and position about executes t0 in the
mind of their customer. You have to complete this
assignment by yourself. You can solve this assignment
on a piece of paper. And I'm also going to attach the assignment and the solution
in this specific video.
11. What is value Proposition?: Hey everyone, My
name is now deep. And in this video, we will discuss about
the value proposition. Now, before we
discuss about what exactly the value
proposition is, let's first understand about the structure of
value proposition. A value proposition have
a structure like this. So in your value proposition, you will first highlight
your target customer, what your value
proposition is for. And then you will highlight
what kind of product your customer need or the opportunity you
have in the market. Then you will mention about
your product and what exactly your product is and all the benefits that your product will
bring to the market. So that's the
high-level structure of your value proposition. Let's look at the example and let's understand about
the value proposition. So if I'll give you
a small example, let's say in the
last few videos, we were discussing a lot about the dairy free alternative, and we were discussing
about soy milk. So let's take that soy
milk blend as an example. So the value proposition of soy milk brand will go
something like this. So for people who have
active lifestyle, I'm looking for dairy
free alternative. In that case, our
product is good because it is healthy
and our product contains omega-3 and
omega-6 fatty acid that can improve your
brain and muscle health. So that's the value proposition
of a brand like soy milk. And we had a discussion about that specific product
in the last video. Now, in this value proposition, you can see that we have covered for that is all the
people who have an active lifestyle and who are looking for d
roughly alternative. So we have also covered
h2 and then we have r. That means what
exactly our product to and in which category
or product line. And then we have highlighted
couple of benefits. So that is a high level overview
of a value proposition. Now, before we talk more
about value proposition, let's understand what
value proposition is and what value
proposition is not. So value proposition is
a simple statement that summarizes why a customer would choose your
product or service. So let's understand what value proposition is and what
value proposition is not. Let's start with what
value proposition is. Value proposition is exclusive. That means, how well
does it highlights the competitive advantage of your brand and how it
can separate your part. Also, value proposition
is being focused. That means in value proposition
you have to mention how your product can fix the customer's pain point and how it can
improve their life. Also, value proposition
needs to be specific. This means that you
have to highlight the specific benefit that your customer will
receive from the product. So these things will help you understand what your
value proposition is. And then the last slide, we had discretion about that. Let's understand what
value proposition is not. So value proposition is not
a description of your brand. That means you don't
really have to talk about what exactly
your product is, how it is made up of these different ingredients
and all of that. And obviously if those
ingredients have some benefit, in that case, you
can highlight that. Also, value proposition
is not information. That means you will not
talk about your product, your company, or your vision, mission, or who are all the people who started this brand and all
of that stuff. Because value proposition
is not the inflammation. Also value proposition
is not a slogan. That means you don't
really have to write some slogan or some catchy
phrases for your brand. I mean, if you want
it to do that, you can look at other
brands attribute. So now that you understand what exactly value proposition
is and what it is not, now, you might be
thinking, fine, I understand the difference, but how do I create a value
proposition of my brand? Let's say you might be
working in a company as a brand manager or maybe as a marketing manager.
In that case. Is there any framework
that you can use in order to create the value
proposition of a brand. So in this video, I'll give you a high level
understanding or maybe an overview of a small value proposition
building framework. So you first have to
start with the market. You have to choose
a specific group of customer that you are targeting. We had a discussion about this specific concept
in the STP video, where we had a
discussion about how do you go around
segmenting your market into smaller groups and
how exactly you can find different sales channel in order to target
those customers. And obviously you have to
position your product as well. So lets the first part
of value proposition, where you choose
a specific group of customers that
you are targeting. Then the second part of this value proposition
building framework is value. That means you first
have to mention at least three to four
benefit of your product. And when we talk about value, than value is nothing
but benefits minus cost. And that's how the customer
will look at your product. So you have to make
sure that you are giving maximum value
out of your product. So value in terms of benefit of your product and in
terms of prestige. So if you're selling
a premium product, the reason people pay
for a premium product is because they are getting
more than just benefit. They're getting a
perceived value. Let's say if there's
a premium brand or let's say there is a
premium smartphone brand. The Nevada from benefit or uses. People also carry a luxury or a value along
with the product. So that's number two. You have to find
out all the ways by which you can build a
value of your product. The third one is
we are offering. And in that you will highlight. For this, you will use your product or service
mix that you are selling. In this case, you have
to work on product, price, place, and promotion. And we had a discussion about that specific concept in
the marketing mix topic. Then we have benefits. So you have to write down at least three to four benefits that your product will provide. And then you have to highlight those benefits whenever you are targeting different
customers segment. So if you are targeting
moms in that case, you can highlight benefits
like so Emily can help your kids improve
their brain and bone cells. And when you're targeting a
high-income group people, none, maybe you can highlight
the specific benefit. Does the product have like this product will have omega-3
or omega-6 fatty acid. Then we have
differentiation and, and that you will
distinguish your product. Then we have a differentiation. So if you have a
competitor in the market, then you can differentiate
your brand in terms of price benefit quality, or GMO free on GMOs,
genetically modified organism. So many brands use these hybrid ingredient or genetic modified ingredient
that are not good. So you can differentiate
your brand in terms of the ingredient to use, or in terms of benefit or in
terms of flavor or quality. And different brands use
different techniques to do that. In the end, you have your proof. And normally people use. Now normally brands use a
third party organization or a health authority
in order to show a proof that our product
is approved by this, this, this, and it is used by 1 million
people and all of them are happy and recommended by
dentists and all of that. So these brands use these different
techniques so that they can prove to the customer that this product is
good for you and it is approved by all these
health care professionals. So now that you have a good understanding
about value proposition, now let's quickly do
a small assignment. So in this assignment
you have to create a value proposition canvas
of a brand like Tesla. But you might be thinking, well, what exactly is a value
proposition canvas? So first, let me help
you understand what exactly a value
proposition canvas is. And then you want to complete this assignment where you will create a value proposition
canvas of a brand like Tesla. Now, you have to do all
this exercise by yourself. I mean, if you do a
small Google search, you can always find the
solution of this assignment. But I will highly recommend
you not to do that. Because doing this
assignment will help you understand how do you
or your concepts are. And these things are
super-important. In the value proposition canvas. You first have to write about the basic detail of the
brand and the product. So you will write things like the company name,
the ideal customer, the different products
that company has, and the substitute that are
available in the market. Then on the right side, you have to mention
about the customer. So in that specific section, we will discuss all the
details about the customer. And on the left side, we will write things
about the product. So let's start with customer. So whenever our customers thinking about
purchasing a product, the first thing those
people have in mind is that what all benefits to
get from the product. So in this section you will talk about all the benefits or gains of a customer and what is their expectation
and desire from a product. That in this section, you will talk about
all the pins. So before a customer
buy a product, let's say they may have
some negative emotion or some undesired cost
or some risk in mind. Since this section you will write all the risk or pins that the customer have
in mind before he think about
purchasing a product. And in this section you
will talk about the jobs. That means what is the
minimum expectation the customer have in mind
from a specific product? So you have all
these three section where we will talk
about the gains, the pains, and the job. Then in the left section where we will discuss
about the product. The first one is about
the product and service. So you will highlight
the list of product and service where your value proposition
is built around. You will highlight all the
different product and service. Then you will discuss
about all the gains that these customer will get out of this specific product. We will discuss how your product or service can create
customer. Again. In this section we'll talk
about the pain relievers. So you can see that in
the customer section they had some pain or negative
emotion or some risk in mind. So in this product section, we will discuss how
that product is. Eliminating the customer
pains or negative emotion or undesired cost or situation that those people have in mind. This is the high level overview of a value proposition canvas. Now, you have to do assignment where you will highlight
all the gains, pains, and the
benefit of a product. For a brand like Tesla. I'm going to attach the
assignment and the solution. You can download the
assignment and just try completing that
assignment by yourself.
12. Whta is SWOT Analysis?: So almost a few days back, I was scrolling
through Instagram. Although I don't really spend
so much of time using it. But I saw a video and in that specific video or person
was seeing that many people fail in certain task in
life because they are unable to channel their strength
in the right direction. And as a result of that, they loose direction in
life and become frustrated. Now some of you will
say that, Well, why are you using that
specific video in this course? Well, just like people have
strengths and weaknesses, organization also have
strengths and weaknesses. And that's what we're
going to study in this course or in this video. In this video we'll
talk about strength, weaknesses, opportunities,
and threat of a company. Now, if you look at yourself or if you
look at any person, you may have some strengths
and some weaknesses. So let's say if communication is your strength as a person, in that case, you
should choose domain like journalism or
human resource. And you should avoid becoming a software developer
or something else. On the other side,
if your strength is mathematics, in that case, you should become a
financial analyst or a statistician instead of becoming a human
resource manager. So you have to make sure
that you are generalizing your strength and you are
avoiding your weaknesses. Or at least we are
working on them. Now in this video, we'll talk about swat analysis. So let's understand
what exactly is swot analysis and why
as a business manager, we need to perform
swat analysis. Swot analysis is
an examination to identify its internal
strengths and weaknesses, as well as its external
opportunities and threats that will affect
the business growth. Let's start with strength. So strength are all the things that you do well
in your business. Now some business or companies use people
as their strength. Some companies use financial
resources as their strength. While some companies have operation management
as their strength. So strength can be
anything that you do well, then you have weaknesses. Weaknesses are all those things, all those departments of your business where
you need to improve. So maybe you do not
have enough people to work on a specific task. Or you may not have the best technology
team in your company. All of these are
your weaknesses. Then you have opportunity. Now the strength and weaknesses are always internally
in your company. That means you have a full
control on your strength and weaknesses inside
your company and external factor cannot affect your strength and weaknesses, then you have your
opportunities. And opportunities and threat can be influenced by
external factors. If your company
wanted to expand into a new market or they wanted
to launch a new product. That's the opportunity. That means all the goals that you want it to achieve or you're looking forward to it. That's the opportunity. In the end, you
have your threat. And threats are all the
obstacles that you face. So let me quickly summarize
all these things for you. So strength are all the things that you do well as a company. And these can be human resource or
financial capital that you have with you. And these can be your
strength because you can leverage your people or
financial resources. If you have, then you have a sauteing
weaknesses in your company. And you have to use either your human resource
or financial resource to make sure that you are generalizing your
weaknesses into strengths. Then we have opportunity. And let say, if
you are working in a company like Apple or Google, and they have a lot more free
cashflow in their company, or they have deep pockets
so they can invest a lot more capital in the new opportunity
or in new areas. In that case. In this area, you will understand
how you can leverage your strength in order to create opportunity in the large market. You can take advantage
of some trends. Let's say Google is
investing a lot more capital in cloud computing and in
the machine learning space. Similarly, Microsoft and
Apple, along with Facebook, is investing a lot more capital in metaphors and we are space. Then we have threats where
we have to understand about how new businesses can disrupt the
existing business. So in the recent few example, if I talk about one of
the product of OpenAI, that is Chet GPT-3. They are somewhat
disrupting search engine. So people are using Chet GPT-3
to quickly get the answer. Instead of using Google,
that's your thread. Your thread and weaknesses
have internal origin. And your opportunities and
threats are external origin. And strength or all
those things that your organization do
particularly well. And strength will help you distinguish your company
from your competitor. So things like human
resource manufacturing or financial resource can
be one of your strength. Then you have weaknesses
where you need to work on. And then you have
opportunity and these have the external origin. So let's say if a government is creating a platform
and as a company, you can build a product on the top of that
specific platform. These are all the
opportunities you have, or let's say if the
government is changing rules and regulation and they are setting
up some sort of compliances in a
specific industry. And that's the opportunity
you have to focus on. In the end, you
have your threat. And threat are all those things that can negatively
affect your business. So maybe you have more
competition into the market, or there might be a
supply chains shortest in the future due to some
pandemic or something. These are all the
possible threat. If you are able to identify threats or
opportunity really well, before then your competitor, then you are able to create much better impact
in the market. So in the next video, Let's do a swat analysis
of a company like Amazon. And in that video
we will understand how people at Amazon are
doing a swat analysis in order to understand how they can channelized
their weaknesses or how they can grab these opportunities and maybe avoid these threats
in the future.
13. SWOT Analysis fof Amazon: So in the last video we had a discussion about
swot analysis. And in that video
we had a discussion about all the strengths, weaknesses, opportunities,
and threats of a company, and how they can generalize
these weaknesses, or let's say these opportunity
in order to make sure that their business is constantly growing and they
are generating profit. Now, let's try to apply swat
analysis in case of Amazon. And in this video, we'll understand about strength, weaknesses, opportunities, and threats of a
company like Amazon. Let's start with strength. Now, we all know that Amazon is a customer
oriented brand. And I guess they have written this specific keyword into their mission statement as well. All the things that
they do is very well aligned with the value that
they provide to the customer. Then if you look at the
e-commerce vertical of Amazon, then they have an
amazing network effect. Now, if you don't know
about network effect, let me try to explain
that in a single line. So one of the reason
you use a specific app, like WhatsApp or
Facebook or Instagram, is because your
family member and your friends are using
the exact same map. That's a good example of network effect in
case of social media. But if you talk about Amazon, so in case of Amazon, if you have more number of users using your
e-commerce platform, then you would be able
to attract more number of sellers selling their
product on your platform. And in that case, you will
have a network effect because you would be able to
grab more number of user, because you have more number
of sellers on your platform. And sellers will only sell
on Amazon because it is the only product that have
the maximum number of users. And that's a good example
of network effect. In the coming videos, we have a dedicated video
network effect. So I'm not gonna go deep
into this specific topic. Also, one of their strength
is large number of acquisition that these
guys have done so far. I mean, from
acquiring Whole Foods to couple of Robo-Taxi platform, Amazon do a lot
more acquisition. And that is one of their
strength because they know how exactly to generalize
their acquisition well into their main business. Now let's talk about
couple of weaknesses. Now, one of the business
model of Amazon that is e-commerce is easily imitable. I mean, you can
easily duplicate it. Like let's say if you want it to start at e-commerce brand, then you can simply create
a store with the help of Shopify or Woo Commerce. Or you can use any
e-commerce store builder. And you can create
your own website and your own e-commerce store. Now I understand that
it is typical to duplicate the network effect or it is not easy to drive
traffic on your website, but it is super easy to
create your own store. And that's why you can easily duplicate the e-commerce
business model of Amazon. In fact, in some countries they have a lot more competition, especially in Southeast
Asian countries, there are multiple alternatives. Amazon, like Flipkart
and other platforms. Also one of the
weaknesses is that Amazon doesn't have any
control on their seller. Obviously, Amazon have a
lot more negotiation power. So normally when these sellers sell their product on Amazon, in that case,
amazon charged them around 25 to 30% commission. And that will include
the logistic cost, handling the packaging and the reverse shipment
and all of that. But still, I guess 30%
is a very huge amount. And that's why many sellers also don't really sell
their product on Amazon. Apart from that, they are also making losses and
couple of areas. Although their Cloud
computing business is doing really
well, that is AWS. But I guess they are making a huge losses in the
e-commerce business. Let's talk about the
opportunity. Now. One of the opportunity that
Amazon has recently started focusing on is the
omni-channel expansion. Now, omnichannel is when you are expanding into more
than one channel. They have recently started expanding into the
physical store. And they are somewhat
competing with Walmart or LDs. Also, they can do
more acquisitions, So that is one of
their opportunity. I mean, if a company is up and running and
if they are doing good and they are somewhat overlapping with the
business of Amazon, then most rapidly Amazon will try to acquire
that company. Also, one of the
opportunity that they have is to attract
the Netflix customer. And they are doing that with the help of
Amazon Prime umbrella. So just take a Prime membership, you will get Prime video. You will get prime music, one day delivery and
so many other benefit. I guess that's their
value proposition. They are trying to grab
a little market share in case of OTT platform. Or maybe they are
trying to do that. Not really sure how much
will they succeed in this. But these are all the
opportunities that Amazon hat. Let's talk about threats. So controversies related to the diverse of the
founder of Jeff Bezos, related to him quitting
as a CEO and joining the space race with Elon
Musk and all of that. And what are their threat is
aggressive competition from some of the other
e-commerce players, especially in Southeast
Asia or in Asia in general. And also a brand can easily. One of the major threat
is that other brands can easily duplicate
this business model, especially the e-commerce
business model. So these are all the strengths, weaknesses, opportunities,
and threats off Amazon. Now, let me give you a small
assignments so that you can practice what you have
learned from this video. So you have to do a swat
analysis of Google. You can download this PPT file and you can complete this
assignment by yourself. So that's all for this video. I'll see you guys
in the next one.
14. What is Holistic Marketing: Hey everyone, My
name is now deep. And in this video, we will discuss about
holistic marketing. Now, holistic marketing
is the integration of value exploration,
value creation, and value delivery activities with the purpose of building long-term mutually
satisfying relationship with all the key stakeholders. Now I know this definition
may sound confusing. So let's understand
the meaning of holistic marketing with
the help of this diagram. So in short, holistic
marketing is nothing but the management of all the important key
aspect of the business. In a single line. Holistic marketing is the marketing management
across different department. So if we discuss about
relationship marketing, then in your business, you might be having these different distributor
or supplier. And in that case, you have to build a
relationship with those people. Then we have
integrated marketing. So in your business, if you are selling across
different distribution channel, let's say you might be having an e-commerce website or let's say if you
have offline store, in that case, how do you
make sure that you have a constant communication
across all your sales channel? And that's your
integrated marketing. Then we have
performance marketing. So as a brand, you
might be running these marketing campaigns or ad campaigns across
social media. So how do you make sure that
you have enough revenue, enough sales from those
marketing campaigns? And you are doing all
those things ethically. And how can you build a community around
all those things. So that's your
performance marketing. Then we have internal marketing. And as a company, it is super important
to make sure that all your employees are also aligned with the vision and
the mission of the company. So let's break down all these things are
in the next slide. Let's start with
relationship marketing. Relationship marketing
aims to develop deep and enduring relationship
with all your stakeholder, like your customer employees, marketing partners, like your
distributor or supplier. And finally your
financial community. Like your shareholder, your
investor, and your analyst, who are talking
about your brand, or who are analyzing the financial health
of your company. Now, let's pick a small example because I love taking example. And I guess example
can also help you understand the topic
in a much better way. To understand
relationship marketing, Let's take an example. I'm going to take an example
of a company like Pepsi. So let's talk about the
distributor of Pepsi. And Domino's Pizza is the
biggest distributor of Pepsi. I mean, they have exclusive
tie up with the brand. We also call this as a
strategic partnership. And in Domino's Pizza, They are only allowed to
sell PepsiCo product. And these people are
there distributor or channel partner,
whatever you call it. Then we have partner. So PepsiCo have multiple
product like leaves, or they are also into
cookies and odds. So their partners, let's say a farmer is the
partner of PepsiCo. Normally, these brands have
tie up with these NGOs or community members and they will buy all the potato these
farmers are producing. These people are their partners than they have supplier like Walmart who is helping
companies like PepsiCo and distributing
these product to the end customer. So sometime if PepsiCo end up producing more
of a certain product, walmart will give discount and push that product to
the end consumer. So Walmart will do
volume purchase and they will push these
product to the end consumer. And that's what your relationship
marketing looks like. If you work in a company
like PepsiCo, in that case, you have to make sure
that you are constantly building stronger relationship
with your distributor, with your partner, supplier, or other stakeholders like
investor or employees. And that's your
relationship marketing. Let's talk about
integrated marketing. So let's say if you are
working for a company like Warby Parker or lend Scott, these are D to C IVR brand. And they have these
different sales channel. So if you look at a
company like Warby Parker, they might be having an
offline store near you. Or you can also order
your spectacles online. That's why they have a
try at home program. And you can also use their
online app where you can use the augmented
reality technology in order to try out these
spectacles on your fees. So if they have all these
different sales channel, then they must deliver a consistent experience
across communication, product, and service
to make sure that all of these
things are intact. That means whatever quality you will get in the offline store, you will get the
exact same quality at your home and in
the app as well. And the marketing or the
communication across all these different sales
channel will exactly be seen. And that's your
integrated marketing. Third one is your
internal marketing. And marketing. Activities outside
your organization is as important as
inside because it makes no sense to Promise
excellent service before the company's stock is ready to provide those excellent service. And that's why internal
marketing is super-important. Now, when we talk about
internal marketing, we are basically talking about how do you communicate
goals, aims, and objectives with all
of your team member, or let's say all
of your employees. So in that case, we will discuss about
culture, staff motivation. We will do couple of training. We also have to establish
a reward program. Then we have internal marketing. And if you look at a company, marketing activities
outside the company is as important as insight. Because in reality it
makes no sense to Promise excellent service before
the company stuff is ready to provide. And that's why we have to
focus on internal marketing. Now, when we're talking
about internal marketing, we are basically talking about goals, aims, and objectives. And that's why in
internal marketing, you need to make sure that
your employees are motivated. You are giving them
proper training and SOPs, also known as standard
operating procedure. And you're also rewarding
them time-to-time. And you're also ensuring
that they are maintaining a quality standard and
they also have a culture. I mean, that's the
responsibility of a Chief Human Resource
Officer in your company. So that's your
internal marketing. Because you have to do couple of marketing activities
inside your company as well. In the end we have
performance marketing. And performance
marketing is all about the understanding of financial
and non-financial return. So performance marketing is all about finding a
sales channel and optimizing the budget for these different social media
channels or sales channel. And in the end, figuring out
the ROI of the business. And optimizing on these
three parameters. You can also go deep into performance marketing
by looking at CPM, CPC, CPA, and LTV. Now, we will not
discuss about all of these things in this video, but I have a dedicated course on all of these SAS metrics, or I would say these
digital marketing metrics. And that course we had
a discussion about course formulae or
cost-per-click, cost per action and customer lifetime value and
customer acquisition cost. Will not discuss about
these things in this video. And that is all about
your holistic marketing. Now, I have a small
assignment for you. And in this assignment
you have to write about the holistic marketing of
a company like Starbucks. And in that case, you can cover things like
relationship marketing, integrated marketing, performance marketing,
and internal marketing. And you can refer to this video and you can take some help. And you can complete the
assignment by yourself.
15. What is product life cycle ?: So I was a big Nokia, and Nokia used to be one
of my favorite brand. So at the starting of my career, I bought their first phone, that was Nokia 11 double zero. Then I purchased Nokia 3110, then Nokia N9, T7. And I remember I also bought a Windows phone somewhere
around 2015, 2016. So I was a big Nokia fan. But the reality is products
like people have life cycles. And that's what we're going
to study in this video. And this video, we'll talk
about product life cycle. Product life cycle is
the four-stage process that a product have to go
through from boat to that. And you can understand
the product lifecycle by looking at this diagram. So on x-axis you have time, and on y-axis you have sales
or revenue of a product. And you can see that you start your journey from
point a and then you go from point a to point
E. Point E is the decline. And after that,
you will have to, after e, You have to either spin-off or you have
to kill the product. So let's start with
process number e, that is the development. So at this process, you are investing a ton of money in developing
a new product. And in fact, Nokia was
also investing a ton of money developing new and
new product for people. And they started off by developing big font so that
people can communicate. So they were investing
a lot of money in developing flip phone. You can open your phone or
slide it like a laptop. So that was the
development process where you invest
a lot of money in solving the pinpoint of your customer and you are developing a new
technology here. That is your stage number one
in the product life cycle. Then the second stage
is introduction. So at this stage, you are building a buzz around the product
and you are creating awareness in the market for that specific product so
that people can purchase it. And that's your
introduction stage in the product life cycle. Then you have stage
number three, that is the growth stage. And at growth stage you are growing at the exponential rate. You are killing
it in the market, and you're generating
massive amount of profit from that
specific product. Now, at this stage, because you have a bigger
market and you may not be able to fill all the
gaps in the market. And this is the best time where you will have some sort of competition or some new players were entering into the market. Then we have our maturity stage. Now, all those competitor
or small players who entered the market when you
were growing exponentially, those people have now started
dominating the market. And at maturity stage, you have enough competition in the market and your growth is stagnant and your sales will eventually
decline or stabilize. And in the decline stage, your profits are declining
and your sales is reducing. And now this is the best
time you should innovate new product so that you can create a new market altogether. This is the product
life cycle for almost every single product
that you can imagine. I mean, this is not
just about Nokia, this is about almost
every single technology or physical product
you can imagine. Now, let's understand
product life cycle by looking at Nokia
as a mobile brand. Because, I mean, who else
doesn't know about Nokia? So this will be
super interesting and it'll be easy for
you to understand. So on x-axis you have time, on y-axis you have
profit or sales. Now the fourth stage of product life cycle
is development, where you're investing a ton of money in research
and development. And you're quickly innovating on product and you are solving customer pinpoint at
this specific stage in the product life cycle,
that is development. Once you have launched
your product, then this is the
introduction stage where you are introducing a
new product in the market. Now, Nokia introduced
a new product. I mean, as far as I remember, back in 2010, I mean, Nokia is a very old brand. They had a product in 1995
and in 1980s as well. But as far as I can remember, I was the first user of
their first mobile phone. That was 1110. I mean, it was a small mobile phone. Then they started
launching couple of more product and that
was their growth stage. So at this stage
they were launching products like nokia 3110, Nokia N9, T7 series. Then they started
innovating a lot. They started investing
a lot more money in research and development. And then after the growth stage, they started launching
multiple products. So they had a flip phone. They were launching our form
that looks like a laptop. So that was their
maturity stage. And this is somewhere
around 2,014.2013 ish. And in the end, they started the brand
was at the peak when they had the n series or
the ECUs in their category. But after the
Microsoft acquisition, their sales started declining. And at that point of time
they had an Windows Phone. And in fact, I bought this
Windows phone as well. Although the UI was super
nice for these windows phone, but somehow they were not able to adapt well in the market. And developers were not that interested in developing apps
for these windows phone. And because of that, Microsoft had to kill the
operating system. And the soul, the
smartphone division, or I guess the whole company to a Chinese brand or
a conglomerate. I don't exactly
remember the name, but that is the lifecycle
of Nokia mobile brand. They started off with
introduction stage, then they were growing at exponential rates
somewhere around 2010. Then they were innovating really fast and they were launching
the school product. You can flip these smartphone, you can fold them like a laptop. Then their sales started declining because they
were not able to convince enough developer
to build apps for their platform that has
been dose before Windows, they were using operating
system called Symbian. I mean, a lot of people
might not be aware of that, but I was a big Nokia
phone back then. But that's a product life
cycle of Nokia mobile brand. I don't know why I'm so
excited about Nokia, but this is a really
interesting way by which I can help you
understand how exactly does a product life cycle
looks like for a product. Instead of Nokia, you
can also take couple of more examples of different
brands like Ford. And that's why Let's understand about couple of things
about product life cycle. So if you look at this product life
cycle and if you look at sales and profit, when you are
developing a product, that means at the product
development stage, you're investing a ton of money in research and development. And at that point of time, you don't really have
enough sales and you are investing some of your profit into research and development. Now once the product is ready, then you have to invest a lot more capital so that you can manufacture
the product. And at the introduction stage, you have to invest
a lot of money in manufacturing and
distribution of the product. And after the initial launch, once your product hit a
certain stage of growth, in that case, you will
start generating profit. So you can see from
this diagram that, that the product is
generating good amount of profit at the growth stage
and at the maturity stage. And the profit will
start declining once you reach to
the decline stage. So Nokia invested a ton of capital in the product
development stage. They were doing a lot of
research and development. Now, once they
launch the product, then they have to do
manufacturing and distribution. So they have to
bear more losses. Once the product is there in the market after
the initial launch, they were generating
massive amount of profit. And these profit will
stagnant for a while and they will decline once
you reach the decline stage. So that's your sales and profit in the product
development lifecycle. If you want to understand
the competitive landscape in the product life cycle than at the R&D stage or at the
introduction stage, you have the monopoly in
the market because you are the only player in the market who is
selling a smartphone. But once you reach a certain inflection point in the growth stage than
competition started coming. Because now enough gaps in the market that these
competitors can fill. So the code for innovative
form will look like this. First, you will innovate a lot. You do a ton of research
and development. And once you are generating
enough profit than the innovation or the
experimentation will go down. Now the competition code
will look like this. So once you are at the growth
stage than the competition, co, will increase exponentially. And obviously, once the
market is mature and enough, people are using a
specific type of product and the
competition will decline. So if we talk about
the introduction, growth, maturity,
and decline stage, then at the introduction stage, you have some innovative idea until the competitor
started copying. Then you have your growth stage. Where all of these commutators started replicating your product or they are developing a new feature on the existing
product by their own. Then you have the maturity
stage where the product has standardized or
innovative product have now become a commodity. Now these competitor or company have to work on
cost or economies of scale so that
they can produce the same product at the
cheapest rate possible. And the term for that
is economies of scale. And probably we will discuss
about economies of scale and economies of scope
in the coming videos. And in the end, we have a decline stage where the
competition is increasing. And the one that has the
minimum cost to produce a product will eventually win the market when you don't really have
other brand advantage. So that's all about the
product life cycle. Let me give you a
small assignment so that you can practice what you have learned
from this video. I'm attaching this assignment
and you can download and complete the assignment of
product life cycle for Ford.
16. What is Value Chain Analysis?: Hey everyone. In this video, we will talk
about value chain analysis. So our value chain
analysis will describe all the business activities it takes to create a product
from start to finish. So things like designing production distribution
and so on. Now to understand how a business create value will be using this specific diagram. So let me take the
laser pointer. Now if you look at
this specific diagram, you have some
primary activities, things like inbound
logistics, operations, outbound logistics, marketing
and sales and service. All of these are
primary activities. Then you have some
supporting activities. So things like form
infrastructure, human resource management, technology development,
and procurement. These are all the
supporting activities. And then as a company, you are giving out some
value to the customer, and then you're also generating some profit and these
are all your margin. Now, the meaning of doing a value chain analysis is
to explain the relationship between these five
dynamic forces that can affect the
industry performance. Also, with the help of
value chain analysis, you can assess the structural attractiveness
of analyst industry. So let's understand about
this specific diagram. Let's start by
understanding about what exactly is this margin. So as a business, you are creating some value. And if you subtract your
cost of creation of value, that's your margin or profit. So let's understand about
value chain analysis. Now, we will first start with primary activities
and then we will understand about
supporting activities. And as you know, the amount of value
that you are creating. If you subtract the cost of
creation, that's your margin. Let's start with
primary activities. Now, the first primary
activity you do in a business is to buy all of these raw materials so that
you can produce a product. So inbound logistic means
all the raw material or all the products that are
coming into your warehouse. That's your inbound logistic. To manage inbound logistic unit, a procurement team,
you need to make sure that you have
real-time inventory data. You also need to
make sure that you have a supply chain
control tower where they can see the location of all your
distribution facility. You need to have some trucks for transportation
these warehouses, and you need people to
handle the material. And all of this is a part
of inbound logistic. In fact, in some
companies they have a dedicated team
or department for inbound logistic and their
responsibilities to make sure that everything is happening normally in inbound logistic. Apart from inbound logistics, you have to do some operation. And this will include
day-to-day operation, whether it is
manufacturing a product or if you're a distributor than storing the product in your warehouse for
a period of time and then shipping it back to
a retailer or to a customer. And these include all
of your operation. So for operation department, they need to have access to the real times sales and
inventory data so that they can supply you the amount of product you need
in the coming week or in the coming month. And the operation team have some standardized
model in their system. Then you have your
outbound logistics. Outbound logistics is when the product is going
out of your warehouse. So let's say if you are a distributor of a specific
company, in that case, you might be shipping
some product every single week or every single month to
a retailer so that, that person can sell that
product to the end consumer. So that's your
outbound logistic. Now, their main role is
to do order processing. They are also delivering
the product to the retailer and delivery and processing is
their main function. And companies have special
outbound logistics department or team to handle this. So we are generating
value as a business and that's why we have to understand the core
pillars of that. So inbound logistics,
operations, outbound logistics,
marketing and sales. These are all the pillars
of your business. In the end, you have your
marketing and sales. And as a company, I'm sure that you are
focusing on product, price, place, and promotion. So working on pricing, making sure that you have
the right communication and marketing to
the end consumer. You are producing new
product based on their need. And you are selling those
products at low prices. These are all the things done by a normal
marketing and sales team. In the end, you
have your services. Whether you are a hardware
company or a software company, you always have a
customer support or customer service team will ensure that they
have the delivery, the installation, the
repair of a product. And anytime they have any
issue related to a product, they can always raise
a ticket or they can always reach out to
the repair center. So these are all the
primary activities of a business in order to create
value for the end consumer. So from procurement, that is your inbound
logistics to operation, to outbound logistic,
which means shipping out the product
from your warehouse to marketing and
sales and to service. These are all your
primary activities. Now, in order to perform
these primary activities, you need some
supporting activities. At first, you need a procurement department who can ensure that you have the form material or semi-finished good in
your warehouse all the time. If you are someone who is
manufacturing a product. So the procurement
department may need a real-time inventory data. They need to communicate
with supplier and they need to purchase supplies and
materials. For that. Normally companies
use our ERP software like SAP or Oracle. Now, in order to make sure that you have a proper
implementation of these ERP solution and you are using technology
in your business. In that case, you need a technology department for
technology development. So these people will
make sure that you have integrated
supply chain system. The all the department have real-time sales
information so that they can plan their
manufacturing AND operation. Then you have human
resource management. Human resource management
team will ensure that they are helping their employees in
professional development. They are building a strong
relationship with them. And then they are doing
performance appraisal based on a proper evaluation
parameters they have. And then obviously
the main role of human resource management
is to make sure that your salary is
credited on time. Because that's the
most important thing. Then in the end we have
formed infrastructure. I think I should
have covered all of the supporting
activities from top to bottom instead of going
from bottom to the top. So form infrastructure
means that you have a good management
team in your company. You are closing all
your books and you have a good capital
inflow in your company. That means you have
a good cash-flow and making sure that
you don't really have any legal issues and maybe planning for other
normal day-to-day operation. So that's the underlying
foundation of your companies. And that's how a company's
able to create value. They have to perform all of these five primary activities. And for that, they need all of these supporting activities,
department or people. And that's how they
are able to create value and profit or margin.
17. Value Chain Analysis of Tesla?: Now I know that this value chain
analysis may not be very much useful
for a lot of people. So let's try to implement this specific concept to
solve a real-world problem. So let's say you want
to work in Tesla. In that case, you
first have to do a value chain analysis on how exactly a company is creating value and also
generating profit. For that, you can do a
value chain analysis and you can use this template. Obviously, in though,
last few minutes, I'm gonna give you
an assignment. But before that, let's
understand about the value chain analysis
of a company like Tesla. So we will go from
top to the bottom. At the top, you have all your
forms, primary activities. And at the bottom you have the opportunities of
reducing the cost. So let's start with firm's
primary activities. So if you look at
Tesla is a brand, they manufacture
these electric car. Now if you're a car
manufacturing company, then you will first
start with design and engineering to make sure that you are building a
high-quality product. Now, once you're done
with your design and engineering and obviously
it's ongoing process, then you will do
purchasing material and component from all of
the suppliers to have. Once all those components are there in your
manufacturing facility, then you will do assembling. Once the car is ready. After that, you will do
testing and quality control. And once your product is
completely ready, in that case, we will do some sales and
marketing and finally, distribution on dealer support. So these are all the
primary activities you have to do as our electric
car brand or as a car brand, then you have your total
cost and importance. So over here we will write about the total cost of doing
this specific operation. Now, you can write
the monthly cost or yearly cost on
this specific area. But the main purpose here is to understand Fitch activity
is costing you a lot. And which one can you
outsource to one of your partners or
strategic alliance? So I was not having enough
time for this video, so I was not able to pick the exact number from the
financial statement of Tesla. So these are all
the random number. So let's say they
might be putting $164 million for design
and engineering. And they might be putting to 30 million dollar for
distribution and dealer support. You have to mention all of their capital expenditure across all of these different
primary activities. Then you have your cost driver. That will help you
understand how they can reduce down the cost over
a long period of time. No cost driver will help you understand which
of the process is costing them a lot and how can they reduce
down the cost structure? Now if you look at
Tesla as a company, they don't have a
bunch of models. They just have four to
five different model. And that's why they are not
investing that much off. Capital in design
and engineering. Then they have purchasing
material and component. Now the price of
these components and material depend on the
amount of your purchase. So if you're purchasing in very large quantity,
in that case, you would be able to get the exact same product
at a much cheaper price. So if their supplier is
present in United State, in that case, they
might be purchasing those components
at a higher price. But if their supplier
is theory in China than they would be able to purchase the same component at a cheaper price.
Very obvious. Then they have assembly. So now the cost driver in case of assembly depends on
the scale of plant, the capacity utilization
and the location of plant. Then they have
testing and control. I guess they have a list of
more than 800 different types of tests that they do before releasing a product
to the public market. Then you have your
sales and marketing. And I guess they invest very less capital in sales
and marketing because Elon is their brand ambassador or their chief marketing
officer as well. Apart from being a CEO, these are all the
cost driver across design and engineering to
distribution dealer support. Then you have to write about the link between
these activities. So let's say if you have a high-quality
assembling process, just like Tesla, where robots
are assembling your car. In that case, you can increase the cost
of quality because these machines have some SOP and they don't really
work like human, where if you give
more work to human, the quality of the end
product will reduce. Also they have some
Gigafactory located in China. So that's how they are able to assemble couple of products that cheaper
price because, because the plant is
near the cluster of supplier and that's how they are reducing on purchasing
and distribution cost. Also, Tesla have fewer model and that's how they are reducing on assembling coast because
they don't really have to configure these
assembling machine. Every single quarter, then you have your opportunity
and reducing cost. If you just sell one model across all these
different countries. In that case, you'd be able to reduce down your cost structure. And that's very obvious
because in that case, you will be producing just one single product and then you are selling that product in
almost every single country. Also, there are some
components that you can manufacture
inside your company. So if Tesla as a company, is able to
manufacturer couple of component inside
their Gigafactory. In that case, you'll
be able to get rid of these few supplier and you can also produce those
products faster. So that's the value
chain analysis of a company like Tesla. Now, you can invest some
time and you can complete this assignment by doing a value chain analysis
of a company like Apple. And you can write about the
firm's primary activities, the total cost and importance, all the cost drivers you
have in the company. And then you can discuss
a bit about link between these primary activities and all the opportunities
of cost reduction. You can invest some time and you can complete this
assignment by yourself.
18. What is a business Strategy ?: Hey everyone, My
name is now deep. And in this video, we're going to talk about
what exactly is a strategy. So have you played
any of these games like Clash of Clans or chess? Or maybe you have read a
book like The Art of War. All of these things are
based on a strategy. Even before you
start playing chess, you have to look at
the other person. And while you're
playing the game, you have to constantly
mixed strategy. And maybe you have to predict the next move of
the other person. And that's why I asked
you that if you have played any of these
schemes or if you have read a book
like The Art of War, then you already understand how the other person is making a
strategy based on your Move. Now, if you look at Clash
of Clans as a game, The objective of this game
is to build your village. And then you have to design your bees and you
have to defend it using the resources
that you have gained by attacking other people's
religious groups. And all of these things
are real example of how do you make
strategy as a human being. Now, just like these games, you also have to make some business strategy
as a business executive. Because I'm sure after
watching this course, you'll be working
in some company, making either a
business strategy or working with the
operation team. Strategy is a well-defined
roadmap of our organization. And the objective of
strategy is to maximize the organization strength and
achieve better performance. And while you are doing this, you also have to build a
long-term competitive advantage. Now, in this specific
strategy definition, you have to work on
three important things. You have to figure out the
strength of our organization. For that, you can do
things like swat analysis. Then you have to make sure that the organization is having
a better performance. And we'll talk about performance
in the coming video. And in the end, you have to build a competitive advantage. And we also have a dedicated section on
competitive advantage. When we talk about
business strategy, then you can implement the business strategy,
a three-level. You have your corporate
level strategy, then you have business
level strategy, and finally the functional
level strategy. So let's understand all these three different
level of strategy. With the help of business
strategy pyramid. The business strategy must plan, is implemented by the
management team to secure a competitive
position in the market. So the way you build a
competitive position is by making sure that you
have efficient operation. You are working on
customer satisfaction and you have some
desired business school. We have to work at three-level
to make sure that we are implementing strategy at
all the level of business. So we have to figure out a
corporate level strategy of business level strategy and
a functional level strategy. Now if you're starting
your career as a MBA graduate, in that case, there is a very high chance
that you'll be working at making functional
level strategy as you progress in your career. Let's say if you have five
to ten years of experience, then you'll be making
business level strategy. And if you are
someone who have 15, 20, or let say, 30
years of experience, in that case, there's a
very high chance that you will work in making
corporate level strategy. So a business have these three different level
and we will discuss about these three concept
with the help of this strategy pyramid. So as the name suggest, business level
strategy is related to a business or a
vertical, or a product. So in business level strategy, you will answer questions like, how do we compete as a brand and how do we gain competitive
advantage as a company? So in business level strategy, you normally figure out different ways by which you
can improve your product. You can adjust your pricing
based on the competitor. All of this is a part of
business level strategy. Then you have your
functional level strategy. And remember, business
level strategy is a work that is done by people who have almost three to five
years of experience. So those people exactly
understand all the competitors, how those guys are selling
the product into the market. Then we have the
functional level strategy. So if you're starting out your career than there
is a very high chance that you will be working at making these functional
level strategy. So these functional level
strategy often aim to improve the effectiveness
of a company's operation. And these are
normally developed by the first-line manager or the supervisor to solve the functional areas
like marketing, production, human
resources, and development. So if you're working in a warehouse or let's say
in a production line. In that case, you
will try to solve the day-to-day problem that you and your other
colleagues are facing. And these are all
functional level strategy that our individual employ a first-line manager
or supervisor make. In the end we have
corporate level strategy. And the strategy are normally
made by people who have at least 20 to 25 years of experience and who are at the CXO position of the company. So corporate-level strategy is normally made by
the top management. So in corporate level strategy, they will think about
mergers and acquisition. How they can build a
new business unit? Or do they need to shift their manufacturing facility
to a different location? These are all your
corporate level strategy, which are made by people in the top management or
maybe CXO level people.
19. Sumsung's Corporate, funtional and busines level strategy: Now I know that some of you may have a question in
mind that now the power we're going to
cover this section and these concepts related to business level strategy
in this course. So I have a small
diagram for you so that you can understand how we will be covering these different concept related to business level strategy. So for internal analysis, we have two framework. We have a value chain
analysis and a Brio model. And as the dome suggest
an internal analysis, we'll be analyzing everything
about that company. Then we have some external
analysis framework. And in that, we will talk about Porter's five forces model
and PESTEL analysis. Now once you have this framework
ready for your company, then the top
management can move on the strategy formulation
by using this framework. So once you are done with
all these framework, then we will discuss
about value discipline, Blue Ocean Strategy, and
Porter's generic strategies. And we'll talk about all of
this and the coming video. Let's understand the
business strategy pyramid. And the first part of that is your functional
level strategy. If you're planning to
work in corporate, then you will start
your career making these functional level strategy. So functional level
strategy can be defined as the
day-to-day strategy, which is formulated to assist in the execution of corporate
and business level strategy. So if you are
starting out your job working in a company,
in that case, you will work as
a manager in one out of these five different
department in a company. So let's say you might work as a marketing manager in
the marketing department, or a finance manager or a financial analyst in
the finance department, or maybe a human
resource manager, a production supervisor, or research and
development manager. In that case, you
might be working in any of these five
different department. Let's say you decided to work in the marketing department and you have a good understanding
about marketing. And in that case, you'll be making the functional
level strategies like, how do you figure out the right marketing
mix for your product? And you will be doing swot analysis and
concentrated marketing. On the other side, if
you are working as a financial analyst or as a finance manager, in that case, you will be dealing with day-to-day operations related
to closing the books, creating budget for these
different department. How can you allocate funds to different departments
AND operation? On the other side, if
you get a chance to work as a human resource
manager, in that case, your responsibilities
are recruitment, development, motivation, retention of employees,
and industrial relations. In production,
you'll be working as a supervisor whose main
responsibility is to make sure that you enhance the quality of the product by making sure that the high-quality material is being used in the
manufacturing facility. And all of your colleagues
or employees are working. In the end you have your
research and development. And it's very obvious that in this department
will be working on developing new product and how exactly can you
innovate things faster? Now I know that the story is boring and that's
why I'm not going to discuss more about
business level or corporate level
strategy in this way. Rather, I'll be using an example so that
you can understand a functional level of business level and a
corporate level strategy. So let's take an
example and let's understand about business
strategy pyramid. If you look at a
company like Samsung, Samsung is a conglomerate
consisting of multiple SBUs. Sbus stands for
strategic business unit. And these SBUs have
diverse product portfolio, ranging from smartphone
to cameras to tv, microwave, and refrigerator. So each of these
product or SBUs need a business strategy
in order to compete successfully within
its own industry. So at the top, Samsung have a corporate headquarters
that is in South Korea. And from that corporate
headquarters, they are managing all of these different
strategic business unit, also known as SBU's. They have a different
strategic business unit for silicon component. They have a different strategic business unit for smartphone. And they have a different
strategic business unit for home appliances. If you look at their strategic
business unit that is related to the manufacturing
of the silicon component. Now, just to give
you a perspective, almost 70 per cent of all smartphone or LED display are manufactured by Samsung. So whether you use
a smart phone from brands like Apple, 1plus, apo. All of these, all at
display are made by Samsung and they are the market leader in
the OLED displays peas. Similarly, the
manufacturer, majority of the RAM memory chip of
all the smartphone brand. And Apple have our
strategic alliance with a company like Samsung. Now, this may sound a little
counter-intuitive because these companies fight a lot on the market share of
their smartphone division. But they have a mutual benefit
on the component division. At the top, you have your
corporate level strategy. Then you have your business
level strategy related to managing these
strategic business unit. And then you have your
functional level strategy in order to manage things
like manufacturing, finance, marketing, and
research and development. In the next video, we will discuss about how exactly as a brand
you can figure out a strategic management
process and how you can start implementing
the strategy. That's all about this video. In the next video,
we will discuss about strategic
management process.
20. Components of business strategy: Hey everyone. In this video, we'll talk about the different components
of our strategy. And to be specific,
in this video, we'll talk about the components
of strategies treatment. Now, there is a famous book
written by Stephen Covey and the name of that book is Seven Habits of Highly
Effective People. In that book, Stephen Covey said that begin with the end in mind. Now, this statement
reminds me of the different components
of a business strategy. Because as a company, you need to focus on achieving its long-term goal
and aspiration. Before even attempting
to accomplish anything. You need to think in terms of decades and not in
terms of years. Now, if you look at a
strategy statement, it has four different component. You have your strategic intent, then you have a
mission statement, then you have a
vision statement. And finally, goals
and objective. So let's start with
strategic intent. Now, strategic intent
will help management to emphasize and concentrate
on priorities. So you'll be inspiring people with your vision and
your mission statement. And we'll talk about your vision and mission statement
in a minute. Then you will be encouraging individuals and
team participation. And then you will be utilizing
your intent to allocate resources to all of the Strategic Business Unit
you have in your company. So when we talk about the component of
strategies treatment, the three most
important concept you need to understand is
your mission statement, your vision statement, and
your goals or objectives. So let's understand about
the mission statement first. So a mission statement describes what exactly your
organization does, home it serves, and what
makes an organization unique. Now when I'm saying what
exactly organization does, these are all the present
capabilities the company have. Now, what I'm talking
about home, does it serve? That means all
these stakeholders, like your investor or your customer and all the
channel partners you have. And finally, what makes an
organization unique means? What is the reason
for existence? So if I'll give you a simple
example to understand this, if you look at the
mission statement of a company like Walmart, their mission statement
is to give ordinary people the chance to buy the
same thing as rich people. So basically they wanted to democratize the
retail for everyone. And that's their
mission statement. Now let's talk about
the vision statement. A vision statement will help you understand where exactly as
a company you want it to go. So our vision is a potential to view things ahead
of themselves. Now, when you look at
the vision statement of a company like Walmart, their vision is to become a
world leader in retailing. Now, let's discuss about goals. Now, goals are more
prominent in concrete, and goals are all the
desired future state the organization
wanted to achieve. So these are all the
different components of a strategy statement. Now I understand that you
might be a little confused between a vision statement
and mission statement, what exactly goals
and objective means. But in the next video, we'll go deep into
vision statement. How exactly does accompany set a vision and
mission statement? And how do they use goals and objective to go close to their mission and
vision they have. So let's discuss about all these individual
component of a strategy statement.
In the next video.
21. Vision Statement of a company: Hey everyone, my
name is not deep. And in this video, we will discuss about
mission statement, vision, goals, and objective. But before we discuss
about these things, Let's understand why do we need these things
at the first place. So in the last video, we were discussing a lot
about the corporate level, the business level, and the
functional level strategy. So your entire
corporate level and functional level strategy will work towards achieving
this vision, mission, goals, and objectives. And that's why we need to
understand this topic. Because if you look at all the senior executive
of your company, whether he is a CFO or
CEO of the company. They are inspired by these
vision and mission statement. And that's why we have
to understand about these vision and mission
statement so that you can inspire all of your team members and
employees so that they can choose a common goal instead of going into
random direction. So to understand
mission, vision, and goals, let's look at
this specific diagram. So our vision
statement will paint the future in your company
for next five to ten years. Anytime you join a company, you may find them having a vision statement in their
office or on the wall. And if you look at that
specific vision statement, you will find that those
people are painting the future of the company
in next five to ten years. And that's their
vision statement. I mean, as a company, they wanted to go to
that specific point because that's their vision. Then you have your
mission statement. And mission statement will help you understand
fundamentally, the reason why the
company exists today. So what they do exactly
at this point of time and why they
are doing that. And that's your
mission statement. Now, in order to go from this mission to that
specific vision, you have to have some
goals and objective. These goals are the future
state of an organization. That means you normally
set the smaller goal and you will achieve these goals so that you can reach
to your vision. So you start with your mission. That's your
fundamental reason why you exist today as a business. And you have to achieve your vision in the next
five to ten years. And you do that by
setting smaller goals and achieve those goals by
having these objectives. So let's discuss about
vision statement first, and then we will discuss about mission, goals and objective. So our vision statement
paints a picture of where you're going and why you want to go
there as a company. And as you know, our vision
statement normally paints the future of your company
for next five to ten years. Let's say if you are
someone who wanted to understand about the
vision statement, or let's say if you are
working with the executive in order to meet the vision
statement for a company. In that case, you
have to understand two core pillars of
a vision statement. Where, and why. So you have to ask yourself, where are you going
as a company? And what does success looks like in the future
for your company? Now let's understand
these two points with the help of one example, because I love giving example. Let's say you're starting out your career working
in EV company, then your vision statement
will look something like this, that your company, XYZ, wanted to be a leader in the manufacturing of
electric vehicle. That's your vision statement. That means your main
aim is to become a leader in the manufacturing
of a electric vehicle. If you look at this
vision statement, you will realize that our vision statement is
normally short and brief. It is written in
simple language. That means it doesn't
have any jargons or any complicated word. There is hard for a normal
person to understand. It is crystal clear and it should complete all the
aspect of your business. If you look at this
vision statement, they want to be a market leader in the manufacturing
of a electric vehicle. So they have
specifically highlighted their position by doing
something in a specific segment, leader in the manufacturing
of electric vehicles. Then it is also
non-ambiguous and non-conflicting and it should
motivate the employees. So that's your vision statement. Now this vision statement fits really well for a
company like Tesla, but will not pick a company
specifically for this video. But let's talk about the
mission statement now.
22. Mission statement of a company: So a mission
statement talks about the fundamental reason why
you came into this business. It will help you
understand about the purpose for existing
into the business. Now if I give you a
small example than, let's say a company
like XYZ wants to make the most compelling
car of 21st century. That means, as a
company you wanted to create most compelling car. That's your mission. I mean, that's the fundamental
reason why you exist today. You wanted to revolutionize the car manufacturing industry. If I combine the
mission statement and divisions treatment, then the mission statement explains the company's
reason for being present. While the vision statement gives its purpose
for the future. These two mission and the vision statement will
defines the overall future, or I would say the overall growth strategy of any company. Now, let's talk about the
features of a mission. A mission must be
feasible and attainable. And it is possible for a
company to achieve it. Also, it should be
clear enough so that action can be
taken by the people who are working in the company or the senior executive
team can work toward achieving this
specific mission. Also, it should be inspiring, which is obvious
because if it is not inspiring management
staff and people, then there's no
purpose of having a mission statement than it
should be precise enough. Which means it should
neither be too broad for a person to understand
or know to narrow. It should be unique and distinct so that it can leave an impact in
everybody's mind. Also, it should
be analytical and it should analyze the key
components of your strategy. And in the end, it
should be credible so that all stakeholders should be able to believe on omission that accompany
wanted to achieve. These are all the futures
of mission statement. You don't really have to
remember these features, but I was just covering these features in
case if you end up working with a senior
management team and writing about the mission, the vision, and the
goals of a company, or let's say a startup
if you are creating. Now let's pick a company
because I love giving example. And let's look at the vision and the mission
statement of a company. And after that, we will discuss about the goals
and the objective. So let's pick Tesla Motors. If you look at the vision
statement of Tesla, than their vision
is to accelerate the world's transition
into sustainable energy. If you look at their
mission statement than they want to create the
most compelling car of 21st century by driving the volts transition
to electric vehicle. Nephew closely absorbed
their vision statement, you will realize that this is their five to ten year goal
that they have in mind. But if you look at their
mission statement, then you will
realize that this is the fundamental reason why
the company exists today. Because they wanted to create the most compelling car
company of 21st century. And the do it by driving the bolts transition
into electric vehicle. That's their mission statement. So vision is
long-term and mission is what exactly they want
it to do as a company. Let's look at Google
as an example. Let's look at their
vision statement. The vision statement of
Google is to provide access to the world's
information in one-click. If we look at their
mission statement while they want to organize the world's
information and making it universally
available and useful. And that's their
mission statement. That means why the
company exists today. That's the mission and what they wanted to do in the
next five to ten years. So let's say in 20 years,
that's their vision. Let's look at Amazon
as an example. The vision statement
of Amazon is two, be the world's most
customer-centric company. And they wanted to build a
place where people can visit and find and discover anything they might
want it to buy online. If you look at their
mission statement, well, they strive to offer the
lowest price possible to customer with the best
available selection and at the utmost convenience, That's their mission statement. So I hope after watching
these many videos, you'll be able to
understand about the vision statement
and mission statement. Now let's discuss about the goals and objectives
in the next video.
23. What are Goals and objective?: So from the last two videos, were discussing a lot about the vision statement
and mission statement. In this video,
we're going to talk about goals and objectives. Goal is the future state of
your company and objective or the specific action
that you will take as a company in order
to achieve these goals. And I know this definition
may sound a little confusing. So let me try to simplify this by giving you some example. Let's say as a company, your goal is to increase the
revenue by ten per cent. And you want it to decrease the waste reduction
by five per cent. That's a very realistic
goal as a company. Now let's talk about objective. Objective or all
these specific action that you will take in order
to achieve these goals. So your first objective, in order to achieve the goal, that's your ten per
cent increase in revenue and five per
cent reduction in waste. That you can just add five new customer and you can retain the existing to customer. And you can simply increase
your revenue by ten per cent. So if you're adding
five new customers, let's say if you're selling
a software product. So in that case, you can acquire five new customer and you
can retain to customer. And that's how you'd be able to increase your revenue
by ten per cent. That's your objective
number one, by which you can achieve the
first part of your goal. Now in order to achieve the
second part of your goal, you have your
objective number two. So our goal is to decrease down the waste reduction
by five per cent. Now if you wanted to reduce down to faced by five per cent, you can follow two
different approach. Either you can optimize
the manufacturing process. So in a manufacturing process, waste can happen at
three different stitch. Waste can happen at the
time of manufacturing. So if the raw material is bad, then you may have a
little more waste. Or a waste can also happen when you're
packaging or product. So sometime people end up
damaging those products. So you can optimize the
manufacturing facility. And that's how you'd be
able to decrease down the waste reduction
by five per cent. Also, you can outsource
the process to have byte label manufacturer or
to a contract manufacturer. And that's how you can also
reduce down the waist. So you have a goal in mind, that's the future state
of your business. And you will take these
specific actions called objective in order to
achieve that goal. So in the end, goals are
the desired future state of your business that will make your mission more
prominent and concrete. And your goal should have
the following features. You should have a precise
and measurable goal. And one of the framework
that you can use for a precise and a measurable
goal is the smart framework. We'll talk about smart
framework in the coming videos. But you have to have a
precise call and you can also measure that
specific goal over time. Your goal will always look after a critical problem,
insignificant issues. That means achieving
a specific target every single month or every single quarter
should not be your goal. Your goal should be critical and significant for the business. Also, it should be
realistic and challenging. And again, we have
covered all of these things like precise, measurable, realistic, challenging
in the smart approach. And it should include both financial and
non-financial component. Now let's discuss
about objective. So I assume that you already understand that objective are all the tasks that will help
you achieve a specific goal. And objective will act as
the foundation of planning. And these objectives have
the following feature. You should not have
a single objective. You can have multiple objective in order to achieve a goal. Your objective should be short-term and long-term
and accompany. And your objective must respond and react to
changes in the environment. So they must be flexible. And as usual, your
objective should be feasible, realistic,
and operational. Now personally, I'm not
a big fan of theory, so you don't really
have to memorize these concept or theory. I mean, if you have to work with a senior management or a senior executive
in your company, then you can use these concept. Otherwise, you just need to know the basics of our mission, vision, and goals
of the company.
24. Amazon's Mission, vision and goal: So now you have to complete a small assignment
and you have to think about the vision and the mission statement of
a company like Amazon. Please do not
search this mission and vision statement
of Amazon on Google. Just think about it. From an employee who
works at Amazon. How does vision and a mission statement in
Amazon looks like? I'm in what they
wanted to become a next five to ten years. And what is their
current state of business there next
five to ten year. Ambition is their vision and their current state of
businesses, their mission. So just think about it and maybe then you can continue
playing this video. Because in this video, I will also help you understand about the mission and the vision
statement off Amazon. So just spend some
time and think about the mission and the
vision statement of a company like Amazon. So I hope you have written a vision and a mission
statement of Amazon. Now, your vision or mission statement don't really
have to match with Amazon because the
main purpose of assignment was to make sure that you are
using your brain. You are writing about the vision and the
mission of the company. So let's discuss about it. So the vision statement
of Amazon is to be the Earth's most
customer-centric company. And to build a
place where people can discover and find
anything they want, and they can also buy
those products online. Their mission statement
is to offer customer the lowest possible price and the best available selection and at the utmost convenience. Now if you look at this
mission statement, you will find three
important terms. Lowest price, best selection,
and utmost convenience. And I think you have seen these three important keyword in the previous few videos that Amazon always wanted
to focus on giving you a product at the
best possible price, the different variety
of a product. And they always
focus on shipping the product in this
shortest duration of time. And we had a discussion about this framework in the first
video of this course, that Amazon wanted
to be a faster, cheaper, and a better
alternative to retailing. I'm in offline retailing. Now if you really want
to understand how exactly amazon makes
sure that they have a wider selection and they
are selling their product at the most affordable price and they're shipping
is super-fast. Then you have to understand
about the flywheel concept. Now, if you don't really want to understand this,
it's perfectly fine. You can skip this part, but this is a super
interesting concept that you should know. So if you look at any
company in this world, one of the reason a
company can become successful and it
is evil to target a mass market is
when the company is having the lower cost structure. In a company you have to
have a lower cost structure. Saw that you'd be able to hire enough people to do a
specific operation. So Amazon has a lower
cost structure and that's how they are able to maintain lower prices
on their platform. So if you have lower cost
structure and you're maintaining a lower
prices on your platform, then customer will buy more number of product
from your platform. That's very obvious, and the customer will have a
good customer experience. So imagine if people
are purchasing more number of product from your website or e-commerce app. In that case, the
traffic is good. If the traffic is good, then these sellers will list more and more
number of product. And that's very obvious because
you have more number of people coming to
your platform and they are buying a
ton of product. In that case, more
number of sellers, or we call these as
third-party sellers, will be interested in
selling their product. If more number of
sellers are selling the product on an
e-commerce platform, and that platform have more selection or
variety of product. And if they have more selection
or variety of product, then customer will become happy. This is a vicious cycle. And we call this vicious
cycle as a flywheel. Because once the platform have a wide selection of products
and these sellers are competing with
each other because they wanted to listed on their product at the cheapest
rate possible so that they can get maximum
number of orders. These sellers are
competing with each other. They are listing
variety of product for people and they are selling at the most
affordable treat. And that's why people
are purchasing the product from the platform. And that's the flywheel concept. And this flywheel concept, we'll make any
platform unstoppable. If more number of people are purchasing product from
Amazon, in that case, more number of seller will list their product at the most affordable price
because they are competing with each
other and people are purchasing more
quantity of product. So earlier, if a delivery
guy was carrying, let's say 50 or 100
different boxes at once. Now he's carrying 300 or
maybe 400 different boxes because more and more people
are purchasing from Amazon. So the success of
Amazon is a combination of lower per unit cost because
of economies of scale, they have a flywheel running. And that's why Amazon
is unstoppable. Now if you look at their goals that they have in
their supply chain, is that they wanted to make sure that they have the right kind
of product on the platform. And they're maintaining
the right quantity of that specific product. And they are making sure that the product is being
delivered at the right time. And they also have
these quality check. The seller have to go
through these quality check. And they are also sending to us product at an affordable price. And that's how Amazon is able to succeed in
their business.
25. What is BCG Matrix?: Hey everyone. In this video, we'll
talk about BCG matrix. And BCG stands for
Boston Consulting Group. And before understanding
about this specific metrics, let's understand what exactly is BCG matrix and
why do we need it? If you go back to
the first video where we were discussing a lot about the Samsung
strategy example, where they were having multiple
strategic business unit. So if you look at
Samsung as a company, they have multiple
strategic business unit. So they have a SBU
for semiconductor. Then they have a strategic
business unit for IT solution. They have one for LCD
and visual display, and they have few for smartphone and then
for home appliances. And you can see that from all of these different
strategic business unit. So Samsung as a company, have multiple strategic business
unit from semiconductor to IT solution to LCD
and visually display, to smartphone, and finally
the home appliances. And their most profitable
one is this semiconductor. And I've told you in
that specific video that almost 70 to 80 per cent of all, all at displaying your
smartphone is made by Samsung. So whether you purchase
a smartphone made by Apple or Samsung, or one plus or any other brand, there is a very high
chance that they're all at display will is off Samsung. In order to understand in which strategic business unit or company should invest or divest, we have to understand
about BCG matrix. So VCG is a tool that is used in the corporate strategy
in order to analyze these strategic
business unit or maybe product lines with the help
of these two variable. The number one is
relative market share, and the number two variable
is market growth rate. Let's discuss about these
with the help of a diagram. So as you know, BCG matrix is a tool that is used to assess the value of a
product in terms of their growth and market share. Now, when we are
discussing about growth, that means with the
help of growth rate, you can understand how desirable the product
is in the market. And with the help of market
share, you can understand, do they have any
competitive advantage as accompany or not? Now, BCG is a two-by-two matrix. And let's discuss about
this two-by-two matrix. If you look at the
first quadrant, then if a product of
your company have a high market share and they
have a high growth rate. It's a star product
of your company. If you look at a company like Apple than iPhone is
their star product, then if you have a product
that has a low market share, but that specific product
have a high growth rate, then that's a question
mark product. And a really good
example is MacBook. Macbook is having a
low market share. If you look at the laptop, it as an industry in that case, you will find that almost 80, 85% people have windows as their primary machine or laptop. While less than 15% people
have macOS or let say MacBook. Macbook is a really good example in this caution my quadrant, where they have a product that has a relative low market share, but the growth rate
is quite high. Then you have a product
that has a low growth rate, but a high market share. And a really good example
is a product like iPad. If you look at iPad as a
product, in that case, they have a high
market share because iPad is the category leader
in the tablet category. But they have a low
growth rate because people are not that
interested in buying iPad. I mean, they're
more interested in a smartphone or a laptop. In the end, you have dogs. So if a product is having a low market share and
low market growth rate, then that product will be categorized under
the dog category. And you have to divest from
these specific category. With the help of BCG model
accompanying can easily prioritize in which
product they wanted to invest their money,
time, and effort. Now let's understand about all of these individual quadrant. Because if you look at
a company like Apple, than they have multiple line of product and they wanted to put all those products into all of these
different quadrant. So let's start off
with star code red. So all the products that are
there in this star quadrant, they are most profitable and they have a
large market share. And therefore the company's
advice to invest in these products so that they can generate massive amount
of profit and they can prevent the star product
becoming a cash cow product. Accompany need to
heavily invest in these star product so that they can increase
the market share. And a really good example of
star product in reference to a company like
Apple is iPhone. I'm an iPhone is
the star product. The specific product has high market share and
high market growth rate. So iPhone is the star
product for Apple. Then similarly, you can
look at the star product for different companies
like Microsoft or maybe Adobe and all of
these other companies. And I'm gonna give you
assignment for that as well. Let's talk about the
question mark quadrant. So all the products in the question mark quadrant
hold a small market portion, but they have the potential
to become a star product. And that's why company
might be investing some amount of capital in
these question mark product. A really good example in
reference to Apple is MacBook. Currently, MacBook
only holds around ten to 15% of market share, but they have the potential
to become a star product. So if you look at
MacBook as a product, MacBook holds just ten
to 15% of market share, but that product have the potential to
become a star product. You have to invest
some capital into all the product that are there in the question
mark quadrant. Then you have your
cash cow quadrant. In cash cow quadrant you
have all those products that are dominating a specific
category or a specific domain. And they are generating
good amount of profit. But that specific segment or category is not growing
at the expected grade. As a company, you have
to continue to invest in this specific product
in order to melt the benefit from this
specific category, then you have dogs. And in this quadrant you
have all those product that neither dominate
a specific market, nor they have the potential for a high growth rate product. And that's why it is in the organization's
best interests to divest from these product in order to avoid misuse
of companies. One.
26. Apple's BCG matrix: So now let's understand about BCG matrix by taking an example. And in this specific slide, I'll be taking an example
of a company like Apple. And we'll be putting all the different products of Apple into all these different
quadrant of a BCG matrix. Let's start with
caution mock product. So caution my product have a lower market share
and a high growth rate. So if you look at a product
like apple Watch and MacBook, you will realize that these products have a
small market share, but they are growing
at a faster rate. And these are your
question mark product. If you look at these
star product like your iPhone or air
pod or Final Cut Pro. These products have
a high market share and they have a
high growth rate. And the company
have to put a ton of capital to make sure that they are innovating really
fast in this product category. And these are all
your star product. Then you have couple of
products in the dark quadrant. And I guess I have
some emotional feeling for this specific
product for Apple. I mean, you can't
really purchase it. Apple is not manufacturing
this product anymore. But I hope you got the point. Then in the end you have some product in the
cash cow quadrant. A product like iPad is a
really good example of it, because this specific
product have a high market share into
the tablet category. But, but I guess this category is not growing at a good
market growth rate. So that's why you
can milk profit from this specific quadrant or all the product in this
specific quadrant. Now I know some of you might
be thinking that now we understand what exactly
a BCG matrix is. But how do you exactly know where to invest
or rare to divest? Because that was
the core purpose of understanding about
the BCG matrix. That in a company you have multiple strategic
business unit. And you wanted to
understand that in which strategic business unit you should invest or divest. So now that you understand
everything about BCG matrix, you might be thinking, well, how do we exactly use
this specific metrics? Well, in the starting
of this video, we were discussing about strategic business
unit and how as a company you will decide where exactly you should
invest or divest. And that's why we are
using a BCG matrix. So let's understand
about the movement of your cashflow and
desired movement of your focus as a company. So as you know that cash cow product have a
low market growth rate, but they have a
high market share. So all the profit that you are generating from your
cash cow product, you have to invest that capital
either into the product that are in the caution my quadrant or in
the star quadrant. Also, you should try to move
your question mark product. Because these products have a high growth rate and soon these product can
become a market leader. So you have to focus on
moving these product from your question mark quadrant
two, this star quadrant. And you may have to make sure
that these products have a high market growth rate as
well as high market share. In the end, you have to
divest yourself from all those product that has a low market share and
low market growth rate.
27. Limitation of BCG matrix: So now that you understand
everything about BCG matrix, let's talk about the
limitations of BCG matrix. Bcg matrix is a framework for allocating resources among
different business unit. And it makes it possible to compare multiple
business units you have. But apart from that BCG matrix, also got couple of limitation and I think you
should a bear about it. So BCG matrix classify your
business as low and high. But generally if you
look at businesses, they can be medium also. So BCG matrix may not reflect the true nature
of your business. Also in BCG metrics
are specific. Market is not clearly defined. I mean, when you are
discussing about market share, are you talking about
market share in a specific geography or
in a specific category? So the market is not clearly
defined in the BCG matrix. Also, if you have a high market share into
a specific category, that doesn't mean
that you can generate higher profit from
that specific product. Because some of the
product may have a high cost involved with
a high market share. Maybe you might be boning a ton of capital into advertisement. In BCG matrix is not just limited to one single brand
or one single product. You can put different
product lines of different companies
into BCG matrix. Also, if you look at growth rate and relative market share, They are not the only
indicator of profitability. So this BCG model somehow ignores the overall
indicator of profitability. Now if you look at
the dogs quadrant, then many companies might think that we should divest from all of these strategic business
unit or product line. But sometimes the product in this specific quadrant can help a business gain
competitive advantage. And maybe they allow them to on even more cash than
the cash cow quadrant. But in the end, the only reason why we are using BCG matrix is because
it's very simple. It's a two-by-two matrix and it is super easy for a normal
person to understand. Now if you want to get
rid of a couple of limitations that
BCG metrics have. In that case, you can
try out the ADL metrics. I mean, let's say
if as a business, if you have multiple
product line and let's say as a business executive
or as a business manager, if you are making a presentation where you want it to put all of your different product into a specific diagram or metrics. In that case, you can
also use EDL metrics. So alien metrics will help you develop strategies
that can be used to understand the competitive
position of your product or service and the market
share that you have. Or I would say,
at which stage of your product lifecycle
your product is right now. So an x-axis you have industries less market life cycle stage, and on y axis you have competitive
influence or position.
28. Assignment - BCG matrix: Now I have a small
assignment for you and I highly recommend you to complete this
assignment by yourself. Because by completing
these assignments, you can always test your
knowledge and you can understand how much have you learned from this
specific video. So you have to put
multiple product of Adobe into these different
quadrant in the BCG matrix. So you have to first figure out all the different
products that Adobe have. And then you have to put all those different product
into these multiple quadrant.
29. Understanding Marketing Analytics: So hey, everyone. Now we are starting the module number
one of this course, and in this module, we'll build a strong foundation
for marketing analytics. This module is all about revising a couple of
marketing concepts so that you are up and running and we can start understanding about
complex topic. Now in this module,
we'll first understand about what exactly is
marketing analytics? Why do we need it?
How do you use it? And what exactly does
it help you achieve? After that, we'll
talk about four piece of marketing and STP framework. Four PD stands for your
product pricing, place, and promotion and STP is your segmentation
targeting and positioning. These are the two
framework that can help you break down a bigger
problem into smaller chunks. After that, we'll talk about the different types
of marketing data. You have structured
data unstructured data. And in the end, we will
talk about a couple of key metric that you need to understand, especially
in marketing. Let's start with our first
section of the course. Before I start a module
or a new section, I always try to create oversimplified videos
so that everybody can understand about that
module and why do we exactly need to learn
all those concepts. Let's understand
marketing analytics like I'm explaining it to
a 5-year-old kid. Marketing Analytics is
just like a detective who look at the glue and who
understand what people like, what they buy, and
what they ignore. So that businesses
can sell better. Imagine you have
a lemonade stand and you're selling lemonade
to different people, and you're writing down what flavor people choose the most. Do people like sweet lemonade, sour lemonade, or
minty lemonade? You also started noted down all the sales
that you are doing, so you're checking on which day exactly are you selling the
most number of laminade? Is it Monday or Sunday? Probably Sunday because more
people are free on Sunday. So this is exactly your
marketing analytics. You're looking for what worked in your business
and what didn't. And based on that, you
optimize your business, your idea or your process. Now the reason these data and these numbers matters is because these can
help you sell more. You can save more money, and you exactly know
what customer need. Marketing analytics can
help a business make smarter decision by learning what already happened
in the past. Now, whenever we talk
about marketing analytics, you may have one
question in mind. What kind of questions does marketing analytics
help us answer? So typically marketing analytics
answers questions like what worked in the past and
what should we do next. And it can help you answer broadly these kind of questions. For example, if you're running some ad campaign on Facebook, on Google, on Tik Tok, or on any social media platform, with the help of data,
you will understand which specific ad got
most number of clicks, and based on that, you
can optimize that ad. Also, you'll know
what product you are selling the most
during weekends, which customer will
likely to come back, and it will also help
us know how much did we earn for every single dollar
that we spent in the ad. But the main conclusion is
that marketing analytics can turn the guesswork into decision using real
customer data. Well, after this, you might have one question in mind that hey, now I understand what
marketing analytics is and what kind of question
can it help me answer. But where does this
data come from? How exactly do we get this
data that we need to analyze as a analyst or as a
marketing analytics manager? Well the data comes from everywhere where the
customer touches your brand. It could be a website, email, offline retail shop,
or maybe a mobile app. So you have different
sorts of data that you usually collect
using different tools. For example, if you
have a website, most of the website use
Google narratics and your website data can help you understand how many people
are coming on your website, how long are they
using your website, which paces they have visited, and where exactly they are bouncing or closing
your website. Apart from website,
you'll also have ad data. If you are running a
Facebook campaign, Facebook, ad manager gives you a lot of data about impression,
number of click, how much revenue it draw, and which all demographic
people are coming on your ad. Then you can also get
some Purchase data. If you're using Shopify
or anything else for your content
management system or CMS, you can get revenue
purchase data as well. Obviously, whenever
you send an email, you get a email data on how many people have
opened the email, how many people
have clicked on it, and a bunch of those things. The main conclusion is that this data is like
footprint in the sand, and we follow these
people wherever they went and we'll try
to understand why. So to conclude, marketing
data comes from many sources, both online and offline, and each tell a small
part of a big story. Now, you might ask
me, Okay, perfect. I'm able to understand what
marketing analytics is, what it helps me achieve, how does this data come from? But how do I do a decision
making out of this data? How do I tell a
story or how do I find a exact goal
that I'm achieving? Well, that's where your metrics and KPIs come into the picture, and obviously we'll
understand more about it in the later part
of this section. So metrics are the number that help marketer
measures the success. So you have a dashboard, you look at the numbers
and the metric, and then you are able to
understand what's happening. Now, think of the metric
as your report card. For example, one
of the metric is CTR or click through rate. As the name suggests,
it will simply help you understand how many people have clicked on a certain thing. For example, if you have
a button and you really want to understand if 1,000
people has opened this page, how many people have
clicked on a button, so you will look at the
CTR rate of that click. Then you have CPC, which
is cost per click. In fact, a better
example to understand the whole story is ad campaign. Let's say you're
browsing through Instagram and you suddenly saw an interesting ad where people
are promoting T shirts. Now, thousands of people scroll through Instagram
every single day. Most of them just ignore the ad. That's called impression. Even if they have
not taken an action, it counted as an impression. But let's say five
to four to five person people clicked on the ad. That's your CTR or
click through rate, which are the number
of people who have clicked on a specific ad. Then you have CPC, which
is cost per click. That means out of
100 or 1,000 people, if four to five person people
have clicked on an ad, how much are you
paying for that? That's your cost per click. How much are you
paying as a brand? You could be paying
50 cent or $1. Then you have conversion rate, which means how many people
actually purchase that item. Let's say your ad was
shown to 100 people, five people clicked on it, but nobody actually
purchased it, so it didn't give
you any revenue. That's where your conversion
rate is also important, which will help you understand how many people has actually
purchased the product. In the end, you have your
customer lifetime value. Which will simply
help you understand how much revenue a
customer is giving. Let's say you Shawn
your ads 200 people, five people clicked on it, one person purchased it. Now obviously that person, is that person coming back
and purchasing again from your brand or how much
that person has purchased? That's your customer
lifetime value. How much a customer is worth
over the full lifetime. In the end, you have ROAS
or return on ad spend. That means if you spent
$1,000 on an ad campaign, how much are you
generating in return in terms of revenue?
That's your RAS. A good ROAS is 2.5, which means if you're
spending $100, your ad should generate at
least $2,500 in revenue because obviously you need to justify your cost
of the product, your shipping, your admin and
marketing expense as well. We'll come back to each and every single metric once
again. Don't worry about this. This is just an
introductory video. But if I have to conclude everything in
marketing analytics, you use a bunch of tools, consider these like superheroes or gadget to track, measure, and decide how to effectively run these
marketing campaign, and we'll come back to these. But we use tools like
Google Analytics that can track our
website visit. We use meta ads manager to run campaign on
Facebook and Instagram, we use email tools
like Mail Cham. We use Google Sheet
or Excel to do a simple analysis from a CSV
export. We have dashboard. And these are all the bunch
of tools that we can use as a marketing manager
or as a marketer. So this is the oversimplified version of marketing analytics. In next video, we'll
understand more about it.
30. The Four Types of Analytics: So great. In the first video, I hope you are able
to understand what is marketing analytics
and why do we need it? That was the oversimplification
of this topic. In this video, I'll help you understand the type of
marketing analytics. But before that, let's revise
marketing analytics a bit. Marketing Analytics
is the practice of using data to measure, predict, and optimize the
marketing performance. Marketing analytics involves
collection of data, then analysis, and
then interpretation. So that you can take a decision. Now, the key goal here
is that you first need to understand the customer
behavior using the data, then you need to optimize the return on investment on
your marketing campaign, and then obviously
you improve how efficiently can you target
and segment your customer. And obviously, if you
have good amount of data, then you can forecast
future trend, demand, or even sales. But marketing analytics
is the backbone of informed measurable and
scalable marketing strategy. And I'll help you understand
these things more with the different types of marketing analytics
technique that you can use. So broadly, when we talk
about marketing analytics, you have four
different techniques. You have descriptive analytics, diagnostic analytics, predictive analytics, and
prescriptive analytics. And let's understand about
each of them one by one. The first one is
descriptive analytics. Now, descriptive analytics
simply answers what happened. For example, if you run
a marketing campaign, it will simply help you understand how much sales
you got from that campaign, how much money that you spent, what were the number of
clicks and impression. Then you have
diagnostic analytics, which will simply
help you understand why exactly certain
things have happened. For example, you were
looking at homepage data and you realize that people are bouncing a lot
from homepage. Diagnostic analytics
will help you understand why certain
things have happened. There could be many
reasons and we obviously understand each of
these topic with example. Third one is
predictive analytics. Which will predict
in the future, what will likely to happen? So for example, you have 1,000 customer they are
using your product. Predictive analytics will help
you predict the action in the future or the probability of that action in the future. Like how many customer will churn or stop using
your product, What will be our future sales? All of these questions could be answered using
predictive analytics. In the end, you have
prescriptive analytics. Which will simply prescribe
you something that hey, based on all of this data and based on this campaign,
you should do this. So things like optimizing your campaign could be one answer of
prescriptive analytics. Now, these type of marketing
analytics technique will help you from past
reporting to future planning. That's the main idea
of business using different types of marketing
analytics technique to improve their
decision making. Now, I wanted to talk about
a few key application where you need marketing analytics and why this topic
is so important. I know you hate PPTs
and you don't want me to spend a lot more
time on these PPTs, but I still want to explain some concepts so that your
foundation is strong. So you use marketing
analytics on a wide range of decision making across
the different step of your customer life cycle, all the way from acquisition to retention to engagement
to upsetting. The first place where we use marketing analytics is customer segmentation
and targeting. Let's say you are a
marketing manager in a grocery delivery app. You have thousands of customer. Now, if you start targeting every single customer
persona with the same lens, you will have very
bad conversion and engagement because
the kind of messaging or marketing you need to
do to an 18-year-old kid is very different
from what you need to do to a 40 or a 50-year-old man. That's where you need
to properly segment your customer and
target them properly. There are techniques
to do it like creating a customer persona or ICPs. We'll come back to
that. Don't worry. Those are too advanced
concepts for now. Second thing is digital
campaign optimization. Whenever you run a campaign
or ad on Facebook, Instagram, Tik Tok, or on any platform, you always choose
your demography. Where exactly do you want
to run this campaign? Do you want to show it to men, women, or to any gender? What kind of interest
do they already have? You want to show a protein ad to someone who is
active in fitness. Also, are these people have
to be salaried or in college? What kind of income you expect from these people
that we are targeting? You need to optimize
these digital campaign and that's where you need
marketing analytics. Third one is funnel and conversion analysis,
which is very simple. You need marketing
analytics to understand. Thousand people came
to our website, 50 visited this specific page. Only ten people clicked
on a certain product, but just two people bought it. What is wrong with our landing
page? Can we improve it? So these kind of
decision making can be done using funnel and
conversion analysis. Then you have postalization
and recommendation engine, which is a different
topic in itself. But whenever you open
Netflix or Amazon, you see the product that you actually wanted to buy
on Amazon homepage, and that's all because of
recommendation engine, that's there in Netflix as well. Based on your previous history, they recommend you the
right kind of movies. In the end, you can calculate your customer lifetime value, you can predict the churn, we have dedicated videos on every single topic
that you can see on your screen all the way from segmenting a
customer to doing a funnel and conversion analysis to solving complicated
assignments and case studies on
customer lifetime value and churn and obviously marketing mix modeling and
budget allocation. We have videos on
every single topic that you can see on your
screen. Don't worry. I don't want to rush
through all of these PPTs, but I'm still
covering them because I feel they are
important for you. Let me give you some real
world application of marketing analytics
so that you are able to understand and relate
with these things better. Companies use data and
analytics to drive growth. They optimize spending and
personalization at scale. A very simple example is that whenever you open
Amazon or grocery app, just on the homepage, just wait for some time
and look at the homepage. You will see everything that you actually
wanted to order. The first real world example of marketing analytics is Netflix. Whenever you open Netflix, it shows you a recommendation of all the movies and
web CDs and TV shows that you actually wanted
to watch and that's all because of all the things that you have
watched in the past. Looking at your
data in the past, it personalizes the content and the thumbnail and suggests you what you exactly
wanted to watch next. Second example is Amazon. Based on your last purchase and behavior and interaction
with the app, it shows you all the
recommended product that you actually
wanted to order, and you can save
some time as well. Third one is Coca Cola. Coca Cola has a very good
placement technique where they place their product in the right channel to the
right kind of audience. For example, they
might be selling normal Coca Cola to
in bigger events. But when it comes to some
sports events or some events where your youth and fitness
people are more involved, they try to market different
kind of Coca cola, like Coca Cola diet
or zero sugar. So they have a really
good placement strategy on which product to sell to which audience? In the end, you have a food
delivery app like Zomato. They create a RFM segmentation, also known as your recency, frequency and monitory and they do AB testing in sending push
notification and discount. I'll come back to this topic. Some of these are little
advanced concepts like RFM analysis, AB testing, what will come
back to these things. But it's all about the types of marketing analytics and what
it can help you achieve. From the next video, we'll
understand about one of the most important
foundational concepts every single marketer
need to understand, that's your SDP and four
piece of marketing.
31. How STP & the 4Ps Shape Marketing Analytics: So here, everyone. Now
we will understand about four piece of
marketing and STP framework. Now, these two are
super simple concept, but they are important. Anybody who is new in marketing need to understand
about these concept. In fact, they are very old. I'm sure if you have studied about marketing
even a little bit, I'm sure you already
know about this concept. But still, I want to revise the concept for someone who is new to
marketing analytics. Why do we need four Ps and STP framework
at the first place? So in today's world,
you have a lot of data, you have a lot of brand, and you need to structure all
of this information to take smarter decision because data is everywhere and
without direction, this data can cause
some confusion and teams often act reactively, not strategically when it
comes to decision making. The solution is
STP will help you decide who to focus and how
to stand out as a brand. Now, STP stands for segmentation, targeting,
and positioning. That means looking
at your product, what segment you actually
wanted to sell to, how do you target them and
how do you position them? Targeting means what kind of channels do you use
and positioning means? Are you selling affordable or premium or a standard pricing? Now four piece stands for product place, price,
and promotion, and it can help you plan what to offer to your audience and
how do you deliver them. So in simple term, STP is your destination and four
P is your travel plan. You need to use your travel plan to reach to your destination. Let's understand about four
P, our travel plan first. Four Ps is also known
as your marketing mix. It stands for product, price, place, and promotion. These are the core
building blocks of any marketing strategy. Let's talk about product. Whenever you try to sell
a product to people, you don't highlight
their features, you explain the benefits. So that's your product.
You highlight benefits, maybe features, design,
packaging branding. All these things
comes under product. Then price, which means, how do you sell this
product to customer? Are you going to sell it
at an affordable price? Are you going to
make it premium? And how does this price change because of other product
or other brands? So obviously, you need to do a price sensitive analysis,
competitor benchmarking. These are all the analytics
technique where you can use and optimize pricing. But let's not touch that.
Third one is please. We will you exactly
sell the product? What are your
distribution channels? Are you going to sell
it online or offline? If offline, which partner
are you going to choose? And how do you going to optimize the inventory and the logistic? Remember, at each step
of the user journey, the cost will increase because
when you sell offline, you need to find distributors, sockist, subtckist, retailer, and then you
need to do marketing. In the end, you have promotion. Where exactly will you
promote the product? TV ads are very expensive, even social media ads
are very expensive. Are you going to find some
influences, some PR agency? How exactly are you
going to promote it? And how does your return on investment looks like
by each channel? Now, these are difficult
question to answer. Obviously, you need to work
a lot on your product, you need to find a
perfect pricing. You need to find a better
place where you can sell the product and you need
to obviously promote it. I can give you some
real world example in some videos to understand
each part of the process. So that's your four
piece of marketing. Which are the four key pillars that are very important
in marketing. The second step is SDP which stands for segmentation, targeting,
and positioning. Now, STP will tell us who do we market and how do we
differentiate as a brand? For example, if you're trying
to build a soy milk brand, one of your target segment are vegan people who actually
don't consume dairy. In that case, soy milk, almond milk is a good
alternative to dairy, and that's one of your segment. Now obviously, you can have super complicated
way to categorize the segment and
we'll come back to things like clustering RFM. But the more simple
segment is that, hey, from a broader
group of audience, you need to figure out which is your core segment that
can buy your product. There could be
other segment like normal people can
also have soy milk. Normal people can also
have almond milk. But vegan is one of your segment where you
can sell your product. There could be five or six
different segments as well. Targeting. Targeting is that, how do you select a segment and align your
product towards them? Obviously, when you target
this specific segment, you have to highlight
benefit that, hey, soy milk
contains Omega three, Omega six, Omega nine, and good amount of
protein so that you can have one glass of soy
milk every single day. Then positioning. Are you
positioning your product as a flavored soya milk
or a healthy soya milk? It depends on your
target origins. For example, if
you're just targeting vegan and general
audience for soy milk. You have to make
it more delicious. On the flip side, if
you're just targeting fitness people or people who are actively in
sports or fitness, in that case, they don't
need anything with sugar. They want a sugar free soy milk. In that case, you sell them a sugar free soy milk instead
of flavored soy milk. And that's your positioning. How do you craft a
unique value proposition for the audience
you have selected? And that's where if you
look at a soya milk brand, you will see a unflavored one specifically tailored
towards people who are active in sports and fitness
and flavored one for general audience so
that it tastes better. Otherwise, soymilk
doesn't taste that well. The main idea is that
you're combining four Ps and STP analysis. So SDP defines your
target audience, and FP defines how
do you solve them? So you first segment
your audience, then you target them and
try to position your brand. And then obviously, you try
to optimize for product, what kind of packaging features, quality of product you
have. How do you price it? How do you distribute and
sell it to the end customer, which is your placement,
and in the end promotion? Do you need a celebrity? Do you want to run some
discount campaigns? All of that. These are the two crucial important
topic in marketing analytics. That's your four piece and SDP. Now I can give you a real
world example as well. Look at AirBnB. Let's understand the way Airbnb use four piece
and STP side by side. Let's start with segment. Their main segment
are travelers and host who actually have a rented property and
they want to rent it out. Now, they have multiple segment. They have budget
segment, luxury segment, people with usual
travel as a hobby, people who are traveling
for a business trip. There could be multiple kind of people. Then you have targeting. How do you target
young urban traveler who have flexible itineraries? So they need to
make sure that they are promoting these product, they are promoting
their property with all the channels possible. And how do you position
them live like a local in a unique way that
Airbnb has position? So you first need
to find a segment, then you need to target them. For example, when you look
at a corporate travel, it requires you to have a lot of corporate tie ups with
different companies. And then obviously, you need to position different kind of properties as places where
you can have a Wi Fi, a stable connection and do
a bunch of those things. So perfect. That's about
your FO Piece and STP. In the next video,
we'll understand about the different types of data that is produced in
a marketing analysis. We'll talk about
structured data, unstructured data, and a
bunch of those concept.
32. Exploring Different Types of Marketing Data: So great. Now you have a really good foundation
about marketing. In this video, let's
talk about the types of marketing data and why is this so important in a marketing
analytics course. As a marketer, you obviously
will get different kind of data while you are running a campaign or doing
some analysis. That's why understanding about these three different types
of data is so important. When it comes to data,
you have structured data, semi structured data,
and unstructured data. Let's understand about each
one of them one by one. We'll first start
with structured data. Structure data is
clean numeric numbers that you can easily
organize structure data is ideal for dashboard
models and tracking performance of different
marketing campaigns or even team members. This data is usually
stored in rows and column, maybe in an excel sheet
and a SQL database. It depends. And some
really good example of structured data is
maybe the pricing data, the customer relationship
management or CRM data, your financial transaction,
your customer information. All of this comes
under structured data. For example, let's
say you are running a campaign on Facebook
or on Google, and whenever you do that, you obviously use
a bunch of data. Let's say you wanted
to run campaign on a specific kind
of customer persona. So all your customer
data like name, age, gender, all of this
is your structured data. In fact, whenever you
run a email campaign, the email open rate, the click through
rate, the number of emails that are sent to
a specific customer, all of that is a
structured data. In fact, the
conversion data that Google Analytics give
is also structured, and even your sales transaction, your storekeeping unit, all of this is in the form
of rows in column, and that's why it is
a structured data. So to simply conclude
anything that you see and store in Microsoft Exl is
kind of a structured data. So data that you
can store in rows in column is your
structured data. Obviously we work with a
lot of structured data. The second type is
unstructured data. As the name suggests, this data is not very
well structured. That means you cannot
use it directly. You first have to parse this data and then you need to get some
insight from the data. Unstructured data
is qualitative, it's messy and it
is rich in insight, but it's harder to analyze
without any good tool. And the reason I say good
tool is because you can still use large language
model to parse images, videos, sensor data to
make a sense out of it. But this data cannot be adjusted into raws
and columns and usually company use
vector databases to store this kind of data. That is a slightly
advanced concept. We'll come back to this
maybe in some other course. But the reality is
that if you have thousands of images or let's
say millions of images, millions of audios, you are not going to listen to
every single one of them. So you cannot summarize, you cannot get really good
insight out of that data, and that's why it
is difficult to get useful information from
unstructured data. Now obviously, you
have Chat GPT, deepsk, a lot of these
large language model, where you can pump in millions
of images and audios, and it will start
giving you insights, and you can store all of these things in your
vector databases. But again, for a
marketing person, this is still a very
messy area to work with. Whenever a customer
gives you review, they obviously write two, three lines of long review, and it is difficult for you to get actual insight
from millions of reviews without using machine
learning or AI tools. Second, is your
social media post. You have thousands
of posts where people are commenting
different sorts of things, and it's really
difficult for you to summarize or
analyze that data. Then you have voice recording,
images, and content. So you got the point.
With structured data, these are simply in
rows and column. That means you can calculate some average, you can multiply, you can find means, standard deviation, a
bunch of those things. But with unstructured data, you have images, files, reviews. It's difficult to get
a proper information. Now, obviously, in some
sort of assignment, I can look at unstructured data, parse it in LLM, and show you how exactly
do you get inside. But still, for a marketing
manager or for a marketer, it is still a messy
area to work with. Third one is your
semi structured data where your data is in
a structured format, but it's still difficult to
get an actual information. Semi structured data blends the structure with flexibility, and this is very common
in marketing system. These data usually have
tags and hierarchy, but they do not have
a standard schema. The reason I say that is because if you come from software
development background, then you might came across JSN. JSN stands for your
JavaScript object notation. Now, it's a industry
standard format to store your data
in key value pair. It sounds complicated for someone who doesn't come
from software domain, but JSON is just like
your rows in column that you see Exil but in a
much more predictable fashion. So whenever you work with
APIs or different tools, all of them follow a
standard, which is JSON. They don't follow XML anymore, so that you can
utilize that data. Maybe I can solve a couple of these problems and show you
how exactly does it work. But with semi structured data, you have meta datas that
are in key value pair, JSON and event logs from tools like mixed
panel amplitude, you can still utilize this
data, still analyze it, but it's difficult to store
it in rows and columns, just like what you see in Axl. So that's your semi
structured data. I'll come back to each
different kind of data. Maybe I can show
you or we can solve a small assignment and
exercise. So perfect. Let's summarize all the things that we have learned
in this video. You have three main
different types of data. You have structured
data that you can store in rows and columns
in Microsoft Axel, like how many units
you have sold, how many transaction happened, how many customers are there, and all of their information
like customer ID, customer age, customer
number, customer purchase. All of this can be stored in multiple databases or in
simple terms, Excel sheet. And then you can
calculate how many orders a customer has placed,
what they have placed, and what is your
average order value, what's your customer
lifetime value, and a bunch of those metric. And that's super easy with structured data because you can store it in rows and column. With semi structured data, it's difficult to store
directly in rows and columns, but you can parse your JSON
and create a CSV out of it, and then you can summarize it. With unstructured data, you can still get
some information, but it is difficult to put
it in rows and columns, and you mostly need to store
it in vector databases, and then you need to use AI tools to get some
sort of information. So you can do sentiment analysis and a bunch of other things. So that's our semi structured structured
and unstructured data. Maybe I can give you one
example and maybe we can then solve one small
assignment or case study. So let's talk about Spotify. Spotify is a streaming app where it gets a lot of data from its consumer who is
using the app and obviously Spotify get
all kind of data, including the structured data, semi structured data,
and unstructured data. So if you are a data analytics
or a marketer in Spotify, the structured data that you would have is user information, like, what's the phone number? What's the user ID? What's the location or the
carrier the user is using? What's their subscription plan, what kind of music
they are listening to? All of this is your
structured data. Now, in an app like Spotify, whenever a customer click
anywhere in the app, they usually trigger
event log so that they exactly know how a
user is moving into the app. Now, your event log data
is usually in the form of event driven architecture, which looks something like
a JSN data, key value pair. And in fact, not just that, all the music that they like, how much music they
have listened to, all of this is also present in the form of semi
structured format. Again, semi structured data
can still be analyzed, but it is difficult to
interpret and parse it. Or once it difficult,
it is complicated. Unstructured data is what kind of music they are listening to, how much they have listened to, the name of the playlist, the transcription, all of
this is unstructured data. Obviously Spotify have
machine learning, AI engineers to analyze all of this data and make sure they are improving their
recommendation engine to recommend the right
songs to the user. But the main idea I was
trying to convey is that as a marketer or
as a marketing manager, you will mostly work with structured data or
semi structured data. You will not work with unstructured data in
most of the cases.
33. Customer Acquisition Cost (CAC) & Lifetime Value (LTV) – An Introduction: So perfect. In the last video, we discussed about the
different types of data you may expect
as a marketer. In this video, we'll
talk about marketing metric and KPIs and
why they are so important in analyzing
the performance of your campaign or effort
you're putting in a product. But let's start by asking
one basic question why metric and KPIs are the
central of modern marketing. The answer is, without the
right metric and KPIs, you will lack direction
and accountability and you cannot prioritize
one thing or the other. Now the problem with a
lot of marketer is that they focus largely on vanity metric to how many people
their campaign is reaching, how many people are looking at the campaign, the impression, and they don't really care about ROI or return
on investment. And they mostly make decisions without the clarity on
the performance side, how exactly do you define
the success of the campaign? And that's where these
metric and KPIs will ensure that you have the
right accountability and you are doing the
right optimization. So things like customer
acquisition cost, customer lifetime
value written on ADSpnd these are
KPIs and metric, we'll be discussing in
this specific video. But before that, we'll
first clear the doubt of the difference between marketing metric and KPIs and how
they are different. Metric are the raw
performance data, while KPIs are the
strategic goal that you build for your team. So KPI stands for key
performance indicator, and they measure
how well you are progressing towards
your business goal. While metric provide you
data on the progress, the status, and your
activities and progress. So when we talk about
marketing metric, we're talking about
customer acquisition costs, click through rate,
written on Adspend. And KPIs are more goal oriented. So a metric could be a
simple chon rate, 15%, but your KBI has to be that you need to reduce
down the churn to 10% in 90 days using
a specific action, let's say, a win back campaign. So you need to think of
metric as ingredients and KPIs are the recipe that
actually drive results. So let's cut the clutter and
let's understand about our first metric, customer
acquisition cost. As the name suggests,
customer acquisition cost reveals how much are you spending
in acquiring one paying customer?
Could be free as well. And to calculate your
customer acquisition cost, you simply divide
your total cost by total number of customer. So let's say if you're spending $1,000 and acquiring
100 customer, your customer
acquisition cost is $10. Now, when we talk
about total cost, it obviously includes your
sales cost and marketing cost. And obviously, you have to
divide that by number of customer to calculate your
customer acquisition cost. Now the reason customer
acquisition cost is so important is because it measures your
acquisition efficiency. As a marketer, you
might be acquiring customer using your blog
post, using your website, using your Facebook campaign, using your email marketing tool, and maybe due to word of mouth. You need to find
out how exactly or how much exactly are you spending in acquiring
a customer. You obviously have
two different types of customer acquisition cost, blended CAC and normal CAC, but let's not talk about it and let's not make
it complicated. But the reality is
that you might need to spend a lot of
money in acquiring customer from the ad campaign, and you can also
get it for free, but you need to account for each and every small
cost so that you know exactly how much are you spending and how much budget
you need to allocate. Just as an example, if you're spending $20,000, acquiring 400 customer, your customer
acquisition cost is 50. Now the reason this metric is important is because you will be measuring your customer
acquisition cost by every single campaign
that you're running, whether you're doing it on
social media, TV, press, or newspaper, and by
every single channel. To find the best
performing campaign and how can you
scale it up further? That's your customer acquisition
cost in simple term. There are so many
advanced concept inside customer
acquisition cost. In fact, we can solve some real world case
study assignment to understand more
about this topic. Let's move towards
our next metric, which is your customer
lifetime value. Customer lifetime value
estimate your total revenue. A customer will bring in
their whole life cycle. This means that if you're
acquiring a customer today and if the customer is using your product for the
next three to four year, how much of total revenue that customer will bring to you? That's your customer
lifetime value. And the formula
is pretty simple. You have to multiply your
average purchase value or average order value by the frequency of purchase
in the complete lifetime. Let's say if I'm buying a
subscription, let's say, a Netflix subscription for $10 a month and I'm buying it
for the next five years, you have to multiply 120, which is your ten
into 12 into five. Close to $600. That's my customer
lifetime value where I as a customer will not use the product
after five year. I'm assuming that. Your
average purchase value multiply by average
frequency rate. Now your average purchase value or AOV can be
further broken down into the total revenue
that you are generating in a time frame divided by
the number of purchase. So for example, let's say you have hundreds of
customer and they are spending different money and they are having a different
frequency of purchase. Let's say some of
these customers are on an advanced plan, some of these customer
are on a basic plan, some of them are
on a premium plan, and some of them have add ons, some of them I don't
have any add on, and they are doing a purchase
at different frequency. In that case, the easiest way to find a middle point of what is the average value of these
customer buying from us is to simply calculate average purchase value
or average order value. Obviously these customers are purchasing at different time, a different plan, a
different frequency. The best way to normalize it is by calculating average
frequency rate. That's where I mentioned that to calculate the customer value, you have to multiply your
average purchase value with average frequency rate. Now, a customer
lifetime value can be calculated using your
average order value, purchase frequency, and how long are they using your brand. So if I'm paying $10, paying every single month and using a product
for five years, that will be my customer
lifetime value. The use case is
that as a marketer, you need to know that if you're spending $50
acquiring a customer, how much of the revenue you can generate from them over
the whole lifetime. Now, it is obviously
difficult to calculate it because let's say you
acquired a customer, they use your product for four or five months
and then they churned off and you were not able to justify your customer
acquisition cost. But they came back
after six months, and that's why calculating customer lifetime value
is slightly complicated. Now, obviously, customer
lifetime value will also influence
retention and upsell. Like, let's say a brand is spending $100
acquiring customer, and their first basic
plan is just $5 a month. It will take two years just
to get your money back. But in reality, brands are really good at upselling
and cross selling, and if they're able
to upsell or cross sell some other
plan at 50 or $20, they are able to get
their money back faster. Okay. As a marketer, you need to identify a high
value customer segment, a low value customer segment. In fact, brand also personalize their pricing by
geography as well. Some of those brands are and
I can show you a couple of those plug ins as
well that can let you customize or personalize your price by
different geography. To conclude, customer lifetime
value will help you shift your focus from one time revenue to long term revenue that you can generate
from the customer.
34. Mastering the CAC to LTV Ratio: Now you have a really
good understanding about customer acquisition cost
and customer lifetime value. But if you carefully observe, these two things are actually
connected to each other, and we call them as
LTV to CAC ratio. Let's say you're
able to generate $300 from your customer
in the whole lifetime. This could be one
year, this could be ten year. You don't know yet. But let's say your
average customer lifetime value is
coming close to around $300 and your average customer
acquisition cost is $100. If you divide your LTV by CAC, your ratio is three is to one. $300 divided by $100
is three to one. Now that ratio is considered
good in the industry. The reason being is that you spent $100 acquiring a customer. The customer is generating $300. That means you have $200 left where you obviously need to subtract your
administration cost, operational cost, a
bunch of other cost, and you will still have 50
to $60 left as your profit. So three is to one as your LTV to CAC ratio
is considered good. That means unique you can
only spend one third of the total customer
lifetime value in the acquisition cost.
And that's a thumb rule. Obviously, you can violate it and you can still
build a good brand. And it also depend on
different industry. Like, usually, SAS has high
customer acquisition cost, but they also have really
good customer lifetime value. But when you look
at other categories where people just use
the product once, maybe, let's say, shampoo, uh, a t shirt or anything
that people usually purchase just once there, the reoccurring purchase
is not there and your LTV to CAC ratio
could be lower. If your LTV to CAC
ratio is less than one, that means your lifetime value is closer to your customer
acquisition cost, which is bad because
let's say you spend $100 just in acquiring a
customer and obviously, you need to incur some
cost to build the product, to sell it, to manage. All of that cost
is not involved. That's why you're
losing money customer, if your LTV to CAC
ratio is less than one. If this is 1-3, you're still at the risky
stage, but it's fine. More than three, it's a
healthy unit economics. So your customer
acquisition cost has to be lower than one third of your customer lifetime value to justify that your
business is good. Then you have your
return on ad spend, also known as ROAS. Now, return on ad spend, as the name suggests, shows how much revenue
your campaign is generating on every
single dollar you spent. Imagine you spending $1,000 for something that
you sold for $1,000. You have not accounted
for product cost, administration cost,
packaging, marketing, shipping cost. You are in loss. If this is 2-5, it's kind
of in a healthy range because you can obviously
subtract your product cost, shipping costs, packaging
cost, administration cost. Just to make sure that you have enough money
left on the table. If this is 8-10,
that's excellent. Very less brand actually have eight to ten return on ad spend. But the main idea is that whatever you are
spending in ad campaign, you need to ensure
that at least you are generating three
times more revenue than that budget that
you're spending, that's your return on ad spend. This will simply help Marketer
RoAS will simply help Marketer double down on winning channels and cut down on
the underperforming spend.
35. Selecting the Right KPIs for Your Business: Now, another important
concept you need to understand in
marketing is funnel, and I'm sure most of you
already know about the funnel. Whenever a customer
visit your website, whether they came from
Instagram, Facebook, organically from Google, they are at the
top of the funnel. They just lend it
on your website. They might read
about your website, and that's your awarenesstge. Once they have
read your website, they may or may not sign up and that's your interest
stage, this one. Let's say they end
up signing for your product, signing
up for your product. Well, then they will browse
through different features, different functionality, and
different things you have. That's your desire. They have
gone through everything, but they still may
or may not purchase. Let's say if they end up
purchasing your product, then that's your action. And they might come back again and again use your product. But if you carefully
observe this funnel was broader at the top and it
narrows it down at the bottom. That means a lot of people might visit your website
or platform or app, but very less will
show interest. But all those people who
have shown their interest, they may not even
explore your product. Even if they have
explored your product, very less of them
will take action like buying a subscription
or purchasing an item, and very few of them will again come back
and do the action. So when you look at a funnel, you have top of the funnel, also known as tofu, middle of the funnel, morfu
and bottom of the funnel. Your top is usually broad and
bottom is usually narrow. So when we talk about
awareness stage, you have so many key performance indicator
you have to measure. Things like impression, how many people are
landed on your website, reach an ad recall lift. These are your awareness KPIs. Then you have
consideration or interest. Things like how many people
clicked on signup button, click through rate
at two card, signup. These are your consideration. Where people are actually
showing interest. Then you have your conversion where people are
actually converting, they're signing up, they're
adding their details, and that's where your
actual conversion happens. Then you have retention
and advocacy. Retention is when people
come back and use your product and advocacy is when they raf for your brand. That's a typical
marketing funnel that I'm sure most of you
are already aware of. In the end, let's
summarize everything that we have learned in
this specific video. How do you choose the right
KPI for your business? Obviously your KPI depends on the type of company or
product you have at what stage in the life cycle of the journey of the business and what is your current goal. You first need to define your business goal that if you are starting
a new business, is your business goal acquiring
more number of customer? Is your business goal sell
more number of product to the existing customer or you want to increase
the attention. But in most of the cases, your business has all the goals. And when you have
multiple goals, you have to set multiple
success metric as well. Then obviously, you
need to measure metric, things like retention rate, customer lifetime value,
average order value, basket size, ticket
size, customer lift. These metrics sounds
complicated, but they are not. And then you need
to set a KPI target on what do you want to
achieve as a marketer? Do you want to increase revenue, reduce customer
acquisition costs, increase activation in a
specific period of time, reduce CAC by 15%
in three months. This could be a KPI target. So that's your
example. Let's say if you want to increase retention, your KPI would be to improve monthly repeat purchase from
30% to 40% by quarter three. Now, let's summarize everything that we have learned
in this video, and let's create marketing
KPIs for Spotify. When you look at Spotify, it's a music streaming app, and this app is used by millions of people around the world in
different geography. They use metric and
KPIs to scale and personalize their
marketing campaigns or pricing across
different reason. Let's talk about three
most important KPIs, your customer acquisition cost, your customer lifetime value, and return on ad spend. Let's start with customer
acquisition cost. Now Spotify sell their
premium subscription in different countries
at a different price. They adjust it by
purchasing power parity. A simple example is
that a person in India will obviously pay less than
a person in United States. The simple reason is
disposablele income. The person in India might be earning less than the
person in the US, and that's why they
will pay less for this company or this
brand or this product. But you still need to calculate how much revenue are
they bringing to your brand to how
much are they paying? So customer acquisition cost will help you
understand how much are you spending in acquiring
a paid Spotify customer. Most of them will obviously
going to be free. Then you have customer lifetime value where you need to know how long are they using your product and how
long will they stick by. And you can use churn
prediction model which will simply help you understand if somebody is not
using your app, how likely they will churn. I have a dedicated
case study assignment on this topic on how
do you predict Jon. Third one is written on ADSPend. Obviously, for a customer
to install Spotify, you need to advertise your
app on Appstore Playstore, on Google, on Facebook and
a bunch of those channels. So the KPIs you will be measuring in case
of Spotify is that, how do you increase repeat
weekly listeners by 10%? This is a retention KPI
where you need to improve the retention of users in the app. Then you
have the second one. How do you improve
premium subscriber NPS by five points this quarter? Now, NPS stands for
net promoter score. So anytime if you use a app, you might see a pop up. Hey, how likely will you refer
this app to your friend? That's your NPS pop up or scale. If you rate five star, that means your NPS score for that specific
platform is increasing. One product manager or
marketing manager might have this growth KPI that hey, you need to improve the NPS by five point this quarter with
all the premium subscriber. Third one could be just grow the artist discovery section
by 25% for Zenz cohort. If you see this KPI
is very specific. It is targeting a
specific segment which is obviously Gen Z cohort by 25%, this main idea is to simply
let them discover new artist.
36. Introduction to Normalization: So hey, everyone.
In this course, I will be creating a lot
of case study assignment, and one concept that
you'll be using the most in solving these case study assignment
is normalization. Before I talk about a
case study assignment, so before I give you a
case study assignment, let's understand about
this specific concept first so that you can solve all the case studies
and we will come across this concept over and over again whenever we are solving
a case study assignment. Let's understand the difference between direct normalization and inverse normalization and what exactly it is and why do we
need it at the first place? You will be using
this concept a lot in all the case study assignment that I'll be giving
you in the course. So let's first understand normalization with
the definition, and then I'm going to give
you some real world example to understand it better. Normalization is a way
of converting values on a different scale into a
common comparable scale 0-1. And the main purpose
of normalization is to make sure that a
variable, which is, let's say in rupees
or percentage or in a number holds the same weight when you combine them together. Let me help you understand
this with the help of a very simple example before
I go into the formula. So let's say in your dataset, you have three
important variable. You have delivery time
in number of days. You have a customer rating out of five and you
have shipping cost. Now, if you look at these
three dataset and you need to compare the values in
three different variables, in that case, you
cannot do that. The problem is that all
these three variable has a different scale. For example, your
delivery time might be from one day to let's
say ten days or 15 days. But your customer
rating is 1-5 and your shipping cost could
be from $2 to $20. If you're calculating
in dollars, if you're calculating
in rupees or Yan, then it can varies a lot. So if you have to carefully
compare a specific data set, let's say you have one line item where you need to
compare where exactly the delivery time stands with the customer rating and the shipping cost that
you cannot do that. And that's where you
need normalization. If you have, let's say,
four dataset and you have delivery time in number of
days and rating 1-5 and cost, and in all of these
four dataset, if you want to
compare the dataset, you cannot do that
because remember, the scales are different. The purpose of
normalization is to convert these values from
a different scale into a common
comparable scale 0-1. That means we will simply
look at this value and then just try to create
a new scale 0-1, and the formula is
this X is equal to X minus minimum of X divided by maximum of X minus
minimum of X value. And we'll come back
to this formula, but let's understand
a bit more about it. So if you look at the
normalization table, I have four different
dataset with me. Let's say the dataset
of company A, B, C, and D. I have these four
rows of data with me, and I have their delivery
time in number of days. I have their rating
and their cost, and I need to normalize these value from a
scale of zero to one. So I will use this formula
and I will normalize the value and the value
comes out to be like this. My normalized time is
0.750 0.001 and 0.50. If you carefully
look at the data, one means that all the values 0-1 normalization scale that
are closer to one are high, while all the values that
are closer to zero are low. So if you carefully look at this specific normalized data
set 0-1 for time variable, you will observe that it's
taking five number of days, which is maximum, and that's why the normalized value
is closer to zero. In fact, it is zero. But if you look at this
dataset is just taking one day and the value is
closer to one or exactly one. Three is closer to three is in between and two is at 0.75. That's your normalized time. Similarly, you have normalized rating and normalized cost. So any value is closer to one is considered
on the higher side, any value closer to zero is
considered on the lower side. So if you look at the
normalization score, the company C is the fastest because the
normalization value is one, which is this one over here. Similarly, company B is
the cheapest because their normalization
score is one over here, and company A has the
highest rating because their normalization score
is one or closer to one. Now you might be thinking that if you carefully
look at the dataset, you will realize one
important difference. You always choose
a company that has a higher rating but lower
cost and lower delivery time. How exactly do you
solve this problem? To solve the
problem, you need to understand about
inverse normalization. So we know the formula
for normalization. It's X, which is the new
normalization score. We want you to calculate
for a dataset, which is X. So you simply subtract the
minimum value of X from X, and then you divide that by maximum value of X and
the minimum value of X, which is within your dataset. So if you have a long
dataset over here, you can see that I
have so many values. The maximum is this,
the minimum is this, and I want it to calculate normalization for
a specific data. So now, we know that
we can calculate a direct normalization where the higher value
is always better. Look at variables like rating. If you have a higher rating,
it's always preferable. I mean, it's better to
have higher rating. But when you want to prefer a lower dataset of anything
may be time and cost. If you have low
time or low cost, that means that value is better. Then you have to invert
the direct normalization. The name for this is
inverse normalization. If you want to invert anything, let's say your value is 0.20
and you want to invert this. Well, you can simply
subtract this from one and your inverted
value is 0.80. So when you have to
invert anything, you simply subtract it from one. And that's why in
inverse normalization, we are subtracting it from one. That's where you see that your normalization of rating
was direct normalization, but your normalization of time and normalization
of cost is your inverse
normalization where we first normalized a dataset and then we subtracted
it from one. So where exactly does this concept of
normalization can help us? Well, this concept is
quite useful when you are using a multi
factor scoring model. Let's say you wanted to
solve a problem that has multiple variables
into the dataset, and you need to use those variables to
create a scoring model. For example, when you want
to choose a supplier, for yourself, you will
look at their rating, their delivery time,
and their cost. Now you need a higher rating, a lower delivery time,
and a lower cost. You will do a direct
normalization of rating and inverse normalization of
delivery cost and delivery time. Similarly, if you
have to calculate a banking credit scoring model, in that case, you will
look at their income, debt to income ratio, and credit history length. You need a higher income
where the higher is better. So you will simply
normalize the value 0-1 where higher is better. So any value closer
to one is better. But if you normalize debt to income ratio on a
scale of zero to one, in that case, lower is better, you need to invert the
normalization score. The best way is
subtract it from one. Similarly, you need a higher
credit history length. You need a credit
history of three months, six months, one year, sometime even five years. Higher credit history
length is better, so you don't really have to
invert the normalization. Perfect. This concept is also useful for e
commerce seller as well. In a ecommerce seller, you will look at their
delivery time, sorry, delivery speed, customer rating, return rate, and sales volume. If you guess it, the lower is better in case
of delivery speed. The higher is better in
case of customer rating, lower is better in
case of return rate, and higher is better in
case of sales volume. Wherever the higher is better, you simply normalize
wherever you prefer the lower
value, you invert. Same goes with
marketing campaign. If you're calculating how
good your marketing campaign is performing by a
specific channel or in a specific event, you look at the conversion rate, where if you have a
higher conversion rate, then it's better. You look at the customer
acquisition cost. Lower customer acquisionOst
is always better. So you will invert
the normalization. Same goes with retention, where higher is better and click through rate,
where higher is better. So I know this sounds a little confusing,
but don't worry. Whenever we are solving
these case study assignment, I'm going to use this
normalization concept a lot and I'll be using this formula to calculate
the normalization. So if I come back to
this formula now, let's say you have
a lot of values. Um, if you go back to
the dataset, over here, you can see that I
have four rows of data and I have these
values two, five, one, three, where the minimum is one, the maximum is five and I'm
normalizing a specific value. Let's say, I might
be normalizing two or three or one or five, or in fact, you have in fact, if I have 100 more data into this dataset, I
can normalize that. You need to take the X value that you want it to normalize, you need to figure out
what's the maximum value, what is the minimum
value in that column, and then you normalize
that X value. Over here, the X that I
wanted to normalize is 11.69. My maximum value is 22.78, my minimum value is 3.65. If I have to
normalize this value, then I'll simply write X, which is 11.69 minus
minimum value divided by X of maximum and simply subtract the
minimum value from it. So B three minus B five divided
by B four minus B five. That way, I can calculate
my normalization of this X. Similarly, if you have, let's
say X one, X two, X three, and hundreds of dataset, you can follow the same formula to calculate the normalization. And if you prefer a lower
value to be a better, you simply invert
the normalization by subtracting it from one. Please don't worry if
you're not able to understand the concept just
from a theory perspective. Whenever I'm solving the
key study assignment, I'm going to explain
this concept once again. But I just wanted to create
a dedicated video so that you can come back
and watch this concept again anytime I use a complex normalization
formula while I'm solving all these
case study assignment that you can see at the top.
37. Assignment: Campaign Evaluation – Retention and Revenue: So here, everyone.
Now we are solving one small case study
assignment where we will be evaluating the campaigns that
we are running on Facebook, Tik Tok, Instagram, and we'll be looking at the
revenue of the campaign, the customer acquisition cost, and what's the retention of
the users that we acquired. But first, let me help you go through the problem
statement, the dataset. What do we need to solve and why this case study
assignment is super important and how it will help you solve a
real world problem. So I'll be first taking
you through this document, and then I'm going
to show you all of this dataset and then we're going to solve
it step by step. I'm also going to
explain you all of these variables that are
there in the dataset. Let's go back to the
dogs file. So great. Let's start with the
problem sttment. So let's say you are working in a performance marketing
team at a ecommerce company and they are giving you the
campaigns that they were running in social
media with influences, and they also have some
referral campaign. In this specific data set, you have all of this data, things like campaign
ID channels, how many users were acquired, how much money they spent
in acquiring those users. What was the revenue
and retention? What is the business challenge or the problem that
we are solving? You have all of this
data of this campaign, things like how much they spent, how many clicks we got. Did we converted a user
into a paid user or not? And you also have
some retention data. But the company
doesn't really have insight about this
because they were not able to realize that
if they are making money or if the campaign is actually
performing good or not. Let's look at the
dataset that we have. And I have explained
everything in the talks, but let me show you the
actual dataset first. So you have campaign ID, which is a unique ID for
every single campaign. You have channels in which you
are running that campaign. A channel could be a
referral campaign, an influencer campaign, an email campaign, or a
paid social media campaign. This is the sponsored ad that
you see on social media. Then you have number of users that were acquired
from that campaign, how much money we spent, how many orders we got
from that campaign. What was the revenue
from these orders? And how many of these users actually
retained after 30 days? So if you look carefully, you have these many users that
were there after 30 days. Perfect. Now in this specific
case study assignment, you first have to calculate the customer acquisition cost, which is super simple. We will then be calculating
the return on ad spend, which is a metric to
understand if you're making enough money from the amount
of money you are spending. Return of amount spent
shows you if you're making enough money so that you can spend more money on
the upcoming campaign. Then you have
retention for 30 days, and now you see a unique
term normalization roast normalized retention, and inverse normalization cap. So if you don't understand
the meaning of normalization, I have created a
dedicated video on what is normalization
and how does it work? And in that specific video, I've explained about normalization and
inverse normalization. I highly recommend that you
go back and watch that video, but don't worry, I'm going to explain it in this
video as well. So let's go back
to the data set. So in case if you
don't know about the technical concept or
the variables like CAC RAS, let me explain you using
this specific dogs. So CAC is your customer
acquisition cost. This is the money that you are spending in acquiring
a customer. So if you're spending $100
and acquiring ten customer, then your CAC is $10. Then you have ROAS or
return on ad spent. This is the amount
of money you are spending to earn every dollar. If your company is making $1,000 and you're spending
$100 in the campaign, then your ROAS is ten. Then you have 30 days retention, which is self explanatory. 30 days retention means
that how many users are staking to your platform
even after 30 days. Then you have a concept of normalization and
inverse normalization. Let me explain you with
a very simple example. Let's say there are
so many students in a class and you have their data, things like the marks they
got in their math exam, what's their height, and
what's their body weight. If you look at this dataset, the exam marks are
between zero, 200, height is 5-6 ft or even more than six and weight is between
50 to hundred Kg. If you look at these
three different dataset, they are on a different scale. Weight is in Kg
between 50 to hundred, height is in feet 5-6 and mark is between
zero to hundred. These three scale
are very different. You need to normalize these three scale on
a uniform scale 0-1, where you will look
at the height weight and marks of one student. Compare that with
all the student in the class and give
it a score 0-1, where zero means that that specific student lies in the lower or the higher band. Zero means it is closer
to the lower band, one means it is closer
to the higher band. Whenever we talk
about preference, what is your preference? Will you choose somebody
who is scoring less in math exam or will you choose somebody who
is scoring more? Well, you go towards the
higher normalization score, anybody who is scoring more. How about weight? Will you prefer somebody having lower weight
or higher weight? I would say lower weight,
and how about height? Well, I will choose maybe
somebody who is very tall. You are preferring a student that is scoring really good in exam is really tall
and has less weight. In this case, if
you look carefully, the weight should be less, and that's why you
need to inverse the normalization so that
you can counterbalance it. So if you subtract
anything from one, that is your way to
normalize the normal score. Please go back and watch the normalization video
if you're still confused. And then we'll be calculating
the campaign score by looking at variables like
K RAS and retention, and then we will optimize the budget so that the team can run the
marketing campaign. Now let me go back to the sheet and we can start
solving the assignment. So perfect. I first need to calculate the customer
acquisition cost. The formula to calculate the customer acquisition
cost is very simple. You simply need to
divide your number of users that you have
acquired by total cost. If you're spending $100
acquiring ten customer, then ten is your customer
acquisition cost. The formula is very simple. Then we will calculate ROAS
or return on ad spent. The formula for this
is also very simple. You're simply looking
at the total revenue that you are generating
from a specific campaign and the money you spent. If you divide the
total revenue by the total money you
spent, you have your oAS. Over here, if you
look carefully, the Roas is 1.31, and that's because you
generated close to $31,000 or this value could
be in millions as well. But let's say you
spent 30 you generated $31,000 in revenue and you only spent 24 and your Roas is 1.31. Generally, 1.3 Roas is not great if you are
early stage starter. You at least need a Roas
of three to four times. Then you because generally, if you're spending
$100 in the campaign, you need 300 or $400 in revenue because you are selling a
product at a specific price. You also need to adjust
the cost of that product. For example, let's say
you're selling a wallet at $20 and you spent
$50 in a campaign. So if you generate $400, that means you sold 20 wallet if your par
wallet price is $20. Now, if you're selling
a wallet at $20, obviously there is some cost
associated with the wallet. Let's say it takes you $10 to procure a wallet
from a supplier. Your profit margin is only 50%. So out of $400 you
generated as revenue, you only need to account $200 as your gross
profit margin. You still need to subtract your salary, your shipping cost, your admin cost, and you might end up with five to
10% of net profit. That's why Roas of three to
four times is really good. More than that, it's a win win. Let's look at retention
of last 30 days. The retention data
is already given, which is simply the users that were returning after 30 days and the number of users or unique users you acquired
in a specific campaign. Over here, 3655 users were returning back and you acquired 2162 in a specific campaign. Your retention for 30 days is mostly positive or
on the higher side. In some campaign, it
is not that great, but mostly it's better. Now it's our high time
to normalize the score, and this is very important. I highly recommend
you that you search a normalization video in
this specific course. You watch that first, and then you come back
to the assignment. Because if you don't understand the normalization concept, you may not be able to solve it. Let me first build some context before I
explain the normalization. So how about
normalization of RAS? When you have to
normalize the ROAS for, let's say campaign
number CMP 001, you are normalizing this value, 1.31 with all the
data set you have. And you'll be putting
1.31 on a scale of 021 after looking
at all of this data. Similarly, if you have to
normalize retention and if you're normalizing the
value of campaign CMP 001, then you're normalizing 1.69 out of this complete
dataset or the full column, and you are placing this
data on a scale of 021. Similarly, why are we inverting
a normalization of Kak? The simple idea is lower
Kak is always better. That's why you will normalize
CAC and then you invert it. Over here, higher
ravas is better, higher retention is better, but you need a lower Kak because lower Kak is
better and that's why it's inverse
normalization of so perfect. Now I can quickly use the formula and calculate
the normalization. The formula is pretty simple. In case if you don't know about the formula for normalization, let me open a box for you and show you the
normalization concept. In fact, you can go back and
read about normalization. Perfect. This is the
normalization formula. I highly recommend that you go back and
read this document. So if you have to normalize
X value over here, this is your X value. 1.31 out of all of this dataset, you figure out the
maximum in the column, the minimum in the column, and then you apply the formula. So if you're
normalizing a value X, then you simply use
the original value, and then you subtract the
minimum value from it, and then you divide that by maximum minus minimum of
that specific column. Over here, you first need to figure out what's the maximum, what's the minimum,
and then you use this specific dataset
which we are normalizing. Similarly, you can normalize retention as well by
using the same formula. So we are normalizing Z J two, which is this value from
the complete dataset, and we are looking at the
minimum and the maximum, and then we are dividing
maximum minus minimum. Perfect. And we obviously have to invert the
normalization value of CAC. You can do it in
two steps or you can just do it directly. You can go back to
this document in case if you're confused
about normalization. In the end, we need
to create in the end, we need to calculate
the campaign score. Remember, the effectiveness
of any campaign is a factor of how much money
are you able to generate? What is the retention
of those user and are you spending less
while generating that money? If you go back to this document, I'll show you the formula. So while creating
a campaign score to find out the
effectiveness of campaign, we are giving a 40% weight or contribution
margin to ROAS, a 40% weight to retention, and a 20% to CAC. Now, you might ask why
are we giving 40, 40, 20? Well, I don't really
know the answer. This is mostly a dynamic value that we create using iteration, but I'm assuming that return on ADSpnd is the very
important factor. That's why it's all 40%
of the contribution. Retention is very important. That's why hold 40% and CAC
is somewhat least important, and that's why I'm
giving it a 20%. You can flip these
values as well. Generally, as a data
science student, you try to adjust these
weight and come up to a value which really gives
you an ideal campaign score. But we are not a machine learning and data
science student, so I have simply hard
coded these values. Perfect. K, K two is
my normalized ros. I'm giving a 40% weight to it. Then I have my L two. I'm also giving 40%
weight to retention, and I'm only giving
20% weight to my customer acquisition cost. The reason I'm using
normalized value is because I wanted to put all of this value on
a scale of zero to one. Perfect. I hope now you are able to
understand everything. Now I have given it a
campaign score 0-1. So anybody so you simply look at the campaign score and you
sort it by ascending order. In fact, I have one small
take home assignment for you. Give me top ten campaign
by this campaign score. So try to apply pivotable and calculate the campaign score and sort it by higher to lower value and give
me top ten campaigns. That's one thing that
you can take complete or solve use as a take home
assignment. So perfect. This was our campaign evaluation to understand which
campaign is generating more revenue retention or return on amount spent. Perfect.
38. Exercise 1: Marketing Campaign Performance Analysis: So, hey, everyone. Welcome to the awareness and
acquisition section. This is the first
exercise of this section. And in this exercise, I'm going to give you
a problem statement, the dataset, and I'm
going to give you an exercise objective on what
all we need to calculate. Now, I'm going to
attach the link for this Google Docs and
this Google Sheet, and you can just open this Google Dogs and
this Google Sheet, and you can start solving all of these assignments
by yourself. And not just this assignment. With every single section, I have a take home assignment
that you have to complete. And in between all
of these exercises, maybe I'm going to
skip one or two, and you have to solve that
exercise all by yourself. But let me solve some exercises
for you so that you have a clear understanding of what all will be
learning in the course. So let me solve
all the exercises. Maybe I'm going to give
you a take home assignment by the end of this
specific section. So let's solve
exercise number one, where we have to analyze the marketing
campaign performance. Now, whenever you're selling
product on Internet, you would be running a lot more marketing campaign on Facebook, on Google, Tik Tok, or any other platform. The main purpose of
these campaign is to drive more users
on your platform. I mean, mobile app or
a software product. So you run a lot of paid
marketing campaign on Google, on Facebook, Tik Tok, or any other platform. You pay money on the platform, and they will show their ads, I mean, your ads
to the end user. Now, whenever we
run the campaign, we can also start targeting the audience
by their interest. We can also start
bidding keywords, and we can upload the media and creatives
the way we want. So I hope you have a basic
foundation on how do you build and create a ad campaign. Let's solve this exercise. So we have to analyze
the performance of various marketing
campaigns for a grocery app, and the main goal is to evaluate which campaign provides the
best return on investment. AKA ROI. Now, this ROI
is also known as ROAS, return on ad spend as well. So we have to look
at impressions, clicks, sign up and purchase. In case if you don't
know, impression is how many people are
looking at the ad. Clicks are how many people
are clicking at the ad. Sign up is when they sign up, purchase is when a
transaction happens on that specific
app or a platform. So let's first look
at the dataset, and then I'm going to
explain you each and every parameter of the data set and what's our
exercise objective. So I'll open this excel sheet and let's look at the dataset. Let me zoom in a bit more. Yeah, I hope you can see
the numbers clearly. So we have the dataset for campaigns that we ran on Gmail. So this is an email campaign. You have a social media campaign
data, paper click data, some affiliate campaign data, and a campaign we run
with influencers. And if I have to explain you each and every type of campaign. If you open Gmail, you have a promotional tab. If you want to send
email campaign to a large number of people
based on their interest, you can run a email
campaign using Google Ads. Similarly, you can run a social media campaign using Facebook, Tik Tok, or any other popular social
media platform like Snapchat. Then you have pay per
click where you're paying as the number of clicks. I mean, it depends on the kind of platform you're
running it on. Then you have affiliate,
where you pay a affiliate commission
to the people who are driving traffic or
purchase on your platform. In the end, you
have influence or campaign where you
pay some amount to famous social
media influencers on Instagram or Snapchat, so that they can talk about
your product and they can give a link of
your brand or product, and their audience can
purchase something. So this is the
amount of money you are spending on each
of these campaign. I guess, this is a data for
a specific time duration. Now, this are the number of impressions we got
from these campaigns. For example, after
spending $100, we got 50,000 impression. We got 2000 clicks
and 300 sign up and 100 people purchased
from the platform, and the total revenue
generated was 5,000. So in our dataset, we have different types of campaign where we are
spending some money. We are getting some impression, which means the number of
people who are looking at the we have some number of clicks that we are
getting in the ad, some sign up, some purchase,
and the revenue data. So irrespective of
which tool you use, mostly you get all of this data. For example, if you use
Facebook Ad Manager, it gives you the
total money that you have spent in a
specific time duration, how many impressions,
clicks and sign up you got, how many people purchased a specific product from
your website or app, and what's the total
revenue you generated? You can get all of this data, whether you use
Facebook ad manager, Google Ad Manager,
TikTok or Snapchat. Almost all ad platform
gives you all of this data. In fact, they give
you more data, but I've just cleaned up the dataset and make
things more clear for you. So let's talk about
exercise objective, and let's understand what we need to calculate
in this assignment. The first thing is ROI
or return on investment. Now let's say if you're
spending $1,000 in an ad campaign and you're
generating $5,000 in revenue. To calculate our
return on investment, you're investing $1,000 and
generating $5,000 in revenue. So you simply need to subtract your spending from revenue. You need to divide
that by spending, and that's your ROI percentage. Then you need to calculate
your click through rate, which means if 1,000
people are looking at your ads and just ten
people clicking on it, so you simply need
to divide ten by 1,000 and that's your
click through rate. Similarly, you have
to calculate sign up conversion rate and
porches conversion rate. Sign up conversion rate
means if 1,000 people are clicking on your ad,
how many are signing up. For purchase conversion, if
1,000 people are signing up, how many are making
the purchase? So in this exercise, you
need to calculate ROI, CTR, sign up conversion, and purchase conversion rate. And let's try to
solve the assignment. So when you closely
look at the funnel, it always start with a
big number at the top, and that number reduces down till the time
you reach the bottom. So 50,000 people looked
at your ad campaign. Out of these 50,000 people, only 2000 click on the ad, and out of these 2000 people, only 300 people signed
up and only 100 people. Purchase the product.
And the revenue you generated from these hundred
people is just $5,000. So that's your funnel
that you have from this specific campaign
that you ran on email. Similarly, you have
a social media, PPC, affiliate and
influencer campaign. Now, the first thing you
need to calculate is the ROI or return on investment. So our investment was $100 that we spent
on this campaign. Let me change this
into $1 value. As ROI is known as your
return on investment, which means if you spent $1,000, how much revenue
did you generated? So to calculate ROI, I simply need to subtract
my revenue from the cost, and I need to divide
this by cost, and I can multiply this
by 100 to calculate ROI. And I can just prefill all of this data into other
cells as well. It's perfect. So I have
a 400% ROI from email, 350 from social media, 300 from a PPC campaign, and 300% from influencer. Now, generating this ROI in
2025 is super difficult, and that's why you have to
be much more realistic. So I guess you need to just reduce down the revenue number or maybe increase your spending. But this is just an exercise, and the main purpose is
to teach you how exactly do you calculate these metric
and solve the problem. The second thing you
need to solve is the click through
rate so that you can understand which channel is giving you a good
click through rate. So to calculate
click through rate, you simply need to divide
your number of clicks from your impression and you
can also multiply this by 100 just to calculate
this in percentage. And your click
through rate is 4%, 5%, 5%, and 5%. In fact, instead of
multiplying this by 100, I can also start
converting these values into percentage so that it
looks much more realistic. I can do the same thing
with this one as well. No need to multiply this
by 100 and just add it, change the formatting
into Percentage. Perfect. So your ROI is 400. You click through rate is 4%. Let's also look at the
sign up conversion rate, which means if 2000 people
are clicking on an ad, how many of them are
actually signing up? So to calculate your simple
sign up conversion rate, you divide your sign up with a number of click,
and that's it. You can also convert
this into percentage. So your sign up so your sign
up conversion rate is 15%, 20%, 15 17, and 15%. So you can see that, 2000
people clicked on our email, a email ad campaign, and 300 people signed up. Now, this data is too now, I know this data sounds
too good to be true, but this is just an exercise. The main purpose is
to solve the problem. Similarly, we can also calculate our purchase conversion rate, but I made a small mistake. This purchase is not
in terms of dollar. This is in terms of
number of purchase order. So I'll convert it back
to the default value. Perfect. So 100 people
purchased out of what? 300 people who signed up. So my purchase conversion
rate is this much. I can also convert
this into percentage. So perfect. Now we have
solved the assignment. You can see that
for email campaign, the RI is 400%, the CTR is four, the sign up conversion
rate is 15, and the purchase
conversion is 33. So you might ask me now which one is a better campaign
according to the data. So if I clearly look at the ROI, the email is a better campaign. If you look at the CTR, the CTR is much better in influencer because
influences the people, which we might listen a
little more than, you know, other type of campaigns where we don't have much
information about the brand. When you look at the
sign up conversion rate, it's best in case
of social media. When you look at the
purchase conversion rate, it's great in case
of PPC campaign. But if you simply have to
look at just one number, RI is the number you
should ideally look at. But again, different people, you might have to
use different types of campaign to reach
different audience, and it depends more on you where exactly you spend
more amount of money. So that's our first exercise on awareness and
marketing campaign.
39. Exercise 2: Calculating Customer Acquisition Cost (CAC): So now let's look at our
workbook and let's try to solve one more exercise on
customer acquisition cost. Let's first look at
the problem statement, then we will look
at the dataset, and then we will try to
solve this exercise. And then we'll look
at exercise objective and what are problems
we need to solve. So in this exercise, you need to analyze
the impact of discount on user acquisition and purchase for a grocery app, and our main aim is
to determine how discount level influences
the acquisition cost, the purchase behavior, and
overall return on investment. In the last exercise, we discussed about
return on investment. So I hope you have a decent
understanding about it. So let's look at the
dataset and then we will look at the
exercise objective. So if I show you the dataset, you have five different
campaign type all the way from email to social media to PPC
affiliate and influencer. So these campaign
types are very similar to what we have in the
marketing campaign exercise. Now you have different types of discount that you're giving. So let's say if somebody is coming up from an
email campaign, you're giving them
a 10% discount. If somebody is coming
from social media, you're giving a 15% discount on their first purchase or on their first grocery
delivery order. And similarly, you're giving type of different
range of discount, and then you're
spending this much of money in operating
these campaign. So for example, let's say you're running a email campaign, you're spending
$1,000 and giving a 10% discount to all the people who are
coming from these campaigns. You have impression data. Impression means how many
people are looking at your ad. Clicks means how many people are clicking on your ad
or your campaign. Then you have signup,
the people who are purchasing and what's the revenue that
they are generating. Now, let's look at the
exercise objective. At first, we need to
calculate our cost per signup and
cost per purchase. So how much are you
spending on every sign up and how much are you
spending on every purchase? Then you have to calculate
the revenue p P cheese. The discount ROI means the discounted revenue minus spending divided by spending. Discount ROI and ROI
is very much similar. In discount ROI, you
take discounted revenue. In normal ROI, you
take a normal revenue, and then you need to identify the acquisition efficiency and which discount level
make more sense. So you have to calculate
which discount has the maximum ROI. So you need to calculate
cost per sign up. That means if you're spending
$1,000 on a campaign, and the number of
sign ups are 350, your cost per sign up, I need to change the
formatting to a number. Your cost per sign up is 2.8. Let me decrease the
decimal places. Perfect. That's your
cost per sign up. Let's look at the
cost per per cheese. So you're spending
1,000 and the number of purchases that
you're getting after spending this much
of money is 120. So your cost per purchase
is $8 $5.05 sent and $4.2. Perfect. Let's look at
revenue per per cheese. So how much revenue are you generating from all the Pochis? So you're generating $6,000
from your 120 Po chis. And similarly, I'll click on Autopil and it
autofills all the details, and my revenue per purchase
is $50, 30, 25, 30, and $22 across all these
different types of campaign. Now I need to calculate discounted ROI or discounted
return on investment. Now in the last exercise, we saw that the formula for
ROI is simply your revenue that you are generating minus spending divideed by
spending into 100. Now, in this case, we are generating a total
revenue of 6,000. But remember, out of the 6,000, we also need to subtract the
discount that we are giving. That means I need
to multiply this 6,000 multiplied by my
discount, which is 10%, and I also need to subtract this further from my spending, and then I need to divide
this with my total spending. So what we are doing
here is that we are simply subtracting our total
revenue from the spending, and then we are dividing it by spending to calculate the ROI. So let's say as a brand, if you are generating $500 in revenue just by spending
$100 in an ad campaign. In that case, to
calculate your ROI, you simply subtract your
hundred dollar of spending from 500 and you divide that by $100 of spending and
multiply it by 100. So you simply have
to divide 400 by 100 and 400% is your ROI. And that's what we are
doing over here as well. Total revenue was 6,000 and
our total cost was $1,000. Now, out of the
$6,000 in revenue, we have to calculate
discounted ROI. So we are subtracting
the discount. So 600 minus the discount, which is 600 multiplied
by 10%, which is $60. So we have to subtract
the $60 from the 600, and then obviously
to calculate ROI, we are subtracting the
spending and dividing it by spending to
calculate the ROI. Now, this is in terms
of 4.4 X if you have to just simply calculate this in terms of percentage. I'll multiply this by 100. Or the other way around is just remove this 100 and convert
it into percentage, which automatically
adds up 100 to it. So I can convert this
into percentage. So that's ROI. So 444, one, zero, and 300. So I'm getting my maximum
ROI from email campaign. So that's your customer
acquisition cost exercise. Now, don't worry, if
you feel like I'm giving you all of these
exercises in Excel, I have a proper
dedicated section where I'm going to solve these complex problem
and exercise in a product analytics tool like mixed panel or amplitude
or Adobe Analytics. I'm going to solve these
exercises into mixed panel, but you can use whatever
tool that you like. The main idea of giving you these exercises in Excel
or Google Sheet is because it clears
a lot more doubt and it builds a
strong foundation. And that's the main purpose. Let's move to exercise
number three.
40. Exercise 3: Funnel Analysis - From Impressions to Signups: So let's look at
exercise number three, which is on funnel analysis. So when you look at a funnel, it goes from
impression to sign up, and there are many things
that happens in between. So when you run an ad campaign, you get some impression
on a specific ad. Impression is basically
the number of views or people who
looked at the ad. Then you get clicks. People click on the ad, but they don't do any action. And in the end, you have
signup and in fact, sign up after sign up, you have multiple
things like poaches, retention, activation,
engagement, referral. But let's just focus
on these three step. Impression, click and signup. But the problem statement
is that we have to perform a funnel
analysis to understand the user drop off just from impression to click
and to sign up. Now, our goal is to calculate the conversion rate
at each step of the funnel and see which step is most effective
in terms of campaign. Let's first look at the dataset, and then we will
look at, you know, the funnel and what's the drop off at each step
of the user journey. So I have my campaign number
one, two, three, four, five, and you can just name these campaigns
whatever you want. Let's say you might be running one campaign on Facebook,
one on Twitter, so called X, one on Snapchat, one on Google Ads, on
whatever platform. Now let's look at the
impression clicks and sign up. So in each campaign, each and every platform
gives you impression data, some click data and
some sign up data. So let's try to calculate
the conversion rate. So calculating conversion
rate is super simple here. You simply need to understand
which campaign is giving you more signup when you look at the impression
to sine up data. For example, this is the top of the funnel and this is
the bottom of the funnel. And you simply need to calculate the conversion
from top to bottom, and it is going to
be super simple. You simply divide
your sign up with a number of impression
and multiply this by 100. That's it. That's
your conversion rate. So 10,000 people look at your
ad and only 500 sign up. I think this is not 10,001. This is 100,000. So if 100,000 people look at your ad and only
500 people sign up, your conversion rate is 0.50. And to calculate the conversion
rate for other campaign, I'll simply drag this forward, and that's your conversion rate. I'll suggest you to remove 100. So this is your conversion rate. This exercise is super simple. I don't think it has
anything complicated. Let's move to our
exercise number four.
41. Exercise 4: Channel Attribution Analysis: So hey, everyone. Now
in this exercise, we're going to understand about channel
attribution analysis. So whenever I start up
acquire a customer, usually a customer has
more than one touchpoint. Now, a customer might have seen an ad campaign on a
TV or on a billboard, and then they will see a ad on their social media platform. So one customer can have two or three touchpoint before they actually start
using a product. So in channel
attribution analysis, we simply help the
user understand which source is contributing
most to the revenue. So let's first look
at the dataset, and then we will look at
the exercise objective. In Column A, you
have unique user ID, starting from user ID
one to user ID 30. In Column B, you have
acquisition source from email to
influencer campaign. And similarly, in Column C, you have revenue and Column
D has touchpoint order. For example, you might can send email campaign to
this customer and you can have an influencer or any other type of campaign
to the same user. So if they have seen
the email first, then this would be Touch 0.1. Social media would be Touch 0.2, and influencer would be Touch 0.3. So I think it all depends. Let me scroll through a
little and see if you have multiple Touch points. So yeah. Now, at first, we need
to calculate what is the total revenue from
affiliate campaign, what's the user count, and what's the average
revenue per user. Now, there are two
ways to calculate it. You can simply calculate all
of this using pivot table, or you can simply
apply AL's formulas. Let's first calculate
this using a pivot table. Now, in case if you don't
know about pivot table, maybe I'll give you a
small introduction. I'll simply click on Insert, pivot table, maybe
to a new sheet. I'm going to delete
this sheet for sure. So what is pivot
table and how it is super useful if you know
how to use it right. I'm going to give you a small four to five minute introduction or tuitorial on pivot table, and after that, we'll go back
to our channel attribution. The primary purpose
of pivot table is to simply group and
summarize the data. You can group your data
by different categories. You can summarize it,
calculate average, count. Standard deviation.
You can also apply filters and you can do a bunch of things
with pivot table. Now pivot tables simply
have these four options, rows, columns,
values, and filters. Now rows will simply
arrange your data in a row, column will simply arrange
your data in a column, values will simply help
you summarize the data. So whatever data you
have in rows and column, you can calculate the average, you can calculate the sum
and the count of that data. And filter, as the
name suggests, will simply help you filter down the data that you have
in rows and columns. So what do we need
to calculate first? At first, we need to calculate total revenue by
acquisition source, which means in rows, I will simply choose
my acquision source, affiliate email, influencer
PPC and social media. And I simply need
to summarize it by revenue, and that's it. That's how easy Pivot table is. What's the second
thing I need to do? I need to also calculate
the user count. User count means the unique ID or the total number
of unique IDs. I simply need to
summarize my unique IDs. And these are my unique
IDs by acquisition source. That's it. That's what we
need to calculate here. What else do we
need to calculate? We need to calculate the
average revenue per user. Now, the average revenue
per user means the revenue. I'll simply add revenue
once again and I'll change it to Average, that's it. That's how easy it is to play
around with pivot table. It's super simple,
nothing complicated. I guess pivot table is something that you
all should practice. You can practice pivot
table with any data set. In fact, you can practice pivot table with data
set number one as well. But I would give you a couple of exercises for which you
can practice pivotable. Let me delete this and I'll go back to our
channel attribution. Now instead of pivot table, I'm going to use functions
in Google Sheet, and functions are very similar to how you
use formulas in math. So if you come from
programming world, I'm sure you're familiar
with functions. Now functions are
single keywords that simply summarizes many
things inside them. So let's try
applying a function. In fact, if you're not aware of functions
in Google Sheet, you can simply apply sum
and average functions. So I hope you have a
basic understanding about Google Sheet. And I'm going to show you two simple formulas that you
can apply in Google Sheet. Now, in this case,
we need to calculate total revenue for all these
different acquisition source. Now to calculate total revenue for each acquisition source, I can simply apply
a sum A formula. Now, as the name suggests, sum if will sum the value if
the condition is satisfied. So let's simply use the sum
if function or the formula. I'll simply select
the Sumi formula. And you don't really
have to use your brain. You just have to follow the suggestion and the guide
that the Google Sheet gives. It says that, Hey, first, help me select the
range in which you want it to satisfy
the if condition. So going to say, I
wanted to select a specific acquisition source
in the acquisition column. Now, what is that
criteria or the source? I'm looking for affiliate as a keyword inside all of
these acquisition source. And what do I have to sum? What do I have to sum if
the condition is satisfied? Well, I simply need
to sum my revenue. This formula says that, Hey, go to column B, look for F three or this
specific acquisition source, if this is satisfied, just calculate the sum or
just add up the value. Yeah, that's it. Now it is suggesting me to auto fill
this and I'm going to do that, that's how you
calculate total revenue for all these different
acquisition source. And you can exactly do the
same thing for user count. For user count, you simply need to count the number of users. Instead of sum if you will use countif which simply counts
the number of users. So I'll simply select
Countif and I will select the range and the
value. And that's it. And you can calculate the average revenue
per user by simply dividing your total revenue
from the total users. And yeah, that's it. That's my average revenue per user. So this is super simple. You can do it with pivot
table or you can simply apply your Sumi and countif
and average formula. Now the difficult part is this advanced
touchpoint analysis. Now, one user can have
three touchpoint at max. So for example, if you look
at user with ID number 13, PPC campaign is the
third touchpoint. It's not the first touchpoint. Now the reason I've written acquisition source
three times is because one acquisition source have
three order of touchpoint. So affiliate can have order
one, order two, order three. Similarly, email,
influencer, PPC, and social media
can have order one, order two or order three. I'll simply write the order
and then I will simply calculate the revenue
and the user count. Let me type one, two, three, and I'm going to simply
copy paste the values. There are better
techniques to do it, but I just use the all
boring way to calculate it. Now we need to calculate
revenue and user count. Now, instead of using a
simple sum if formula, I'm going to use some ifs. Now, sum ifs will check
two if condition. So let's apply some Is formula. Sum if is a conditional
sum across a range, and sum if is a sums of a range depending on
multiple criteria. So I'm going to select sum ifs, and now you can see the
recommendation from Google St on how exactly
this specific function work. So what is the sum range? My sum range is my C column. And then I have to
choose a criteria range. The criteria range is
that I'm looking for my acquisition source inside the acquisition source column. So my criteria range is B. Then I have to
choose a criteria. I'm looking for affiliate
inside this column. And after that, I have to
choose my criteria number two. I simply need to check my
touchpoint order and now, this means that my acquison
source affiliate with TouchPoint order number one contributes to $235 in revenue. My affiliate with
Touch Point order two contributes to
$80 in revenue. Similarly, your email,
influencers, PPC, and social media contributes to this different
revenue number. So if I simply repeat
you this formula, some Is will simply calculate sum from multiple if
condition if they satisfy. Now, over here, I'm checking affiliate in the
acquisition source, and I'm also looking at
the touchpoint order. Since simple term, it is simply checking if
this specific value exists in column B and if that value has a specific
touchpoint order. And after that, if both the
conditions are satisfied, you simply create a sum. In this case, we simply
adds up the revenue, and that's how
your sum ifs work. Simply look out for
this value in B, then look at the touch point
in D and simply calculate the sum of the values if both these conditions
are satisfied. Now, similarly, I can also
calculate count or sorry, count if as well, and this is very similar
to your sum ifs work. We'll first look at
the criteria range which is B in this case. Then you look at the criteria. So I first need to check the criteria which is
affiliate in this case, then I need to check if this specific
acquisition source has a similar touch point that
we are looking after. And yeah, that's it. That's how you calculate your user count. And both of these
are super simple. And now you're
able to understand the total revenue by each acquisition source
and the touchpoint order. You can see that your affiliate
with Touch Point Order one contributes to
235 and as expected, your Touch Point order three
contributes to very less, only $80 because your
user is also one. Similarly, you have email with Touch 0.1,
the revenue of it, influencer with Touch 0.1, PPC with Touch 0.1, and social media with Touch 0.1. So now you can look at
the revenue number, the touchpoint order,
and the user count. And we have already
calculated the total revenue, the total user, and
the average revenue per user by the
acquisition source. So this was a
summary and this was a drill down of the summary in case if you
want to know more about it. So that's your
channel attribution. Our primary objective was look at the total revenue
for each acquisition source, the number of users for
each acquisition source, the average revenue per user, and we were looking at the
touchpoint analysis where we were looking at the revenue contributed by each
touchpoint order, which is first second and third and the user
count contribution, sorry user count distribution by touchpoint for each source. So great. This was all about your channel
attribution analysis. In the next exercise,
we'll discuss about segmentation of a new user by a different
acquisition source.
42. Exercise 5: Segmenting New Users by Acquisition Source: Now I'm going to show you one more exercise and
how can you solve it. And after that, I'm
going to give you three assignment that you
have to complete by yourself. Now in this exercise,
we will look at the segmentation of new users
by the acquisition source. So we have to perform advanced segmentation
analysis of the new users by their
acquisition source, and we have to evaluate which acquisition
source contributes to more signup and purchase. We will also look at the
purchase behavior of these users by
simply understanding their average order
value and the time they took to place
their first order. Because even after sign up, people may not place their first order and
they have to wait for 24 hours or one day or two day to get the
first order placed. We'll first look at the dataset, and then we will look at
the exercise objective. Our main objective
is very similar. We have to calculate
the total signup, the total purchase,
the conversion rate, the average order value, and the average time to first
purchase in terms of days. So let's look at the dataset. In this dataset, I
have my user ID. I have my acquisition source. I have the sign up data,
the purchase data, and the order value, and
the time to first purchase. So if I'll just give
you a simple example. In case of our user ID one, the acquisition sources email, he signed up for the product, but he never made a purchase. He never placed the order, and time to first
purchase doesn't exist. Now for user ID with five, this person cames from
influencer campaign. This person did sign up. He did purchase a product. The order value was $50 and
the time it took for him to purchase or time to
first purchase was 60s. That means it took this person six days to
place the first order. And same goes with other
specific data set. So for customer with customer
ID 15, you have one, one, one, 52, it took him two days
to place their first order. So let's start the video by calculating the total sign up. So with total signup, we simply need to add all these ones by the
acquisition source. And whenever you have to add a sum by different categories, you simply apply
a sum a function. Si function suggests that
if condition is satisfied, you simply add up the value. So I'll simply choose
this function. My range is B, my criteria is that I'm looking out for H
two inside the B column, and if that condition
is satisfied, simply add up the
value. And that's it. That's my total
number of sign up by each acquisition source. Luckily, it's 15
for all the cases. Now let's do the same thing
for our total purchase. For total purchase, I can
simply repeat the same formula, but this time, I need to simply change it from sine
up to Purches. I'll say it's going to be B where I'm looking
out for this value, and this is going
to be Etch two, and I'm looking out for Purches, which is D. Yeah, that's it. My total purchase is there only for people came from a
influencer campaign. Now I need to calculate
the average order value. Now I need to calculate
the average order value. Now, average order value
can be calculated by simply dividing your total order
value by the number of orders. So you have your order
value in column E, and you have your
purchase in column D, and I simply need to calculate
the average order value. This, I'm going to combine
two simple formula. I'm first going to
validate if there is a purchase for a specific
acquisition source or not, and if there is, I'll simply
apply a sum a formula. Let me first apply if formula to check the value if
I have some value, and this is equal to zero, then simply type zero. But if this is not there, then I need to
calculate the sum I. Now this formula sees that if your total
purchase is zero, then your average order
value will also be zero. But if that's not the case, then use a different formula
or function like sum if and now I'm going
to calculate sum of if if the condition
is satisfied. In this case, my acquisition
source, which is the range, I'm looking out for this
specific value in the range, and if that's the case, just simply add up the value. Because I'm calculating
average order value, I now need to divide this
with my total purchase, and this is total number of purchase. And yeah, that's it. So only my influencer
acquisition source or acquisition campaign has a total purchase count for 20, and because it has a
total purchase count of 20 and a total sine of 15, this was having average
order value of 50. Let me repeat this formula
in case if you're confused. So I first validated the condition that if there
is a value in total purchase, then only the
function will apply. So if your J four
is equal to zero, in that case, just type zero. But if that's not the case, then simply use this function to simply calculate the
sum of my condition. Sum F will simply calculate the sum pair if
condition is satisfied. So I'm looking out for at two as my accusation
source in column B. And if that's the case, then simply just add up the value. Okay, so what's
the formula here? So I simply validated
this first, then I calculated the average
if the function is applied. Now, in average
time to purchase, I'm looking for how much
time will it take for a user to place their first order by
different acquisition source. So by influencer, it is taking almost four days to
place their first order. So I simply calculated the
average time to purchase. Now, similar way, I can also calculate the conversion
rate as well. Now, conversion rate can
simply be calculated with your total purchase
by total synu. But before that, let's first
validate the condition. So if your purchase
is equal to zero, then type zero and don't
validate the condition. Then simply divide your
purchase by total sinu. So my total purchase is zero. I need to divide this by
total number of signup, and I can also
multiply this by 100 just to calculate the conversion rate in terms of percentage. And, yeah, that's it.
Only influencer has 133 percentage or 130
3% as conversion rate. This doesn't sound correct, but let me see if
I can fix this. So total sign up
did 20 purchase, I think the number of purchases are way more
than the sign up. So there are some customers
who did multiple purchase, and that's why this is
coming more than 100. So this data is in terms
of percentage or 1.33 X. So that's how you calculate all of these different metric. I know this assignment is
slightly more difficult, so I advise you to
practice these formulas. So if, average if some
ifs and average ifs. The next assignment
is going to be super simple and we'll also
discuss about that.
43. Exercise 7: A/B Testing for Landing Pages: Now let's look at
exercise number seven on EB testing
for a landing page. Let's say on your website, you have two different
landing page, landing page A and
landing page B, and you're running
some EB test to check which landing page is having
more number of clicks, signup or in fact purchase. Now, you can create different landing pages
for signup for Purches, and even for post
purchase as well. Just to see which
is more effective. So you can change the
color of the button, you can change the
content structure, and you can change anything
you want in a landing page. The primary purpose is to simply check which landing page is more effective in terms
of conversion and purchase when you
yourself are confused. AB testing works really great
with large amounts of data. If you're having thousands
or even millions of people on a landing page, then AB testing works great. Now there are multiple
tools that can help you AB test these
different landing pages. Optimizely is one tool
that is very popular. In fact, there is a tool from Google Analytics or Google
as well that simply changes the HTML
content or it simply allows you to route the traffic into
different landing page. Long story short, Landing page
will simply help you test which variant is driving more conversion and more
revenue to your brand. There are plethora of tools
that can help you do that. Now, in this case, let's first look at the problem statement, then we will look at the dataset and the exercise objective. The problem statement is
that we are conducting AB test analysis to compare the performance of two landing
page, Group A and Group B, and the goal is to
identify which version of the landing page has the higher engagement
and conversion. With engagement, I mean clicks, with conversion, I mean sign up. In fact, they can also add revenue as a part of the
problem statement as well. In the dataset, I
have my user ID. These are unique user ID
that are tied to a user. I have my group A and B. I have the number of clicks, the number of sign up purchase, and time spent on a page. This is also known as your session duration
in simple term. And in the end, you
have your revenue. So for user ID one, group A, these people
landed on a landing page. So the impression is always one, but they haven't clicked on it. They didn't sign up. They
haven't made any purchase, and the revenue is zero. The time they spent
on the page was 130 1 second, close
to 2 minutes. Now for user ID four, they saw the landing page with
group B or the variant B. They clicked on this, but they haven't made any
purchase or sign up. And when you look at a data where they have made a purchase, so these people were
already logged in. That's why they directly made a purchase. They didn't sign up. Or, in fact, there
might be a possibility that these people never signed up and just made a purchase. Let me look at the dataset
where everything has happened. Let me see if there is
any short of that data. Yeah. User with ID
32 with variant A, this person clicked
on it, signed up, made a purchase, and
the revenue is zero. How can the revenue be zero
if they have made a purchase? I think there is a fundamental
flaw with the data, but let's simply still
calculate all this data set. It should not happen, I think. I don't know why
it's there because every time you made a purchase, there is always some
revenue added to it. Maybe I think I miscalculated
this data, but that's fine. Let's try to complete
the assignment because the main goal is to understand the core problem statement that
we are trying to solve. So at first, we
need to calculate the total number of users. The simple way to do that or I think there are
two ways to do it. You can use Pivot table. I recommend you to use
Pivot table as well, or you can simply apply
Sum A or average formulas. Let's simply apply account
formula to calculate the total number of users. I need to simply
check column group, and I need to check
how many of A variant are there and how many
of B variant are there. That's it. That's how you can calculate the total number
of user with variant A and variant B or group A or group B. I think group is a
better term than variant. So for group A, I have 144 user, for group B, I have 161 56 user. Now I need to calculate
the number of clicks. Similarly, you can calculate
the number of clicks, the number of sign up,
the number of purchase, average diamond
purchase, total revenue, average revenue per user, click through rate, sign
up rate and purchase rate. I think I will
still give this as a take home assignment
because this exercise is very similar to how we have solved other assignments
and exercises. So just try solving
this by yourself. It will improve your foundational
understanding of a concept, and you can also practice this. If you're not able to solve it, I'm going to attach the
assignment solution as well.
44. Exercise 8: Evaluating the Impact of Discounts on Acquisition: Now let's look at
exercise number eight. In this case, we
first have to check the impact of discount
on acquisition. So if you go to the data, you can see that you have
different campaign source. You have the discount
that is being offered. You have impression, click, sign up, purchase, revenue, and the money you spent in generating
this much of revenue. So you have campaign source, the discount that you're offering for that
campaign source, the impression or the people
who have seen the ads, the number of people
who have clicked on the ads, then sign up, then purchase, then
the total revenue, and this is your
acquisition cost. Now you need to calculate
all of this data, and it's going to
be super simple. I think we already did this. So first, you have to
calculate the total spending, and you can simply calculate the total spending by
the discount offered. You simply have to
apply a sum formula. So you simply need to
calculate the sum of this column etch
by this category, or this is your criteria range. After that, you need to
calculate the total revenue, which is simply your total
revenue by your discount. Category, and your
total impression, you simply have to
create it like that in total click signer
purchase, CTR, and signup. This is very much similar what we did in the
last few videos. In fact, I would recommend
you to use Pivot Table in this specific assignment because let me show you a glimpse
of the pivot table. And how pivotable is going to
make this job super simple. So I am looking for rose with the discount that
is being offered. And now I need to calculate
the sum by click and by revenue se Impression,
it's perfect. I have my sum of click, some of sign up, and
some of revenue. And you can also calculate
other metric as well. In fact, you can simply
calculate your CTR, which is your click
through rate. You can calculate
your sign up rate, your purchase rate, and ROI. So yeah, this is going
to be super simple. I would really
recommend you to solve this exercise on assignment
all by yourself. I'm going to delete this
pivot table from this. And yeah, in the end, you have one take
home assignment, which clubbed all the
small small assignment that we have solved so far. So in the ninth exercise, you have your take
home assignment, which is a comprehensive
analysis of this specific section on
marketing and acquisition. So if you look at
this, I have clubbed almost all the concepts that
we have learned so far. So you have your tampin,
let me zoom in a bit. So you have your
campaign source. You have your
acquisition source, you have discount offered, impression, click,
sign up purchase, spending revenue, time
on page and group, which is your group
A and group B. These are your
lending page variant. So we have combined
your campaign, your discount offered,
your time on page, which is time you
spent on a page. In fact, one thing that I have missed is adding time
to first purchase, and then I have also added
your AB testing as well. So you can see that this
dataset is quite good. It contains all the
variables that you need, and the thing we
need to solve in this is the total impression, total click, sign up, purchase, CTR, sign up rate, purchase rate, total revenue, total spending, and ROI. And yeah, this is going to be a super interesting assignment, and I'm sure you guys will learn a lot if you're able
to complete this. Great. Just try completing it. I'm going to give you the solution for all
of these assignment, but I still want
you to complete it because if you are able to complete this
take home assignment, all the concept in
your acquisition and awareness will be cleared. If you're able to
solve this take home assignment all by yourself, then you have clearly understood all the concept in awareness
and acquisition stage, and then we can confidently move towards the next section.
45. Introduction to Market Segmentation: So Hey, everyone.
Now we are starting a new module in the course
and in this module, we will discuss about customer
and market segmentation. Now, after completing
the first section, I hope you have a really good
foundation about marketing. So in this specific module, we'll first understand why segmentation is important in marketing and why it matters. After that, we'll talk about
the different ways you can segment your customer like
our demographic technique, our behavioral data,
or psychographic data. After that, we'll talk about K mean clustering
technique for segmenting your customer and
then we'll talk about RFM and LTV based segmentation. Now, these are just different
ways to effectively segment your customer so that
you can target them better and make the
marketing more personalized. After that, we'll
talk about how do you create customer persona
from the help of data? And in the end, I always give one case study
assignment with every single module
that I create just to make sure that you're not
just learning the concept, but you are also solving some real world
problem. So perfect. That's the overview
of Module two. Let's start with our first
video of this module. And whenever I
start a new module, I always try to create
a video Uh, like, explain me like I'm 5-year-old, just to explain all
the concept and topic in the first video in
oversimplified manner.
46. Segmentation Made Simple: So great. This is
our first video of this section or
module number two. Now, in this video, I'm
going to oversimplify all the topics that we will
be covering in this module. Now, the reason I create these oversimplified
videos every time I start a new section is
because I believe all of you are not
expert in this domain, and many of you are new
to marketing analytics, and that's why building a strong foundation is
really important. Now, these oversimplified
explanation of each and every concept make it easier for you to relate these concepts
with these stories. And that's why I create
these explain me like I'm five kind of videos every
time I start a new section. So the primary purpose
of this video is to simplify all the topic that we'll be covering
in this module. So let's understand this concept with the help of an
interesting story. Let's say you open a toy
store where you have different kind of toys from
robots to crayons to dolls, you have different
variety of toys, and hundreds of kids walk every single day
in your toy store. Some of them like puzzles, some like robots, while some
just want these shiny dolls. But you don't exactly
know which kid like what so sometimes you end up showing robot toys to a kid who
just like coloring book. And that's a problem
because you are showing a wrong toy to someone who
doesn't really need it. So what should you
do so that you do not treat every single
kid the same way? And you show them the kind
of toys that they like? The answer to this
question is that, Hey, can we group our customer and show them the
toys that they like? And that's where
your first topic will come into the picture. It's called segmentation,
where you group your customer the way
we usually sort toys. So if you have used
crayon as a kid, when we purchase them
for the first time, all of them are arranged
in a proper sequence. But once we start
using them, obviously, the color will shuffle and we
usually mix them together. And this is how
your customers are. And very similar to that, this is the same feeling that store owner will have once random people start
walking into the store. So that store owner has to put the customer in
every single group. And this is very similar to how you arrange your crayon
in a specific box. Like you put red first, then green, then blue, then white, then yellow. And just like that,
you need to arrange your customer into some
groups or segment as well. But the question is, how
exactly do you do that? Well there are multiple
techniques that a person can follow to group
these different kids based on their interest. One single parameter could be simply their age.
How old are they? A kid who is one to 3-year-old
will obviously need different kind of toys versus a kid who is three
to 5-years-old. And I'm sure you will find
a good number where you can show those particular kind of toys based on their age. That's one way to
group these customer. It's called as a
demographic characteristic or demographic grouping. The second technique
is what they buy. If you have some data on what these customer or kids have
purchased in the past, you exactly know
about their interest. Similarly, you can also recommend
the right kind of toys. Third technique
is psychographic, which is very difficult to understand,
especially with kids. So instead of showing
random toys to random kids, you are showing the toy that
these kids actually want, and all of them are now happy. But the problem is, well, how exactly do you
find these groups? Like, there are
thousands of kids walking into your store
every single day. How will you start
grouping these kids and start showing them the toys
that they actually need? I mean, it's practically
impossible, right? Can we use some computer
to sort them out? Maybe not for a retail store, but in a digital world
where a lot of people are using your
website or your app, that's where you can just
personalize their experience, and you can sort them with the
help of so many technique. One of them is K
mean clustering. This sounds complicated,
but it's not. The main idea here is that you are using a robot helper or a computer that looks at the data of all of your
customer in this case, kids and look at the pattern on what they
have looked in the past, what they have purchased, what kind of categories
do they like, and then group them together
into individual clusters. For example, there could be kids who just wanted to
explore robot toys. They are picking up five,
six robot toys every other week and they are purchasing
one robot toy a month. That case, you can
create a cluster of kids who exclusively
like robots, but very few of them also like dolls and so many of
them also like dolls, you can obviously create
one cluster of dolls and these two clusters might
overlap with each other. That is known as your
key mean clustering. We'll come back to this topic. Obviously, this topic
need a dedicated video. But right now I'm just
oversimplifying the concept. So this robot or computer simply group these kids interest into clusters because these kids should have something in common. Consider this robot
having a magic class. It can look through your
customer and put them into a cluster so that it is
easy for you to group them. But this one small doubt
that we still have, how do we know which of these customer is actually
important for us? Like which of these
customer will drive revenue or will
actually purchase? Let's understand how do we know which
customer is the best among all the customer we
have in different clusters. And to understand that, we
will talk about RFM and LTV. And I'm sure you have
studied about LTV as a concept in the first
module, if I'm not wrong. So when you look at
all of your customer, whether you run a
ecommerce company, a retail shop, or anything, all of the customer
are not the same. Some people buy very frequently from you in case
of retail store, some people might walk into your store every single
day to buy something, while some people might visit your store once in a
month or once in a year. So not all customers
are the same. So how do you exactly know
which customer to prioritize, what to offer, and how can you increase your
overall revenue? To understand that, you
have a concept of RFM, recency, frequency,
and monitory. You will analyze your customer on how recently have
they purchased, how frequently have they
purchased from you, and how much have
they purchased? Do they spend a lot or do they just buy a
very small thing? And if a customer have
a high RFM score, that means they are purchasing
more frequently from you, more recently from you, and they are spending a
good amount of money. You already know about LTV. LTV stands for lifetime value, which simply means how long
the customer is sticking by you and how much lifetime
value they are bringing. It's just a revenue um metric that simply look at
your average order value, frequency of purchase multiplied
by retention duration. So great. After doing RFM
analysis and LTV analysis, now we know one of
the kid is our VIP. I mean, this kid is
purchasing a lot. That means this kid is
probably convincing his parents to walk
in into the store every single day and
just get him some toys. So we need to take special
care of this kid because he's at the top of the leaderboard. Perfect. Now we know which
customer is more important. But we still need to understand
about this customer. What exactly does
this customer want? We have now grouped
our customer, segmented our customer know
why it is so important. The next topic is
profiling the customer, and that's where your customer persona come into the picture. I think this is something
that you should do first, but I came to realize that when random
people are walking in, you first have to
look at their data and identify some
clusters and then you can start profiling them
based on their history. Now, in profiling,
you already know the cluster in which
your customer exist. You just personalize
their experience more. For example, we have a cluster where kids purchase storybook, or they are just
picking a storybook, looking at it, and then
just dropping them off. We are looking at storybook. Now we want to know what kind of now the main
purpose here is to personalize the
recommendation for them so that they see the right kind of storybook that
they might like. For example, Discount Disney is one marketing campaign that we can run to make sure that we are marketing the so now we have our cluster and we know which customer is most
valuable for them. Next thing we'll do is
create a cluster profiling, also known as creating customer persona on
how do you personalize the experience for
different people inside the same cluster who might have a
different interest? That's where your
cluster profiling and persona is very important. We'll obviously
understand more about it. But once you have your customer
profiling ready with you, then you have to run real campaign to make sure that you are
promoting your brand, you're generating the revenue, and dropping a right messaging to people so that they convert. Because remember, the
main job of a marketer is to make sure to personalize the campaign
and drive the conversion. You give right discount
coupons to people, right promotional
images, pictures, advertisement to people
based on their interest. Anything from email marketing to ad targeting to loyalty program, you show the people
what they exactly need. And great. This is the oversimplified explanation
of our first topic. I know the video is super long. It doesn't have
to be, but I just wanted to build a strong
foundation for everyone, even if you're new to
marketing analytics, and that was the main purpose. Now, from the next video, let's start understanding
each topic one by one. And obviously, we have so many
case study assignment and exercise that you can do so that you are not just
learning the concept, but you're also solving
real world problem. And these kind of
similar problem, you will also see once you start working working in corporate
or in actual company.
47. The Four Major Types of Segmentation: So great. I hope
after first video, you have a really
strong foundation about customer and
market segmentation. This video we understand
about different ways to segment your customer
and market and why they are so
important in marketing. Let's understand why
segmentation is important in marketing and then
we'll understand about different ways to
segment your customer. So imagine you start treating all of your
customer the same. You are sending them
same kind of email, you are sending them
the similar kind of push notification, and you are just showing
them the same kind of ad. The result is obvious. You will have a low
return on investment. The simple reason is that
if you don't segment your customer really well and
personalize the experience, you don't see much engagement
or even conversion. So the problem is that if you start sending same
message to everyone, it will obviously leads to lower engagement and increase
your acquisition cost. Same goes with product
pricing, messaging. If you start showing the
same kind of product to people across
different geography, with a similar kind of pricing, you will not see much
conversion and engagement. The simple reason is that different people across
different geography, age group have
different interests. So the solution is you
need to divide the market into meaningful groups
based on people's needs, traits, behavior,
or characteristic. And then you need to
personalize the messaging, target each segment with
different campaign, and make sure you are able to achieve a product market fit. The main idea of segmentation is that it can help you sell better and smarter by aligning your values with
the right kind of audience. So let's understand what is customer segmentation
and why is it important? So customer segmentation is an idea of dividing
your customer base into distinct group based on the shared characteristic or traits like demographic
characteristic, behavioral characteristic,
or psychographic. And we learned about
the same concept in our first video as well. The main goal is that
if you categorize these different customer based on their shared characteristic, you can target them better. Whatever campaigns
that you're running, you will have much better
return on investment. You can personalize these
product and you can improve the retention of these customer on your app platform website, whatever you have because you have properly segmented
your customer. The business outcome we
can expect from this is that you have right
persona to do marketing. You are sending
different email or different kind of content in the same email for
different segment, and similarly, you are pricing your product differently for different segment and geography. So let's talk about four
core segmentation types. And if you come from a
marketing background or marketing
analytics background, I'm sure you have
already studied this concept so many times. When we talk about
market segmentation, you have four important
key pillar demographic, psychographic, behavioral,
and geographic. Let's understand about
these one by one. The first one is demographic. You are simply segmenting your customer based
on their age, gender, income, and
marital status. The simple reason is that when
you look at any platform, maybe a ecommerce company, a grocery delivery company, a food delivery company, whatever they purchase from your brand is largely
dependent on their age, gender, income, and if
they are married or not. And this way,
obviously it's very difficult to categorize and
find out this information, but there are simple patterns
that you can look into, and we'll come
back to that topic obviously in the coming videos. Second is geography. If you're running a brand that operate in multiple cities, even in multiple
countries, in that case, you need to segment
your customer based on their climate, reason,
city, interest. For example, a person
in San Francisco versus Miami will expect a
different kind of fashion. Third one is psychographic, where you look into
some lifestyle, interests, values
of these customer, and then try to find out their segment or
predictive behavior. In the end, you have your
behavioral segmentation on what they have
purchased in the past, how they have engaged
with your app, and what kind of product they
might end up purchasing. Now, if you carefully
think about it, you can't really have a clear
demographic geographic, psychographic and
behavioral segmentation. Many many times a customer is often layered together across these different
customer profile, and that's why understanding
segmentation is important. So first, we'll talk about
demographic and geography and then we'll talk about behavior and psychographic segmentation. And after that, we'll obviously study about other
techniques as well. So as the name suggests, in demographic and geographic, you're simply looking for a customer profile in
terms of their age, interest, value, gender,
and where they stay. When you look at a
insurance company, they usually plan their
insurance by age group. If you're elder, obviously, chances of you getting
a claim is really high, they will increase the principal amount and even the interest. Then credit card, if you
have a really good job, the kind of money that you can get from your credit
card will be very high, and they obviously have
so many parameters to include apart from you having
a good job like your age, your credit score and a
bunch of other thing, but income is one
of those parameter. Education is also one
of those parameter. These are usually
your demographic and geographic segmentation, where a credit card company, maybe a company who sells some fashion
item or grocery item, look into these characteristic. Similarly, geographic. Geographic is much more relevant if let's say you
have different temperature, different climate in different cities in
a single country. In that case, you have to
personalize your clothes, your branding, your marketing, everything for these
two different customer. So that's your demographic
and geographic segmentation. Then you have your
behavioral segmentation, which is based on the behavior on what exactly a customer do, not just who they are. So in behavioral segmentation, you're looking at the
purchase behavior of your customer in the past if
they have done any purchase. You're also looking into how often are they opening
your app or website? How frequently are
they purchasing? How much are they browsing and which category and product are they browsing
on your platform? The main idea is
that you're trying to understand their
purchase frequency, the categories and the
product that they like. How recently have they engaged? And what device are they using? Are they using an expensive mobile phone or a
cheaper device? Because that also can help you understand which kind of
product can you offer them. A really good example of behavioral segmentation
is cart abandonment. Anytime a lot of people who add a lot of product in their card, and if they don't check out, you usually send them
an email saying that, Hey, we can see one
item in your card. How about you checking out?
We can give you 5% off. That's one example of
behavioral segmentation. Another example is that you have a power user who
purchase a lot of item from you and he's not engaging and you are
launching a new sale. Then you should tell them, Hey, you have bought this
much of items from us, we're giving you the best
discount and the best product. Why don't you purchase?
Then you have loyal customer one
time discount buyers. When you look at the
targeting for each customer, you can use their
behavioral data and segment them really
well and then you can personalize your card
abandonment email or marketing email or launch email or anything in general. The next one is
psychographic segmentation, where you want to
understand their mindset, like their personality,
their lifestyle, attitude, fitness,
or social status. Now some of this can
be understood with the help of their income data
and the place they live. But still, psychographic
segmentation is all about understanding
their attitude, lifestyle, and
personality trait, which is really difficult
to understand, honestly. But there are still
ways to understand it, if they are browsing through
eco friendly product, that means they are
very eco friendly. They need organic product
more than in general product. Also, you can look
at their trend, the kind of clothes
they are purchasing, or the products that
they are buying, just to understand what is their lifestyle
and social status. And psychographic
segmentation has very good application for some fashion brands or some ecommerce brand who is
selling you clothing items. So can tailor the
product, the categories, and the catalog for these
people who are browsing through your platform. Perfect. That's your psychographic
segmentation. Let's talk about
segmentation by values. Now, apart from these, another way to segment, which is obvious is your RFM and LTV. So if a customer has
recently purchased, has purchased many times and
spending a lot of money, they will have a high RFM score. These are loyal customer. You should win back and you should try to cross
sell the customer. On the flip side, if a customer has a higher customer
lifetime value, if you don't know the formula, customer lifetime
value is simply your average order value
multiplied by your ticket size, multiplied by the
number of month or EOs the person
is with your brand. So if they have a
high lifetime value or revenue contribution to you, in that case, you need
to prioritize them. The main idea is that 80% of your revenue comes from
20% of your customer. That's the parato principle
which applies everywhere. 80% of food delivery revenue in your country comes from
20% of your customer. 80% of fashion purchase is
done by 20% of your customer. 80% of Income tax is filed
by 20% of your people. Parto principle is applied
almost everywhere you see. The main conclusion is that when it comes to segmentation, you need to segment
your customer really well so that
you can target them, drive engagement and retention, which will eventually
increase your revenue. From the next video, we'll
understand about RFM analysis. Also stands for recency,
frequency, and monitory.
48. Introduction to RFM Analysis: So great. In the last video, we discussed on how you can segment your customer
by their demographic, geographic and psychographic
characteristic. In this video, we will
understand how you can segment your customer by the value that they provide to
your company or product. In this video, we'll talk about customer segmentation
using RFM analysis. This is a really important topic when it comes to
loyalty management or understanding about
the value that each customer segment
contributes to your brand. But before that, let's
understand how does segmentation drives revenue
and retention to your brand. So most of the businesses treat all their
customer the same. They send same kind of generic messages
to these customer, whether they are loyal
customer or inactive user. And when you do that, you
eventually waste your budget, and it will lead
to poor results. And that's why you need to do a personalized
segmentation messaging. Because without segmentation,
marketing is less personal and less effective and you're simply relying
on the guesswork. The solution to this
problem is RFM analysis, which stands for recency,
frequency, and monitory. It simply group your
customer on how recently have they purchased
any item from your brand, how often they are
purchasing those item, and how much money
they have spent. So recency means how recently have they
purchased the item. Frequency means
how often are they purchasing and monitoring means how much money have they spent? And this specific technique
will let you treat your loyal customer at risk and inactive
customer differently. And I'll give you examples so that you understand about it. But first, let's understand
what exactly is RFM analysis. So RFM stands for recency
frequency monitory. It's a simple behavioral
base scoring method, which is used to
segment your customer. Based on their
purchase behavior. RFM is not just used
for segmentation, it is also used for loyalty
management as well. So all of your customers who have recently
purchased the item, buying from you more frequently and are spending a lot of money, you want to give some loyalty
program to these customer. You can make them gold member, platinum member,
whatever you want. But the main idea is that
based on their recency, frequency, and monetary score, you put these customer
into different bucket. So recency score
will simply tell you how recently a customer
has made a purchase. Frequency score will tell you how frequently they
have purchase, and monetary score will help you understand how much are they spending with
your brand in total? Now we'll obviously understand how do you calculate
a recency score, frequency score,
and monetary score. But let's understand how
exactly does RFM analysis work? Long story short, RFM is one of the most widely adopted
effective segmentation technique which is used for customer
relationship management, ecommerce, and SAS marketing. And let's understand how exactly does RFM
scoring method work. So in RFM analysis, we assign a score to each
customer on a scale of one, two, five based on their recency,
frequency, and monitory. So we'll first sort the
customer by their recency. That means all the
customer who have recently purchased from their brand we'll look into all of the data, create five different bucket, and put customer equally across these five
different bucket. Let's say if you have
handed customer, you might find probably
2030 customer with a recency score of five people who have
recently purchased from you. People who have purchased people whose last purchase
was six month or one year, you might give them
one recency score. Similarly, you rank
your frequency or by number of purchases. All the people who have purchase more frequently or more number of
times from a brand, they will get a high
frequency score of five. People who have purchased just once might get a lower
score, maybe one. Same goes with monetary. People who have spent
a lot with a brand, they will get a higher score, people who have spent less, they will get a lower score. So that's your recency, frequency and monetary score, and it's a three digit score. When you look at a
top tier customer, they will get a score of 555. That means they have recently
purchased from your brand. They have more
frequently purchased these item and they have
spent a good amount of money. Sopla Catalis, this
person is your top deal. Then you have Bob who have
not recently purchased, probably purchase a month back, but is more frequently purchasing and is spending
a decent amount of money. And that's why you gave
Bob as a score of three, four and two, and the
RFM score is 342. Same goes with Clara. Clara has not recently purchased anything. She purchased
almost a year back. She's not very frequent, she rarely orders from the
brand and monitor is one. You can see that these are three different customer
where Alice is the top tier, most loyal customer, which is super important
for the brand, and Clara is the
least important. So least important customer
have lower RFM score, most important customer
have high RFM score. And obviously, we're going to solve one case study
assignment to understand this.
49. Case Study Assignment – RFM Analysis for an E-Commerce App: So, hey, everyone.
Now in this video, we're going to solve one more assignment exercise
with some dataset. Now, the main purpose
of this assignment is to help you understand how do you work with
customer segmentation and RFM analysis? And these kind of
problems are more popular in ecommerce or
in retail management. So if you are looking for a product management job in ecommerce company or
in a retail company, in that case, this is a really nice problem
that you can solve. Now, when a company look out for product manager
in a specific domain, in that case, they gives you specific problems
as well to solve. So for example, the RFM and the customer segmentation is a big problem related
to retention. So if a company is
looking to hire a person who can work with different business
team on retention and boosting the
customer lifetime value, then they might give you these
kind of problems to solve. So first, I'll read through
the problem statement, look into different
business challenges, then I'll also go
through the data. And after that, I might spend five to 10 minutes explaining you the concept
of this assignment, and then I'm going to solve it. And not just that, by the end of these couple of assignment
solutions that I have given, I'm also going to give you a few assignment that you
have to solve by yourself. So maybe by the end of
these all assignment, you might find a
link where you have to solve three or four
assignment all by yourself, and that will really build
a strong foundation. So first, I'm going to solve these four or five
assignment in this section, and then I'm going to
give you a 34 assignment that you can solve by yourself. So let's start with
this assignment. Let's look into the
problem statement first. So you are a product manager at a fast growing
ecommerce company, and the marketing
team has noticed that the customer retention
rate is declining, and they struggled to
identify which customer to target and which promotion and personalize
campaigns to run. Now, as a product manager, your goal is to develop a
customer segmentation strategy that helps you optimize the marketing spend and improves
the customer retention. So our goals are pretty clear, and we need to identify high value customer that brings most of the
revenue to the business. Now, the business challenges
that the company currently sends generalized
marketing campaigns to our customer and which obviously leads to poor engagement
and inefficient ad spend. And the leadership
wants you to implement a data driven
approach to segment these customer and best way to allocate your
marketing budget. So that's the core
problem statement. Let's look into the data set
that is given and maybe a couple of tasks that we have to complete as a part
of this assignment. So in this dataset, because
it's a ecommerce company, I have my sales data, so you can see you have your customer ID,
which is unique. You have your transaction ID, which is also unique. Then you have your
transaction date and time in the UTC format. You have your purchase
amount and product category. I think this is the basic data almost every single company track anytime they have a
sale on their platform. Let's look into one more data, which is your customer
profile data. I will rename it as
customer profile. Now in this dataset, you have your customer ID,
your total order, the total spend the customer
has done on the platform, and the last purchase
date and the sign update. Now, customer profile is very important because it gives you a glimpse about the customer, like how many total orders
a customer has placed, what's their last spin, the last purchase, and the
customer sign up data. So that is important for sure. Now obviously, if you closely look at both of these dataset, there's one common value
that you will find, and that's your customer ID. The customer ID
in the sales data and profile data is common. And whenever you have
a common dataset in both of these different data, so whenever you have
a common column or a common thing in
both the dataset, in that case, you
can combine them as well by simply using Lookup. Now, we should do that ideally, but we can also directly
refer to that specific data set inside though
function itself. So you don't really
have to use Vlookup, but it's good to just
put all the data set in a single sheet so that it is easy for anyone
to understand. So perfect. Et's go
through the task first because I'm sure you fairly understand the data
description really well. Now, our goal is to analyze
customer behavior to build a structured segmentation
model using recency, frequency, and
monetary analysis. Now, this exercise is specially tailored
towards RFM analysis, also known as your
recency frequency and monetary analysis. So before we go into the task, let me help you
understand what exactly RFM analysis is and why
is it used by companies. And I have not prepared
any fancy PPT, I'm just going to Google
it out and show it to you. So first thing first,
what is a RFM analysis? Now, RFM analysis is a concept that is used for customer
segmentation and retention. Now, it's a very effective
data driven method to segment customer, and it uses three
important factors recency, frequency, and monetary. Recency will help you understand how recently a customer
has made a purchase. So more recent buyers are generally more engaged
and they are likely to make more purchase because your brain usually forget a brands or a
purchase over time. Second factor is frequency, which shows how often a customer has made a purchase
in a given time frame. Frequent buyers
usually indicates a strong relationship
with the brand. In the end, you have monetary, and this is the total amount a customer has spent with
your brand overtime, and usually a high spender contributes more
to your revenue, and they are also considered
more valuable as a customer. That's your RFM analysis. So recency shows
just for an example, in recency, you need the time since they last
ordered a specific product. In frequency, you care
about the total number of transaction done by
a single customer, and in monetary, you care about the total or the average
transaction value. And you can see that we
have all the data set. We have total number of orders,
which is your frequency, we have the total spend, which is your monetary, and you have your recency data as well. So now what do we need to
analyze in this dataset? We need to first analyze the customer
transaction behavior. Then we need to develop
RFN segmentation model and we need to
assign it a score, and we'll understand about
the recency frequency and monetary score in a minute. So first, we need to analyze the customer
transaction behavior. Then we have to develop RFM segmentation model
by assigning a score. I'll help you understand what
do you mean by a recency, frequency, and a monetary score. After that, we need to
classify customer into meaningful segments like
your high value customer, loyal customer at risk and lost. After that, we
will simply extend the segmentation model and understand about
product categorization, customer tenure, seasonality
or periodic purchase trend. We'll also look into
customer lifetime value and some actionable
business recommendation. So these are the
five, six tasks that we have to complete as a
part of the assignment. But before that, let's understand
about how do you create a RFM segmentation model
and assign a score, and what exactly is it? So to understand how
strong relationship we can have with our customer, each customer is scored based
on these three factors, recency, frequency,
and monetary, and these are typically on
a scale of one to five, but you can also use a scale
of one to ten as well. Where if a high value is indicated for a
particular factor, it indicates a
better engagement. For example, let's say a customer one has recently
purchased from your brand, have very high frequency and has spent a large
amount of money. This customer is way
more valuable than, let's say, customer five, who has spent a very
small amount of money, has very less frequent purchase, and it's been a long time since he have
purchased a product. So we will give a recency score, a frequency score
and a monetary score 1-5 for all of these customer, and then we will simply put
them into different buckets. And these are those
buckets. This one. So a customer who is
recently active and has purchased a large
amount of product from your brand and has done
a frequent purchase. These are your loyal customer. On the flip side, you
might have customer that are not recently active, have not done a lot of purchase, and are not frequent
buyer as well. These could be the customer
that might join off, and you need to prevent
that from happening. Now, let's understand
why RFM analysis is important and why are we solving the assignment
at the first place? The first thing that
RFM analysis does, it helps you enhance your
customer segmentation. Be RFM analysis will simply allow businesses to
classify customer into different buckets like VIPs customer at risk
and one time buyer, and this enable your
personalized marketing strategy tailored towards each
customer segment. Also, once you have identified
the customer segment, it is easier to focus on a segment and improve
the customer retention. Not just that, you can optimize
your marketing campaigns because now you understand
which are your VIPs customer, which are your high risk
customer and one time buyer, and you can focus
all your ad spend on optimizing for these
high value customer. For example, all the
frequent shopper may receive an
exclusive discount because they have
already spent enough on your platform and they do want to get early
access to your product. Also when you have a proper
view on the segmentation, you can maximize revenue and your marketing campaign and
increase the overall ROI. For example, you can see
this red color segment. These are your
frequent buyer with high monetary purchase and
they are recently active. To these customer,
you can give them an offer like 20% off
on your next purchase. For these people who
have been active, but it's been some time and has a lower
frequently purchased, then you have these yellow
segment or these are all customers who were active a few weeks back or
a few months back, and they have spent a
decently good amount of money and they are not super frequent on
purchasing from your platform, you can give them some
membership so that you can transition the customer to
become a high value customer. Then you have your fresh
leads or users that did one time purchase and they were they were active long back. That's how you can optimize each and every
customer segment, and obviously, you can use RFM analysis to reach to
these customer segment. That's how you can optimize your marketing and
your ad campaign for all these different customer
segment and the best way to identify the customer segment is by looking into RFM analysis. Let's try solving
the assignment. So at first, we will calculate the recency frequency
and monitory. Then we will give it a score. Then we will calculate
the RFM score, and based on the RFM score, we'll start creating
customer segmentation, we'll understand about
average order value, the purchase frequency, and
the customer lifetime value. Perfect. Let's
start with recency. We want to know how recently this customer has
purchased from our brand. The best way to do that
is to simply calculate the time difference between their last purchase
date and today's date. Now, this data is obviously old, so you can use February
2024 as your today's date. But you can even use today's
data as well because anyway, we are calculating a percentile
where we are allocating a specific number based
on the overall dataset. So it doesn't really
matter whether you take today's date or you take the date at which we downloaded or
exported this dataset. So let's say you're
taking today's date and you're simply subtracting
D two from it. So it's been for 73 days since this customer
has purchased it. Now, this data looks old, so maybe the better approach
could be to simply subtract February 2024 instead
of subtracting it from today's date because the data was downloaded
in February 2024. So instead of today,
I'm going to replace this with 24 Fab 2024. Right now we are in 24 Fab 2025. So this data is almost
a year old. Perfect. Now you have your recency data. As you can see, this customer
was active 107 days back. This customer was
active 215 days back. I think most of this data
is all by three months. Maybe if I look into the
lowest difference I can find, then I will exactly know when
did I exported the data. So maybe I can sort
this from A to Z. Since this data is close to
two months before even 2024. So maybe instead of 24, I can put this as maybe
20th of December 2023. Let's see. Okay. I think this is wrong because I'm getting a negative value, so maybe January 5, 2024. Perfect. I think
this seems fine. Because I'm not able to
see any negative value. Perfect. I think this
data looks good now because you can see that the
least number of Ds are five. Perfect. I think
we can take 2024, 1 January as today's date
because this data is old. Then we need to
calculate frequency. I think frequency data
is already given. Frequency is your total
number of purchase, and I think you
can directly just refer to the B two cell. Monetary is also given, so I think we don't
really have to calculate. We can just directly
refer to C column. Perfect. Now you need to
calculate a score 1-5, both for recency,
frequency, and monetary. And the best way
to do that is by simply using a
percentile method. Now in this dataset,
we are simply calculating the percentile
and giving them a score. For example, within 20%, you give them a
five recency score. Within 40%, you give them a four recency score within 633, within 82, and after
81 recency score. That's a very easy
way to distribute your whole dataset into
five different bucket. The formula for this
is also very simple. You simply need to apply this formula where
it is taking up the recency value and simply looking into the percentile
and giving them a score. 0.2 less than 0.2 will
have a five score, less than 40 will
have a score of 40, less than 60 will have
a score of three and similarly, you can see that. I have now given it
a recency score of one because this customer
was recently active. Now obviously, 165
is not very recent, so that's why score of two. 241 is obviously very late, that's why we have given
it a score of five. Now, there seems to be something
off with this dataset. A high recency score means the customer was
recently active, while a low recency score means it's been a long time since
the customer was active. You can see that 57 means the customer was active
two months back, I've given it a
high recency score, while 245 or 433, you can see that I've
given one recency score because 433 is a long time. Similarly, for 245, I've
given two recency score. Obviously, you can
further optimize it by using a scale
of ten instead of using a scale of five
because you can see that even a customer that was
active 57 days back, even to that customer, I've
given a high recency score. Maybe this is something
that I can correct. Because five would
be still 40, 60s, ideally five frecuency
score should be given to the customer who was active
within last one or two week. So that's the simple problem with the dataset if you want
to optimize it further. But let's focus on the approach
more on the perfection. Then you have zero frequency. And you can use almost
the same formula to calculate the
frequency score sewll. So if they have
done more purchase, they will get a high
frequency score. If they have done less purchase, they will get a low
frequency score and will use the same formula to calculate the frequency
score as well. So perfect. For this customer,
they have done a many purchase like
almost eight purchases. They will get a high
frequency score. This customer just has
done just one purchase, so they will get a
low frequency score. Similarly, we can calculate
a monetary score as well. So this customer has purchased a good amount
purchased in a good. So this customer has overall spent a good amount of
money with the brand. That's why you have
high monetary score. This customer has spent
very less amount of money. That's why a low monetary score. And the easiest way to calculate RFM score is to simply
add up all the values, your recency, your frequency,
and your monetary. That means we are now adding all the three important
factor that is super helpful in optimizing
our marketing spend or our campaigns so that we can increase the
overall revenue. Perfect. Now, obviously,
based on RFM score, you can dynamically
create segmentation, but I'm not a Python engineer to dynamically fetch the values, figure out three equal split, and then give a
customer segmentation. In this one for simplicity, I'm going to simply
hardcore ideally you should create equal
buckets and, you know, you should let the system decide in which bracket they
want to move this customer. So if your RFM score
is more than 13, this is a high value customer. That means we have to give
more exclusive discount. We have to give them special
access or beta access because these are the people
that are recently active. They have purchased from
our brand multiple times, and they have also contributed to a good amount of revenue. Then RFM score more than
ten is our loyal customer. Less than seven is at risk. That means they might turn, and below seven are all
those customers who are kind of already lost because
they were active long back. They haven't made any purchase. It was just a one time purchase, and they contributed
a very less amount to the overall revenue. So perfect. So this is your
customer segmentation. You have four different
segment of customer, high value, loyal,
at risk, and lost. And obviously, there
are multiple ways to make more money
from this and at least it do one more
purchase because you can give them a 50% discount and they will do
one more purchase. To this customer, you have to push them to buy a membership, or you have to push them to buy more exclusive high end product. Perfect. Now we will calculate
the average order value, which is easiest to calculate. You have your total value
and your number of orders, and that's your
average order value. I think purchase frequency are also very easy to calculate. You have to divide
your frequency with the number of
days in a month. Your frequency is what? G two, today's date minus E two, which is your sign up
date divided by 30. I think instead of today's date, I will still take
February, sorry, January 2024 as today's date
because the dataset is Okay, so this is our
percentage frequency. Perfect. So this is how frequently these customer
are purchasing in a month. So 0.42 means they are
purchasing once in two months. So this is your
frequency roughly. I think you can also
multiply this by 100 if you want to calculate the
frequency in percentage, but that won't be a fair way
to look at the frequency. Maybe you can
calculate a quarterly frequency instead of month. But I think customer
lifetime value is something that is
more useful here. You want to calculate your
customer lifetime value. You need to multiply
your average auto value, multiply it by your frequency
and the retention rate. I don't have the
retention read data, but let's say the retention
is close to 12 months, that's your customer
lifetime value. Perfect. Now, now you have
all of the data with you. You have your recency
score, frequency score, monetary score, and you
have customer segmentation. You can anyway do a pivot table and understand more
about the data. That's something you
can do it yourself. But I simply have to
show you maybe I can see the multiple customer segment and how many customers
are there in high value, low value, medium value. The column name is
customer segment. So customer segment,
I want to see the value in rows,
I need to see. So there are 126
customer at high risk, 144 are loyal, 107 are lost, and 112 are high value customer. Maybe I can see their
contribution to revenue as well. So now you can see
that loyal customer, high value customer,
and loyal customer. Oh, this is a very
unique and sights. The loyal customer are more, but when it comes
to total revenue, high value customer has contributed to more
total revenue. Just like this,
you can obviously see multiple things and, you know, complete
the assignment. So we have developed
a RFM model, created the customer
segment, extended the model. I think we haven't
done this yet. I think this is something
that we can park for some other assignment because you need a few more variables
and dataset in this. We predicted the
customer lifetime value and obviously you can write
the recommendation as well. Perfect. You can look
at the solution as well if you get
stuck anywhere else, maybe the formula could
be slightly different. Yeah, that's your assignment
to your RFM analysis.
50. Interpreting & Summarising RFM Results: So now let's understand
about RFM and a real world use case
in ecommerce company. So let's say you did
a RFM score analysis and you create a different
customer segment, and you have 10,000 customer
that you're able to segment into five
different RFM bands. And your main purpose is that you actually want to
improve retention, increase revenue, or
customer lifetime value. So let's look at a
couple of tempin example that you can run across these
different customer segment. So let's say you have a customer segment that you named as champions and the RFM score for this customer
segment is 555. That means these are
the customer who are recently use your product. They are most active
frequently buying from your brand and are spending
a good amount of money. So to these customer, you can create a VIP offer
campaign and you can give them early access because these customers are most
important for your brand. Then you have at risk RFM
segment 200-300 range. Now, these are the customer
who haven't purchased anything for quite some time and you really want
to activate them. To these customer,
you can send them, we Miss you notification
or email campaign, or you can create some
urgency offer like, Hey, limited time period offer, the deal expires or the
offer expires in 23 hours. In fact, some brands also gives a reverse countdown
in the email saying that 50% off on all popular brand and the
deal expires in 2 hours. Third example is
all the customer who are new to your product, are recently active,
have purchased a lot, but haven't spent
good amount of money. So to these customer,
you can cross sell, upsell, tell them about new features that you
have in your product. And in the end, you have
your lost customer segment. Who have RFM score of 100-150 and these have mostly unsubscribed
from your product. They don't use it anymore. They are dormant. You can use some
revival campaign. Now, the main idea is that
in ecommerce company, when you segment your 10,000 users into these five
different RFM band, you will have
really good result. Things like you have 28% higher
click through rate across all these email campaign
because you're sending different email campaign
to different user segment. Also you might end up
seeing a revenue increase of 12% with the email and push notification
that you send. In fact, if you look at
all the push notification sent by a food delivery company
or by a grocery company, these are super personalized
push notification. One more result could be that after doing a
proper segmentation, you might see
something like 2.1 X, higher retention rate, and you might able to revive some of
these lost customer as well. But long story short, when you do a RFMB segmentation, you will see a
higher conversion, a higher revenue, and
much better engagement. That's the main purpose of
segmenting your customer.
51. Clustering in Segmentation – The Basics: So great. In the last video, we discussed about
RFM B segmentation, and that's a really good
technique to create multiple customer segment
based on the value that they contribute to our
brand or to our product. In this video,
we'll talk about K mean clustering.
Or segmentation. Let's understand what it is and why exactly
do we need it? Initially we start segmenting
our customer by behavior, demographic and psychographic
characteristic. That was enough. But then we suddenly
realize that, we also have to create our customer segment by the value that they provide to our brand or to our product. When I say value, it means recency,
frequency, and monitory. How recently are
they purchasing? How frequently are
they purchasing and how much money
are they spending. Both of these three things, all these three things
actually delivers value to us. Like it brings
money on the table. Why do we need K
mean clustering? Now, before we understand
about K mean clustering, I wanted to revise a
couple of concepts that you might be already aware of, or you just want to understand these concepts first before you go into K mean clustering. And this concept comes
under machine learning. We'll obviously understand where exactly K mean clustering stand. This is over here, but let's
understand from the top. So let me explain what machine
learning is for a minute. Machine learning is when your system learns
from the data, when the machine
learn by itself. That's the oversimplified
definition of machine learning where
you feed a lot of data to a machine and the machine
will start looking at the pattern and start
learning it by itself. That's your machine learning. Now when we talk about
machine learning, we have three broad categories. We have supervised learning, reinforcement learning,
and unsupervised learning. As the name suggests,
supervised learning means that the machine is learning
from the labeled data. Let's say if you give machine data like this
is the temperature, this is the weather condition, this is the country, this is the wind flow, and please help me predict whether it will
rain tomorrow or not. That's your supervised learning. You're giving some
labeled data to a machine and you're just
asking a simple question, either tell me it will
rain tomorrow or not, which is a classification, yes or no, or predict a
weather for tomorrow. That's your regression.
So classification means you're simply
asking the machine yes or no or a binary value
and regression means you're asking machine to predict the future outcome. That's your supervised learning. Then you have
reinforcement learning when you are giving a reward
and a penalty to a machine. Every time machine
makes a mistake, a person manually come into the picture, give it a penalty. Anytime a machine take
a right decision, you give it a reward
and the machine learn it by reinforcing the algorithm. That's your
reinforcement learning. Then you have
unsupervised learning. Where you have not given
any labeled dataset and just machine
is trying to find a pattern from some
random data point. Let's say you have
given some thousand data point to machine, and you're just asking machine, Hey, these are 1,000 data point, these are the million customer. Just try to put these
million customer in some random segmentation based on the thousand data point
that you're collecting. That's your
unsupervised learning. In this one, you
have two different techniques Association
and clustering. Association is finding relationship between
different item, and clustering is grouping the customer or data point
with a similar characteristic. And you obviously have
different type of clustering. You have hierarchal clustering, overlapping, exclusive and KMI. Now, we'll obviously discuss about these three in
some other video. Our main purpose is to create different customer segment
using K mean clustering. And we'll obviously solve
a case study assignment. I'll give you some
dataset and we'll understand about this
concept properly. But let me give you a bookish
definition or knowledge of what is Kaman clustering and why
exactly do we need it? Like, we have a RFM analysis. That's great. Why do we
need mean clustering?
52. K-Means Clustering Explained: Now before we understand
more about me in clustering, let's understand why
do we need came in clustering when we already
have RFM scoring segmentation. To understand this,
I'm going to tell you a small story or maybe
oversimplified example. Imagine you are running
a shopping app. Where people can
purchase product online and you have two
user on your platform, User A and User B. Now, user A buys every few months and
spend close to $500. Now, User B opens the app daily, browse for almost 20 minutes, add a couple of
things into the card, but he hasn't bought
anything yet. So these are the two customers that you have on your platform. Now, our first way to
create segmentation is to simply look at their demographic or geographic
characteristic. Now, both your user A and B
have the same age of 30 year, their gender is women,
they are from London. You can't really create different customer segment
for user A and user B. Then you will say, perfect now we can move towards RFM based customer segmentation, where we will look at
customer A and customer B. You customer A is opening up the app once in every few
months and spending $500. The customer is not very active, but he's spending some money. But when you look at customer B, this customer is opening up
the app every single day. That means the recency is high, and this customer is
also interacting. That means he's spending
close to 20 minutes, but he doesn't have a
frequency and monitory. If you calculate the
RFM score of A and B, you might feel that the RFM
score is also close to equal. How do you create proper
effective segmentation? Because something
feels off to me. When you look at User B, User B is clearly engaging
with the product, but the user B is not getting the right offer to check out. And the problem
is that RFM score only sees the transaction, the recency, and the frequency. RFM based segmentation doesn't
see the behavior pattern, and that's where clustering
comes into the picture. Clustering goes
beyond these limit. It looks at the real behavior, like how frequently the customer is browsing through
the platform. How much time are they spending? Have they added
something into the card? Have they abandoned
from the card? Can we lift these users and make them purchase
from the platform? Now there are multiple
techniques to do clustering. One of the technique is known
as your K mean clustering, and that's what we will
learn in this video. K mean clustering is an unsupervised machine
learning method that groups your customer into K clusters based on
their similarity. Customer who are in
the same group who behaves or interact
like each other, they are into the same cluster. And after you have run Kaman
clustering on your dataset, your clusters will look
something like this. I mean, this is too
good of a diagram. The actual clusters
look pretty bad. But the main idea is
that you will have all these different cluster and at the center
of each cluster, you have a centroid and
from centroid to your data, you have your distance. All these clusters have
a similar data point and these clusters are created based on their
natural pattern, such as maybe these customers are spending a similar
amount of money, maybe they are having a same behavior where they are just adding a product to
the card and dropping off. K mean clustering
basically create clusters based on
the user behavior, pattern, habit, and usage. In K mean clustering, you create exclusive cluster. That means one customer can belong to one
cluster at a time, where K stands for the
number of groups that you want to create or number of clusters you want to create. And the main idea is
that K mean clustering, group your customer based on their similar behavior or trait. This behavior is related to maybe interaction with the
app, the spending behavior, the purchase behavior, the duration between adding a product to the card
to checking out, you can have N number
of combination. Now, we'll obviously solve a real world case study
assignment on K mean clustering. But if I have to give you
a high level overview on how exactly does it work, you first input the number
of clusters that you want to create then you calculate the distance and you try to group based on the minimum distance
from the centroid. If your clusters
are very stable, in that case, you
stop the process. If they are not stable,
you recalculate the distance and try to minimize the distance
from centroid. This sounds complicated,
but it's not. Once I run Kaman clustering, this thing will become
super simple for you. But the variable that you use in K mean clustering
are these one, and I'm sure you can have thousands of variable
that you can use. The first one is RFM score. All the customers who have recently purchased, more
frequently purchased, have spent a good
amount of money will have a different
kind of RFM score. So RFM score can act as a input data in the
Kmean clustering. Then you have customer
lifetime value, which is a metric, this
can also act as a source. Customers who have a
similar kind of CLTV or customer lifetime value can or cannot go into
a same cluster. Then you have your
average session duration, the number of pages a
customer has visited, the click behavior, the sign up source, the device pattern. You can have thousands of different data points and came
in the came in clustering, it will go through all
those thousand data points, see which all customer comes into the same kind of
pattern or grouping, and then create these clusters. And we'll obviously
talk more about K mean clustering after solving some real world K
study assignment or after solving some
real world problem. Then you will understand more about this specific concept.
53. Introduction to Predictive Analytics: So hey, guys, so far we have covered three module
in this course, and now we are starting
our fourth module on predictive analytics and customer lifetime
value modeling. Now, in the first three module or in the first three section, we discussed a lot about
marketing Analytics foundation, customer segmentation
and profiling. And in the last section, we discussed about
funnel analytics and conversion optimization. Now in this section, we'll discuss about
how do you predict a future sales or a future
behavior on anything, and how do you make sense out
of customer lifetime value? So in this section, we'll first discuss about
predictive modeling. Then we will discuss
about linear regression, logistic regression, which are the types of
predictive modeling. After that, we'll understand
about John prediction, customer lifetime,
and then in the end, we'll discuss about retention
and acquisition cost. So this section is going to
be a lot about predicting the future and understanding
the customer lifetime value. So let's start with our first
video where I will try to oversimplify all the topics and concept we'll be covering
in this specific section.
54. Predictive Analytics Made Simple: So this is the first video of this section and I
want to make sure that all of you have a strong
foundation before we start understanding about
all these concepts. That's why in the first
video of this section, I'm going to oversimplify and explain all the
topics that we will be covering in a super simple
language or in layman terms. This will help you build
a strong foundation if you have no idea about predictive analytics or about customer lifetime
value modeling. That's why I usually tell you a small story and explain
all of these concepts, and then I will actually create proper videos for each
and every single topic. In this video, I'm going to oversimplify all the
concepts to you. Let's first understand what
is predictive analytics. I'm going to tell you a
small story to explain predictive analytics and a
bunch of other concepts. So let's say Anika has a lot of customer buying t
shirts from her online. She is having an online store. Now, she's perfectly running the online store
where she normally sell t shirt to different
people on different events, occasions during the year. But Anika usually wonder, how do I know which user
will come back and buy the t shirt again and which customer might stop
buying in the future. She has little to no clarity or visibility on any
of these questions. So she started
talking to people, and some of those
people said that, Hey, you need to use some tool or some product to understand
predictive analytics, which will simply
tell you what will happen in the future for
every single customer. So she started talking
to multiple people, and those people suggested
her that you should use some predictive
analytics tool that will help you understand insight
about each customer, whether they will buy
again from you or not, and how many of them may not purchase t shirts from
you and might churn. This tool works
by using clues or past data to guess what
will happen in the future. And predictive analytics
works exactly like prediction of weather where
it is almost accurate, but it can go wrong as well. But in this case, it
works for customer. So these kind of tool can
help Anika plan better, keep customer longer,
and sell smarter. Now Anika exactly know what her future sale is going to look like for the next month
or for the next quarter. But she want to know about
every single customer, whether someone will buy the t shirt again
from her or not. To understand that,
we'll talk about regression model and how these regression models can help her make
better predictions. Anka started learning
about two regression model or two regression tool. The first tool is
linear regression and the second tool is
logistic regression. Now, linear regression
will simply help her understand how much a customer will spend in the next purchase or
in the whole lifetime. While the logistic
regression will help her predict if the customer will return back and purchase are going from the platform
or from the website or not. So how likely they will purchase from her
ecommerce store. Now to make sure these two model or regression model
works really well, she have to feed
a lot of data to the regression model so that they can predict
the result better. So she started feeding
the past purchase data, all the website analytics data, things like how many users
came on the website, how much time they have spent, things like session duration, session time, all of that data. And then she's expecting some results from these
tools or these models. And after using these tools, he saw that, Hey, linear regression is
able to tell me that a specific person will
spend $60 next month, and this person
might not return. Again, this is
just a prediction. It will turn out to be true
or false. We don't know yet. But you might wonder, well, how exactly these tools work? And obviously, I'll explain
that to you in a while. But she is more concerned
about the second part. This person may not return. I'm sure there are more people who might join in the future. So how does Anika prevent
this from happening? And you want to know how many of these users might leave or
might not come back again. So to solve the problem, Anika started learning
about churn model. And these prediction
model will also help you understand which user will
churn and which one will not. Now, all of this started when
Anika started noticing that many people who purchase from the platform are not
purchasing anymore, like many people stop
buying from her. In simple term, this is
known as your churn. So now she's focusing on building a churn
prediction model, which will simply tell her which customer may not purchase in the
upcoming month or year. And she's feeding
a lot of data to this one model like
your past sales data, your website analytics data, and if the customer has opened any promotional emails or not, and how many visit and how many of those customers have
visited her platform. After feeding all of this data, I'm sure this data is very less. I'm going to give you an
exhaustive list of data that you have to feed to all these
models for them to work. After feeding all of that data, she is able to figure
out that, hey, 20 customer might leave
the platform soon. The advantage of this
is that once you know that these customer
may not come back, you can literally give them some discount or maybe send
them a thank you note, just to bring them back or just to engage
with the customer. Now, there is one
more problem here. Apart from Chun,
she also need to make sure whatever
customer she has, they also need to
buy back from her. So she's also curious in knowing which customer are worth
keeping the most for my brand. To understand that, she started learning about customer
lifetime value. We have covered
customer lifetime value in the last section as well. Now, the main idea here is
that Anika doesn't want it to spend too much money trying to keep every single customer. So she started using customer
lifetime value model to help her predict how much each person will spend
in the whole lifetime. So as soon as she
started acquiring one customer and the customer
has done some purchase, the model will tell her
that this customer might spend close to $300 in
the complete lifetime, while another customer
will might purchase once. Now obviously, once you understand customer
lifetime value, then you also need to understand how much money can you spend to keep these
kind of customer. Now to do that, she
has two choice either to retain existing customer
and acquire new customer, and she can do both of
these things side by side. So Anika wants to compare the
retention and acquisition. She wants to compare
how much cost she has to incur to retain the existing customer and what will be their customer
lifetime value in the future. For acquisition, she
wants to know how much will it take for her to
acquire a new customer. And obviously, she knows that finding a new
customer is much more difficult than retaining
existing customer because existing customer
can bring more revenue, you can easily upsell and
cross sell to that person. So obviously so technically,
she should spend. So she started spending more time retaining
the existing customer, but very less effort in
acquiring new customer. In the end, she has to put all of these data together things like linear regression
where she needs to predict how much sales she
will have in the next season, next quarter or next month, or logistic regression
where she wants to know if a particular customer will churn or not or come back or not. Then she also has customer
lifetime value data, retention data, churn data. So she want to make
a super simple model that can give her a holistic view of all these different data point and she can run the
business properly. So obviously we'll create a spreadsheet for
her where she can look at all of this data and
make more sense out of it. We obviously need to feed all of this data into the
model so that it can start predicting the
right things for her so that she can run
the business on autopilot, which obviously means we
have to interrupt or she has to come in and just check
a few things if they are going in the right
direction or not. Great. This is our first video. From the next video, we'll go deeper into every single
concept that we have covered. Things like
predictive analytics, logistic regression,
linear regression, customer lifetime
value churn model. We'll cover all of these
concept one by one.
55. Applications of Predictive Analytics in Marketing: So great. In this video, we'll talk about
predictive modeling and why is it important
in marketing. Now in modern marketing, you want to know
what will happen in the future the
understanding the past. Anika who is running
online ecommerce store, she wants to know
who might leave, who is ready to buy again, and what should she focus on. So in predictive analytics, we simply use past data
like your purchase data, your website analytics data to forecast the future behavior. This forecasting could
be right or wrong. It depends how much data do you feed in and
what's the noise, and we'll understand what
exactly this noise is. Main idea is that all these
predictive model will help Anika understand so that she can send the right
offer to the right people. She can stop wasting money on those things which might
not bring her the revenue, and she can keep her
best performing customer so that they can give her
more money over the lifetime. And not just online store, a real example of predictive
modeling could be a grocery brand that is selling groceries to different
customer every single day, and this grocery brand
wants to know the jon rate, the retention rate, and how much revenue this
customer will bring to her. So what is a
predictive modeling? In predictive modeling,
you simply use datas and algorithm to predict what your customer are
likely to do next. And this is not just
about customer, whether you want to
predict whether, sales, marketing spent,
revenue, anything. Predictive modeling is used in almost every single
domain that you see. And it works on the top of statistical and machine
learning techniques. And if you come from a machine learning or a
data science background, I'm sure you have worked a
lot in predictive modeling. Now, in this case, we are
talking about marketing. So if I give you a
couple of use cases that you can solve with
predictive modeling in marketing, well churn analysis is one
where predictive analytics will simply help you understand which customer will
likely churn or not. You will know how many leads you will get in the future
based on the past data, how much money a customer will spend based on the behavior of the customer because you
do get the browsing data, the session time,
the session duration in the app or website, and what product you should recommend next
to these customer. The technique that
is used is known as your lift or market
basket analysis. Not go there, but
predictive modeling can help you predict or
guess a lot of thing. Not guess, maybe predict
a lot of things. Now to run a
predictive modeling, you have a small workflow, which is not very
important to learn. Obviously, we're going to use the workflow whenever we solve a real world case
study assignment that we obviously do by the end
of almost all the videos. So every predictive
modeling workflow, follow a series of
steps that you have to follow to make sure
it works really well. The first step is defining the outcome that you
want to predict. Do you want to predict churn? Do you want to predict revenue or customer lifetime value? You first have to
define your goal or the outcome you
want from a model. The second thing is that you
need to collect and prepare the data where you might
need to clean some data, you might need to structure
and label this data. Now when you want to
predict something like churn or revenue
or lifetime value, in that case, you
need a lot of data. For example, you obviously need past sales data of
all your product. You need a website
analytics data. Things like how many people
landed on your homepage, how many of those
people bounced. What was their session time, session duration,
click through rate. You need all of the data from your website and from
ad campaign as well. Let's say if you're
running ad campaign on Google, Facebook,
YouTube, whatever. Third thing is that you
need to choose the model. In regression, you have linear regression and
logistic regression. Linear regression will
simply help you understand the future sales or
future forecast, while logistic regression
will give you a probability, whether a certain event
will happen or not. We'll come back to
both of these topic, but you need to
choose the model. Do you want to
forecast the future or do you want a yes and
no in the future? So you need to decide
whether you need a number to forecast
in the future, or you need state, yes and no. Then you need to
train the model. You need to fit your
training dataset so that the model start
predicting better. And then you need to
evaluate the performance, run it on small dataset and see if it works
really well or not. Now, as a marketer, you'd never have to do any of these things
because most of the model or software
product work out of the box. But I'm still explaining you all of these things
because they are important for you to understand on how things are
working under the hood.
56. Understanding Linear Regression: Now Anika, who runs
online ecommerce store, she is quite sold on the
idea of predictive modeling, but she's still confused. On which model to use. Now she understand that
using predictive modeling, she will be able to figure
out which customer will churn and how much a customer will
purchase in the future. But she's still confused. How do I use this model and
which model should I use? To help her and to
simplify everything, she has two options
and obviously we'll be covering both of these two
topic in the next few videos, linear regression and
logistic regression. Linear regression, which
is a predictive model will help her answer how much a customer will
spend in the future, and logistic regression
will give her a yes and no on if a customer
will purchase in the future or if the
customer will churn. Let's understand about
linear regression first. Let me give you
oversimplified example for linear regression and then
we'll come back to this story. So let's understand about linear regression
using a coffee shop. So let's say you're running
a small coffee shop. Every day you try
different things. You post on Instagram, you offer some discount
to these customers, and you also change the music. Now, all of these
things obviously drive your sales and you see
increase in your sales, but you don't exactly know what is the contributing
factor of the seals. Now techniques like
regression will help you answer which variable
is driving my sales? If a specific user
will come back or not, and what makes the
biggest difference in the user's coffee experience? This is like turning
a messy data decision into a very statistical
one or data driven one. Now, in regression,
you have two method, linear regression and
logistic regression. This video is going to be
just about linear regression. Let's talk about linear
regression first. The simple formula for linear
regression is this one. Y is equal to Theta
one plus Theta two X. You can also write
this formula as Y, which is a variable that
you want to predict. The simple formula for
regression is Y is equal to one X one
plus two x two plus B. Now, one X one and X two are there because you
have multiple variables. So when you look at
your sales data, it is dependent on ad spend. It is dependent on the
price of your product. And then there are
some random variable like season, timing, context. We call it as noise. In this case, you
want to predict sales from the ad spend data. This is a simple
linear regression. If you have multiple variable, it will become a multiple
linear regression. Let's stick with simple
linear regression which only have a
single variable. So in this case,
we want to predict sales from add spend data, and we assume that other
factors don't really matters. So in this case, is your slop. Which shows you how strongly your ad spend will
affect the sales. B is your baseline. That means even if you
spend $0 on paid marketing, what is your minimum sales? So even if your ad
spend becomes zero, so this part will
obviously become zero. In that case, what
will be your ad spend? So if this becomes zero, obviously you still have this. So if you're not spending
anything in marketing, what is the minimum sales that you will still
do as a brand? A linear regression model will simply fit a line by minimizing the error called Lee square and think of this as a trend
extraction from your data soup. If you look at this
specific data, you can see there is a intercept
or your baseline spend. Even if you spend
$0 in the ad spend, you will still have this much
amount of revenue coming. So these old red data point are my past sales based
on the ad spend. So this was my sale if you
spend this much of money. Similarly, in this data point, this was my sale if you
spend this much of money. And based on the past data, I am simply creating a simple line that passes
through all of the past data, and the distance between this data and this
line is minimum. So if you create
a squared sum of all the distance that
is least in this line, and that is my best fit line. That's why I call it
as. It fits a line by minimizing error
called e square. So this line, when you calculate this error from all of
these data point to this, this line has a
cumulative minimum error, and that's why this
line is the most fit. And that is the main
idea of regression. You're simply drawing a line
and obviously this line will stretch dot dot dot, which means we are predicting
something and we will be able to predict if you
spend this much of money, obviously you have
this much of revenue. Now you can have this line
maybe in this way as well, in this way as well if most of these data points are
present near to this line. I hope now you're
able to understand what is regression
and how does it work? We'll obviously solve a
real world case study to understand this topic better. Perfect. Now let's
look into a couple of real world use cases
of regression model. Couple of those use cases
are campaign forecasting. You want to predict how
much revenue will you able to generate from a
Black Friday campaign. And obviously, this will
use the past data of the last few Black Friday campaign that you
ran in the past. Then price optimization. You will find a sweet spot
where you can increase the price of a product and
the sales doesn't drop. Third one is ROI modeling. You will understand how each journal is performing and how will they perform in the past
if you pump in more money. Obviously, you will max
out there are a couple of ceiling and thresholds
that you need to consider. But you can use your
linear regression model across all these use cases, from inventory
planning to forecast, how much seal you will
have in the future to how much money can you spend, how much revenue
can you generate? In how much price can you
sell a specific product? Now there are cases where
linear regression may not work. When you start plotting data, if you see these
random patterns, in these cases,
regression doesn't work. Like, if you look at this line, you will see that this data is present randomly
at so many places. That means this variable and this variable is not correlated. They are not moving in
the same direction. When I say same direction,
it should not be positive. It could be this way as well. Similarly, when you
look at this data, you will see there are
a couple of outliers. And in this case, see,
there is something wrong. And in this case,
regression won't work. You have to use
another techniques. If you have a
nonlinear behavior, in that case, regression
will not work. If you have so many outliers, let's say suddenly your
brand is picking up, you're getting so much
of random seals and you don't have some variables to
predict that random sales. You have too many outliers. In this case, if
something goes viral, then you can't really
predict things. Also, if you have high
correlation between two variable, in that case, you can't really
make much sense out of it.
 Navdeep Yadav, Product Manager | MBA |