Transcripts
1. Chart Pattern Mastery Course Introduction: Hi there. My name is Randy lasagna. I've been treating
the financial markets for the past five years now. And I'm going to be
instructor for this course. I'd like to welcome you to the chart petal mastery course. And in this course,
we are going to go through different
chart patterns. Then one can actually make use of to execute long
or short positions. Now, there's different
strategies under the sun that one can
actually make use of. But if there's one
thing I've learned throughout my, my, my, my trading journey is that you don't have to use everything. But something else that I've
also learned is that what works for me may not
necessarily works for you. Hands out lag to give you some chart,
different chart patterns. Then you make use of them,
then you practice them. Didn't you see which
one you love the most? Which one resonates
with you the most. In this course, we're going
to cover chart patterns such as your double tops, which is an M formation, your double bottom
which is a W formation. Where do you enter where the exit we're going to go
through Head and Shoulders, inverse head and shoulders, etc. So I really hope that you're
going to enjoy this course and see you on the
very first lesson. Cheese.
2. Double Top Pattern: Welcome to this lesson. My name is Lonnie lasagna. In this lesson we are
going to go through what a double top pattern is and how does one
create a double top? Double top consists
of two types. As you can see, this is one top. So this will be our first top. First top. And this
would be our second top, which makes it a double top. Now we've got two tabs. This is our second top. And this would be our
neck line can images. This, this would
be our net climb. You determine our neck line
through this bottom here. This slope here. This
would be our neck line. I'll just write it
down for you here. This would be around neck line. And obviously how you
treat this, Is that, okay? First and foremost, double-talk. A double top pattern
equals short positions. So it double top tin
short positions. So when trading the
double top pattern, we're looking for
short position. So let me make this red for you. So we take the only take our short position at the
break of our neck line. So once we have our first top, can obviously the market for bounds here at the snare clay, which is our support
in the market. We'll create our second top. Then we wait for the
second top to finish. Once it's finished,
we will wait for a break out at our neck line. In this case, here was the
breakout at our neck line. So once we, the market
breaks the neck line, we enter our short position. And our TP will determine
how TB by measuring one of our the length of our tops. Then we measure it. Then you take it down from on
Nightline to the dull side. And this is where
our TP will be. Yeah. Let me just make this blue
so you can see it for t p. And you will probably estoppel
probably somewhere here, stop or be somewhere here. And obviously your entry
will be at the break out after the break
out, the neckline. Okay. So as the market
breaks the neck line, you enter a short position, then U T P here. So that's how you treat
a double top pattern. So the aggressive way is to wait for the market
to break the neck line. The more conservative way is to wait for the market to
break the net line. Wait for a retest
back to the net line. Now the neckline will
act as our resistance. And once the market
tests the neck line, then it'll confirm that we
should take a short position. So that's a more conservative
way in how to treat this. Otherwise, both results are essentially wait for a break
out that our neck line. If you want to take an
aggressive approach, sell the product of the neck. If you wanted to take a
more conservative approach, wave for the market to break down and retest the neck line, then enter your short position. Look at now the instrument. This is our first top. This is our first top. You just make this black
for you is office top. And this is our second topic. It's really an M formation. It's an M formation. This is our second top. This is our neck line. So what we will do is to
wait for the market to break our neck line in order for us to take our short positions. This will be our neck line. And we determine our neck line with this lower right here. And the mock-up test is slow. And what we will do is to wait
for the market to actually break the net line so that we can enter our short positions. And to measure our TP, we measure it through this
space of either the tops, then replace it from the
neck line to the downside. And this is where
our T p will be. This is our TP. This is our TP level. And obviously this is our entry point to the
break of the neckline. And this is our top level. So this is our stop. Let me just make
this red for you. This is a stop. And this is our entry point. I'm trying to make this
another color, gray. Okay? So this is
our entry point. This is a stock level and this
is our t p. So we wait for the market to actually
break on a play with a, with the aggressive approach, we take a short position, read the break, the
breakout of our neck lab. With a more
conservative approach. We will fill them up
and to break down, then retest, then we
take our short position. This is also another
inflammation. Remember your two tops doesn't have to be
on the same level. It's still valid even if
they're not in the same level. So this, for instance, is our first top. This is our first talk. This is our second top. As you can see, these are
not in the exact level, but it's still valid to
make it double top pattern. This is our second top. And obviously as
you probably can tell right now that
this is our neck, because we see it
through this low. This is our nebulae. Going to make this red for you. This is our neck line. And what we want here is we want a break out
around neckline. Spheres, determine our TB. We're going to
measure it through the inside of this tubs. This will be RTP
level right here. So this would be our T B level. Never going to make
this blue navy. So TP level. And this would be
our stock level. This would be all stopped level. I'm going to make this red. And our entry would be at
the break of the neckline. And obviously this
would be our entry. I'm going to make this gray. So we've got our entry housetop
level and our T P level. So at the break, as you can
see right here at the market, didn't just break the neckline
and move to the downside, but instead it both a net land and it went back to retest, as you can tell here, it went down. Then. I went back to retest
the neck line. Just make this green. To retest the neck line, then there will be no
confirmation for us to take a short position
to the dump site. Okay. Short position to the down side. So that's really how
you treat a double top. So this is our first top. Another instrument
is our first top. Okay. Let me just make this black. And this is our second top. As you can see that the
second observed but lower than the first
top, still valid. Still valid. Second top. And this is our, this is our new
client and we see on a client through the slope at
the break of the neckline, which the break is we
n tau short position. If you're taking a aggressive
approach first determine our TP by measuring the inside of either of
our tops, one of our jobs. And you put it here. And obviously this will be our TB level and this
would be our stock level. And this would be our entry, right? The break of the neck. Okay. So as you can see that
the market did just dead broke down here and it
went straight down. And I'll TB level would
have been hit right here. So this is our TP level, this is our stock level, and this is our entry point. So this is a double top four
nation or double-talk pad to determine whilst the
market is still playing out. This use a possible
double top as well as we can see here that
this is our first top. But this has not
yet paid out fully. But I just wanted to
show how do you approach this in a live market. This is our first top and this is our second top. Second talk. We will then this is obviously our neck line. This is our neck line. So what, how we
would approach this? We would wait for a
break at this net line. If you aggressive, you
will sell at this point. And to measure our TB level, we first measure the
inside of one of our tubs and drag it down to two from your neck
line to the downside. This would be our TB level. Yeah. This will be our TP level, VP level. This would be our entry just at the break of our neck line. This would be our entry point into the point. Somewhere here. We'll have all the
top level bob level. So we have our input point here. Somewhere here we
have our stock level. This is a TP level. Okay? So if you take an
aggressive approach, it's just that the
break of the neckline, that's where you enter. If you want a more
conservative approach, you'll wait for a retest
to the next line. The next line we will now
act as our resistance level. And then we'll take a short position just at the retest of the
neck to this level. So that's how you
treat a double top. That's how you
treat a double top. Just show you the last thing. I think that's enough. So this is our neck line. So what you need to know
is that double top, we're looking for
short positions. We're looking for short
position at the break or at the break
of our neck line. So it's upon you where they want to take
an aggressive approach, which is to wait
for the break of the neckline to the downside in the winter short position, or you're going to wait for
a retest and the MetLife. But what you need
to know is that pretest does not always happen. Retest does not always happen, but it's safer to
wait for a retest, then enter into your position. That's it, and that's how you
treat a double top pattern. Let me see you on the
next one we're going to cover are double
bottom patterns.
3. Double Bottom Pattern: Hi again, welcome to
yet another lesson. In this lesson we are going
to cover double bottoms. So now that we have, we know what a double top is. And how do we treat
a double top? Well, in a double top, as we have covered in
the previous lesson, that we are looking
for short positions. So a double top is
an M formation. As you know by now that a
double top is an inflammation, but a double bottom
is a W formation. And in inflammation
which is a double top, we're looking for
short positions at the break of the neckline. The break of the neckline, we're looking for
short position, but I'll double bottom. We're looking for long position at the break of the neckline. So it's an W formation
w formulation. So the break of our trend line, we're looking for a better
edit brave of her neckline. We're looking for low precision. So m is a double M that Tim
inflammation is a double top, but it w or w formation
is a double spot. So as you can probably
see right here, this is our first bottom. This is our first term. This is our second term. This is our second bottle. And this would be our neck line. Right here. The break of the neckline, we enter and long position. So this is where you would
enter one long position. Okay? The break of this neckline. Okay. So this is our next thing. This is our mid line. The break of this neckline, we enter into a long position. And how do you measure our TP would measure
one of the lengths of this app from our
neck line upwards. So this is where exit a treat. This is where I would exit
out trader obviously, this is where I'll stop
with Beaches pillow, probably 50 pips at most
below our entry point. Entry level. Okay. So this is exactly, you treat this exactly how you would with your double-talk. It's just the opposite. Looking for long positions. If we can view this as a
possible double bottom pattern. As you can see, this
is our first bottom. This is our first bottom, and this is our second bottom. In this way, what we
will do now here, we will wait for break, our weight for a
break neck line. So this is neckline. You'd wait for the
market to actually break this neck brace, the neck line. We are looking for N long
positions and we just measure how he believed. This is a level of our TPN. Obviously, at the
break of this neckline we're looking for
along the position. Just make the screen for
you a long position. So this is how you
would read this. You would wait for
the market to break this neckline and tend
to lock position, then this is a TP level is
and obviously with your stop, you stop would be below your enterprise in if you're
looking for a long position. But if you're looking
for short position, they'll stop would be just
above your entry price. And this is also possibly
a double bottom. So this may be our first button. This is Office bottom. And obviously with
wafer reversal here in the market to create, but we don't know how
far it's going to drop. But if you could put worse yet and this would be our second. And obviously this
would be neck line. And wait for the market to actually break this new client. The market break this next line. We enter our long positions
and tau long positions. And obviously as you know, how do we measure our TB? No. Okay. And would exit our
position right here. This is on an
airplane, as you know. Obviously this is our
entry images shape, this entry point. This is our entry here, and this is our TB. And this would be our stock. So that's how you treat a double bottom looking
for long position. So I hope that it makes sense. Let me see you on
the next lesson.
4. Head & Shoulders Patterns: Welcome back to yet
another lesson. In this lesson, we are going to go through the head
and shoulders pattern. So when we trade the Head
and Shoulders pattern, we are essentially looking for short positions at the
break off, a neck line. But I think the most
important things for you to know that head, head and shoulders, head, shoulders equals two short position. We are looking for
short position. I'm going to make it
red for you. Again. Head and shoulders, we're
looking for short positions, so head and shoulder
pattern looks like this. This high heel
represents the head. It represents the head. Okay. And you can see
the lower high on the left-hand side represents
the left shoulder. This is our left shoulder. And then on our right-hand
side of this screen, the lower high here represents
the right shoulder. I hope that you can see now
that it does make sense. This is the head, and
obviously this is how as human beings
we i as well. This is your head,
which is higher than both your shoulders, your head, this is the head and this is our left shoulder. This is all right shoulder. But now how do you
take a position here? Okay. This is what we
call and neck line. This right here is what
we call that line. Let me just show
you quickly here. Okay. This is what we call a
neck line and we want a break and our neck line in order for us to
take a position. Okay. This is our claim. This is our neck claim. So how do you treat this? You wait for a break. Neck line K, Once
the right shoulder completes and it
breaks the neck line. Let me just write the line here so that you will not confused. Neck line. This is a neck line. So we want a break out at our net line
to take a position. So this low in this law is what will
represent our nullcline. So once the deadline has
been broken right here, That's where you take
a short position. But to be more safer, to be more conservative
if you are aggressive, you wait for the
right shoulder to complete the break up the right show the
break of the neckline. You enter short position. If you are aggressive, but
if you're more conservative, you wait for the break
off your neck line and wait for retest
back to the neck line. And once they retest, the neck line is now acting as our resistance because it has all previous support,
as you can see here. And it was all previous support because of previous support. Now, we want the market
to test the neckline, which was our previous support, now, confirming that
is our resistance. And then we enter into
a short position. Then we enter into
a short position, obviously making use of our indicators such as your
RSI or your stochastic, which we've covered on the minority of Forex
trading course. If you have not yet checked out the cost, make sure that you do. So. We take our short position
and how do we measure our TP? We measure a TB by the
length of our head. So from our head up
until our neck line, That's how we measure. Then we put it at our neck
line to the downside. This is where our TP will be. This is where our TP will be. So we enter short position at
the retest of the neckline. And TP is here. And obviously our stop should be maybe 50 pips away
from our entry point. Okay. So let's just go and check
with another instrument. As you can probably tell you
as well. This is on my head. This is our head. And this is our left shoulder. Shoulder. This is our right shoulder. Your left and your right
shoulder does not have to be on the same level? Okay. They don't have to be
in the same level. You can have your
left shoulder above, in your right shoulder
a little bit below. Or your left shoulder
a little bit below. Your shoulder above. Obviously. This will
be our neck line. This is our neck line. If you connect these
laws, the shoulders lose. This will be our neck line. So what we want here
is that we want a break out for the
right shoulder to complete and the breakout
at our neck line. Okay. This is our neck line. Okay. This is our neck line. We want
a break at our neck line. And if you are aggressive, you enter your short position. Other words, this is
where our break is. This is where I'll break is. This is where you enter
it should position if you are a, an aggressive trader. Or if you want to take
the aggressive approach to measure your TP, you going to take the length of the head
to the neck line, then measure it from the
neck line to the downside. And obviously, this will
be our TP our TP point. And your stock can be any way, maybe 50 pips away
from your entry point. And obviously this is
where our entry point is. Then you take TB here. But to be more safer. And if you want to take the
more conservative approach, you wait for the break at your neck line and
then retest back to the neckline and retest
back to the client so that the neckline now
acts as a resistance level, which was a previous support. And then that alone will confirm that we are now
heading to the down side. This is your t, p or b. Okay. So this is
your left shoulder. This is your head does
your right shoulder and at the break
of the neckline, that's where we enter
our short position. Let's look one
last 11 more time. If you look at German for d, As we can see here on our h4. This is our head. Okay. This is our left shoulder. This is our left shoulder. This is my right shoulder. And this will be our neck line. And we want the market to break. This will be our neck line. And at the break
of our neck line, we're looking for
short positions. This is on an incline. The break of this neckline, we are looking for a short
position, obviously. Going to measure our T P by measuring our head
to our neck line. Then from our neck
line, downside. Either you wait for a
break and right here, this is where you enter your
short position or you wait for the market to
come retest back. This neckline official
market came down here. If you aggressive,
you would have taken a position right
here to a downside. But if you are
more conservative, you would've waited
for a retest, then enter your short position. So that's how we trade
a head and shoulder. Head and shoulder equals
two short positions. And B first, wait for
a break out there, our neck line level. Then take our short
positions either when the when the market breaks our neck line or the
market breaks our neck line, then we wait for a retest. And once the market
is retested necklace, then we enter into
our short position. So that's how you trade
Head and Shoulders pattern. See you in the next session
where we cover inverse, the inverse head and
shoulder pattern, really hope that you found
value in this video. Let me see you on the next one.
5. Inverse Head & Shoulders: Welcome back to yet
another lesson. On this video, we're
going to cover the inverse Head and
Shoulders pattern. As we have covered the
head and shoulder. Obviously we've got shoulder. And when we do the
head and shoulder, we're looking for
a short position. So we've got a shoulder. Then we get the head, then we have a head. Then we get another
shoulder, right shoulder. Then we wait for a break
out the neck line. And obviously we
get the neck line. Then we will wait for a break at our neck line and enter
our short position. Okay, so that's
basically what we have covered in the previous lesson
of the head and shoulder. Now the inverse head
and shoulder is, is just like the head and
shoulder but facing downwards. So with the inverse
head and shoulder, we're looking for long position. With the head and
shoulders, we're looking for short precision. But with the inverse
head and shoulder, we're looking for
a long position, so we just write it down
for you so that you can see inverse head and shoulder is equal to long positions. Long positions. So inverse head
and shoulder with little forward and
long position. So how the inverse head and shoulder looks like it's
just a hair and shoulder which is facing downwards or in an opposite direction compared
to the head and shoulder. Just write this down once again, inverse head and shoulder
is equal to wrong position. So this is how the inverse
Aiden shoulder looks like we've got our
left shoulder. Left shoulder. And obviously we get our head. Then we get our right shoulder. And at the break
of the neckline, we looking for long positions. This is where I'll
break line would be. And we look for long position shifts the
break of the neckline. It's either if we take
an aggressive approach, we wait for the breakout
of the neckline or if you're more conservative
way for a breakout retest. Then we enter into
our long position. So that's really
how one treats and inverse head and shoulder. So let me just show you in the live market right
now how you would. So as we can see right
now on this instrument, which is Euro GBP
daily timeframe. Here we've got a left
shoulder to shoulder. And this is our left shoulder. And this is our right shoulder. And remember, they don't have
to be at the same level, but approximately are more
or less the same level. So here we've got our right shoulder and
obviously we've got our head. Here. She is lower than our shoulders. We've got our head. Then. This would
be our next line. Just this would be our neck line connecting
our shoulders highs. Then obviously at the
break which is here, it's where we enter into
our long positions. The break of the neckline, this is where we enter
our long positions. This is really buy
into a long position. And obviously the red line
here is our neck lie. This is our this
is our neck line. So the break of the
neckline looking for malposition and obviously
how do we measure our TB? You'll probably know by now
that we measure it through our length of our head. Can then run this app. From our neck line. And this is where
our TP would be. So this is where TPU would be. An obviously stop level will be just below
our entry point. And obviously, this is
where our entry point is. Okay? So aggressively, just at the brink
of our neck line, you'll enter into a loan
position conservatively. You'll wait for a break out and every test
before you go lock. But you won't always, the market won't
always be retesting. The market will only be tasty. But the nicest thing about
waiting for a retail, sometimes the market has, does fake break out. So it acts as if it broke out, then it drops within again. So that's what we want to avoid. That's a reason
why it's probably safer to wait for a retest. So that's it. Let me just look at the second
at a second instrument. Let me just go to oil. This one is still haven't
yet fully played out. Okay, so let me just show you what you would do
in this instance. This would be your
left shoulder. This would be, remember this is an inverse head and shoulder and we're looking
for long position. This would be a left shoulder. This would be our
right shoulder, which is still playing out. This would be our shoulder. Obviously, down here. We'll have our head TO we'll have our head. And this is where our
next line would be. This is where our
new client would be. This is on Nick line
connecting these two here. This is our new plan. Okay? Okay. And as you can see, the market is now broke. The market is now broke
the neck line and test it. Now we are looking for
and long position. And just to measure, we're going to take profits. We've measured this
length of the head and we break it up from
the neck line to here. And this is where
our T p would be. This is where TB would be. And you'd enter your position right to the market
is currently. That's where you enter. Enter into position here. Okay, pause, it
broke and it tasted. Now the market will
most likely go up. Okay. So this is our neck line, as you probably know by now, is our neck line.
This is our TP. And our stock level
would be somewhere here, just below the entry point. Okay? So that's the second one, the inverse head and shoulder. And obviously, last
example would be this one. As you can see, that this was our
first shoulder, which is our left shoulder. Left shoulder. And this was our head. This is our head. The market now is creating starting to
create our shoulder. Good. This was our head. The market right now is to
create our right shoulder. Okay? And now what we will do, we will wait for
the formation of the right shoulder to actually complete and wants
to market breaks. The next line. And
obviously this is, this is how I'd
nipple line would look like the marketplace. This neckline, we enter
into and long position. So this is our head. Head. Head. This is
our right shoulder, which is have not yet
fully played out. Okay. This is like this is our left shoulder To shoulder. This is our wait-for, break. It, break it. And obviously, we measure a TP level somewhere here. This is our TP level. And obviously this
is awesome way. I'll stop. Just put on entry. So that's how you actually treat the inverse
head and shoulder. And you are looking
for long positions with the head and shoulder, we're looking for
short position. So I hope that it makes sense. And you're going to practice
this and we're going to look for this pattern in your chart. But for now, that's
it for this lesson. I'll see you on the next one. Cheers.
6. Always Keep Your Charts Simple: Hi once again. I hope you are enjoying
the course thus far. I just wanted to remind you that your chart does not need to
be all messy and full of, and full of lines, trend lines, horizontal lines,
shapes and colors. It does not. You just have to choose with what works for you. In fact, I prefer a
chart that is nice and clean and not too
many tools within it. So just use your
horizontal lines for your support and your
resistance levels or your trend line for a trend. And then you can make
use of tools such as your indicators as confirmation. Nothing else should be used. I feel like don't
overwhelm yourself with too many things because you'll
end up confusing yourself. Can just make use of what's
necessary and leave the rest. I, let me see you
on the next lesson.
7. Flag Patterns: Welcome to yet another lesson. In this lesson we are going to cover a chart pattern that
is called a flat pattern. Reflect that in, is basically a continuation pattern or
a continuation strategy. In other words, if the
market is bullish, meaning it's in an uptrend, we are looking for long
positions and a flat pattern. We are going to take
long position in the market is bearish
or we observe, or we see a bearish
flag pattern, then we are looking
for short position. As you know, the shape of the flag or the
frame of the flag is that you've got a pole. Pole. And obviously
you get your flat, you probably have seen this. Okay. Then you get your flag. So this is how, this is the shape of the flag
and this is how a flag is. So what happens
here is the market. If we looking at a bullish flag, the Margaret is obviously
moving upwards, upwards, upwards, and then
it consolidates. In other words, um, there's an indecision
between bulls and the bears, between buyers and sellers in the market then consolidates, creating the flag. It consolidates here. Creating the flag. Just trying to change
colors so that you can see it's Bulls and Bears that are actually in indecision here. Okay. So they, they, they are
consolidating here. There's an indecision
between the two. So it creates the
flag right here. The bulls and the bears
creates the flag. Then what we're
looking for here, we are looking for a long position because the
market is trending upwards, then it created this flag. But what we want to happen here is we want to train a
break out of the flat. Okay? That's really
how you treat a flat. So we want to create
the breakout. We want the market to actually
break out somewhere here. Once the market breaks out here, we will take a long position. Once the market breaks
out here, we go long. It would take a long position. As you know, with whatever
strategy you are using. If you're trading a breakout, you either treat
aggressively or you approach it conservative
or aggressive leeches. The breakout, you take
your long position or your short position
conservatively, You first wait for
the breakout and then you get into the tree. So I'm just going to say break out is equal
to long position. So we are taking a
long position once the market comes to this level. And obviously how we measure
our TP is that we will take this flag pole and measure it from the breakout
to the upside. And that's where you will
take your t p. So this, okay, I'm trying to
get rid of this one. This, this is how we trade a bullish break out,
bullish flag pattern. So bullish flag, you're
looking for long positions. Just going to make this
green so that, you know, we're going along bullish flag, we're looking for
long positions. This is what we call flag pole. As you would know. If flag pole. Okay, I'm just going
to make this black. This is a flag pole. And obviously this
is consolidation. The market is
consolidating right here. So there's an indecision between
the bulls and the bears. Corn saw dictation. And obviously you
will have your TP, 50 pigs away from
your entry point. And this is where you
enter the marketplace top. This is a bullish or bearish
work is quite the opposite. So what will happen is that the market old trend
to the downside. The market will drain
to the downside. Just make this red
to show you that we are in a parish, fled. And then the market who actually create the flag right here. To create the fled. Marketo create the fled. And obviously the market
will consolidate here. Marco do consolidate and the
breakout to the downside, we take our short positions. That's what we're looking for. A break out so that
we can get into our short position right at
the breakout of this flag. And how we measure our TB
is that we're going to take this port and measure
it to the downside. Obviously, That's where
we will take our TP. This is consolidation. This is all flat board. And obviously at the break
to the downside with them, so we take our position. So that's really how you trade a bullish or bearish
flat pattern. Obviously, this is a
bearish flag pattern. Just to show you
this practically, Let's go to our charts. So I just wanted to
delete everything here. Let's just go to our charts. So I'm just going to use
historical price here. As you can see that this
was a bearish flag. Petit mal could was
trending downside here. Marketers trending down here. And it created a
flag, right? Yeah. So the market created
a flag right here. Maybe let me just
created a flag right here and then write
it this break out. This is where you would have
taken our short position. This is where we
would have taken our short position
because the market broke down. So what
happened here? The market was training to the downside and there
was an indecision. Yeah. So the market started
consolidating right here. So this was or is
rather a consolidation. This is a consolidation. Mother started consolidating
and obviously, this is a flag pole. This is a flag pole. Then this is consolidation. I just wanted to see if
I can maybe color this. Doesn't shape, doesn't
really look nice, so we just get it. But you can see this is
consolidation and obviously how we measure our TP is
we'll take our flag pole, measure it to the
downside from here. And obviously, this
is where we'll take our TP of which the market
did reach this point. As you can see right here. So this is where we
would have taken our TP. So this is our T P level. Going to make it blue
so that you know, it's blueness. Tp level. This is Navy. Medium
brain is fine as well. This is a this is our T B level. And obviously our
stop can be anywhere, somewhere here, just above
our, our entry point. And obviously this
is our entry point. This is our entry point. To make this black. This is our entry point. So we have a flag pole or consolidation are anthropoid
did the breakout, and we have OTP level as well as our stock can just check
another instrument. Same thing here. We
get our fled poll. Okay? Then we get our flag with the
market stats consolidating. Okay? And obviously at the break flag, this is where we take our short positions.
Is it bearish flag? Remember, this is where we enter our position and how
we measure TPP is that we take a thread pool
from year to year. And obviously this
is really going to, this is our targets. So this is where we get
off the crate and we've taken our t be somewhere here. So flagpole consolidation, TP, and obviously just above our entry price is
above the breakout. That's where I'll stop, is. Same thing applies to our
two are bullish, bullish. So we have our flagpole. And obviously the market starts consolidating,
creating our flag. And we created now
at the break out, this is where we enter our long position and
obviously to the upside. Okay? So then that's really how
you treat a flag pettiness. You can probably see,
you can identify, can just see this pattern. It's all over. So it really depends on you
to check out this pattern. This is where we
enter position at the break to the downside. So we enter short position. Same applies to our bullish. Same thing to
abolish the market. Trends to the upside and
creates a flag right here. As you can see, it's a flag. And obviously we measure
our TB from here to here. This is where it
would have taken. Our TB are TP, This is our entry
point at the break. Point that break off this flag. Take a long position. And obviously I'll stop would
be below our entry point. So that's how you trade a bullish or bearish
flag pattern, which is a continuation pattern. I really hope that
you are going to look for this chart pattern. Make sure that you
see and you are able to observe this pattern. See you on the next lesson.
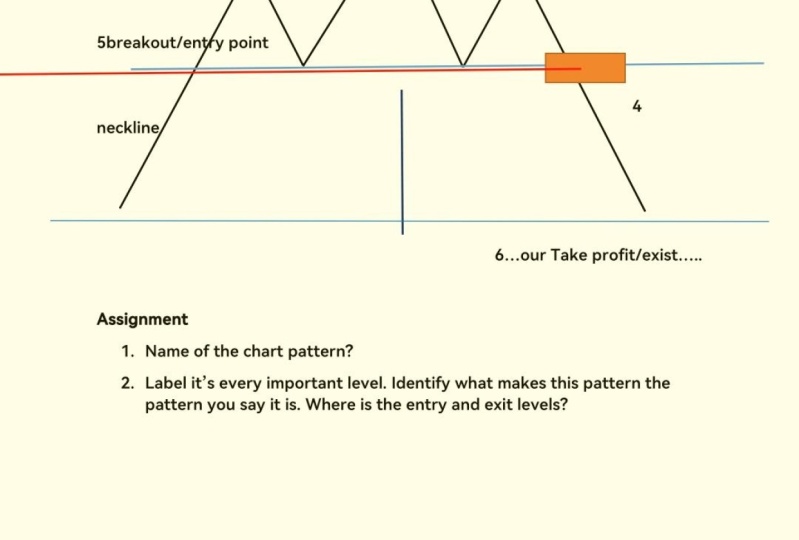
8. Final Words: Congratulations for
completing this course. I really hope that what you have learned throughout this
course makes sense to you. And I want to test you just to see if you have
really grasp what you have gone through
and what we've been teaching about
in this course. So your next step is now to actually complete the assignment that I have for you in
the assignment section, make sure that you finish the assignment and submit
it back to me so I can give you feedback on whether
you are in the right path. So make sure that
you do that and also don't forget to
give me a review, your sincerest review
of the course. Let me know what you
think of the course. Do you think, Is this something
you'd like me to improve? Or by the way, if you want a
trend following strategies, then we do have to check out our minority of
Forex trading costs. And if you also familiar
and you'd like to know how the method trader platform
works to check out our ultimate guide to the
metal trader platform. Other than that, good
luck with your trading, and I'll see you once you
submit your assignment. Cheers.
 Lwandile Zonke, How To Self-Publish Your Own Shocking Bo