Transcripts
1. Introduction: I am not musically trained. I used to saying, well until before the pandemic, I guess, and then it kinda lost
touch and I can't sing that well now I
need some practice. And even though I'm
not musically trained, one thing that fascinates
me a lot about music, or musical sheets or musical notations is basically music that's written on paper, that you can read it. And I believe that the
musically trained can also hear the music in their
heads as they're reading it, representing a
physical phenomenon. Sound and pitch on
paper is astounding. It's remarkable what
we've been able to do. Now before I move on to
talk about motion graphs, I would like to linger on the topic of musical
notations for a little bit more and talk about
but music, no, it's not. What do you think
it is? It actually comes from a painting by Renaissance painter Hieronymus
Bosch in this triptych couched in this corner
in this sea of chaos is this guy with a musical
annotations written on there. But people have, of course, try to play that
music and you be the judge of how good or
how bad it is. Alright? The point that I'm trying to
make is that you can write a physical phenomena
or represent a physical phenomenon like
music on paper with pen. Similarly, you can
also represent motion on a paper with pen using
three lines like these. Like musical notations are to me or to anyone who is
not musically trained. These lines also don't convey much if you don't
understand motion graphs. Hello, my name is Nash
and in this class, I wanted to train your brain
to look at the lines like these and imagine motion
happening in your head. Imagine a motion happening
in your head and draw the lines that
correspond to that motion. Because it's the
motion graphs and the easy things that make
or break in animation. Even if you have a
beautiful animation, great colors and everything. If the evenings and the
motion graphs are not write, your animation will suck. I say that with a
lot of confidence. I'll teach you what these
graphs in lines mean and how to manipulate them to
create beautiful animations, this class has used
that you know, the very basics of
your way around After Effects like
keyframing properties, etc, anything that can be covered in a 10-minute
YouTube crash course. I will start from
the very basics and I will build on top of that. And I will also,
without hesitation, show you a little bit of math that's involved in these graphs. So let's not waste time. Let's go.
2. Rate of Change: Welcome to the very first
lesson of this class. The title of this lesson
is rate of change. Now, before I get into why this lesson is
called rate of change. And the other stuff, there's something that
I wanted to share. The way that I've
structured this lesson is that you're going
to walk away from this lesson with one
and only one core idea by the end of this lesson, not to reach that idea, I'll have to go
through some amount of calculations and some
amount of mathematics. Not, not anything super complex, just simple things
to reach there. But I just wanted to put it forward before the
start of the lesson. Because if you reach a part of the class or of this lesson, which you are not necessarily enjoying because
of the math and everything. I just wanted to tell
you that it's okay. If you don't understand that, it's just one core idea of the class that you
need to walk away with. But that out of the way, let's just get into
the meat of the class. The difference between
anything that is static and anything that
is animated as simple. In something that's static,
nothing is changing. But in something that's
animated or an animation, things are changing and
things that are changing. Position, size,
rotation, et cetera. Hence, the very
basic building block of any animation is change. And change is always measured
with respect to time. Anything changing
necessitates that time is also moving forward
in Pattern roll. Without the movement of time, without the arrow of time, there can't be any change and there can't be any animation. And hence this portion of After Effects user interface
is called the timeline. Here you can scrub
back and forth in time and see an
animation happening. And if you don't see it, again, go into window and
you'll see timeline. Let's take the
square for example, at time t equals 0, I'll set a keyframe for
rotation for 0 degrees. And at time t equals 1 second, I'll rotate it by
four to five degrees. And if I scrub, you
can see it rotating. Now let's take this
same set of actions of setting one keyframe
at time t equals 0 for 0 degrees and
at time t equals 1 second for 45 degrees and plotted on a
very simple graph. Now we already know that we
need the movement of time. So I'll draw this flat axis
and I'll call it time. And I'll draw another
axis like this. And I'm going to call
this the rotation axis. Alright? Now, again, the same
set of actions. I'm gonna go ahead and change my color to something like blue. Alright, so at time
t equals 0 seconds, we have the rotation
as 0 degrees. And let's say here is
time t equals 1 second, we have the rotation. And if we divide this
axis like ten degrees, 203040506070 rates. So this could be ten degrees, 20 degrees, 3040 degrees, 506070 degrees, and
so on and so forth. 45 degrees would be
somewhere around here. So at time t equals 1 second, the rotation is 45-degree, so I'll just draw a dot here. Great. Now I will just draw some
horizontal and vertical lines. So at from t equals 1 second, I'm just going to
draw this line. And at time t at
rotation of 45 degrees, I'm just going to
draw this line. So this is where they intersect and this is our first which is of 0004 to five at one. This is all these two, these two dots basically say, now let's go ahead and connect
those dots using a nice, you know, yellow color. If that's visible, I'm going
to make it a little darker. So I'm gonna go ahead and
connect these points like this. Alrighty. And their VR, we have a graph and we really don't
need this circle here. So I'm just going to go
ahead and, you know, just, just gonna get rid of it. Alright, just focus
on this line. So we have a graph now. Alright, cool. Now let's try to simplify this
graph a little. First of all, we don't need these horizontal
and vertical lines. These dotted lines were only
there to emphasize that these dots are created at their intersection and the dots are all we really care about. Next, we know that since this graph is drawn in
the context of animation, the horizontal axis will
always be a time axis. Now we'll leave the divisions, will leave these divisions here, but we can get rid of
the label because it is understood that this will
always be timed, right? It's implicit, it's understood. We're going to leave
the rotation over here for now because we're
dealing with rotation. But remember that in
After Effects will be always working
inside of property, rotation or scale, or
British and et cetera. And that will always be implied. But for right now, Let's
leave rotation here. We also do not need these
labels here, right? Because all we, in the end, you will see that all we care about this graph here, right? That's what I'm
trying to get at. Just to simplify
the graph a little and get rid of the
redundant information. Once we have done that, once we have cleaned
it up a little, oops, let me just
clean up a little. And if you use Procreate,
you know that this app, I'm using an iPad and Procreate, but that's like really totally
not the part of the class. But okay, in the end, we have this graph over here, right? What do we did is this is
understood that this is time, this axis, the property
that we're working in, this this yellow or green line, I'm colorblind, I don't know, but this line over
here is what I assume is your
first motion graph. Alright, now, if I go back into After Effects through this
little animation remade of this square rotating, right. We can go over here, click on graph editor,
then straight up, go right down, click on Edit Value Graph and make sure that the rotation
property is selected. And as you click on it, the exact same graph
like this. Look at that. And that is why I said
that maybe this, you know, if you're not
familiar with graph, this is your very
first motion graph. Now this is going from 045
degrees is what changes. But remember that the name of this lesson is rate of change. Now what is that? Rate of change is the
same as saying how fast the change is happening or the speed of change and
what's changing here again, the value of a property, the value of a property and the property under question
right now is rotation. Let's come back to this
graph that we sketched earlier of the square rotating from 0 to 45 degrees and try
to figure out the speed. And speed from a graph is
measured by a simple formula. Alright, there'll be a
little bit of calculus. Okay, turnaround. Close the video
now if you're not interested, I'm just kidding. It's not that complicated. And I won't just
make your weight your time learning something
that you won't use. But anyway, the speed is
measured by a simple formula, which is divide by dx. Alright? Now, there are three things
here that can be new to you. D, y and x. Let's first of all, get
x and y out of the way. Now I presume that you
already know this, but let me go over it one more time in a two-dimensional plane. And we'll talk more
about this when we come to changing position
property and after effects, there are only two directions. You can move in, either either
horizontal or vertical, instead of repeatedly calling
it vertical and horizontal, which are both a mouthful, we conventionally
universally accepted all over the planet. We label the
horizontal direction as x and the vertical
direction as y. And we're just going to
ignore that ice cold label, label in the last sentence. But that's the point we call the horizontal direction x
and the vertical direction y. And if you understand this mean, then congratulations,
you understand the concept of x
and y in a graph. In our graph here, time is in the
horizontal direction. So we can say that this is
our x-axis of the graph or the horizontal axis and rotation or any other property
that we are dealing with. An After Effects will be
in the vertical direction, or which we can
say is the y-axis. Now x and y is out of the way. What is this d. Now, here is how
I'm going to write the speed of rotation
for this animation, this rotating square symbol animation that we create
an After Effects. What I'm going to do
is I can write speed of rotation is equal to, so it goes to 45 degrees. So 45, and it starts
from 0 degrees. So negative 0, it reaches
four to five degrees at 1 second and it starts from
0 seconds, so minus 0. So this would be 45
degrees by 1 second, which implies the
speed of rotation is 45 degrees per second. And this subtraction right here, this subtraction or subtraction,
how do you call it? I don't know. This subtraction is
what is called Delta, and it's represented
by the Greek symbol of delta or instead of delta, what can be used is
just a small letter D. Now there are some
calculus nuances where you should use Delta and where you should use D. But that doesn't
really concern us. We are good to go. All of this was just to show
you that this is the graph of a square that is rotating at 45 degrees per second, right? So let me get rid of
all the math here. Now what I'm going to do is I'm going to select different color. I'm going to select this color. And I'm going to
draw another graph, but one that is a little
steeper than this, right? So let me draw
something like this. A little steeper
than this, right? A little steeper than this. As you can see that
this graph right here, the original one, is
flatter than this graph, this new graph that I drew. Now you tell me this, the object with this
graph for rotation, the new one, we'll rotate
faster than this one or slower. Now think about it. Yes, it will rotate faster
because it is covering more. It is rotating more
than 45 degrees in the same amount
of time to get it. Now let this sink in. This is the one
important concept that you're going to take
away from this lesson. Now let me go back
to After Effects to this simple animation
that we created. I'm going to go ahead and select this layer press Command
D to duplicate it. And before we go ahead
and do anything else, let's once again look
at the rotation, the motion graph of
the rotation right over here and right now
it takes up the entire Area of the timeline, which is because this
option is selected, which is auto zoom graph height. We're going to turn that off so that it will make it easier for us to see the difference
of what we're going to do. Now, we have just
duplicated this layer. I'm going to hide
the original one. I'm going to go ahead and
select the new layer, press R to get rotation up. And you can see that
since we duplicate it, it is the same exact thing. But what am I going to do
is increase its speed. And one way to do that is to increase the amount it rotates. So now this square rotates
75 degrees in 1 second, and this square rotated
45 degrees in 1 second. So let's have a peek
at their graphs. I'm going to select rotation
of the original one. And you can see
this is the graph. And now I'm gonna
go ahead and select the rotation property
of the newer one. And there you go. As you can see, the
graph is steeper and I hope you are understanding what I
mean when I say steeper, it means that it is it is, it is farther away. This angle right
here is farther, more from the ground
for this graph, then for this graph. So flatter, steeper,
flatter, steeper, faster rotation, steeper graph, slower rotation, flatter graph. And in the same way if I drew another graph which was flatter like something
like this, right? This one right over here. Can you imagine the
speed of the object? But this rotation
graph, of course, it will be slower because it is rotating less in the
same amount of time. And let me reinforce that by again going back
into After Effects. I'm gonna go ahead and
duplicate this square again. And what I'm going to do with this duplicated square is
press R to bring up rotation, and I'm going to rotate it
like 20 degrees in 1 second. The speed of this square is rotating 20 degrees in 1 second. As you can see, it's
pretty slow, right? And if I go ahead and look
at its graph, is flatter, flatter, slower, a little
faster, more faster. So as you can see, the
graph changing from, from flatter do more
steep to more steep as the speed of the
rotation is increasing. So this is how you
can interpret, correlate how steep or
flat the graph is and how fast the rotation or any change
in property is happening. Now before we get out of this video with the
insight that we've gotten, let me go ahead and give you one more example so that
it becomes more concrete. So I'm going to delete
extra these layers. I'm gonna go ahead and remove any keyframes from rotation. Alright, so this is
just a normal square. Let me rotate it backwards 0. I'll go ahead and
press S by selecting this and bring up
the scale property. And I'm gonna go ahead
and keep the scale at a 100 at t equals 0 seconds. Or I can go at anytime. And then again, I can increase its scale to something
like 150, right? So you can see that
this is how it's changing from hundred,
two hundred and fifty. Let's peek at the graph of this animation and you
can see that it is again, the very same graph of
it increasing like that. Now, duplicate it and then again press S and let me
increase the speed of it. How can I increase
the speed by making it go 200 per cent in 1 second? So you can see like
boop, it's faster. And if I look at its graph, you can see that that
is steeper, steeper, flatter, steeper, flatter,
flatter equals slower, steeper equals faster, right? And it's not magic, it's math because when
the graph is steeper, the same amount of changes
happening in shorter time or more changes happening
in the same time. And hence the animation
is slower or faster. And with that, we are
done with this lesson. The only clear idea that
one core idea that I was talking about that you are
going to walk away with was, when the graph is flatter, things move slower and when the graph is steeper,
things move faster. So slow, fast, fast,
fast, fast, fast. And that's the core idea
and I hope that you understood it and
I hope that you're walking away with that idea. From this lesson.
In the next lesson we will talk more about easing, different types of easing
and why they are called. So I'd take a short break. I'll see you soon.
3. Easing(s): Okay, So here you are. Let's jump right in
and know recapped. Okay, a little bit of recap. In the previous lesson, we left at this graph. If you can see it shows basically how a property
is changing over time. And we learned that the
steeper the graph is, the faster the change
happens and the flatter the graph as the
slower the change happens. Now when it comes to easing, easing is not really
an English word, I guess you are not going to
find it in the dictionary. I had a hard time to
come up with a way to explain it to someone who
has never heard it before. So pay close attention. Easing is basically how a change in property
happens over time, how it slows down,
speeds up, etc. There are many kinds
of easing that motion designers use ease in, ease out, ease Expo and
ease Expo out, et cetera. And all of this
will be more clear as we progress in the class. You don't have to have 100%
understanding of this. Okay? Now this graph here represents
an easing colinear easing, this graph which is very just
a slanted straight line. And the linear easing is the most boring kind of
easing that there is. Can you say why? It is? Because the entire
change in value of a property happens at
one constant speed. Like if I play this, it happens had one
constant speed, which is not how things
move in real life. Now if I asked you to plot
a graph constant on paper, what would it look like? A constant like, for example, this is time, of course, but a constant
could be anything. It could be the
number two, Number, Number one, Number
ten, or whatever. What would the graph of
a constant look like? You know what it will
look like if I select the color green, totally arbitrary. Green has nothing to
do with the graph. So the graph of a constant, we will look
something like this, which means that
as time passes on, it stays the same. There is no change
in the constant, but with a constant speed is not how things
move in real life. In real life say
when the car starts, it starts out slow and
then it picks up speed. And then as it is slowing down, it slows down gradually. Or when you roll a ball, it starts at a good
speed but then halls slowly due to friction. There's something
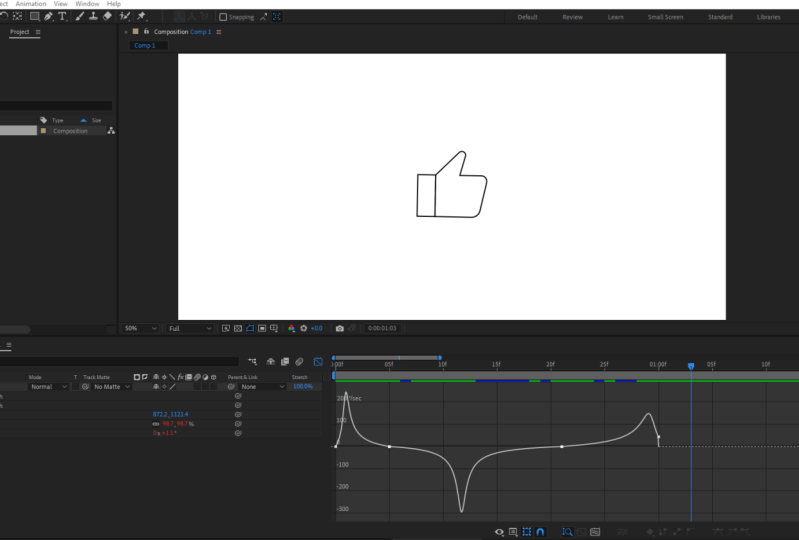
that I'm going to show you in after effects. Just a little peek of something. Okay? So there are two types of
graphs in After Effects. There's the value graph, which shows how the, the value of a property
changes over time. And then there's the
speed graph which shows up speed changes over time. And if I click here, what you will see is
this is the speed graph and the graph of a constant
that we drew here, which means asked
time passes by, it stays the same. So the speed of this animation stays the same
throughout its duration. And that is why
it's very robotic, very unnatural and
doesn't really look good. And this time of easing is
what is called linear easing. Now Value Graph and
speed graph are very much connected and I'll
show you that later. But right now it
feels safe to forget that speed graph even exists. Let's change things a bit now. Let's go back to our timeline by clicking out if
the graph editor, I'll select the first keyframe. I will right-click
on it and go to keyframe assistant
and choose Easy, Ease, alright, and
you can notice that the shape of
the keyframe change, which we will discuss later. Now, if I play that animation, notice how that it'll start off slow and then at some point start moving
at a constant speed. Okay, ready, pay attention, I'm going to play the animation. It starts off slow
and then starts bleeding at a constant speed. And then I'll just move this keyframe a
little bit ahead so that you can get them getting
more feel of the animation. So I click Play,
it starts off slow and then starts moving
at a constant speed. Now if we peek into
the value graph, which shows the graph of how the value of a property
changes over time. We can see a certain,
the curve here. If your graph is not, is like totally zoomed out, you can click here, which says Fit graph
to the view and it will just stretch
it to fit properly. You can do that. And you can notice
that the graph is no longer a straight line because of the curve over here. Now, how do we read a graph
that is curved like this? And this is a very
big inner graph. There's going to be grafts
that are twisted and whatnot. And how do we read those? Well, it's not that hard. All you have to do is
remember that any graph or any curve is made up of a
lot of points like these. This is a point,
this is a point, is a point, this is a point. So it's made up of a lot
of points like these. Now what you have to do
is mentally draw tangent on each of these points or
some of these points, right? But first, what is a tangent? A tangent is just
a straight line that touches a curve at a point. So if this is a curve, then tangent could be this. It is a straight line that touches this curve at
this point, right? So you can draw as many
tangents as you warm there. So let's pick this point
and draw a tangent. I'll pick this point
and draw a tangent. I'll pick this point
and draw a tangent. I will pick this point and
draw a tangent like this. And remember what we
talked about earlier. Steeper, steeper equals
faster and flatter. Equals slower. But look at this, the property
that follow this graph. So this tangent here is flatter, so the speed is slow, then flatter still increase
a little bit, right? And then again, it gets steeper and steeper until
it reaches all the tangents actually
are of the same angle or equally steep
or equal E flat. So basically it starts off slow, and then it reaches a
point of constant speed. And that is what is
happening here as well. You see it's the same graph. So the tangent is
flatter, flatter, flatter, and then
reaches account speeds. Imagine this. I'm gonna go ahead
and do a little bit of graph manipulation. Not much, just to
reinforce the point. What if I pull this, I'm holding Shift so that it
moves in a straight line. I pull this and
make it more flat. Alright, so if I draw a
tangent at this point, it will be almost flat, so the speed will almost be 0, and then it will stay with a slower speed
for a longer time. So if I play this
animation, look at this. Yeah, it starts off pretty
slow and then it picks up. So let me go ahead and
stretch this animation up a bit more so that you
can understand it better. And I'm gonna go ahead
and replay it so you can see that so much of time passes before it starts
rotating because the speed is slow for
this entire duration. So again, scrub this,
look at the graph, how flat it is and how less it is moving
during the flat part. And if I make it flat or still, you can see that it will take
longer time to get started. So again, remember that this is the value graph
you're dealing with. We are ignoring
speed graph for now. And yeah, so in the value graph, the flatter it is,
the slower it moves and then it slowly
catches up speed. Okay, Now, there is going to be some nomenclature that we'll
be using gear disclaimer. Now, if you look at
this whole graph, this value graph as a whole, Let's call this side the left
side, the inside. Alright. The right side, the outside. Now we will be doing something similar when we
were really talking about easing app
at single nodes. Later, we'll have an
inside and outside. But that's where then I was
just giving them a heads up. So in this graph as a whole, the left side here
is the inside, this is the entry side, and this side over
here is the outside. Now as you can see
in this graph, there is easing applied
on the inside, right? And hence we can call this
graph the ease in graph, if I bring in this website
called easing is dotnet. It just showcases all different, some different sorts of things. Of course, no website can cover every single little
change in curve. But look at all the curves that have 0s n in front of them. All of them have some easing on the inside
of the graph, right? He's in, there you
go, There we go. There's some easing here, right? And similarly, and
similarly in this graph, if I go ahead and remove
easing from this point, which can be done
simply by going back to the timeline Command
Plus click and gear so that there is no easing. And if I go ahead
and apply easing to this keyframe by going to keyframe assistant
and easy ease, you can see that this becomes an ease out graph
because there is easing on the outside
of this animation. And again, if I bring
up that website, you can see all
the Ease Outs have some sort of curve
happening here. Ease out, ease out cold. All of these have some sort
of curves happening here. So I hope you understand
when you call a graph, ease in and when you
call it graph ease out. And it goes without
saying that you've already learned to
read the sorts of graph is that the tangents here are forming the
same angle from here. So they are the
similar steepness if that's a word and then it
starts getting flatter here, which means that
it will start at a constant speed and
then it will slow down. It's going out. Now there are some precise mathematical values
that After Effects, It's applies to these graphs
when you go ahead and apply some sort of
keyframe assistant and then easy ease and we'll talk more about
the default values and how to manipulate them
later in the coming classes. Now, if I go ahead and apply
easing to this key-frame to by going to keyframe assistant
and applying easy ease. You can see that now it has
easing on both the side. And this graph is called
an ease in, out graph. And remember that
we're talking about this graph as a whole here. This whole value graph. Now so far, you know
about in graph, about Ease Out graph, you know about
ease in our graph, and you also know about
the boring linear graph. Now, all these things are
the very basic template, easy things that
you can just add to your animation to make
it a slight little bit, a slight bit more natural, a little bit more interesting, but nothing much with
all of this information. Now in your head, we are ready to start working on a project that will
require a ton of fiddling around
with motion graphs to obtain a desired change. So that is something that we'll be doing in
the next class. And I can't wait to
get started on it. Take a short break and I'll
see you in the next one. I mean, the next lesson.
4. Your Handwriting is Unique: Here's a secret. You might not know. It's that your handwriting
is unique. Very unique. And I don t think we can ever copy anyone's
handwriting to the t. I mean, there's so much
that goes into what develops our handwriting and makes it look the
way that it does. I had a friend when I
was quite young and he had a beautiful handwriting
and more than anything, I really loved the way he wrote for it and so I copied it. There are so many such instances
and occurrences that has seeped into the personality
of my handwriting, most of which I
don't even remember. You don't even remember the
last year while doing dishes? I swore I stick my thumb and that changed my
handwriting quite a bit. Just wanted to just
wanted to wait it out. It's still not properly heals. No further project. In this lesson, we're going to animate handwriting,
my handwriting. Your handwriting, anyone
else's handwriting? And all depends on how you decide to move forward
with the project. Now, if you go into
the project and resources section here at Skillshare and
download the files. Under the main folder, you will find this another
folder called occurred. Inside this folder, this
file called starter file, and you need to
double-click and open it. What do you will
see is this cart written in my handwriting, I wondered right in my name, Nash here, but that'll be
too much of self-indulgence since I read the
first name of one of my favorite writers,
Kurt Vonnegut. They are ready to
start if you want to know how this Curt, this right here, God here. I just traced it. I wrote it on paper, and I traced it in
Illustrator and imported this path
into After Effects. If you want to do that and
not work in this file, just knock yourself out,
write something down, trace it in Illustrator and
bring it into After Effects, and just continue as I will continue with this
file right over here. Now there are two layers
that you will notice here. First is Kurt, written
in cursive, alright? And the second is just
the cross of this t here. This is a second one. So two layers occurred
and the T cross. Alright, great, time to begin, Javier, we're going to
start is like this. I'll do something with the
curd written here, this layer. And then I will leave you to do the same to
the T cross, right? So after I'm done,
just pause the video and see if you can do the same
set of actions on T cross. Alright, so I'm
just going to hide the T cross for a bit and
concentrate over here. So the first thing
you'll wanna do is you want to unfurl it, right? And then you will see contents. I'm going to go into
Add click here, and I'm gonna go ahead
and add trim paths. Now what trim paths does is
gives you these two options, start and an offset. And what you can
do using this is basically if you drag and you can make it look like
it's being written. So that is very cool. So let's leave it here. I've added trim paths, and let's go ahead and do
the same with T cross. So I'll unfurl it. It's for you to do don't
wait for me to unfollow me. I'll go into Add and I'm going to go ahead
and add trim paths. And as you can see,
these three options are added here too. And there you are. Let's again hide the
T cross and start concentrating on this
big chunk of text here, which is Kurt
without the T cross. And remember that
I've already added trim paths to both of them. Now I'm going to go
ahead and do this, set a keyframe at t
equals 0 for end, and I'll change the end
to be 0 here, so just 0. And now I'm going to
move ahead to 1 second. And I'm gonna go ahead
and set n to 100, right? And if I play it now, you can see that
if it looks like it's being written, great. We have a simple animation now. Good, but what trapping up a pen and a paper if
you have it nearby. And notice that when you
write curt or anything, the pen doesn't move
at a constant speed. It's sort of speeds
up at some point and slows down at the
curves, et cetera, right? We're going to recreate the same variation of
speed and After Effects. Now, let's get started. Now I can scrub through
the timeline to see how the animation
is progressing. And I can use this to identify points where
they're winding, slows down and create
keyframes there. So the curl of this case stem here is where we will
create one keyframe. So all you gotta do is
stop the scrubbing here, go here and click here. So add one keyframe here. The k is face curve is another point where the
handwriting Church slow down. So I'll go ahead and create
another keyframe here. Now, let's move ahead. And I think we will
just let you be as it is and add another keyframe
at this point of arc. So I'm going to add a keyframe
here and then forward and add another keyframe
for the curve of t here. Okay, So we have just
identified points where we would
like the animation is slowed down a little. Because when you're
writing your hands sort of takes its time to write
these curves, right? So if I play the
animation again, it will be the same. There'll be no variation at all because we haven't
really played, played with the
graphs yet, right? It was just added keyframes. Now let's go ahead and
peek at the graph. And to pick up the graph,
you're going to click here and make sure that this
property selected, which is end for now. And also make sure
that you're looking at the value graph and
not the speed graph. And look at the graph, it
is pretty much straight, pretty much resembles
the linear graph. And therefore there is
no vibration speed, there is no personality, no nuance says whatsoever, we're going to change that, but before that time
for a shortcut. Now, remember how in the previous lesson I told you you can select the keyframe. Right-click, go to keyframe
assistant and easy ease. Well, they're just
good for that, but just written right
over here, It's F9, right? So what you can do is
select all the keyframes and then press F9 and be
mindful that in some keyboards, so you have to pull
the function key before pressing F9, right? So I'm gonna go ahead, hold the function key,
press F9 and look at that, how the shape of the keyframes have changed and what
doing this adding Easy Ease also does is that in the graph
you will see that it also adds handles to show the keyframes for
easy manipulation. If you're seeing
your graph pretty much cramped towards
the left side, you can go ahead and
click this button here that says Fit all graphs to view and we'll
just stretch it, fit it so that it's
easy to manipulate. But the thing to notice
here is that how the graph shape
changes once Easy, Ease as Abbott and if I
play the animation now, you will notice that there is very meniscal of a difference, not something that you
can really notice. But let's go ahead and start
playing with the graph. I'll zoom out a
bit on the canvas. I'll select the end property
again to bring up the graph. Let me zoom out a little
and start playing. Let's start with this
key frame right over here that makes up for
the curl of the k. I don't remember that what
we discussed and the crux of all the videos before this is that for a value graph, flatter equals slower and
steeper equals faster. So right now, right over here, the graph is super flat, okay? It's not super flat,
it's a little flat, but let's go ahead
and try making it super flat. And
how do we do that? Is we just extend this. So if you hold Shift, you can make it move
in a straight line. If you don't hold
shift and it wobbles. So I'm gonna hold shift
and move this forward. And I'm going to hold
shift and move this backwards so that this
area is super flat and this area corresponds
to this curve if k. So let's start playing this part of the
animation again. And you can see that there
is a slight slowing down. And then again, we can move
it a little back, right? It hits the correct point. And you will notice that
while manipulating graphs, there will be lots of
tiny backs and forth, fourths back and
forth that you will have to do to get a
certain easing, right? Right. So that's
what I'm doing here. And these, these yellow dots, I hope you know, already
correspond to the keyframe. So moving it here also moves the keyframe in the timeline. Now at this point, you
know that making this flatter slows down the animation and we know all the curves vary. Want to slow down the
animation and they're all represented by these dots, these points where
the graph changes. And you can go ahead and
try doing it on your own. Because what I'm
going to do now, it's a very manual work or
you can just watch me do it. Whatever, you decide time for
this loop of k. So again, I'm gonna make it flatter. I can go ahead and hold Shift, drag it so that it looks
flatter and you'll also need to like play
it over and over again. And what you can do
in After Effects is trim your work area to a certain extent so that
it only replaced that part. So I can go ahead and
drag this like this. And I can go ahead and I can zoom in so that when it plays, it will just leave this
area that I'm trying to see the whole animation. Right? So yeah, that
looks pretty good. Okay. Okay, slows down there. To make it slow
down a little here. So let's make it flat. Okay, let me extend
this to the whole area. And then I can go ahead and
make the T's loop a little. And the end is something
that we will manipulate a little so that it looks
like it reaches the end. So I'm going to
extend this and meet the super flat, right? So then there is a nice, There's a nice slowing
down at the end. If you don't get to
collect slowing down, it can also just move this
keyframe a bit ahead, like so. So then you get a
little slowing down. I can also move this like this, just making sure that it
stays flat for the most part. So let's truly, yeah, pretty cool. Let
me play it again. We see that it is non-linear, plus there is some little bit of personality to
the writing now. So again, let me go
ahead and play it. Cool. I'm going to do is
make the animation take a little more time. So when I can do is
select all the keyframes, hold Option on Mac
or Alt on Windows, and drag it so that it stretches the
key-frames like this, so that takes a little more
time and also make sure that the work area takes
him enough space. Yeah, you see that? That's a, that's
a nice animation. Now let's bring in
the T cross for the final cherry
on the animation, I'm going to collapse
this height it bring, bring the t cross up. If you've been following
along, you can go ahead and give it a
shot on your own, animating the T cross
the structured animate, swish, fast in the beginning and then slow down in the end. So give it a shout
if you want to. And while you're doing that, I will give it a shot myself. So I'll go down
and phosphorylate, go to the end property. I'm going to go ahead and
create a keyframe, make it 0. Move ahead a little. And I'm going to make it a 100%. And now if I play it,
you can see that, Whoo, yeah, very linear, very bad. Don't like that. So
select the keyframe. Keyframes. Press did
I just say keep, re, alright, so, so
I like keyframes, press F9 to add easing. And then let's go ahead
and try manipulating. And I'm going to zoom in
a little on the graph. The first thing we
want is to start fast. So you want to make sure that the tangents that
are drawn this, this side of the curve
are pretty steep. So how do we do that?
How do we get steep? Just make it move like that. Then I wanted to slow
down towards the Android. So I can go ahead and
make it more steeper. Let's see how much
deeper I can make. So I'll make it
like really steep. And then as it reaches this point gets flat,
it'll just slow down. So let me go ahead
and play it. Yeah. Right. So starts fast and then
boom, it gets slower. I'm going to make it
more steep actually. So I'm gonna go ahead
and try it again. So I like this, I like this, and I'm gonna go
ahead and move it closer so this happens
quicker, right? So yeah, I like that. I'm gonna go ahead and
turn back again so that I can adjust the keyframes
position properly. So I'm going to select
the PTE graphs breast you to reveal all the
keyframes now it has. And I'm gonna go
ahead and let's say that as it reaches this point, I want the T cross
animation to happen. So I'm gonna go select both of these key frames by holding Shift and drag them here, right? So let me go ahead and play
that animation again. Okay? Yeah, or maybe you know what, can wait till the whole T
is written like naturally. So let me go ahead and
have a look at it again. Just a few minor
adjustments here and there. Yeah, So I'm gonna go ahead and play the whole animation again. And you can see that
it's pretty cool. And I have deliberately
made it like way slow here, which you can notice
like at the curves. And if you want to make it a little faster, you
know what to do. Go to the, go to the graph. Select end here and make
it a little less flat. And how do you make something
a little less flat? You just go ahead and
move it like this. And if you notice
that only one side of your curve is changing and the other side
doesn't respond. What you can do is right-click
here and select Keyframes. Keyframe Interpolation
changed from Bezier to continuous bezier. And if you click Okay,
you can see that you can change both the sides
with the keyframes. So I'm gonna make a little,
little less flat so that it doesn't totally
Hall dan dot point. Yeah. Pretty cool, right? And that's what I'm
going to do here. Right-click Keyframe
Interpolation, change to continuous bezier and then
make it a little less flatter. And then same thing here to
key-frame interpolation. Continuous bezier and yeah, yeah, Cool, cool, a little less flat, not totally whole thing. So now if I run it, you can see, yeah, that's
pretty cool, right? Like you are seeing that
it takes a couple of back and forths to get it right. I think we're pretty
much done here and I've conveyed how to use
the value graph and you know how you can
adjust the steepness or how flat curve is
to control the speed. And we are done with
the animation here. Everything that I'm
going to go and do a head of this is
just a cherry on top. I'm going to show you a few
effects to make it look like it's been written
and fountain pen, etc. So if you want to
hang around for that, hang around for that, but you're all set and ready
to move to the next video. Okay, So let us go ahead
and add some effects. Alright, so the
first thing we wanna do is just collapse
all of these. Select both of these and press
command shift C on Mac or Control shift C on Windows to precompose these two
layers into one, I'm going to let the name be pre-comp one and I'm
going to click Okay, the next thing that we
will do is we'll go into Effects and Presets panel. And you can find it in Windows if it doesn't
show up for you, you can see that here
is effects and presets. We're gonna go ahead and
search for Guassian blur. And I'm going to double-click
to add to this precomp. Now let's go ahead and drag
this to something like 12 or 13 to make it this blurry. The next thing that we're
going to do is search for levels and effects and presets, and then double-click on this levels under
color correction. So double-click on it
and it gets added. Now what you're going
to do here is go ahead and change the channel to Alpha. And we're going to adjust
these three sliders here. But let's go ahead and move
this towards the left. And it will take this slider and move it towards the right. And you can see that
it clears it up. And then you can adjust the position of
these three to make it thinner or thicker
depending on what you like. Now this seems okay to me. So if I go ahead and play again, you can see that
it sort of creates this little wells of ink that form when you
write with a fountain pen. And this is the effect that
I was trying to go for. And this is the
effect that we got. One final thing
that we're going to do is create a new
adjustment layer. So go to Layer New and
select Adjustment Layer. In the adjustment
layer, we're going to add turbulent and displays. So let me search turbulence. Whoops, turbulent
displays, right? Sometimes I forget the name. It's turbulent displace. So double-click and
make sure that you are applying it on an
adjustment layer. What adjustment layer does is that everything that's below this adjustment layer
and this layers panel gets the effect that we apply
on the Adjustment Layer. So double-click and you've added it to the
adjustment layer. This makes this whole
thing very wonky, but let me go ahead
and adjust it. The only thing that
you wanna do is set the size to something small, like two, for example. And now you will
see that it gets some sort of a
roughen edges, right? And that's pretty cool. You can play around
more with the size to whatever to your
heart's content. I'm just gonna go ahead
and leave it up to. Now if I play the animation, you can see that it
has the roughen edges added to it because of
the turbulent displays. But let's go ahead and add
one little final thing. It says small expression. So hold Option on Mac or
Alt on Windows and click on evolution's a
watch icon here, which will bring this panel up. And in here I'm
going to do right, this posterize time
eight in the brackets, a semicolon and then time into
800 and a semicolon again. And if I click out, and now
if I play the animation, you can say that
there is some sort of character to the
roughen edges too. And that's it. That's all we wanted to
add to this animation. And I hope you followed through, and I hope you've finished it. And if you wanna know
more about expressions, I have another class on
Skillshare that you can watch, which I will link to in the description or I'll talk about in the conclusion video. But yeah, this is the animation
that we make together. Pretty great. Now for this entire class, to manipulate the speed
of the animation, all we did was manipulate
the value graph. Lest you forget, let me remind you that there
is another graph, coal the speed graph. And if you go ahead and, um, as you're working
on your project, if you go ahead and peek
into the speed graph, it will not make sense to you if you've not
already familiar with it, but just perfect because
in the next class, we are going to dive deeper
into the motion curves. And we will talk more about the speed graph and
the value graph and how they're connected. And I'm very excited, are you? I hope you are. I'll see you in the next lesson.
5. Advanced Easings: Okay, welcome back. We are to knee deep into
this now to turn back. So all my hand and follow me. That sounds like
a sketchy thing, but it's not, it's actually
a very good thing. The number one thing
to understand is that value graph and
speed graph are not exclusive of each
other as in they don't exist separately
on their own. There are two different
but connected ways to show the same animation. And since they are connected, the change of shape of one
affects the shape of another. And often animators
while working on a project switch between the
speed and the value graph, depending on the
context of which graph is easier to manipulate to
bring out the desired effect. So let's go ahead and
take a bit of time to understand how
they are connected. Okay? The simplest way to
put the difference is that value graph shows how the value of the
property in question, which right now
here is n. So how the value of the property in question is changing over time. And the speed graph shows how the speed of that change
happens over time. I know how complex
all this sounds, but it's not just bear with me. I wish it was possible
to show the changes happening in both of the
graphs side-by-side, but After Effects
doesn't allow that. So we'll make the change in one and then switch to the other to see how the other graph
response to that change. Also notice the unit
of the numbers that are here on the left
corner or the y-axis. The value graph, if I
go to the value graph, it is basically the
value of the property. And then the speed graph it is the speed of change
in the set property. If unit of value is in-person, which right now as you can see, this property has
unit of person, and that is what
is visible here. The label of the speed graph on the y axis will be
person per second. Now, for the scenario where we wanted to make this
loop of the k, this loop of this k
to animate slowly, which basically corresponds
to this key frame and the speed graph
or this keyframe, which is the same
keyframe actually in this key frame and the value
graph and make it slower. What we did is we made
this curve, this point, the curve around this point
flatter instead of like this, we made it something like this. Which is because we know
that in the value graph, as the tangents gets flatter,
the speed decreases. So the two ways in which I can make the animation
happens slowly at this point is by making this curve flatter in
the value graph or just going through
the Speed Graph and clicking this note
and pulling it down. And notice, as I lower it down, as I lower it down, notice that the value graph, this point gets flatter. Okay, so one more
time I'll go to the speed graph and let
me increase the speed. And as I increase the speed
by moving this point up, you will see that
the value graph around this point gets steeper. And one more time, if I go back into the speed
graph and a fight, decrease the speed by
pulling it down like this, you will notice that
the value graph gets flatter and vice versa. If I make this
curve flatter here, you will notice that
the point here goes down and touches almost 0
because it's so flat there. Sometimes it is easier to
manipulate this graph, which is the speed graph. And sometimes it is
easier to manipulate the value graph to get a
desired result in an animation. Now that you understand these two graphs,
more than nothing, I hope we'll see a
few small examples of value graph and speed graph
for some common easy things, just so that all of
this information sits in your head better. We'll also see how
changing the graph, any of the speed graph or the value graph effects the
shape of the keyframe, right? You know, this is a shape, our glass shape, this
is a linear shape. We'll see how that goes, how changing the graph affects the shape
of the keyframes. Here we are back at
where we started with a square that's rotating from
0 to four to five degrees. I'm sorry, I should
put my phone on. Silence. Yeah. So we are back with this
square root of 45 degrees. This is all you're going to
take away from this class, is how to do data square from
0 to four to five degrees. But anyway, anyway, let's, let's scrub through
this animation. And somewhere in the middle, what I'll do is I'll
add another keyframe. So all this little square things you don't
need to follow along. This is just for
demonstration, right? So even if you are
falling along, its a good thing, but
you're not required to. Okay, so we've added
another keyframe in the middle of
these two keyframes. And what I want you to notice is the shape of these keyframes. And the shape of these
keyframes look like two triangles joined at
their base is right? And there's a reason
why I called the Shape two triangles joint at their
basis and not a rhombus, which is the actual legal
name for this shape. Because it'll be clear in a bit. Hang on. Also, remember that after effects by default
applies linear, easing the keyframes
that you create as can be seen in
the value graph. Yes, I am the value graph, which is a very straight line with no features whatsoever. When you see keyframes
with the shape of two triangles join at
their base says it also means that the
keyframes have linear easing applied on both in and out. Now, what do I
mean by n And out? In the previous
video, we learned how to add easing keyframes. One is by right-clicking. I'm going to keyframe
assistant and selecting easy ease or
pressing the shortcut F9. Another way to do
this is like this. You go into the graph, you select a node or a keyframe. And notice how we restrict the whole graph
is what I will do now is click here where
it says, Easy, Ease out. And as soon as I click here, notice how it adds a curve towards the direction
of this keyframe. Left side of this keyframe
is the indirection, and right side of this
keyframe is the direction. Similar like we already
have talked about the whole motion graph having
in on the left side and out of the right
side when we were talking why certain easing is called ease in or ease out,
you already know about. So it also appears
that every keyframe, every node also has an insight on the left
and outside on the right. So when I click this node
and clicked over here, which says add easy, ease out. It added a curve towards
the owl direction of this keyframe with the
same keyframe selected, I go back to my
timeline and look how the shape of this
key frame has changed. The left side, the
insight is linear, whereas the outside has easing applied to it
and hence this shape. Now if I go back to
the graph and select this keyframe again and go
over here where it says, add an easy ease in, you
know, what will happen. We'll add a curve towards the
indirection of this node. And if I go back
into my timeline, you can see how the shape of
this keyframe has changed. It's not an RTOS. I mean, it looks like an RTOS, but there are two parts
of it through easy on the left side and there's also
easing on the right side. This is what the
shape indicates. And remember that the
shape has nothing to do with the exact
curve of this side. All it shows that
this is not linear, but there is some sort
of easing applied. That's it. Now, if
I undo everything, go back to my timeline. Select this key frame in
the middle of Right-click, go to keyframe assistant. And I'm going to add easy ease. And can you tell me which side of the keyframe shape is going to change, please? I hope that you said the
inside we did the left side. So if I add easy, ease and
you'll see that half of our glass is added to the inside and the rest
half is a triangle. And if I go back into my graph, you'll see there's
easing on the inside. And similarly, if I go back,
right-click this keyframe, go to keyframe assistant
and easy ease out. It has now easing
on the both sides. Me who? There you go. There are
multiple ways to add easing to thereby that either by
this and that's pretty cool. That's so much
information for you. I hope you are handling
everything properly. And if I go ahead and do everything again and go
back to this keyframe, right-click Keyframe
Assistant and select Easy, Ease in and what will happen. It will add easing on both
sides of this keyframe. And then again, we'll
have the same graph. And again, if I go ahead
and undo, select this node, and I'll click over here and it will do the very
same thing again. So I hope this back-and-forth
and everything, it's making sense to you. And I'm pretty sure that you're understanding
this because I haven't went over
this so many times now. But allow me one last time, one last time I'll
go brisket Mansi, make it a linear, select
this keyframe and press the shortcut F9 and vamp. The same thing
happens. That's it. This is the last time
that I'm doing this. And at this point
I'm also hoping that you can read this graph. So what will happen is that
it'll start at some speed, slow down here
because the curve, the value graph is flat here and then pick up
speed again, right? So if I play this loose
slows down, goes back up. And if I go back to
the speed graph, you will notice that
it starts off, goes, speed goes really low, almost 0 because the
curve is flat there, and then speed increases
and decreases again. Pretty cool. Let's go
back to our timeline. Now something has to be said
for the extreme keyframes, the first one and the last
one in any animation, not just one, the
first keyframe, there is no indirection
because this is the point where the
animation starts from. And if we add easing towards
the inside of this keyframe, it won't really do anything. And similarly, for
the end keyframe, if we add easing towards
the outer direction, it won't really do anything. So let's go ahead and look at me doing something not really affecting
the graph at all. So let me go ahead and go
back into the value graph. And I'll select this keyframe, which is the extreme
keyframe, that end keyframe. And I'll add ease out to it. And you see ease
out has been added. Of course the shape has changed, but it doesn't
really do anything. Similarly, if I go to the
first keyframe and add ease in towards the left
or the indirection. It has added easing, but it won't really do anything. And I think that was
just self-explanatory. I just wanted to go over
it for completeness. Now one last thing
that I want to show you here is if I go back to this graph and go back
to this node over here. And you know already
that you can change the steepness of this graph or the flatness here to
control the speed. And we've also seen that how these graphs
are disconnected, and we've also seen
that how you can connect them by selecting it, right-clicking,
going to keyframe interpolation and choosing
continuous bezier. Now there's another
way to do it. If I go back, I keep
saying go back. But if I go to the speed graph and look
at this point here, and if I wanted to
raise its speed, and what I'll do to
raise the speed again, very normal action is
I'll click and drag, but you'll notice that these
two points are disconnected, which is not right, and
y are the disconnected. It's because this value graph has two different
curves on each side. And that is why there are two
points in the speed graph. Now there's another
way to connect this. Other than right-clicking and going to keyframe interpolation, selecting this
double-clicking here and then clicking
on continuous lock, lock both the incoming
and outgoing direction. So if I click on it, click Okay, you'll see that it
becomes a single point and then I can move
it up or down. And that will change the
value graph how it should. And also this point is also a single thing now and
I can move it around. So that's the one thing
that I wanted to show you. That's the one last thing that I wanted to show you
in this lesson. Yeah. Yeah, that's it. That's it. That's it. That's it. That's it with this lesson. I didn't really have anything to say in the conclusion except I'm hoping I'll see you in the next one as well in
the next lesson. Bye.
6. Animating Position: Okay, Welcome to this lesson. This one is a shortest
lesson of this entire class. So far in this class, we've only been
animating properties like scale or rotation or the end percentage
when we were working with the curd
handwriting animation. And there's a reason for
that is because all of these are unidimensional
property as opposed to, let's say something
like position, which is a
two-dimensional property. And it'll be clear
what I mean when I say 2-dimensional later
in the class. I just wanted to
show you the problem manipulating value graph poses when it comes to any property that has
more than one dimension. Now back in after effects
of gaba square root here, what I'll do is I'll go
to the position property, which I can reveal by selecting
the layer and pressing P, I'll create a keyframe here. Move a little bit ahead
and timeline at any place, doesn't matter,
totally arbitrary. And I'll move this
grayer to this corner, the diagonally opposite corner. Now the way the position
property works, and I'm very sure that you
probably know this already. But if there's even one
student who doesn't, then this short explanation,
we'll help them. Now I moved this square
diagonally to this corner. If I look into the
position property, you can see that instead
of just one number, as in a unidimensional property
like rotation or scale, there are two numbers. The first one is x
and the second one is y. X means horizontal
and y means vertical, like we've already discussed in one of the previous lessons. Remember that? What does that mean?
A little nauseous. I don't know. I don't know. Some rapper x and y. I hope you remember that. I moved that. Do
you remember that? So okay. So the first number is x and
the second number is why? And unlike, like in
computer graphics, and unlike how it does on paper, where the bottom-left corner
is 00 or x and y is 0. And in computer graphics and also in After Effects,
this top corner, the top-left corner is the
origin where x and y is 0. Then as you move
towards the right, x increases and as you move
downward, y increases. And in this animation
where the square is moving from this
corner to this corner, both x and y values are changing because the square
is moving horizontally, but it's also moving vertically. You can see that
here as I scrub, you can see that these two
numbers change simultaneously. And if I go ahead and look into the value graph from here, make sure in value graph, you will see that
there are two graphs, one for x, one for y, and this gets kinda
hard to play with. So there is a thing
that you can do. You can right-click on position and to separate dimensions. And now you have different
graphs to play with. But even with
Sabrina dimensions, like in a general context, it gets really difficult to play with two
different graphs for position and to get
the desired animation. So let me press Command
Z and connect them both against without there
was a single position and not separated dimension. And because of the two graphs, what I and most animators that I've observed
do is that they directly go into the speed
graph because there was just only one graph to adjust. Right now there is no
variation in speed. It's a constant
and you know, it, it's because a0 or After Effects applies linear
easing by default, what I will do now is I'll
select both of these keyframes and go ahead and
click on easy ease. And now you can see that we have a little bit of ease
in the possession. And just by making changes
to the speed graph, we have changed the way
the animation happens. Something else you can do is you can shift the graph towards, let's say towards the left. I can hold Shift and make it
look something like this. Which if you have followed along some tutorials or course
has an Alpha effects, you can, you know that
this is very common graph. Would that change? This creates a very
different animation and I didn't have to go into the value graph and just two graphs units simultaneously
to get this, I could just go into
speed graph and it's just one single graph. And also changing the speed
graph, like I said before, it produces some sort of
change in the value graph, which you've already observed. So here you can see how you
can interchangeably either use the speed graph
or the value graph. They are both very much
connected as you follow more tutorials or the works
of different animators, you will notice the pattern of them jumping into
the speed graph directly and making these
making these Hale style graphs. Heel Stone graph is a term
that I just made up myself. You get the idea right? There's a slight
bit more nuance to this graph and a
few more options which reveal themselves
by double-clicking on any of these nodes which
we need to understand. And we'll be doing
that while building our final project
in the next class. So you don't need to worry
about them right now. And that's it. Something like
what, five-minutes? Yeah. That's all I needed. I
needed a little bit of time to tell you about multidimensional poverty
and their graphs. And I hope I have meant that expectation or what I
had hoped for this lesson. Am I making sense? But like I said, even though
this was a short lesson, lesson after this is going to be a very long one
because we are going to be working on our final project for
this entire class. But yeah, take a short break or don't take a short break
because this was a short class. And I'll see you soon
in the next lesson.
7. Final Project - Pt. 1: I've made a recent discovery. It's very delightful
and it's very subtle. And I don't know if
you noticed this, but if you go into
the YouTube app on IOS or iPadOS for that matter. And if you're watching
a video and if you press the like button, a very nice animation happens. I don't know if it will be
visible, but look at that. Do you see it? Look at that. Pretty cool, right? And also another thing
that I just wanted to remind you of is
that I hope that you have downloaded
the resources from the projects and
resources section here on Skillshare because
we're gonna be needing that. Now if you go into
the resources and into the YouTube lie can folder, you'll find this
video title example. And if I play it, you can see the same YouTube like
animation happening. Our job is to recreate this animation and
after effects while also revising everything we have learned about
the graph so far. Now you can try doing this
on your own for short. But first let me walk you
through the after-effects file that we'll be
using for this project. Now you are required to go
into the starter dot AEP file. I'll double-click to open it, and there it is. Now in this file, you
will find one layer, just one layer tied
to lie can very self-explanatory and
a few unfurl it. If you Command and
click on this arrow, it will unfurl all
the nested options. So that's a shortcut for you. If you just click it
without holding command and you'll have to unfurl the nested
options again and again. But if we wanted to
unfurl everything, you hold command and you
click here, inside here. If we go to the path property, you will notice that we
have four keyframes here. No, I'd like us to
understand where these four keyframes came
from and what they do. So this, the entire graphic is first of all
made of two parts. There is hand, which is
this part over here, the palm and the
common everything. And they're asleep, which is basically just this
rectangle over here. Now this whole shape, this whole vector shape was
created in Adobe Illustrator. If you look into
the project files under YouTube Line, Can, you will see a file
called handy cons.ai. It just a random name. I should have given
it a better name. But anyway, I can, if you have Adobe
Illustrator installed, you can double-click
and look into it. So as you can see
that inside the file, I have the different
states of the graphic, as in when the thumb is
in a normal position, but it is totally stretched and here in the middle
when it is regressed. And then what I've
done is simply brought these different shapes
into After Effects. Now there are multiple ways
in which you can bring a graphic from Illustrator
to After Effects. The simplest way is
to just imported, which basically every
YouTube tutorial and every class shows you. But what I use is this
plug-in called Overlord. And overlord is
not a free plugin, is it costs around
forty-five dollars. But if you're a serious about animating and
pursuing it further, I think it's a really
good investment. Let me go ahead and
show you a demo of overlord in just under a minute. Okay, I'll go back
into After Effects. I'll collapse all of this. I'll hide this and lock it. I don't want to mess
around with it. And now look at the
magic of overlord. I'll go back into Illustrator. I'll make sure that
this path is selected. And then I'll simply
click this arrow and bam, I have it here in After Effects. Pretty cool, right? And if I go ahead and unfurl everything, you will see that
the different paths here and here it's named
group one because I just exported it vanilla
here in like and I've prepared it and name the layers and
everything that way. That's why there
is pain and sleep, but here's just group one. But anyway, we have to
focus on the path here. And as you'll see, we have
this entire path here. And one thing I've made sure while preparing these shapes is that each of these shapes have the same number
of anchor points. And what does it mean to have seen number of anchor points? It's simply means like if
you look at these dots here, are these Bezier points. Which of these
paths were made of? Each of them have the
same number of them. And when paths have the same
number of anchor points, it means that After Effects can set keyframes between them. Which means if I go
back into After Effects and I've set a keyframe
for path here. Move a little forward, right? And I just want to bring in the keyframe or the
path for this part, the palm part, the hand
part, and not the sleeve. So what I'll do is I'll
select this and make sure that I can detach
it and bring it here. And then with this selected, I'll simply press this arrow, go back into After Effects. And now you can see that I
have two different paths here. And because they have the
same number of anchor points, After Effects can
animate between them. And I'll get rid of it. And that's how I have dropped in different keyframes for the path here and with the different
states of the thumb. Now, all of this,
everything that I said in the last
one or two minutes, it's something that
I only set for the completeness of the lesson so that you're not
totally in the dark. Hey, how did this vector
shape even get here? How did you make it? It's just for that
extra information and it is not the part
of the actual class, the actual class, the
animation of this hand starts. Now, know broadly, I'm going to divide the whole animation
into three steps. We're going to
animate the rotation, we're going to animate scale and we're going to animate
position broadly, broadly there would be certain small nuances here and there, but broadly, rotation,
scale and position. First of all, let's start with rotation and I'm gonna go
ahead and command click. Or if you're a Windows
Control click to just wrap everything up so that we have
just this visible. And another shortcut for you. If we're not already aware
with the layer selected, you can press R to bring up the rotation
and you know what? Let's go ahead and get started. The number one thing that you
want to make sure is that the anchor point of this whole graphic is on
the bottom left corner. And if it's not in the
bottom-left corner, if it's somewhere around center, what do you have to do is
press Y to bring up this tool. It's called the pan behind tool, also the anchor tool. It's right over here. You see Pan Behind Tool
or anchor point tool. And you can then start
dragging and hold Command on Mac or Control on Windows
to snap it right over here. One more thing before we start is that what we
wanted to do is again, I'm going to command
click and unfurling. We're going to take all these four keyframes
and drag them way to the right because we don't want them interfering
right now when we're, when we're doing rotation,
scale and position, we'll bring them back later to add more personality
to the animation. But for now, let
me just go ahead and push them away to the right. Not really concerned with them. Go ahead and select the layer, press Oregon and there'll
be our head rotation. Let's go ahead and put
the first keyframe at 0 seconds like that. Since a major action is
the hand rotating upwards, we will add a little bit of
anticipation to rotation by adding a keyframe,
another keyframe, a little bit ahead in time, and then rotating
it down like this, Let's say around ten degrees. Now we will move a
little ahead in time and rotate the hand to
its peak position. So I'll just go ahead
and drag this backwards. So I think it's something
somewhere like here. It looks good. Once we are. So it's anticipates it goes
through the top position. Then I'm going to move
ahead and bring it back to its initial position by copying
Command C and Command V. So we've got anticipation, it reaches its
final position and then back to the
initial position. And that's it. We're done with the project. No, I'm just kidding. Uh, to robotic tour robotic. First of all, there is no personality and
only easing so linear. So of course we're not done yet. Let's go ahead and
keep working on it. Its first thing
that we're gonna do is select all the
keyframes and use our trusty old shortcut of F9 to add easing to all of them. And if I play it again. Okay. A little better. A little better. But not there yet. Look at it. A little better,
but not there yet. Let's go ahead and
look at the graphs. And for this, I'll
be directly editing the speed graph and
not the valley graph, because in this context, it's just easier for me to
manipulate the speed graph. One thing that we have
not talked about yet is this parameter in the speed
graph called influence. If you want to be mathematically precise with your easing
in the Speed Graph, you can double-click
any of these nodes. I'm going to go ahead
and double-click here. And in the pop-up window, you will see a parameter
called influence. Also, what you will
notice is that this whole pop up window has two parts, incoming
and outgoing. And we have discussed before, incoming is things
on the left side and outgoing are things
from the right side. Since we clicked on this node, which is the first node, there is no real
incoming for it, which is something we've
already also discussed. So whatever we put in here, or any value won't
really affect anything. Changing the outgoing part
will affect the graph. Now, when you add easy
ease to a keyframe by either right-clicking and
selecting easy ease or click a gear or clicking
here, or pressing F9. What After Effects does
this automatically applies the influence of
thirty-three point three, three percent through
the Speed Graph, which works perfectly for
motion of small ranges, like for small movements, influence of 33.33
per cent works well. We're going to go ahead
and leave it at 33%. Because this, this, this
particular range of motion is for the little anticipation
in the ham that happens. And since it's a small
range of motion, again, we're gonna go
ahead and leave it at 33%. We're going to click Okay here. Now, this second
node is something of interest since it has both an incoming side
and an outgoing side. For the second note,
we're going to go ahead and keep incoming at thirty-three percent
because n is the left side and it's
part of this graph. So we're going to
leave it at 33%. And what we're going to
do for the outgoing, we're going to go
ahead and change the influence through
something like, let's say 75%. We're gonna go ahead
and click Okay, and you'll see what it did. It simply increases the
length of this handle, which can very well be done by also dragging this handle
to the left or the right. And that's all
basically influences, either do it precisely by double-clicking
and adding a value there or just arbitrarily
to your own liking, drag this handle anyhow
for this particular graph, we also want this side to have a 75 per cent influence
on the speed. If you want to, you can
go ahead and do that. But here are the steps, double-click it and since
we want it on this side, we're gonna go ahead and
manipulate the incoming site, which is right now at
23, a default value. That's 75. And we're going to click Okay, and now we have a halite
graph in the middle, very relevant or irrelevant. You have a good starting point. Let's go ahead and
play the animation now and see what it looks like. I'm going to press space. Okay? Okay. One thing I want
to make sure it, since this is a very, this animation lasts
for a small duration. I'm gonna make sure that
it's less than 1 second, so basically till 24 frames. So I'm going to go ahead and position the marker
at the 24th frame. You can see the frame
number I'm ad from here, or your ad from here. It's After Effects
is for everyone. So select all the keyframes, hold Option on Mac
or Alt on Windows, and go ahead and
drag it like this so it fits within 24 frames. Now, what I wanted to do next is I want the
anticipation to last. Not so much. I just want it to last
for like three frames. So I'm gonna go ahead and
position the playhead, add 0. Then on Mac you can use
Command and right arrow, and I believe on
Windows Control and right arrow to move a
single frame forward. So I'm gonna go ahead and move
to the third frame, right? So Command 123, and this is all, this is how long I want to
add dissipation to last. So I'm gonna go ahead
and drag this to here. So now the anticipation
is like this. Okay, Cool. And also what we want is that the hand to linger on this
pose for a little bit. And remember how we made the
value graph a lot flatter on curves of k When we
were animating K incurred. You're going to do
something similar here. Okay, Let's go ahead and
go to the value graph. Go ahead and go to
the value graph. And what I wanted to do is
to flatten this part here. So make sure that this
node is selected, which is the peak point. And I'm going to go ahead
and select this part. First of all, let me
zoom in a little. I'm gonna go ahead and
select this part hold Shift and just drag it out. It will just make
it more flatter here so that it lingers
on this position. And I can go and go, keep
going back and replaying it. And you can see that, yeah. Well, the flatter I make, the more that it
will linger here. So let me go ahead and make
this a little more flatter. Yeah, you see it? It just goes ahead and
stored up balls is at this position and it is because
I flatten this part here. Now you can see how value in speed graphs are used
interchangeably. This change, the
flattening has, of course, rippled out to the speed graph, as you can see here. And in turn, it would have also changed the
influence of bed, which is a 100%,
which is alright. We only use their
influence to give us a base animation on top
of which we can build on. Also, if you look, if I go ahead and play back, look at how the, the way the anticipation ends
is a little sharp here. So let me go ahead and play it. And you can see that it's a
little sharp but just pure. I just wanted to be
a little smoother. I'll go back to the
value graph here, zoom in a little bit more and
trying to make it flatters. So I'm gonna go ahead and hold
Shift and make it flatter. And I can also move it
forward and backward. You can make changes
that the plane with graphs is all about making minute changes and isn't the sort of thing that you
can disappear in sometime. The devil's in the details, that God is in the details
whenever in details are what makes anything better. So, yeah, some
back-and-forth, of course, is always needed
as I've reordered, agitated and repeat it
a lot in this class, but I made this part
a little smoother. So let's go ahead and play
it again and see if it ends that sharp leave and
then dissipation ends. So I'm gonna go ahead
and press Space. And yeah, it's not that sharp. It's sort of smooth, which
is good, which is good. We're getting there. Now. We need to play around
with scale a bit. We want this hand
to shrink during anticipation like when it
goes from here to here, we want it to shrink
a bit and then burst into bigger size as it
reaches this peak position. Let's go back to our timeline where we
can see the keyframes. You can select the layer. And if you already have
a property visible, you can hold Shift
and press a shortcut. So I'll press Shift and S to
bring up scale here, right? And then I'll go to
0 times 0 and pop in a keyframe at a 100%
scale at time 0. Then during anticipation, what I wanted to do is I want to shrink the size to
something like 90 or 87%, something like that,
very arbitrary number. And then as it reaches
the big position, what I wanted to do is
increase at scale to something like a 110 or let's
go with 115 year. Okay, So it goes like this, shrinks and then
pops up there and then goes back again as
m as it is coming back. I wanted to go ahead and copy the initial scale keyframe and paste it here so that
wild coming down it's shrinks to its
original position. Okay, now if I play
that animation again, you will see that the rotation and the waste scale animates. It's totally out of sync. And it shouldn't be out
of sync because there is easing applied to all these. Rotation keyframes and there is just linear default easing applied to all of
the scale keyframes. We need to get the rotations
easing onto scale. To do that, we can use a plug-in which is
called e's copy, which you can see
right over here. It's a $15 plugin, which I know not all
of you might have. So let's give easy, ease to all the keyframes
and adjust them manually. So what I'll do is I'll select all these keyframes
again for scale, press F9, and now all
of them have an easing. Now to give an exact
easing, the gift, the scale exactly
usings and the graph shapes and everything
as rotations. What we need to do is
we need to go into the speed graph of
rotation from over here. Yes, we are in the speed
graph now and then copy the influences on each node
and paste it into scale. So let me go ahead
and start doing that. I'll double-click this note. It's 3733. I'll go to scales speed graph. I'll double-click here. And since it is a two-dimensional property and
x and y both are changing, we're going to make
sure that lock Dimensions is checked and we're just going to paste
the values here. As you knew. Sorry, as we saw
in previous graph, we had it at 37% and the outgoing at
thirty-three percent. We're going to click Okay here. Alright, we're gonna
go to rotation again. Double-click here. We've got 86.567 to five. Go to scale, double-click 86.56. And what was done was that 75? Guess it was, I'm
going to click Okay. And you can see that
the graph shape changes to a mimic exactly how this is. So I'm going to check
again with 7575. Let's double-click here. We've got a 100100. I'll go back into scale,
double-click this node, give it a 100 here, and then another 100 here. And fame, we've got this graph. Let's go ahead and look at
the last keyframe here. It's got 3316. So go back to scale. We've got 33 here. And it doesn't really matter the outgoing part because
it has no outgoing part. But anyway, let me just write
16, okay, doesn't matter. Now, if I go ahead and play it, you can see that the scale and rotation are totally in sync. As you can see, all
that work of copying and pasting could have been avoided if I just
selected all of this, went to the East copy, plug-in, copied it, and then select that scale and
just paste it in. But again, I know, I know. I find it really kinda frustrating when I'm watching a tutorial and a paid
plugin comes up. But anyway, we're not
using a paid plugin here. I was just showing you that this plugin exists
and we can use that. No, she would go into your resources and you look into the YouTube
lie can folder. You will find this
little text file called elastic
expression dot TXT. I want you to open it, copy everything in it, and then come back here. Let's say rotation. Just to begin with Option, hold, Option on Mac or Alt on Windows, and click the stopwatch icon, which will bring up
the expression editor. And right here, I just
want you to paste it command V and click out
and not worry about it. Okay? I want you to do the same
thing with scale to option, click Command V, click out. Nothing to worry about. Endless. Click hold Command or Control on Windows and just
collapse everything. And if I play the animation now, well, nothing really
happy. Oh ****. Did I do something wrong? No, I did not do
something wrong. The way this expression
works is that you need your last key-frame
to be linear easing. So how do you change
this to linear easing? You hold Command on Mac
or Control on Windows, and you just go ahead
and click name in BAM. And now if I go
back and play it, whoo, there's some bounds. There isn't in
someone's life there. You're right, Cool. Alright, now we are almost
done with this animation. We need to add position and
all the hand shapes here. But I realized that this, that this video is touching
the 20-minute mark. So I will stop right
here and I'll make another part of this lesson
and I'll see you then. So hold on, hang on, take a rest, drink some
water, and come back.
8. Final Project - Pt. 2: Okay, welcome back to part
two of the final project. So far we've been able to
animate scale and rotation of this hand and also give it a little bit at bounciness
using expressions. The next thing we want to do
is we're going to bring in, bring up the path property, which is over here. These two paths, which
we've already talked about, the keyframes of which we've pushed away towards the right. It's time to bring them back in. So I'm just going
to drag them in, position them at the
beginning of my timeline. And let me just go ahead
and adjust these so that they match the
anticipation and everything. So this part is actually when the thumb kinda
regresses the patient. And then the extreme
pose over here with the thumb stretched and
then coming back to normal. So let's go ahead and play it. It won't be perfect, but let's see if it gives us, gives us an idea of
the final animation. So, okay, yeah, so
it's definitely not proper because it's
moving in a whole different out of sync. The thumb, what do we need
to do here is bring up the easing from scale to
orientation to the path. Now, earlier, you saw me copy and paste the
influences, right? You can go ahead and
do this same thing. But what I'm gonna do
is I'm going to go ahead and use the
e's copy plugin. So I'm going to go ahead and
select scale or rotation. Does it really matter them
have the same easing. I'm going to click on Copy. I'm going to go ahead
and click on the path. And I'm going to go
ahead and hit Paste. Ease. Okay, And then
I'm gonna go ahead and play that animation and
look at this right now. It's pretty much in sync. Let me go ahead and zoom
in and see if I can make certain adjustments.
Let me play again. Yeah, pretty much in sync. What I can do here is maybe
move this peak position for a bit ahead so that it
lingers for a bit more. So let me do this and let
me go in and play again. Yeah. Yeah. Everything looks perfect and
everything looks proper. The only next thing that
we need to add right now is the animation for
the position property. So let's go ahead and do that. Let me go ahead and
select this layer and press P to bring up position. And I'll go ahead two times
0 and create a keyframe. Now I also need to match
it with rotation or scale. I'm just gonna go ahead and
press Shift S to bring up scale so that I can match
the position of keyframes. And as it is anticipating
and shrinking, I want this to move. I want the hand to move
a little bit downward. So let me go ahead and
choose the second number, which is the y
position in drag it a little bit down as a shrinking. It's shrinking. It goes a little bit down. Let me move it a little
more, little more down. And now as it is arising, I wanted to move
a little bit up, so I'm gonna go
ahead and move it a little bit up right
around there. And then as it is coming down, I wanted to bring it to
their original position. So copy this keyframe
and paste it here. So now it moves down, it moves up, and then
it moves down again. Now I'm gonna go ahead
and again copy the easing from scale using
e's copy, of course. Now I could again go into the speed graph and copy and
paste individual influences. But you don't want to sit through and watch
me do that, right? So you do that if you're
doing have these coffee, I've had really guilty
to be using a plug-in, but, you know, it's
required again. So sorry for erasing a time. I'm going to go ahead
and copy the easing. Go to position and paste
the easing just like that. And if I go ahead and play it, you can see that the position is also changing now and it
looks so much better. One last bit of
adjustment is to make the path of movement
a little part. Because remember that
it's a basic principle of animation that nothing in real life moves in
a straight line. We need to add a little bit
of arch to the position. So let me go ahead
and select this. And with the position
property selected, you will notice that
there are these dots, not the square ones
with the circular ones. These are handles for
the Bezier curves. So I can go ahead and drag
it so that it forms a curve. And let me go ahead and
form a curve wherever I can and make it as
smooth as possible. So that's what I'm doing now. And let's move it like this. And let's move it like this. That's enough curve. Let me zoom out and play again. And you see that now
it sort of moves in a curve and then it adds
the curving of the path. Just added so much
more life to it. Animation. So let me go ahead and
play this one final time. And there you are. And to your own liking, I think this is a little
too much right now, but to your liking, you
can also go ahead and adjust this as you like it. So yeah, that's that's
pretty much it. That's pretty much
it. One final plate. Okay, great. If you have made this
animation by following along, go ahead and make a GIF or a video and post it
in the projects. And I'm so proud of what we've been able to accomplish so far, so cool, I'll see you
in the next lesson, which is the final lesson. And I can't wait to recap from the very beginning
where we didn't know anything about graphs
do here where we have manipulated graphs
and made this animation.
9. Conclusion: After all that, we did
look at the sheet of music and telling me that you can hear actual music playing
in your head. Know you probably can't, because we talked about
graphs and looking at this sheet which has a
value graph drawn on it, you can probably tell the kind of motion that this
graph represents. And if you can
re-watch the class, I mean, it's up to you. If you can't, you can
rewatch the class, but I'm pretty sure that
you do anyway, any h2. Let's take a recap of everything that we
did in this class. One important thing
that I wanted to teach through this class, because it was quite
mysterious for B2 is why certain easing, so called ease ins
and outs, et cetera. And we looked at it
through an entire graph. That entire motion graph has an inside and an outside
and depending on which side you apply
easing on it could be called ECM is out
or ease in, out. And also there are
in and out sides to every keyframe or which is
also a node on a motion graph. So that is something
that we did. We use trim paths to animate
handwriting and added speed variations to handwriting by manipulating value graph, either by making it flatter
or steeper, et cetera. And you know, what could it be? A cool project is that you
record yourself or anyone writing something
on paper and try to recreate that
of After Effects. So that is something
that you can do for our final project
of the class, we recreated the YouTube like
cam animation as it is in 2022 on iOS and iPad OS devices, we learned about anticipation
when the hand goes up, there's this little
bit of anticipation and we wanted to regard
followed through. And we added a little bit of follow-through by
using an expression that adds some sort of
bounciness to the Lai Can, you should check out the
finished project that we did. There's something that I
should come clean about. The left-hand project
that we build together that you're solving
but linked together. It needed more polishes
and more time. I wasn't able to go all the way with it because of the time constraint
and everything. But the finished file
that is there in your resources is the one that I've worked extensively on. And it looks much
smoother and much better. So you should check it out. Don't worry, it's created using the exact same techniques
that I showed. And by the way, if you're new to expressions and you
want to learn it. I have another class
on Skillshare, which is titled of beginner's introduction
to expressions. You could take
that it definitely isn't to advance
and it doesn't go into recreating
something advanced as expression that we used in this, in this class for the
YouTube like Han animation. But still, I think it gives
a very solid ground for anyone who wants to start
learning expression. So you could check it
out if you wanted to. That's a wrap for me. I would really appreciate
if you're watching this, if you've reached this part of the class to drop a review, it really means a lot. Reading a nice review. Or if you did not
like the class, I still put an overview. I would like to get some feedback on how
I'm doing because I really enjoy teaching and I'm a student of how
to teach better. So yeah, whatever,
it's up to you, again, That's a wrap and I'll
see you in the next one. Hopefully soon. Bye.
 Nash Vail, I write and draw and design and code.