Transcripts
1. Introduction Lean Six Sigma Black Belt: Hello friends. Welcome to the Lean Six
Sigma training program. Let me give you a
glimpse about what are you going to expect
in this training program. This is going to be divided
into four important parts. The first part will tell
you why should one be interested in
taking up Six Sigma as a journey towards
continuous improvement? We will also be covering
up the concepts of D Mac as a project
management methodology. And what are the different
phases in DMAIC? Define, measure, analyze,
improve, and control. What are the tools that are required at each
of these stages? And some common mistakes which we should be aware of when we're
doing this program. I mean to say that
when we are picking up a project for Lean Six Sigma, what type of data
do we look for? What type of analysis
should we be doing? All those things will be covered
as part of this program. The general awareness
program will make your capable
of identifying, should you be diving
deep in taking up the Green Belts and
Black Belt program. This dot of your interests. If you are a person who loves to make decisions based on data, then this is definitely the program that you
should look forward to. I am dental sound and I am a master black belt from
Indian Statistical Institute. I have done my black belt from American Society of quality. I'm also a PMP certified from Project
Management Institute. I come with more
than 21 years of experience and I want to share
this experience with you. I want to make this
learning journey of learning journey and
action-based learning journey. Where at the end of every video, I might give you some
small tasks too. When it comes to problem parts like the mathematical problem solving parts during
the Lean Six Sigma, I will be giving you plenty of examples which we will
be doing it together. And there'll be plenty of
examples which you will be asked to do and refer it
during the discussion feeds. I hope you enjoyed this
journey of learning, Lean Six Sigma with me. Thank you and get started.
2. Concept of Lean Six Sigma: Pase overview, foundation and principle of six Sigma and lien. In this course, we
will be introducing you to the foundation
and principle of six Sigma and lien
along with the values these quality and productivity
improvement methodologies bring to the organization. We also cover the key lean
tools commonly used in Six Sigma projects and
explain what is N, what is six Sigma, and what is the integrated or a unified approach
called a Lean Six Sigma. So what exactly is six Sigma? It all begin with an
important metric defects per million opportunity, DPMO. DPMO is a scientific measure used to calculate the number of potential mistakes or defects in the delivery of
products and services. This DPMO metric sits within the broader
organizational system where six Sigma operates. The core competence of this system is the
improvement methodology. Which is known as
the DMAC cycle, which stands for define, measure, analyze,
improve, and control. So together, the metric and the DMAC process forms the foundation of
Six Sigma projects. This enables the organization to systematically improve the
business process of all time. Why do we need six Sigma? There are several compelling
reasons to adopt. The PruATrack record
of Six Sigma, which was popularized
by Motorola and General Electrics
in 1980s and 1990s. Moreover, the COR techniques
have been used to nearly a century and
have been adopted by leading organization
across the industry. The powerful tool kit, Six Sigma offers a
structured methodology and a robot set of tools. It identifies and
eliminates defects, reducing variation,
and improving quality. Though it was born
in manufacturing, the Six Sigma has been successfully applied in a
wide range of industry, including financial
services, government, non profit organizations,
healthcare, logistics, and many more. Currently, BPOs use Six Sigma from the last three decades. The key benefits of Six Sigma
is that all organizations, whether they are for
profit or non profit, everybody faces the challenge of controlling operating cost. While ensuring sustainable
revenue growth, Six Sigma addresses these
challenges very well. So what are the ways
in which Six Sigma helps you manage
this cost reduction? Six Sigma has a proven method called cost of poor quality, famously known as
COPQ which is used. Six SIGMA emphasizes on
the voice of customer VOC, to understand the customer
satisfaction level. We are aiming to
reduce variation, eliminate inefficiency, and improve the
process reliability. Six Sigma helps in profitability
and long term value. By improving quality
and efficiency, Six Sigma contributes to
increased net profits to the organization and improve the value system in
the organization. It builds a culture of
continuous improvement. So when we focus on
continuous improvement, Six Sigma ensures that
the organization remains customer focused while enhancing
internal capabilities, process controls and
process performances.
3. Foundation of Lean Six Sigma: Purse overview. Foundation and principle of six Sigma and lien. In this course, we
will be introducing you to the foundation
and principle of Six Sigma and LIN
along with the values these quality and productivity
improvement methodologies bring to the organization. We also cover the key lean
tools commonly used in Six Sigma projects and
explain what is N, what is six Sigma, and what is the integrated or a unified approach
called Lean Six Sigma. So what exactly is six Sigma? It all begin with an
important metric defects per million opportunity, DPMO. DPMO is a scientific measure used to calculate the number of potential mistakes or defects in the delivery of
products and services. This DPMO metric sits within the broader
organizational system where six Sigma operates. The core competence of this system is the
improvement methodology. Which is known as
the DMAC cycle, which stands for define, measure, analyze,
improve, and control. So together, the metric and the DMAC process forms the foundation of
Six Sigma projects. This enables the organization to systematically improve the
business process of all time. Why do we need six Sigma? There are several compelling
reasons to adopt. The fluid track
record of Six Sigma, which was popularized
by Motorola and General Electrics
in 1980s and 1990s. Moreover, the code
techniques have been used to nearly a century and have been adopted by leading organization
across the industry. The powerful tool kit, Six Sigma offers a
structured methodology and a robot set of tools. It identifies and
eliminates defects, reducing variation,
and improving quality. Though it was born
in manufacturing, the six Sigma has
been successfully applied in a wide
range of industry, including financial
services, government, non profit organizations,
healthcare, logistics, and many more. Currently, BPOs use Six Sigma from the last three decades. The key benefits of Six Sigma
is that all organizations, whether they are for
profit or non profit, everybody faces the challenge of controlling operating cost. While ensuring sustainable
revenue growth, Six Sigma addresses these
challenges very well. So what are the ways
in which Six Sigma helps you manage this
cost production? Six Sigma has a proven method called cost of poor quality, famously known as
COPQ which is used. Six Sigma emphasizes on
the voice of customer BOC, to understand the customer
satisfaction level. We are aiming to
reduce variation, eliminate inefficiency, and improve the
process reliability. Six Sigma helps in profitability
and long term value. By improving quality
and efficiency, Six Sigma contributes to
increased net profits to the organization and improve the value system in
the organization. It builds a culture of
continuous improvement. So when we focus on
continuous improvement, Six Sigma ensures that
the organization remains customer focused while enhancing
internal capabilities. Process controls and
process performances. You need to understand
that DPMO and process performance are very important when it comes
to Six Sigma projects. The concepts like DPMO is the fundamental
basis for six Sigma. Once you can measure
and capture the data, you can then check the
chart performances, compare the actual results
to a defined goal or mean. Evaluate deviation from
statistical tools. By applying standard deviation, we access how process performs relative to its
specification limit. Anything outside the upper and the lower specification
limit is considered as out of spec and meets and it fails to meet
the customer expectation. A performance chart
typically includes a mean, which is the goal line, a range measured as standard
deviation or Sigma levels. While many organizations set the tolerance of limit as
plus or minus three Sigma, Sig Sigma aims for plus
or minus six Sigma, resulting in only 3.4 defects
per million opportunities. This means there is a
dramatic improvement in the process quality. If our process is operating
at six Sigma quality level, we are setting a much higher
standard for quality. And operating performance
at this level is 99.997% defect free. Meaning there may be only three defects per
million opportunities. Why am I not saying 3.4? Some of you might wonder
because the textbook definition says 3.4 defects per
million opportunity. Understand, can you
have a 0.4 defect? No. So we are expecting
the defects to be around three for 1
million opportunities. What's the difference between an operation where
deliverables are expected to fall within three Sigma versus the operation
that works at six Sigma. Do all the operations have
to work at that level? The answer is no.
The main difference which can surprise
you when you look at the numbers is that if
an operation limits the defects at 3.4 million
per million opportunities, so if the operation limits the defects just 3.4 per
million opportunities, the improvements are dramatic. At three Sigma, it
could mean losing 20,000 emails on the
mailbox per hour. But if the same department
is operating at six Sigma, it can be only seven pieces of mail getting lost over a year. Now consider now consider 5,000 incorrect surgeries per week versus just two surgeries
with six Sigma. Our electricity
outage and many more. Understand a process
which involves humans should be operating at six
Sigma or beyond six Sigma. For other departments, you can work with two Sigma and
three Sigma as well. Six Sigma as a methodology
believes that, yes everybody should
work at Six Sigma. Think about landing airplanes. Thankfully, airlines
today mostly operates at six Sigma
level of quantity. Why that plane crash are rare? It is because it is not
operating at three Sigma.
4. Lets have some Breakfast: Let me start with the story
of the big first time. Even before we get into the
concepts of Lean Six Sigma, it's important for us
to understand why is Six Sigma projects solving methodology when you are
experiencing radiation? Even if before I explain you the concepts of
statistics and all, let's listen to the store. I love making breakfast
for my family. And you're, as you can
see on the image here, I love decorating
the bread slices when I made the big
fuss for my family. There are six members
in my family. And I went to the
beaker next door and brought backups of bread. When I brought two
packets of bread and I paid him a
100 Indian rupees. I was very happy because
when I came home, I found that they were
eating slices of bread. Each member of my family
got three slices of bread and I could make yummy delicious
breakfast for them. This big quest, we all enjoyed. And my daughter said, Mom, I want you to meet the same
breakfast again tomorrow. I was very happy. I went to the same beaker again, brought the same two
packets of bread, paid him 100 rupees for the
bread that I picked up. This time, I received
only 15 slices of bread. And it was wondering, there
are six people in my home, is the one who leads
to compromise. There was a variation. I went back to the baker
and said, Listen man, I paid you a 100 of these, picked up two packets
of bread and I got 18 slice of bread yesterday. I was able to give six people
into three slices of bread, Eating slices of bread. And based on that, today, again, I picked up
packets of bread. But today three
slices where less. And hence, I did not have my breakfast because I had
to give it to my family. So the five people
in my family were 33 slices of bread and I
was without breakfast. The beaker said, No, ma'am. I need eight gauges
of bread yesterday. And on an average, I back 400 grams of
bread in every packet. Yesterday, I back 20 packets. And you have picked
up two buckets yesterday and two packets
to the early morning. It comes from the same place. So how come? He was talking
about the average, telling that on an
average 400 grams who have bread was
present in each bucket. But when he was
packing the bread, some packets had for 50 grams of bread and
some packets have 350 grams of blood to my desk where the first day
I receive the good ones, and hence I received
extra slices of bread. But on the next day, I received one
packet of 350 grams, and then all 380 grams. On an average, I have
received 400 grams of bread. But as a customer, I experienced the mediation. Are your customers experience
radiation than six Sigma is a journey towards solving these
type of problems, reducing the variation that
your customer is expecting. So we're going to
learn many tools and techniques of identifying the variations and
eliminating them, or at least reducing them
as much as possible. So stay connected and
continue in the next video.
5. What do Customer Experience: Let us understand, what do
we experience as a customer? I told you the story
of my big plus time. The baker very clearly said
that on each bucket the, of the bread, it was very
clearly written 400 grams. The beaker also confirm that yesterday he
made eight gauges of bread and packed it
into 20 different packets. Confirming that on
an average 400 grams of bread was packed. On an average. What really happened? But yes, On an average he
was back 400 grams. But some packets of bread
had for 20 grams of bread, which was actually a good
for customer like me, where I was able
to sell my family, but it is a loss
to the business. On the second day when I
receive 350 grams of bread, I was definitely dissatisfied. Customer always
experiences of radiation, the customer never
experiences to average. The journey of Lean
Six Sigma focuses on identifying the variation in the process and
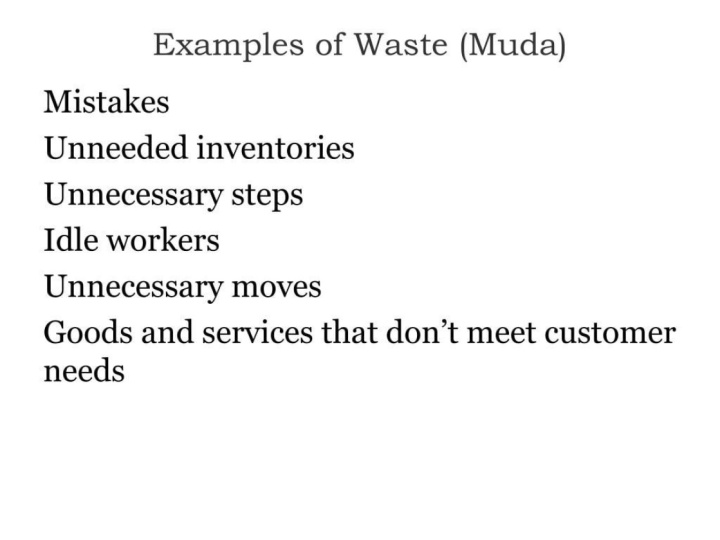
reducing them. Identify waste in the process
and eliminating them. Let's understand the story further when we go in the
Lean concepts. Thank you.
6. Belts and roles: The Six Sigma organization and the hierarchy and the rules. Within a Six Sigma, there are organizational
hierarchy and different rules exist
within this hierarchy. Each one of these rules carry a unique responsibility in
the deployment of six Sigma. The organizational hierarchy
begins at the top level of the organization within the executive teams
and the champions. These are individuals who can provide the vision
for the organization. Next, we have
Master Black Bells. They work alongside with the champions to help
select the project. Master Black Belts also
mentor Black bells who are actively involved in
leading Six Sigma projects. Further down the hierarchy, we have green belts. At this level, process
improvements are occurring within the Green Belts job function or the department in which
the Green Belt is working. Finally, at the bottom
of the hierarchy, we have yellow belts. These are individuals
who can participate in the team activities and have a general understanding
of six sigma. Within the hierarchy
of master black belts, black belts, and green belts are the professional
designation. The executive leadership and the champions are made up
of chief executive officer, the CEO, and other top
executives of the organization. So now let's explore
each of these roles, starting with executive
leadership and champions. Executive leadership
is responsible for a vision and the
implementation of Six Sigma. As a Six Sigma projects
are implemented, the role of the executive
leadership is to ensure that these projects help
the organization achieve the long term
strategic vision. Champions are essentially
the power brokers. These are individuals
who help secure any necessary resources and often secure the
improvement projects. They often sponsor the
improvement projects. Champions act like a bridge between executive leadership and the Master Black Belt to ensure that each project aligns with
the organizational goal. Therefore, champions
have to fully understand the corporate culture and should have a basic
understanding of sig sigma. The executive leadership
and the champions have a general understanding
of what is six Sigma and what is their role in linking six Sigma efforts to the long term vision and
the organizational goals. The Master Black Belts are the consultants to
the team members. They work on conducting or
they work as a bridge between the champion and
the Black Belts to ensure that the appropriate
projects are being selected. In addition, Master
Black Belts are generally responsible
for training and mentoring Black Belts. So it is important that we have a full and thorough
understanding of Six Sigma. In comparison to the
Master Black Belt, a Black Belt are the people
who lead the project. They are also the
project managers leading Six Sigma projects. They are typically team leaders and for any Six
Sigma initiatives. In addition, their role
is mentoring green belts. Within Six Sigma hierarchy, there are several levels that
are providing mentorship. The Master Black Belt
mentors the Black Belt. The Black Belt mentors
the green belt. Therefore, the Black Belt
plays an important role in disseminating
Six Sigma knowledge throughout the organization. The entire organization has an opportunity to learn
from the black belt. The bottom level
of the hierarchy as comprised of green
bells and yellow bells. These are the operating
team leaders, and they typically work on the projects that can
give direct results. These are the people whose job is to work in that department, take out some time and do improvements and continuous improvement in their processes. In addition, they use process improvement tools within the context of their project. Finally, yellow bells have a
basic six Sigma training and are actively involved in the projects alongside of
green bells and black bells. Thank you. I'll see you
in the next lesson.
7. Role of Lean Guide: The role of a lean guide as organizations mature
in their lean journey, the need evolves for just running projects to building a culture of
continuous improvement. And this role can easily be managed by a person
called Lean Guide. The lean guide is the one whose role goes beyond
applying just tools. The lean guide becomes a coach, a mentor, and a culture carrier. Someone who empowers
the team nurtures problem solving and aligns improvement with
strategic goals. We will break down exactly
what a lean guide does and how it differs from a lean practitioner
or a project lead. Think about someone in your workplace who
doesn't just solve problems but helps others
get better at solving them. Would you call them
as Lean guide?
8. Difference between Lean Guide and Practioner: Duties and responsibilities
of a lean guide. Their job is conducting
training sessions. Lean guides are responsible
for organizing and leading training
sessions to educate teams on lean methodologies
and principles. They're also responsible
for coaching team. Understand? Coaching means going with them, sitting with them, and helping them implement the lean practices effectively to enhance productivity
and efficiency. They oversee the lien projects. Lien guides oversee
these projects, ensuring that all the processes are aligned with the lien
principles and objectives. They identify areas
of improvement. They assist team in identifying
areas of improvement by streamlining the process and increasing the efficiency. The key traits of an
effective lien guide is they have strong
leadership skills, effective communication, and deep understanding
of the lien principle. What's the role of a
lean practitioner? We might get confused
that my friend is a lean practitioner.
How are they different? Driving continuous
improvement within the organization is led
by Lean practitioner. They focus on
eliminating Tim woods, reducing inefficiencies,
and streamlining workflows, data driven decision making, analyzing performance
metrics like cycle time, error rate, and customer
satisfaction score. They use root cause analysis, FIs pareto analysis to identify problem
before they escalate. Practitioners facilitate in lean training and
cultural development. They do not drive
it on their own. So let's do a quick
comparison of rules of the lean guide versus
a lean practitioner. Scope of work and influence. The role of a lean
guide is broad, because they are
mentoring across multiple projects and fostering the overall team development. They are strategic, focusing on organization wide lean culture and continuous improvement. Whereas the lean practitioner, they are concentrating on implementing specific
task of improvement, focusing on improvements
within their own teams. Their solutions are tactical, focused on processes,
tasks and workflows. So remember, a lean practitioner is focused on execution
at the team level, whereas a lean guide
is involved in driving strategic and embedding
lean into the culture. Handling resistance
within the team. Let's understand this scenario. During a process
improvement initiative, some team members are resistant to change
being introduced. The project lead steps in, facilitates a root
cause analysis session, and helps the team co create a new workflow to
reduce resistance. Does this behavior reflect
hands on problem solving like a line practitioner or a strategic facilitation and mentoring across multiple teams? The project lead steps into
facilitating root cause analysis and help co create a new workflow to
reduce the resistance. Yes, it's the role of
a lean practitioner because he's helping
and problem solving. Scaling improvements
across departments. A pilot project to reduce customer onboarding
time is successful. The project LD is now working with leadership to roll out this solution across sales,
operation and finance. This is aligning with the business strategic
and coaching session. The question is,
is this focus on cross functional
alignment and strategic typical of a lien
practitioner or a lien guide? So as I explained to you, it belongs to the lien guide.
9. Teams in Lean Six Sigma Implementation: This lesson, we will understand about teams in an i Sigma. Teams are an integral part of LIN Six Sigma implementation. Typically, a lean
Si Sigma activities are carried out collaboratively, making them team
a critical factor in the success of
any initiative. When forming teams, it is common to build cross
functional groups. These teams bring together members from different
parts of the organization, enabling diverse
perspectives and a better alignment with the
overall business rules. Additionally, involving
teams from various functions helps empower them to actively contribute to process
improvement efforts. Types of Six Sigma projects. There are four key types
of Six Sigma projects. Define, measure, analyze,
improve, and control. This is called as a DMAC cycle. The second one is designed
for six Sigma, DFSS. Plan Do Check at PDCA. That's the third type. Lean Kison or Kison list
is the fourth methodology.
10. Stages of Team development: The types of team in
Six Sigma projects. The four most common
types of teams in a Six Sigma projects are
process improvement teams. These teams focuses on enhancing specific
business processes. Their goal is to deliver
immediate results often by implementing solutions that are simple and quick to execute. This approach helps ensure that the implementation is fast and tangible
outcomes are ensured. The second one is
the quality team. The role or the aim of
the quality team is to improve internal
efficiencies that affect the final output, an area closely tied to
customers expectation. Their work typically involves either improving a
specific process or developing a quality plan for a department or the
entire organization. Ad hoc teams. These teams create a complete project with a well defined
specific requirements. These teams are goal
oriented and have a narrow focus and usually
exist for a limited time. They are often a cross
functional team. They're interdepartmental
or tailored to address a particular
stakeholders need. Ad hoc teams are very useful
when you want to kill a project or kill a problem
using a project methodology, get the team together
and solve it. Self managed or agile teams. These teams are
responsible for managing their own work and leading
their own improvements. They are required a high level of collaboration
and functions with minimal directions
from the management the self directed team, the team leader in
such an environment, is also acting like
a facilitator, a guy, rather than just
being a supervisor. What do we understand from this? Regardless of the team time, the effective teamwork is essential for the success
of Lean Six Sigma projects. By leveraging the strength
of each team structure, organizations can drive meaningful improvements
and sustainable change. What are the stages
for team development? Teams go through various
stages of development, primarily because
project dynamics tend to evolve over time. These changes occur not only due to the natural
progression of the project, but also as the team
members become more familiar and more
mature with each other. This allows them to
collaborate more effectively towards
a shared goal. Additionally, the nature of
the project itself may shift, influencing how the team
functions and adopts. One of the most critical
factor for ensuring a strong team performance
is effective leadership. Strong leadership
contributes significantly to the team's ability to evolve, align, and improve over time. When managing team dynamics, two key responsibilities
fall to the manager. Managing people, managing
the overall team and the team's performance to navigate these
responsibilities successfully, it's helpful to understand the stages of team development. This typically includes forming, storming, norming
and performing. And adjourning. Recognization is the next stage that has been
recently added to this. In the first stage
that is forming stage, this is the initial stage where
the team is put together. At this point, the team leader
provides clear direction, delegates a role
and responsibility. The focus is on setting
expectations and helping team members
understand the project goals. During this stage, team
members begin exploring the nature of work and learning about each
other's strengths. Since this is a
functional phase, it is essential for the team leaders to
clearly define objectives, timelines and
communication protocols. Team development in Six
Sigma projects continue. Let's continue with that.
During the storming stage, team members may begin to test the boundaries and
assert their opinions. At the same time,
they are learning how to communicate effectively
with one another. In Six Sigma logics, team often consist
of individuals from diverse professional
and cultural background. As a result, communication
style can vary significantly, which may lead to
misunderstandings or conflict. The norming stage begins once
the team members have gain a better understanding of the project and the
objective of the project. They have learned to communicate more clearly and respectfully. This is when the relationship
begins to solidify and the team starts to collaborate more effectively on
the shared task. The team members begin to appreciate each other's
working style and now reach a consensus
on how to approach their progress and do
the process improvement. At this stage, it's essential
for the team leaders to encourage active
participation and foster a collaborative
environment. Promoting team
engagement helps ensure everyone is aligned and
moving towards a common goal. Once the team has established strong working relationship
and clear communication, they enter a performing stage. This is the most productive phase of the team development. The team functions cohesively, communicates seamlessly, and is highly focused on
achieving project goals. In the performing stage, the team leader adopts more
for a supervisory role, stepping back to allow
the team to operate with greater autonomy and confidence in their process
improvement efforts. The next phase is adjoining, which marks the conclusion
of the project. At this point, the team is dissolved because the
project goals have been met. However, this stage can bring about two
different reactions. Some team members may feel reluctant to let
go of the project, while others may lose interest because all the
tasks are completed. It is important to ensure that all the
remaining activities like the project closure, documenting the lessons
learned and wrap up any loose ends that
needs to be addressed. The final stage of team
development is recognizon. Once the team has successfully
completed a project, it's important to acknowledge and celebrate their
contribution. During this stage, the
team leader provides feedback and recognize individuals and
collective achievements. Effective recognizon
reinforce positive behavior, boost morale, and highlights what is valued within
the organization. When celebrating team's success, ensure that recognizon
reflects both the outcome achieved and the values
upheld during the project. By understanding and
managing these stages of team formation that is forming, storming,
norming, performing, adjourning and recognizon, team leaders can
guide their teams through the natural
progression of development, ultimately, maximizing their performance
and project success.
11. What is Lean: Let us understand what is
laid in the lean journey. In the journey of
Lean Six Sigma, what do we mean by lean? Lean is a methodology
about problem-solving. And in Lean, we focus
on eliminating waste. You would have heard this a lot. Lean manufacturing, Toyota
lean production system. And whenever we think about the, we're thinking about creating
value for the customer. So the first step towards understanding Lean is
identifying the value. You identify this value from the customer's
point of view. The second step is to
map the value stream. When you are doing Lean, it's technically a
process where we try to map the process
tree, the value string. The third one is about
creating a flow. In traditional service or
production environment. Usually we used to
do batch processing. Lean very clearly
believes that we should have a one-piece flow
in an organization. Establishing a put. Lean does not believe in pushing the product and services which are manufactured
to the customer. In fact, the customer demand should pull the
goods or services. Moving towards perfection. That is about Lean. Lean is about creating perfection in your journey
towards excellence. Thank you.
12. What is Six Sigma: What is Six Sigma? Let's try to understand what is Six Sigma in the concept
of Lean Six Sigma. Six Sigma is a target. It's a number. Statistician's have defined
that if a process has less than 3.4 defects per
million opportunities, then the process is
said to be performing at Six Sigma journey. You cannot achieve
that number overnight. It's a journey where we are changing the culture
of the company. It definitely means
that when we are talking about changing the
culture of the company, it must involve everyone
in the company. An organization is
supposed to be on the journey of Lean Six
Sigma where everybody is in board getting trade
on the concepts of Lean Six Sigma is involved in the process
of process excellent. Taking the product and
services that they offer towards near perfect. It transforms the way the
company does business. It's going to be successful for itself because it's
going to make profits. It's going to be
beneficial to the customer because it's going to give them affordable goods and services. So in the journey
of Lean Six Sigma, six Sigma is not about the standard deviation
that we have learned, but it's about a calculation which we will be covering
in the coming videos. If you have any queries, please write down in
the discussion section. I will be happy to answer them.
13. Defects Per Million Opportunities Dpmo: You need to understand
that DPMO and process performance are very important when it comes
to Six Sigma projects. The concepts like DPMO is the fundamental
basis for six Sigma. Once you can measure
and capture the data, you can then check the
chart performances, compare the actual results
to a defined goal or mean. Evaluate deviation from
statistical tools. By applying standard deviation, we access how process performs relative to its
specification limit. Anything outside the upper and the lower specification limit is considered as out of spec, and it fails to meet the
customer expectation. A performance chart
typically includes a mean, which is the goal line, a range measured as standard
deviation or Sigma levels. While many organizations set the tolerance of limit as
plus or minus three Sigma, Sig Sigma aims for plus
or minus six Sigma, resulting in only 3.4 defects
per million opportunities. This means there is a
dramatic improvement in the process quality. If our process is operating
at six Sigma quality level, we are setting a much higher
standard for quality. And operating performance
at this level is 99.997% defect free. Meaning there may be only three defects per
million opportunities. Why am I not saying 3.4? Some of you might wonder
because the textbook definition says 3.4 defects per
million opportunity. Understand, can you
have a 0.4 defect? No. So we are expecting
the defects to be around three for 1
million opportunities. What's the difference between an operation where
deliverables are expected to fall within three Sigma versus the operation
that works at six Sigma? Do all the operations have to work at that level?
The answer is no. The main difference which can surprise you when you
look at the numbers. So if the operation limits the defects just 3.4 per
million opportunities, the improvements are dramatic. At three Sigma, it
could mean losing 20,000 emails on the
mailbox per hour. But if the same department
is operating at six Sigma, it can be only seven pieces
of mail getting lost. Now consider 5,000
incorrect surgeries per week versus just two
surgeries with six Sigma. Our electricity
outage and many more. Understand a process
which involves humans should be operating at Six
Sigma or beyond six Sigma. For other departments, you can work with two Sigma and
three Sigma as well. Six Sigma as a methodology
believes that, yes, everybody should
work at Six Sigma. Think about landing airplanes. Thankfully, airlines
today mostly operates at six Sigma
level of quantity. Why that plane crash are rare? It is because it is not
operating at three Sigma. Crash far more common if it is operating at three Sigma or
anything less than six Sigma. Six Sigma is highly
adaptable and is commitment. Any organization, regardless of the size and the industry, work towards the
level of performance. From manufacturing
to consulting, from profit to nonprofit, government agency
and private sector. Everyone can apply Six Sigma. The great example of Six
Sigma application is customer facing organizations
such as call centers. We also call them
as contact centers. But there is no restriction. An organization can adopt
and benefit from Six Sigma.
14. Cost saving and reducing defects: Course overview, foundation and principle of six Sigma and lien. In this course, we
will be introducing you to the foundation
and principle of six Sigma and LIN
along with the values these quality and productivity
improvement methodologies bring to the organization. We also cover the key lean
tools commonly used in Six Sigma projects and
explain what is N, what is Six Sigma, and what is the integrated or a unified approach
called lean Six Sigma. So what exactly is six sigma? It all begin with an
important metric defects per million opportunity. DPMO. DPMO is a scientific
measure used to calculate the number of
potential mistakes or defects in the delivery
of products and services. This DPMO metric sits within the broader
organizational system where Six Sigma operates. The core competence of this system is the
improvement methodology, which is known as
the DMAC cycle, which stands for define, measure, analyze,
improve, and control. So together, the metric and the DMAC process forms the foundation of
Six Sigma projects. This enables the organization to systematically improve the
business process of all time. Why do we need six Sigma? There are several compelling
reasons to adopt. The Proud track
record of Six Sigma, which was popularized
by Motorola and General Electrics
in 1980s and 1990s. Moreover, the code
techniques have been used to nearly a century and have been adopted by leading organization
across the industry. The powerful tool kit, Six Sigma offers a
structured methodology and a robot set of tools. It identifies and
eliminates defects, reducing variation,
and improving quality. Though it was born
in manufacturing, the six Sigma has been successfully applied in a
wide range of industry, including financial
services, government, non profit organizations,
healthcare, logistics, and many more. Currently, even BPOs use Six Sigma from the
last three decades. The key benefits of Six Sigma
is that all organizations, whether they are for
profit or non profit, everybody faces the challenge of controlling operating cost. While ensuring sustainable
revenue growth, Six Sigma addresses these
challenges very well. So what are the ways
in which Six Sigma helps you manage
this cost reduction? Six Sigma has a proven method called cost of poor quality, famously known as
COPQ which is used. Six Sigma emphasizes on
the voice of customer BOC, to understand the customer
satisfaction level. We are aiming to
reduce variation, eliminate inefficiency, and improve the
process reliability. Six Sigma helps in profitability
and long term value. By improving quality
and efficiency, Six Sigma contributes to
increased net profits to the organization and improve the value system in
the organization. It builds a culture of
continuous improvement. So when we focus on
continuous improvement, Six Sigma ensures that
the organization remains customer focused while enhancing
internal capabilities. Process controls and
process performances. You need to understand
that DPMO and process performance are very important when it comes
to Six Sigma projects. The concepts like DPMO is the fundamental
basis for six Sigma. Once you can measure
and capture the data, you can then check the
chart performances, compare the actual results
to a defined goal or mean. Evaluate deviation from
statistical tools. By applying standard deviation, we access how process performs relative to its
specification limit. Anything outside the upper and the lower specification
limit is considered as out of spec and meets and it fails to meet
the customer expectation. A performance chart
typically includes a mean, which is the goal line, a range measured as standard
deviation or Sigma levels. While many organizations set the tolerance of limit as
plus or minus three Sigma, Sig Sigma aims for plus
or minus six Sigma, resulting in only 3.4 defects
per million opportunities. This means there is a
dramatic improvement in the process quality. If our process is operating
at six Sigma quality level, we are setting a much higher
standard for quality. And operating performance
at this level is 99.997% defect free. Meaning there may be only three defects per
million opportunities. Why am I not saying 3.4? Some of you might wonder
because the textbook definition says 3.4 defects per
million opportunity. Understand, can you
have a 0.4 defect? No. So we are expecting
the defects to be around three for 1
million opportunities. What's the difference between an operation where
deliverables are expected to fall within three Sigma versus the operation
that works at six Sigma? Do all the operations have to work at that level?
The answer is no. The main difference which can surprise you when you
look at the numbers. So if the operation limits the defects just 3.4 per
million opportunities, the improvements are dramatic. At three Sigma, it
could mean losing 20,000 emails on the
mailbox per hour. But if the same department
is operating at six Sigma, it can be only seven pieces
of mail getting lost. Now consider 5,000
incorrect surgeries per week versus just two
surgeries with six Sigma. Our electricity
outage and many more. Understand a process
which involves humans should be operating at Six
Sigma or beyond six Sigma. For other departments, you can work with two Sigma and
three Sigma as well. Six Sigma as a methodology
believes that, yes, everybody should
work at Six Sigma. Think about landing airplanes. Thankfully, airlines
today mostly operates at six Sigma
level of quantity. Why that plane crash are rare? It is because it is not
operating at three Sigma, if it is operating at three Sigma or anything
less than six Sigma. Six Sigma is highly
adaptable and is commitment. Any organization, regardless of the size and the industry, work towards the
level of performance. From manufacturing
to consulting, from profit to nonprofit, government agency
and private sector. Everyone can apply Six Sigma. The great example of Six
Sigma application is customer facing organizations
such as call centers. We also call them
as contact centers. But there is no restriction. Any organization can adopt
and benefit from six Sigma. And we will explore
the timelines of Six Sigma and understand
the evolution over time. The importance of
Six Sigma concept is the standard deviation. This was defined
in 19th century. Going back to the late 1800s, we find that Frederick Taylor, the rise of Taylorism. His economic theory
and divisions of labor laid the groundwork for many principles we
associate with six Sigma. In 19 twentyes, pionists
like Henry Ford, Walter Shuhart, George
Box contributed to what would be evolving into today's modern six
Sigma practices. In 1940s, the US
government began publishing quality control in
the military manufacturing. This led to the rise of
statistical process control, SPC, as we call it. Thanks to this part of early teaching by the
statistician Walter Stuhart. After the World War two, figures like doctor
Edward Deming, doctor Joseph Juran worked
extensively in Japan. Their contribution
helped transform quality into a competitive advantage
for Japanese industry. It was during this time that the Japanese Union
scientists and engineers, JUSE Jews was established. Laying the foundation of many practices will
later adopt a six Sigma.
15. Evolution of LSS: We will explore the timelines of Six Sigma and understand
the evolution over time. The importance of
Six Sigma concept is the standard deviation. This was defined
in 19th century. Going back to the late 1800s, we find that Frederick Taylor, the rise of Taylorism. His economic theory
and divisions of labor laid the groundwork for many principles we
associate with Six Sigma. In 19 twentyes, pionists
like Henry Ford, Walter Shuart, George
Box contributed to what would be evolving into today's modern Six
Sigma practices. In 1940s, the US
government began publishing quality control in
the military manufacturing. This led to the rise of
statistical process control, SPC, as we call it, to this part of early teaching by the
statistician Walter Stuhart. After the World War two,
doctor Edward Deming, doctor Joseph Juran, worked
extensively in Japan. Their contribution
helped transform quality into a competitive advantage
for Japanese industry. It was during this time that the Japanese Union
scientists and engineers, JUSE Jews was established. Laying the foundation of many practices will
later adopt a six Sigma.
16. Understanding the DMAIC Roadmap: The MC approach at the
d.school Mac roadmap, whenever you are picking
up a Six Sigma project, we usually follow
the DMAIC approach that is called as a
team Mac roadmap. Why is each of these
teach important? Let us try to understand that. In the define phase, we define the problem and the optic disc that we want to achieve by doing
this project. During the measure phase, we tried to establish, can we measure the problem? Suppose if we are
doing a project on reducing the turnaround time for a process or reducing the number of defects from a
particular machinery. Whatever is my metric, can I measure it? And what level am I today? I tried to understand my
current process capability. Once I understand where do I stand in terms of my
current process capability? We then move into
the analyze phase, which is the third
phase of the project, where the maximum
effort takes place. During the analyze phase, we tried to analyze the process. We take updated or approach. We take up the process
to report and we try to define what are the factors which are influencing
my problem. You remember, I covered what is y is equal to a function of x. You project metric is getting impacted by
a lot of inputs. We try to understand which
of those inputs which are actually creating are
influencing my output. Concepts like root
cause analysis. We do test of hypothesis. We do Gemba walk, we draw the process maps, we do swim lane diagrams
and many more things. With that, we then
understand how to pick 20 x's are 15 X's that you
have for your process. What are those whiter
five or seven x which are actually implementing
are causing the problem. Sometimes that could only
be a two or three axis. Once I have established what
is causing this problem, then we go into the
improved phase. In prophase is the fourth
stage of a project. Some of the organizations also call it as an engineer fees. Suppose if you are doing a
service related process, are you are trying to fix
a process which is from a service industry or which belongs to the support services. We usually call it as an improved because we're trying to improve from
wherever we there. We call it as an engineer. If you are in a
manufacturing setup because you need to
engineer the solutions. So as you understood,
during this phase, we try to identify what could we the solutions and order the multiple solutions
that we have. Bit solution will
actually helped me in going towards the outcome
that I won't post, which we go into the control phase after we have successfully
done the pilot. And we see that the pilot phase is giving me the
results that I want. We want to then go for a
full-scale implementation. During the control phase, we have seen the sample results
during the pilot phase. Now how can I do a
full-fledged are a complete roll-out across all the processes
which are in scope. Number two, how do we ensure that the results
which I receive now will continue to remain
and I sustain the increments. As you would have heard, many people say that I did the project during
the project fees. There was a lot of benefit. But once the be moved
out of the project, the benefits stopped coming and the process slowly
moved back their own way. There are many tools and
techniques like responsibility, assignment, matrix,
control, plan, project closure document,
which are very important, which we will be covering during the control
phase of the project. With that, let's move
to the next slide. This slide talks about what exactly happens
during each of the phases. So during the define phase, I reviewed a charter, I validate the
problem statement. I validate the
voice of customer. I validate what could be the
approximate dollar seats, validate high level VSM. We do need to do this. This is also called as a SIPOC. We establish a
communication plan. We establish, select the team, and we develop a project
plan or shade you, and ensure that we go through the defined
tollgate review. Technically, you should be
able to complete this phase of your project in max of
one week to ten days. Because you should
not do our analysis because the project charter
is a live document. I go and measure the data. During the measure phase, I can go back and update
my project charter with the correct numbers
in the problem statement. And I can revisit my goal
statement if required. So hence, it's
important for you to establish what is the project
you're going to work on. What is the voice
of the customer? Does a customer wants you
to work on this project? Do you have proper
communication plan? Do you have the proper team
who will work with them? And can I complete
this project in a span of three to five months? Six Sigma project, which is
going beyond five months. Out of my practical experience, never gets done because it would then become like a regular
business operations. And it would be like, okay, this project is going
on right in-between. We would come do some artsy, but there is no practical
change on the process. We understand that it is the concept of
continuous improvement. But you also need to understand that continuous
improvement in terms of continuously
doing the project. We then move into
the measure phase. During the measure
phase, some of the activities that you do are you understand the
as-is process map, our SIPOC, you develop
the data collection plan. You validate the
measurement system that the data that
I'm collecting. Is it correct? We will be seeing
all these things in detail during
the future program. We established the
current baseline, we determine the current
process capability. With that, we go to the
measure phase tollgate review. Six Sigma very clearly believes that at the
end of each phase, I need to go back to my stakeholders and tell them
that how am I progressing? With that? We go to the analyze phase and
that key activities during the analyze phase is to
determine the critical inputs. Identify the root causes. Narrow down the root causes, determine the impact of root
causes on my project, right? Prioritize the root
causes to be worked. Analyze the as is process map in terms of value-added and
non-value-added activity. These are some of
the Lean concepts which we implement
during this phase. Nowadays, we call it as a Lean Six Sigma because we want to get the best
of both worlds. Both switch, we go for our
analysts tollgate review. During the improve phase. As I have already established,
what are the root causes, I will go ahead and develop
the potential solutions. I evaluate and select optimized solutions
are the best options. I have tools like solutions, selection metrics for the
path matrix, and many more. I then do a small pilot with limited resources and see if I'm getting the results
for which I have set up. I can form by doing a
test of hypothesis that actually the results are in favor of the objective with
which we started the project. If it works out well, then we go for an
implementation plan and we come to the end
of the improve phase. We then go to the control phase where
we try to establish that, okay, these are the solutions. How can I make this solutions? Mistake proof. I applied the concept
of Poka Yoke. I developed a training plan,
implement the solutions. I ensured what are the lessons that were
learned during this journey? Those are all documented
before I complete my project. Right. Then I do the animal
control phase review and then I transition this
causes to the operations team. B will understand more in
details in the next chapter.
17. Understand the Deliverables for each of the DMAIC project phases: Based on understanding what
are the key activities we do during each phase of
the project life cycle? Let us understand what
are the key deliverables. For each phase. There could
be multiple deliverables, but at least we should ensure that what I have
mentioned on the screen, those 15 deliverables are
there in your project. And you ensure that you work towards getting
this deliverables. During the define phase, at least we need the
project charter, the CTQ tree, and the SIPOC. Please do not
compromise on any of the tool because all of these tools are
equally important. The project charter
is also a change. Management to CTQ validates
the voice of customer. And SIPOC sets the
boundary of your project. For the measure phase, the three important deliverables or your measurement
system analysis. You collect the data
and you establish your baseline or the
current process capability. During the third phase, that is, the analysts fees identify the sources of variation
I found on the causes, and I validate the root cause. Tools and techniques
can be different. You can take a process
door approach, you can take a
data-driven approach. You will be doing hypothesis
testing and so on. But we ensure that we have enough deliverables under
each of this bucket. During the ego fees. The three important
deliverables are, I generate a lot of solutions. I select the best-fit solution, and I pilot the solutions and confirm that the
results, what I want. If that does not work, you actually go back to your solution dashboard and identify the next solution
which actually can work. If all the solutions
which we generated, none of them are working
successfully during the pilot, it means that you have not
analyzed your project or the cause of your
deviation Very well. Then you need to go back to
the analyze phase where you would be investigating the
root causes one more time. Usually this doesn't happen. But in case that happens, you should be flexible
enough in doing this. During the control phase, the three important
deliverables are you implement the
full-scale solutions. You monitor the process
and monitor the results. You're not only going
to monitor the output, you're also going to
want it to the input because y is a function of x, then you ensure that
you have a project plus process project closure
document and you share the best practices
with the others that what have you learned in the
last three to five months. With that, we will
be moving into the defined phase of
the project life cycle. And we will try to understand what are the different types of tools that we use
during the define phase.
18. Y is a function of x(s) y=f(x): I keep repeating the statement multiple times during
the entire training, as well as if I'm entering
any of your projects. Why is the function of x
where y is the customer CTQ, or the thing that
we need to improve with Lean Six Sigma x, or the internal processes that directly affects the
customer seek to you. So your output is a symptom which is
affected by your inputs, which is can positively or
negatively affect your output. So how do I define what
is the customer's? Ctq stands for? Critical to quality. Ctq for a process or product or a service characteristic
should be measurable. You would hear me specifying, stressing on the word measurable,
measurable, measurable. Six Sigma strongly believes what can be measured,
can be improved. What cannot be measured,
cannot be improved. So it's important for you to
have this metric measure. Let's take some examples. It could be characteristics
like speed, accuracy, timelines and cost. In the leading
lending environment, the time to receive the final decision whether
the loan is approved or not, is a critical metric. And it could be your CTQ. Number of documents
required to make the final decision
can also be a CTQ. For opening a new account. The waiting time to
receive a debit card can be a metric which
you want to improve. Example in India earlier to get a debit card to only
had to wait two weeks. Today, you walk into a bank, you open an account, you do the verification, and they give you a welcome kit. The debit card is in your hand. They have literally did a beautiful process
improvement where the turnaround time
has been reduced from 15 days to 0 minutes. And this card is safe and secure because we are talking about
a banking as a process. I didn't hospital. It may be a patient
waiting time already. We know that the patient
is not really well. If he has to go to
the hospital and wait endlessly for two hours, three hours for 15 minutes. It is a very
uncomfortable moment that could become acidic. Because the patient will say, I do want to go to a
particular hospital or a particular cleaning
because I have to read in spite of
booking an appointment, the number of incorrect
bills issued. We see that the doctors are excellent in a
particular hospital. They do amazing surgeries. They ensure that the patient
is recovering very fast. When it comes to the
billing department, there are a lot of arrows and then they spend
two to three hours fixing it and the patient is
waiting for to go back home. These are some examples
of CTQs that can be.
19. How do I find an opportunity for improvement: One of the important
questions which is commonly asked by my participant during my training workshop is how do I identify an
opportunity for improvement? I don't have a project in hand. I don't know how to
identify a project. I'm going to tell you some
simple tips which can help you identify an
opportunity for improvement. When you are identifying and opportunities tried to
see in both the worlds, one internal, the
other is external. Let's first understand how do I identify internal
improvement opportunities? You can brainstorm with cross-functional team who
can tell you what are the problems that we
face when we are handing off the process from one
department to another. Sometimes you can identify
an opportunity for improvement by analyzing the
core business processes, either by mapping them or by examining their
historical performances. Are the performance going
towards the negative side? If everything is in control, those things can be identified. You can sometimes even look at the financial analysis
of the business unit. Ease my department making
the profit that is required is my
particular product making the profit
that is required. How is it when compared to
industry best standards? Is the profit less than what the industry
people are making? Then also it's an
opportunity for improvement. I can measure it against
my past that I was making. X percentage of profit. It has my profit reduced. As my cost increases. I can identify opportunities for improvement in this field so that you can review some
of the repeated processes, products and service issues and challenges that you receive. So if you are repeatedly
receiving a challenge or issue relating to your
product process or service, you can identify that as a
project and take it further. You can identify the
business goal and metrics that have been missed or you add
poorly executing. Look at your SLA documents
for the service sector, or look at the customer
contract where we have paid penalties to the
customer for not meeting the metrics that we had agreed during the
contract street. These could be some of the improvement
opportunities which can be picked up as a project. If I go to the external
opportunities, technically, the
external opportunities are driven by our customers. It could be auditor's. Does customers of the
final product or service. The project idea from
the external source can be identified by
conducting surveys, analysis of the existing
customer feedback, direct dialogue
with the customer. If a new discovery fees for
an improvement opportunities, you may actually identify
several opportunities. Now, because you have identified
multiple opportunities, you might have a question, how can I prioritize them
all eliminates some of them. Asking the following
questions should help you in reading
of this process. How can, what can I do to
improve the situation? How important is this
issue to your customer? East opportunity or, and, or the error in need of
improvement, measurable. Other data available
are easily generated. Can the benefits be quantified? Is the process table or
against controllable? Is the scope of
your problem narrow enough to finish the improvement
in four to six months. Is there a sponsor or champion who's willing
to provide you the help that requires you for this project in terms of
resources and the support. By getting answers
to these questions, you will be able to identify which are the projects
which you need to keep and which are not an important projects are
important opportunities. Answering these questions
will help you help the team with products
and action very easily. For example, if the data is not available or
easily generated, validating the problem,
baseline the current state, and ultimately proving
that the improvement has taken place becomes impossible. What can be measured,
can be improved. In data. We trust. We do not trust in
any gut feeling. The other way of saying
is In God We Trust. And indeed I dressed. However, when that project should not be
selected immediately, the data collection plan can
be implemented in order to meet the opportunity
possible in the future. As you can see, these are some important questions
which needs to be addressed. The other issue you can face is the project's scope is too
large that the opportunity requests substantial amount
of resources in terms of human capital as well as
investment in daughters. Or if they take longer than
six months to complete, then perhaps you need to
raise, cope your project. As I told you earlier. Out of my practical
experience, I have seen, if the project does not get completed in four to six months, the project lead
technically gets tired and never
completes the project. Hence, you can define
to reduce the scope of your project to ensure that
you achieve the success. Because when the scope is
within what is possible, the team requirement,
the dollar requirement, will also be substantially
appropriated. But most importantly, what
you choose as a project idea, it must be driven
by the customer. This can be your
internal customer or this can be your
external customer. You cannot have a project idea because you feel that you
need to do on a project. Or your boss is telling do here, but not the customer feels. So. Hence, it is important that
everything that we do in Lean Six Sigma project is
always customer-focused. In the event that
you approached by a business leader with a project idea or a business issue that
needs to be addressed. It is critical to note that
no project ideas should be accepted as factual
or a 100% accurate. What makes this
phase challenging? Ease the burden of
validating the opportunity. And the problem falls on the shoulder of the
project leader. Validating this
opportunity or a problem. It is the responsibility
of the project leader. This validation and tails
both defining the problem and establishing its magnitude and the frequency of its occurrence. A well-defined problem
statement helps provide a better answer
to who care situation. I don't care about this process. The customer keeps complaining. These are not some good
things to listen to. Hence, it is important
that we address this by identifying the correct opportunity
and fixing it.
20. Project Charter How to Guide: The most important tool
in your define phase. In fact, I should say, the most important tool in your Six Sigma project is
your project charter. It. I also call it as the
lighthouse because just like the way the lighthouse guide
the ship towards the shore, project charter will guide
all the team members towards the goal that the
project has been initiated. When you are building
a project charter. The purpose with which you build the project charter is that you want to clarify what is
expected from the team. It keeps the team focused. It keeps the team aligned with the organizational
priorities and transfer the project from the champion to the
process improvement team. As you can see, it's
very critical for us to build a project
charter very carefully. The different elements of the project charter or the problem and the
goal statement. It describes the problem
and opportunities and objectives in a clear
and concise manner. Your process will be
ensuring that it's a measurable process
because Six Sigma very clearly believes what cannot be measured, cannot be improved. We then try to understand, please the business case
into the project charter. Business case explains why to do this project
in the first place. It will help you to convince your stakeholders that why
is this project important? Project scope, what is in scope, and what is out of scope. This is a very critical space. Your project charter. If you do not fill
this up correctly, you might end up having a
scope creep in your project. And your project will be
endlessly increasing. And your stakeholders will be unhappy during that you're
not achieving the results because the scope is
going on in milestones. They are the key steps and the dates by which
you want to achieve. As you know, Six Sigma is a structured approach
if you ensure that all the elements are there in place in
each of the tools, the success to your
project is sure. My student, knowing when I
will complete my define, measure, analyze, improve, and
control is very important. If there is a delay, you can put in the remarks, it gets the team back on goal. We also define the roles
and responsibilities of the people in the team
in the project charter to ensure that everybody is clearly a sample project charter looks something like this. It has a business case. It has the problem statement. Do not get fixed
on the structure. Every company follows
a different way. I have tried to give you a
very simple for blocker, which will make it easy for you to build your
project charter. You name of the
project is on the top. You first start with the
business case below it, you have the problem that
the company is facing. Below that, you have the
goal statement which clearly defines what is the goal you are
set out to achieve. You are clearly defining your in-scope and out of
scope of the project. You are identifying
your team members. Potential financial benefits
is what you're right during the project
charter fees are, I should say, during the define phase in the project charter to what are the
milestones and shadows. You are going to clearly mentioned each phase
of your project. What are the planned date? What is your actual date? If there is a delay, you will ensure the remarks I mentioned. If it's on time, you can just
see everything is in order. This looks as a
very simple tool, but this is the lighthouse of your entire journey
of your project. Hence, do not
underestimate this shadow. Now, I will help you in understanding how we
build a business case. The business case is, please, in your project charter, which clearly defines why
is this project what doing? What is the process that
we are trying to improve? Why is it important
for me to do it? Now? What are the consequences
of not doing this project? How does this fit
within the business or the process but priorities
we have it today. Can you see if you're able to answer these few
questions correctly, you will automatically
develop a good business case. The next element is the problem statement in
your project charter. You want to ensure that you describe what is
wrong with your process. When and where did
the problem occurred? You are trying to measure and tell what is the size
and impact of the problem. Now some of you might have
a question telling that, how can I measure
the size and impact? I do not have so much data now. So do I need to collect the data before I start with
the project charter? Know there will be a hint. It is said that when you are
identifying the opportunity, you will have received a
hint either from the survey or from some other dashboards
that this is the problem. You take that number and
fitted over here when you go through the
measure phase and you find that the numbers
are different, you can always come back to your project charter and
update those numbers. Customer, be happy if they know that I'm working
on this project. Can you see how beautiful
is this question? Because practically you
are able to tell that, why is this project important? What is the pain that
we are facing and when the customer be happy by
address this pin. Yes. So then we go to
the next element. That is my smart goal. So what happens in
the smart goal? The goal is supposed
to be smart. We all are aware of this
smart as an acronym. Specific, measurable,
attainable, realistic, and time-bound example, reduced the transformer rejection from 5.25% to 2% by September 2022. I'm very specific that I'm
looking at reduction in the transformer rejection and no other rejections
in my organization. I'm currently at 5.25 and
my target is to reach 2%. By when do I reach by September? I'm specific. Is the metric measure of it? Yes. Is 2% achievable? Yes. If I would have said 0%, then it would have
not been attainable. Realistic to reduce from
5% to 2% by September? Yes, because I have started this project before
five months or I'm starting this
project in FAB and a dagger to complete
it by September. Let's take one more example. Improve the productivity of
the contact center team from 85% to 95% by September 2022. I have kept in mind
that we have initiated this project somewhere in
March or April of 2022. Right? I'm specific that I'm looking at the
productivity as a metric. Within which department? The contact center D. Is it measurable? Yes. Triviality. If a person is ninety-five percent
attainable, yes. Is the target realistic? Yes. Because if I would
have said include the productivity of
contact center 200 person, it would have not been
a realistic target. Are you getting my point? If you have any questions, do not forget to ask. In the discussion section below, I'll be happy to
address those wires. Input the revenue through sales of washing
machine by 20 per cent. Currently we are too
close in INR, right? So when you are
defining your goal, your goal statement should be a one liner because that is what will
help you achieve it. Here is the sample guide
of the project charter. I have put up the business case. This is for a
manufacturing setup. The service incident rate of ABC washing machine model
indicates the machine time of failure and subsequent
replacement rate is higher during
2020 fiscal year. This contributes to 40% of the overall service
incidence rate. And most of the
complaints are from the eastern and southern
region of the country. Where did I see the problem? How big is the problem? Which department is
facing this problem? I have mentioned all of
it and the business case, you can definitely
improve it further. But this is just a sample. In the problem statement. If said that 40% of the
overall service incidents are from the timer failure for a semi automatic
washing machine. I will company serves
multiple products, but we are receiving service incidents from
this particular model. The goal is to reduce the
timer field failure of EBC washing machine model by
80% by 20th March 2021. What is in scope, semi-automatic washing machine. Out of scope. All the other washing
machine and then any other electronic product
produced by ABC limited. I clearly define the names
of the team members, ms. Eggs, Mr. a, Mr. B, Mississippi, and so on. Financial benefit, the incoming ABC timer
inventory reduction by 25 per cent leads to an x dollar saved in the
overall inventory cost. The field work and part
replacement reduction by 30 per cent leads to an
approximately of so many dollars. You are giving an approximate
financial benefit numbers in the project charter stage. Clearly defined my
define, measure, analyze, improve, and
control timelines. What was the plan did? And I will keep updating
the actual dates as and when I progress
to tollgate reviews. I hope you got an idea of what to do in the
project charter.
21. Understand with more examples Lean six Sigma: Understanding the transfer
function in six sigma. Let's now explore the function and its relevance in six sigma. This begins by understanding the mathematical relationship. Y is a function of X. In this equation, Y
represents the output and the results or the
outcome we want to improve. X represents the input
variable or the pattern. F represents the function or the transformation that can
be applied on those inputs. In essence, fix Sigma is about identifying and
optimizing the X factor, the inputs that
drive the output. By improving the Xs, we must improve the Y or we
focus on improving the Y. The transfer function
example in Dmth. Let's consider an example, calling a technical support
to resolve a computer ratio. In the defined phase, we define a problem, how long it takes for a customer
to receive a resolution. Y, which is equal to
the time to resolution, O is the total time it takes to resolve
the customer's issue. In the measure phase,
we identify and measure the various factors
involved in the call. Like the time in the queue, the time with support, the time spent transferring
the calls between agents, the resolution time. Analyze phase, we
determine which Xs are critical and what are the typical variations
across the factors. During the improve phase, we implement changes to reduce the time
spent in each step. Perhaps automating
certain responses or optimizing routine logic
is what is covered there. During the control phase, we monitor the system to ensure that the Y
that is a time to resolution has indeed improved and stayed in cop over time. This process can be repeated continuously to drive
further improvements. When followed
rigorously, DMAC is a powerful repeatable
methodology for achieving measurable return. Additional improvement,
methodologies in six Sigma that we have pen. Sixema nan by other
proven tools and techniques and practices which includes statistical
process control. It utilizes Controls chart to monitor the
variation over time. It uses the upper and
lower control limit to identify when the process is statistically out of control. SPC tools can trigger the DMX cycle when variation and defect exceed the
acceptable threshold. Variation and defect
reduction tools include commonly in total
quality management. They help identify
the root cause, opportunities for optimization. These tools play
a key role during the analyse and the
improve phase of DMC. Teamwork and quality circles. Originated in Teta emphasis were based on team based approach
to the process improvement. Employees at all levels
collaborate regularly to solve a problem using the tools and methodologies provided
in six Sigma. The quality circles often
integrate statistical tools, DMAT, and DPAtRduction
techniques. Next, Six Sigma projects
and the Yellow Belt road. In the next section,
we will discuss the Six Sigma projects and highlight what a yellow
belt needs to know, including the project roles, responsibilities, and the value the Yellow Belt brings
to the improvement team. Typically, the duration of a six Sigma project can
vary significantly. A short term project may last
just a few hours or day, especially when it is driven by small quality team aiming
for incremental icuments. A long term project
can span over a year, particularly when the scope is complex and cross functional. This is where the black
belt comes into play. However, the most typical
Six Sigma projects, which are a green belt run
about four to eight weeks, allowing enough time
to gather the data, move through all the
phases of the DMC cycle. Teen roles in six
Sigma projects. Each team member plays a
distinct and critical role. Let's understand them. A master black belt and a Blag. These people are leading
and managing projects. They ensure alignment with strategy and mentor
the team members. Green belts. They handled
a detail analytics, data gathering, and help
implement process improvement. Yellow belts are the people
who provide key inputs, assist with data collection, and support the
implementation activity. Though not as project leaders, yellow Bells have a very
essential team member role which are driving the day to day execution of the
Six Sigma project. What are the common goals
Six Sigma projects have? Project varies in
scope and often focus on reducing variation
in customer experience. In today's world,
experience matters a lot. Accelerating time to market, eliminating errors and defects, lowering operational costs, some critical consideration
for implementing Six Sigma and executive
sponsorship and management bid. Project without strong
leadership support and funding and visibility
are very unlike ecofaxe. Appropriateness of
the methodology. Pi Sigma is so powerful, but it is not right
for every problem. Avoid a one size fits all
methodology or a mentality. Start small and then scale. Build confidence
and skills that are smaller manageable
projects before taking up a broader
transformation effort. Do you know when to
use other approaches? In some cases,
alternative methodologies can be more appropriate. Lean initiative, Business
process reengineering, we call it as BPR, Business Process
Management or BPM. Or the other methodology
which can be used. Scope control is very important. If the project scope is too broad and it lacks
a clear outcome, it becomes unmanageable. Cost versus benefit. Consider the ROI before
investing time and resources. Example, spending
100 hours to save only 10 hours annually is
not an effective trade off. Conducting a
readiness assessment before taking up a project
is very important. This helps your
organization's preparedness before we dive into
picking up a project. Define the desired outcome. What are we trying
to achieve and why? Establish a success criteria. What does success look like for both the organization and
the individuals involved? Evaluate the data availability. Do we have reliable, relevant and timely data
to support analysis? Assemble the right team. Do we have people
with the skills, influence, and commitment to
make the product successful? Build a business case. What is the value
of improvement? Who tends to benefit
and who might resist? What's the expected ROI? Assisting the organizational
readiness is very important when you plan
for a six Sigma project. Are these key questions because
they are very important. Is, how does the future state look like compared to
current situation? Are we solving a real life
problem in our business? Is now the right time
to implement Six Sigma? Carefully assessment
ensures that the six Sigma project
is not only relevant, but it's also achievable and impactful for our organization. Are we evaluating
the performance? Do we have a strong
rationale about applying six sigma in
our business case? And finally, is there
something else going on in your project that
needs your attention? In Six Sigma, is there
actually right approach? These questions can
be certain that our organization is ready for six SEMA for
a given problem. There are three key steps to assess the organizational
readiness. Step one, assess the outlook
and the future path. Ask the question,
I chain critical? Business need it right now. Evaluate the current
performance. Ask the question. Is there a strong
strategic rationale for applying six Sigma
into our business? Review the systems and
the capacity for change. Ask the question, can
the existing improvement deliver the level of change
needed to keep us successful, competitive without
using six Sigma? To get started, consider
the importance of customer experience,
customer satisfaction. We're focusing on voice of
customer to drive change. Improvements are essential
and customer needs them. This is where six Sigma data
analysis tools come handy. It helps us in understanding how the customer
truly cares about. Six Sigma provides
powerful tool, future strategic planning by improving marketing
effectiveness, getting things right the first
time and identifying what really matters to the customer regarding our projects
and services. One such valuable tool in six Sigma Toolkit
is the CO model, which helps us understand and prioritize customer
needs more effectively. The CO model is a method
for gathering data from customers and understanding what truly matters to them. What differentiates our
offerings from the rest? It helps us in identifying important things like what
are the features that can increase customer
satisfaction when delivered well
attributed to the customer. What are the potential
dissatisfactor that could harm the customer
experience if not address? By analysing these feedbacks, we can prioritize
improvements that can create greater value
for our customer. Now, let's consider
strategic planning. Six Sigma analytics can play a critical role by identifying key factors
driving customers. Customer satisfaction, integrating them into
strategic planning. Performance improvements
are most needed. I an organizational
culture part of a standard approach of TIC Sigma through effective
project chartering, metric development,
control systems, and quality circle
teams can significantly enhance performance alignment
across the organization. Profitability remains
a top priority. Six Sigma is specifically effective in reducing
cost of quality. Many organizations
spend 20 to 75% of cost simply ensures quality
in products and services. By lowering these costs, we stay closely aligned with
customers expectation and consistently deliver better and faster than our competitors. Okay. Concept of len. Lean manufacturing,
particularly in a service sector
environment means recognizing continuous
improvement initiative. At its core, N focuses on
streamlining and enhancing processes to create more
value with your resources. TahiOo often regarded as father
of modern lien thinking, emphasized that the essence of lien lies with one
simple principle, calculated time from receiving customer order to receiving the payment for fulfilling it, and then work
continuously to make that time as short as possible. Len is fundamentally about eliminating waste across
the entire value sting, reducing unnecessary time,
effort, and resources. The result is to maximize value, improve efficiency,
better quality, and higher customer
satisfaction. In a manufacturing setup, an success stories are many. Currently, we have a lot, even in the service sector.
22. How to find a Project Defining the Opportunity for Improvement: One of the major problem which
the Six Sigma professional are many students
who come to me for training have experienced this. How do we identify a project? I cannot find a project in
my workplace in my company. Six Sigma is not
very strong around the first person from my company who's going through the
Six Sigma training. And I don't know how to
identify the project. This video or this session of the course is focused
about how do you define an opportunity for improvement and what could be the steps that we can
take for doing this. The improvement
opportunity that is identified will ultimately
define your project. What is broken in your process, how often it breaks, and the impact on the
customer and the form. As a project owner, you will need to ensure
that the opportunities has the characteristics
required for a great project. What defines a great project? The opportunity has a clear boundaries
and measurable goals. The opportunity that you have
identified is aligned with the business critical issues or initiatives with the
businesses driving. Suppose, if the business is
thinking about robotics, process automation by 2020, then your process of
identifying an opportunity could be any process
where it's highly manual so that you can
pick that up and go ahead. If your project, if your business
initiative is about ensuring that everything
is on one platform, you can find something where you have processes which are
on different platforms. So depending upon the
business critical issues or the initiatives with
the businesses driving, you can identify the project. What the customer
will feel about the improvement is an
important question which you need to answer. That will the customer
feel happy that, Oh wow, you're working
on this project. Or he feels that
why do you I don't even care if you do a process
improvement over here. If the answer is the second one, then you should not be
working on this project. Now the most commonly
asked question is, how do I find an opportunity
for improvement?
23. Voice of Customer Practical approach: The first important to, during the define phase is
the voice of the customer. What does the customer need? Sometimes the
customer explicitly mentioned what he needs, and sometimes it is implied and we need to understand
what exactly he needs from our product
or service and how well the process
meets those needs from the point of view of the
customer and not from our point of view or the process point of view or
the business point of view. To understand this, we can use some of the tools
and techniques which can help us get what is the point of view the customer has
and what are his needs. We may get involved
in direct discussions are in W with the customer
to understand what. We might sometimes roll
out a survey after we send the product or service to understand what he or she needs, we should regularly check the complaint box to understand. Are there any
concerns because of one bad customer expedience will ensure that our 100 of your good customers
you're going to lose. So regularly checking
your complaint box is also very important. If suppose you do a direct discussion and
there are no complaints. Testimony is very happy. You rule out a survey. You get very good
survey results. You go to the complaint box
and there are no complaints. It does not mean that you
should sit back and relax. You should keep looking
at the benchmark, what the market is doing within my industry and
other industries, which can create a thread. Is the customer moving away
from me toward somebody else? That could be analyzed through the bench marking exercise. Hence, it is important
for us to do this VOC exercise
very diligently. Now, most of us also have a problem that how do I
define an opportunity? I will identify a project. I'll be continuing with that
topic in the next chapter.
24. SIPOC: The third important tool during the define phase of the
DMAIC life cycle is SIPOC. Some people also
call it as Scopus. It's actually the reverse
of SIPOC is COP IS, do you call it as a SIPOC or a coop is the output
diagram will be the C. Sipoc is actually an acronym
for suppliers input, process, output, and customers. This diagram is a visual
tool for documenting the business processes
from beginning to end. The SIPOC diagram
is also referred as a high-level process map because they do not
contain much detail. The reasons I book
is created is it will help you set the
boundaries for your project. Though it looks as SIPOC or some people
call it as Scopus. The first thing
which I do out of my practical experience is that I fill up the
process steps first, which would be in maximum
of five to seven steps. To do this process,
what do I need? I fill that in my input. Who is going to
provide these inputs? It is my suppliers. From this process. What are the output
did I receive? And what, who's going to consume that output
is my customer. Now you need to
understand those SIPOC looks like a very simple tool. It helps you have
measurable metrics because your process
can have some KPIs. Your output can have
some requirements or specifications given
by your customers. Your inputs need
to be exactly in the same requirement that
the process needs to ensure that this
output comes out where you have some
measurable metrics. You also get to know who's going to supply and who's
going to consume. So when you build your SIPOC and show it to your stakeholder, he can clearly identify our contract is coming to an end with a
particular supplier. It will help you address the problem at the
very initial stage. If suppose the project
scope is too wide, number of customers might be too many or too many
outputs are present, then it will be easy for you to visualize who is the
scope manageable? Or if you stake holder fields
that these are the set of customers who might do not want to focus at
this point of time. I think the scope is increasing. We need to divide it into
two separate projects. We will be able to do that. Let's take a sample sidebar. This is very easy. I'm going to prepare some
pizza favorite, right? So I will go into first
fill up the process steps. So at a high level, how
do we make a pizza? You prepared a doubt. You add a source at toppings, at cheese bigger
than the old one, removed and package it. To do this process, what are the inputs
that you need? I need I need sauce, pepperoni, cheese, and Peppers. Who's going to supply me this
input is my grocery stores, dairy farm and vegetable farms. From this process, what is the output that I'm
going to receive? It's nothing but my whole pizza. And then I'm going to get
them into pizza slices. Who's going to consume it? Either the customer may decide
to dine in at my hotel. They might be a takeaways and they could be ordering
for home delivery. This looks as a very
simple process. You can see that I'm not specifying how should be
the texture of the dough. Is the person ordering a thin crust pizza or the
normal hand toasted pizza? What type of sauces He wants? Easy looking for a pure veggie
pizza or a cheese pizza, or a mutton pizza. We are not specifying what
type of doping it is. The process is kept at a very high level
and simple, right? If it is a three types treaties, visa or a margarita pizza, if you're in India, you have three types
of pizza and they might not require any
peppers and so on, right? So you are defining your process
at a very high level and specifying the inputs
and suppliers. You're not going
to specify what is a baking oven temperature for how many minutes do I
need to bake it and so on. Over here. All those things we're
going to do when we do a detailed process map during the next phase
of our project, that is a measure phase. This diagram, when I
show it to my staple that along with the project
charter and the CTQ, the stake holder will
be able to see, oh, you're only focusing
on the Piazza park, whatever the cupcakes
that we are selling. So you can clearly see
it is out of scope. So a quick recap. How do I build this
SIPOC or coppice? I begin with the process, define the process in general
terms at a very high level. I specify the start and end. I list outputs. In this process, I specify
our identify the customers, including internal or
external customers willing to receive this output. I list down the inputs
required for this process. Identify the suppliers who are going to provide
these inputs. It is a very simple tool
and a very powerful tool. You can clearly identify what is in scope,
what is out of scope. Some of you might say
that I have already written this during my
project charter stage. Do I need to write
it again? Yes. You need to write it again because you are reinforcing the fact that what is the
scope of your project. So all the three tools
we are going to use during the define
phase are mandatory. Like the project charter, the CTQ tree, and the sidewalk. You are free to add one more
tool which is a RACI matrix, which we will be
covering later on.
25. Kano: I just explained
you conceptually. How do I identify projects? My internal stakeholder
from external stakeholders, what questions I
asked and so on. Now, I will show you a
tool which will help it and make it easy for
you to identify a project. There are multiple tools. You have project
selection matrix. You will have the
other VOC techniques that I had told you earlier. Sometimes we can
also use Kano model, which will help me identify a pain point that
the customer is facing. In the model. You can see that I have
on the lower left corner, the must-haves in the middle
as a green diagonal line, I have one-dimensional desires. And on the left top corner, I have the delighters or
unexpected unknown things. You, before I even
get into those three, I want you to understand. My x-axis is about
how my job is done. The x-axis on the right side Does that the job is done well. And on the left says that
the job is not done well. The y-axis is how
my customer views. As my customer feels
satisfied, it goes up, and as my customer feels
satisfied, it goes down. Now let us understand what is a must-have or unexpected
quality requirement which your customer
might set up. These are those needs
which the customer has, which he has not spoken about. These are taken for granted
and spoken if not met. The one-dimensional type
of metrics are these are the desired quality metrics with the customer has
specifically asked, he has spoken to you
that I need this. These are something
that are measurable and it gives them a range of
fulfillment that Yes, Good, I bought this
product or services. When you look at a delighters, these are something
that are unexpected, unknown features of your
product or services. Nobody has spoken about it. Nobody was expecting this to happen and they are
unknown to the customer. So what you see is
that even if you do your job really
well for must-haves, the customer is never going to reach the satisfaction level. Our image just as to satisfy
can because that's your job. That was was required. So let me give a simple example. If I'm going by a flight, Do I have to ask specifically that the flight
will take off on time? Will they allow me to
15 gauges of baggage? Would they allow me a handbag? No. These are some
unspoken needs and they're taken for granted. Yes. If the flight is mentioned
could be departing at seven AM and reaching the
destination by say ten. It should be around
the same time. Because if the
flight is delayed, we are going to be unhappy. So the characteristics of a must-have is they are
spoken if they are not met. Do you know last time when
I went by an XYZ airlines, it just kept me at the airport
for three extra hours. All my day was plan, did not go. I missed my customer
meeting, etcetera, etcetera. Does the customer asked you that will the flight
depart on time? No. These are unspoken requirements. These are taken for
granted requirements. If you don't, you have to do these requirements
and ensure that all the metrics relating
to this are met. When I look at the green line. These are one-dimensional
design or activities or desired quality
characteristics or CTQs with the customer has. In the flight, I might say that I need a business class ticket. I'm willing to pay for it. I need a sandwich because I have paid for
it and I've booked it. I need more space and
I'm willing to pay extra $50 for the extra space at the beginning or in
the middle and soar. The customer has
specifically asked, I need extra speeds. I need a particular
food because in India for the domestic
flights you have to pay to, you consume the food. For example, I need extra baggages and you
are going to charge me, say, 300 Indian rupees
for extra KG of packet. So I see I have extra luggage. I want to book 50 cases
of extra luggage, right? So these are something that the customer is
specifically asking. They are measurable and the customer is also
willing to pay for it. Now suppose I have
booked my flight ticket, saying that I need
some extra space with some extra baggage. I have paid that extra money to the airlines and my
night reach the airport. The flight officers and the crew members
tell me, I'm sorry. The seed is not available. We will give you a normal seat. I will get unhappy if the
job is not done well, there is a drastic reduction
in my satisfaction level. If the job is done well, I booked for it and then
it was seamless SSO I get into when the job is done, when I get into the satisfaction
zone as a customer. So these are
one-dimensional arrays. These are at metrics
which are desired quality characteristics
of the customer has from the product or service. Now let's understand
what are delighters? These are some unspoken
needs of the customer. So let's assume that
I read the book, my flight, I reach the airport, I got into the flight. The lady over there
Give me a bouquet of flowers and a small gift. I was not expecting it. Did I ask for it? No. When I received it, do the gift was something that I may or may not use at first, very small, maybe just a
$5 or some 500 rupees. I would feel very delighted, you know, last time when
I went for the flight. I receive this as a
complimentary gift. They buy, just give
you something, a pen, or a small toy for your kid
who's traveling with you. These are something which
you are not expecting. Even if it's something
which is very poorly done, the customer feels delighted. Now how do we help me in
identifying the project? Let's take an example of the
conference room booking. Let's assume that I was not
taking this training online, but I had planned for meeting or further training in
a conference room in one of the five-star hotel. What are the must-have
requirements? The easy in the conference
room should be appropriate. They should be comfortable. Ct because of my workshop is going to go on for five days, for eight long hours, every day. These are some expected needs. What if I go to the
conference room and I find that those guys have said
that for each extra chair, you need to pay some amount. I really beat the satisfied I said when I booked
the conference room, I'm expecting you to give
seating for my audience. Right? If the EC is not working or
if it's too hot or too cold, it's not acceptable
and get upset because my customers are my
participants of the conference. I'm not comfortable. These are some must-have
requirements which needs to be as per the requirements, what the client needs. Even if I'm not going to ask, they should know
that it should be. These are some basic things. When somebody's book in
the conference room. The desired objectives of my conference could be that I need a strong Wi-Fi
connectivity because I'm going to ask participants
to download the dataset and I'm going to make them submit
their project work, etc. I will say that I need a
strong Wi-Fi connectivity. It's because it's not a speech, but it's an
educational workshop. I need a strong
Wi-Fi connectivity. I need a projector, which is an LED format because even the participants who
are on the backside of the conference room
should be able to clearly see the presentation
that I'm showing. When I do this, leaves the conference room and I find the Wi-Fi is not working. I'll get this satisfied
as a customer. If the Wi-Fi is
working as expected, I'll say Yes, I'm happy. They have arranged for the LED what I asked for and be happy. But if this is sorry, ma'am, We forgot the LED. I will get the satisfied. I even say very clearly, I had very clearly instructed
you that I used to things and I was also willing
to pay for it, and so on. Right? What comes out as a
delight is that I was not expecting them to give a free valet parking
for my participants. So not only did they
give free valet parking, which met them, which
made them feel Royal. They also give a customized
coffee mug which had the imprint of the participants who were coming for
this conference. I was also not aware that he's going to give a
customized coffee mug. He just asked me, can you give me the names
of the participants who are going to attend?
How many of them? I said, yeah, this is a list. This other 25 parties
tend to overlook come. And then he had ensured
that he goes to LinkedIn, finds the picture in, prints it on the coffee mug, and gave those customized
coffee mugs to my participants. Now there could be an
instance when one, the person who was mentioned in my conference was not
easy to be traced on LinkedIn or his
photograph was not good for that
customized coffee mug. He just mentioned the name of the customer and
gives it to him. He's not done a great job. But still I will be satisfied
because I may also, my participants
will be satisfied because they've never
expecting that we're going to get some
customized coffee mugs with their photographs
and needs and printed. Right? So these are some delighters, even if they're not done. So when the customer is going to be in the
satisfaction Zoom. Now, apart from these three
things that we just learned, that is the must-have
characteristics or must be characteristics which are your expected quality
requirements. If they don't do the job, when, if it is not a job
which is fulfilling, there is extra dissatisfaction if they do it extremely well. Also, the satisfaction does not go beyond a
particular level. The one-dimensional blue line, as I just expected, these are some desired quality
which the customer has. He specifically asked
for it and he needs it. So if you do it when
the customer is happy, if they don't do it when
the customer is satisfied. The green color line
or your delighters. Even if they do it well
or they don't do it when the customer is already
in the satisfaction zone. If they do it extremely well, the customer is on
the top of the world. Now, apart from this, you might see a Greek and other languages and
indifferent characteristics. Their presence or
absence does not cause any difference towards
the satisfaction level. Can you guess what could be the indifferent
characteristics in my in any project
or in any process. Then you see a purple
line which is a reverse. Their presence cause
dissatisfaction and their absence will keep the customer in a
satisfaction zone. And give you an example. Suppose there is a pest
in the conference room. The presence of a pest
is going to cause me dissatisfaction and it
fits the best free, it becomes a satisfaction. So those are some
characteristic which should not be present. Our example. They have opened the windows
of the conference room, which makes the direct
sunlight come inside. Now because they have
kept the windows open. Technically, keeping the window opens a good thing, right? But because they keep
the windows open, people are not able to
see my slides properly. They're feeling very
hot and they're getting distracted because they're
looking outside the window. Presence is causing
dissatisfaction and absence is keeping the customer satisfaction
zone in the front? Could be. Yes. So whether they are
present or not, it does not make any difference. I would invite you to type some examples of what are the
must-have characteristics? What are the one-dimensional
characteristics? What are some examples of
delighters that you have seen when you are consuming or using
some product or services. Some indifferent
characteristics and some reverse characteristics in the discussion section below, which will help me
understand they do understand this
concept or not. Now, let us understand how do I identify a project using
the scanner model. If there is a problem with any of your must-have requirements, that is definitely your
first list of project ideas. Let's assume all
your must-haves are being met and the customer
has no components, are no concerns regarding them. Then you go towards the one-dimensional aspect
where you see that, okay, if the customers are asking for these 34 days or
these ten things, are we able to meet it or not? Yes. Out of the ten requirements the customer has most of
the time two requirements, we always get complaints. So those could be your
project identification ideas. Once you are satisfied about
having a must-have in place, you're one-dimensional,
then only go for inventing some desired
characteristics. Please do not think
about delighting something to the customer without having your
must have in place. Let's keep the house in order. Before we go for designing some delighters
for the customer. You must ensure that the reverse characteristics
object of opportunities, are not there in your process. Orders that could also be an
opportunity for improvement. With that, we come to
the end of the model. I'm going to show you
some samples which can give you an idea of what are the
threshold attributes, what are the
performance attributes and what are the
excitement attributes? The must-haves are also called
as threshold performance attributes or your
one-dimensional and excitement attributes
are your delighters. This is about an airline
model pre-COVID. Now, the second exercise
mute I give to you is to identify each of these items and write down in the discussion
section below that, what do you think automatic
channel scanning on a TV. Is it a performance
glider on must-have? I will be looking
forward to your answers in the discussion
section so that we can I can understand whether you understood the
concept clearly are not.
26. CTQ Tree: We understood what is
critical to quality. Now, unimportant note the most important attribute of
a CTQ that it may be, it must be translated directly from the
voice of the customer. And it must give an unbiased view of what
the customer needs. So it is not what you think, but it is about what
the customer feels about you or your
product or your service. Customer needs
mapping for a bank. Let's take this example. Suppose the voice of
the customer sees, I'm confused about how to sign
up for an online banking. This is the problem or this is the complaint
that he's making. This service or quality issue is that the access to the
online banking is unclear. Do you understand that? Exactly? The
customer need is can I get a simplified online
signing up process? So if I have to pick
a project on this, the output characteristics
should be the minimize the number of steps
required for signing up. Are you understanding how do
I convert a VOC into a CTQ? Let's take a look at the
template more easily. So when you do, a customer needs mapping data, four key elements, the
voice of the customer, exactly the way the customer
has said in his survey, in his interview, in his interaction with us or in
the complaint mailbox week, picked that up and
write it down. We try to understand what is the service or quality issue
the customer is facing. Then we can work
them into what does, what does it need the
customer has what is the thing that the
customer wants us to fix? And can I can work? Because customer always is talking about something
which is soft. Then I tried to convert it into an output characteristics. I can give you a more easy
template for you to relate. You can put that up in
the CTQ drill down tree. The client is satisfied. So once I have my
previous template ready, I can pull up and pick this and put this up for
my CTQ drilled out D, which will be an output
during the define phase. So my client is dissatisfied. Why is it a satisfied? Because he has concerns
with accuracy. What type of accuracy? External accuracy. That's my output. So it is the external accuracy. What is your project?
Why the project? Why is external accuracy? What is the target that
I want to achieve? My monthly external accuracy should be greater
than equal to 95%. What is the lower
specification limit the customer has said? The customer sees that the lower specification
limit is 95 per cent. Avoid obviously
sky is the limit. So sometimes a customer might give you a
specification which could be one-sided
defect definition. So the effect is equal
to the external reward. Right? So that is how you can
put up a CTQ drill down. For ease, I am sharing
this template with you, which you can use as a
reference and you can plug your values during the yellow or green belt
or a Black Belt project. The project charter,
the CTQ tree and SIPOC template will
be seen in spite of the fact that your
project can be as simple as a yellow belt project or as complicated as a
Black Belt project. Right. So you ensure that the CTQ
drill down tree tells you why is the need the customer has on what is causing this
satisfaction to the customer. And on the right side, you break it down into the output characteristics,
your project. Why? What is the target? What are the
specification limits, and how do you define
this as a defect? With this, we come to
the end of CTQ tree. We will move into sidewalk
in the next lesson.
27. Types of Waste TIMWOODS DOWNTIME: We have been constantly working on learning the concepts
relating to Lean Six Sigma. As we can see, though
this concept of Lean Six Sigma is centuries old, are at least I should say, it's 300 years old. The evolution we had seen in the history of
Lean Six Sigma. We need to now go and understand one more tool
that we use during the lean. That is the eight types
of ways that we identify. Some people call
it as Tim woods, and some of them also
call it as downtime. Let us investigate
each one of the waste. The first T in the ten words
is the transportation waste. Do you know when you're moving
items or information in terms of a service industry or moving items for a
manufacturing setup, you are spending time,
energy, and effort. Why cannot we have everything
at the right place? Can I avoid transporting
the items or can I minimize the moving of information from one
mailbox to another? Which can make it
easy and faster for me to do the process. If there is transportation
in your process, it is one of the
types of waste and your objective is to minimize
the transportation waste. Because products get damaged
when they're getting, when they are in transport. Information might get
lost because it's in between the two mailboxes
are two different cues. There is an opportunity for minimizing the
transportation waste. You must try to address it. The next letter in the timbre is I. I
stands for inventory. Inventory is nothing
but the items and information that the customer
has not yet received. It is lying in your warehouse
or somewhere within your factory or between your
factory and your customer. In terms of a service industry, what is an inventory? It will be those extra
reports, extra processing, your application forms
which you have processed, but the customer does not know the status of
their application. And those application, those papers are just
floating around in your office or in somebody's desk or
somewhere in-between. Either they are in the
transport and so on. Inventory happens because
of the other type of waste, which is overproduction,
which we will be covering in few minutes. The M in timber
stands for motion. Motion means excessive
movement within the workplace. The difference between
transportation and motion is the transportation
is about moving of objects, items,
or inflammation. Whereas motion relates to the operator who is
working in the office. Do I have to continuously
move from one place to another within my office to
ensure my work gets done. Can I rearrange my
office space in such a way that may motion can be reduced because if
I'm continuously moving, maybe I get tired by the
end of the day and I'm not as energetic and productive
as I required to be. I might decide to skip some process because
I'm very tired. So can I have my
process my floor arranged in such a way that
my motion is minimized. Let's give you a
one more example. In a service sector
environment because it's easy to visualize and
a manufacturing setup. I sit on the first floor, the printer is present on the second floor
at the right end. I give a printout. I need to immediately rush
from the first floor to the second floor to pick the
printout from the window. Otherwise, it is a
confidential information and can cause a problem. Even if it does
not confidential. It is some information
which I needed it, right? And suppose I am giving ten
to 12 prints or the blue feel that I should
relocate my desk to the second floor or relocate
the printer to my flow, which will ensure that this
motion waste can be reduced. We will be seeing many more
examples as we go further. The M stands for
the waiting time. Sometimes we are waiting for the information to arrive
or the raw material to arrive are some semi-finished
product to arrive for me to continue with my
production operation or to continue with
my service work. So hence, we should
eliminate the waste. Processing.
Overprocessing is doing the work more than necessary. I have already cleaned the table or I have
cleaned the item, but I'm redoing it thinking
that, Oh, it will shine. I have already
verified the process, but I'm redoing it because I don't want my boss
to find an error. How can I apply the Poka
Yoke key techniques in such a way that I don't
need to work process. And still the processing is
perfect without any errors. That will be your
responsibility to identify. The next row in ten words, East oil production, doing
more work before it is needed. If I'm thinking
that the next month I might have orders
for 10 thousand units, manufactured 10 thousand
units, this one. It might result in the
inventory waste as well. Or production leads
to inventory. And it is blocking your
capital resources, your space, and all these
things in a negative manner. Hence, we should
avoid or production. If there is a demand, we should actually
make it to order. You have the example of Dell, which makes the laptop to
the order of the customer. It doesn't start
the assembly till the time the customer
does not place the order. Still, they have made the
process so that they're able to deliver the laptop at the specified
delivery timelines. The inventory in that
process is very less defect. Defect is the mistake or the error that
needs to be reworked. The product is
damaged or I haven't verified the application
form correctly. If there is defect
in the process, it is waste of resources because the first time you
were trying to do it, there was a problem and
hence you have to redo it. Why can't I have a
technique or a process in place which ensures that
the defect does not happen. We have to get creative
with our solutions. The S in the ten words stands
for unutilized skill set. Skin set, which are not
matching to the cast, to the employee's ability. If I'm not able to utilize
my employees to the fullest, there is a thread that I have. They might either get
demotivated or they might decide to leave my organization and
go somewhere else. Hence, it is important for me to remove the skill set
waste from our process. So to summarize, what stands for transportation,
inventory, motion, waiting, overprocessing, overproduction,
defects, and skill set. Our objective would be
to minimize or reduce this waste or completely eliminate them as
much as possible.
28. Current State: Yeah. Toast done. Oh, thank you. Why
are you serious? As raisin toast. Plus, that's burnt. I only one to two pieces. What
29. Types of Data: As we increase our
awareness towards type of data, towards six sigma. Understanding the concepts
of type of data is very important because
when we look around, we collect data which are
of different datatypes. Sometimes the datatype
is qualitative. I'm very happy. This class is good. Assignment was difficult. I did not like the movie. Now, can I say How good was it? How difficult it was? It? Was it bad? How bad was it? Can I measure good, bad? And all these elements, because these are emotions. These are definitely
representing what the audience's feeling, but it cannot be measured. And in Six Sigma, we very well believe that what cannot be measured
cannot be improved. As these elements
are qualitative. Be, will not be. We will try to convert
them into quantitative. Let's take the example
of quantitative data. When we think about
quantitative data, there are two types of data. One is discrete data and
other is the continuous data. Let's understand what
is discrete data. When we think about
discrete data, these are the data
points that I can count, but I cannot divide. If I ask you, how many members are
there in your family? Even though you might have your grandmother who
is 90 years old, or you have a small
kid at home with just a few months
or few days old, you cannot count somebody as a whole and somebody as 0.02. Hence, you see, there are
five people in my family. Are there are three
people in my family, depending upon the
count of the people. If the baby is two days old or your daughter
is 20 years old, you never count them as 0.0, 220 or something like that. Things like this will be counted and hence they are
treated as discrete data. I'll give you more examples. How many laptops do
you have at home? You can count, even if to work, laptops are not working. You might say that I have
five laptops at home. What not working and
three are working. But can you say because
it is working partially, I will treat it as 0.5. No. Hence, discrete data, those data types which are
used for counting, I cannot divide it. When you have
discrete data type, the type of graphs
will be different. You cannot use a line chart
or a continuous data chart. Whenever you're
doing discrete data, you might want to
do a count plot, a bar plot where you
have frequency on one side and the categories
on the other axis. This will make it easy for you to represent the
data on the graph. Let's come to continuous data. When we think about
continuous data, these are some things
we can measure. I can divide it. I can measure it
to the accuracy of the last decimal point, e.g. if you ask me how much of raw material was
sent to the factory, I can see it was three-tenths. If you tell me can you tell me exactly in how
many cages was it? I can move the precision of
telling that it was 2,743.23. I'm not really measuring
it in kilograms, but I'm also in Proving Grounds. Suppose I'm doing a reaction
in a chemistry lab. I need to put the catalysts, but I need to ensure that those are sent only in milligrams. Can I measure it
with that accuracy? The answer is yes. Hence, continuous data are those data points which
are easy to measure. I can measure it in higher unit. I can also measure
it in lower unit. I can divide it endlessly to get the accuracy that I need. I can measure time in
light-years, in calendar years, in months, weeks, days, hours, seconds,
milliseconds, nanoseconds. Hence, I'm able to measure
this data divisibility. And I can easily
divide this data and I will go to another
unit of measurement, which is only increasing
the precision of my. Hence it remember, whenever
we pick up a project, we ensure that our data is either discreet data
or continuous data. Sometimes we Rollout Service. So when we roll out surveys, we want to ensure the data. I know it's the quantity. Did you like the service? But what do we do? We try to convert them into a
five-point scale, 1-51 being pool five,
being great experience. So what happens is the user
is trying to put one of the tick mark at
either 1234 or five. Hence, it's important for
you to understand that a qualitative data needs to be converted into
quantitative data. And then only I can pick
up an improvement project. We will continue our
understanding in the next lesson.
30. The 5 Whys Explained Root Cause AnalysisPart1: Let us now understand
the phi by techniques. It's a very important technique when it's come to a process. Dora. I'm going to cover using this radio animated video
of what needs to be done and what can be
avoided. Let's get started. Have you ever experienced a
problem that kept recurring? Addressing a problem or
failure mode more than once as time-consuming and a
waste of valuable resources. The issue is that the root cause isn't being identified
or addressed. If you're not getting
to the root cause, you're merely treating a
symptom of the problem. In addition, if a
permanent remedy is not determined
and implemented, the problem will
eventually repeat. However, and easy
to use tool can assist in eliminating
repeat problems. This tool is the
5-Why and five how unpredicted problems might
occur in any team or process. However, issues are just
symptoms of deeper issues. Fixing a problem rapidly, maybe a convenient solution. However, it does not protect your work process from
recurring errors. This is why your team
must concentrate on identifying the root cause
and tackle it properly. The Five Whys analysis, often known as the
root cause analysis, is one of the seven
fundamentals used in Six Sigma. The principle idea
behind the tool is that there is a
cause for every effect. Therefore, the quality issue can be viewed as having
multiple causes. However, it is additionally known that there's a series of reactions called symptoms before the cause reaches its effect. Therefore, if the management can pinpoint and solve the
problem from its root cause, considerable advantages
would be gained. Every team encounters
roadblocks and it's daily work. However, using the five whys
will assist you in finding the root cause of any issues and protect the process
from recurring errors.
31. The 5 Whys Explained Root Cause Analysis Part2: Hello friends. As I have decided to make this program a complete program. And some of you had written some questions in the
discussion section. The limb that you would
like to know more tools about the process door
approach and the data. To the tool that I'm
going to take up in this video is the
5-Why Analysis. I'm going to dive deep into it. And before we go further, let me just do a quick recap that whenever we are
trying to solve a problem, we have two approaches. One is the process door approach
and other isn't Datadog. So we have seen multiple things
about Graphical Analysis, different types of
graph hypothesis testing control charts. All those are part of data adorable in process
due to uproot, it's highly based
on the Lean skills. There. We are trying to
understand the process by asking questions and not
focusing much on data. But as we are part of the
Lean Six Sigma journey, we will try to
leverage the numbers as well as the questions
in the right format. So let's get further. We want to understand how
should I do if I buy? And we all know that we love
to ask questions as good. Let's go further. So the phi right
technique was created in 1930s by shocky, the Japanese manufacturer, inventor and the founder
of the Toyota industry. It has become very
famous in 1970s and Toyotas still uses it to
solve the problems today. Not only to eta, I would say everybody is using to
solve this problem today. One of the essential
variable for a successful implementation of a technique used to make
an informed decision. This implies the decision-making process should be based on an insightful grasp of what actually happens
on the workflow. What is 5-Why Analysis? Bye-bye. Analysis is an iterative process
where we're trying to explore the cause and effect of relationship with the
underlying problem. We always believed that whatever you're
seeing as an effect, there is an underlying
root cause. And we want to understand how that cause is causing an
effect on the output. The primary objective of this technique is to
determine the root cause of the defect by the issues are issued by repeatedly
asking the question, why, why is it happening? Why is it happening and
why is it happening? Why is the name derived from the recounted observation of the number of hydration
to resolve the problem, If one wishes to reveal
multiple root causes, the method must be repeated, asking a different sequence
of questions each time. We will be seeing
the examples also. What is fiber analysis? Let's dive more deeper. Method provides no
rigid and fosters that. What should be the lines of
questions our investigation and how long should we proceed in search of the
original root cause. Consequently, even when the
method is closely followed, the outcome still depends
upon the knowledge and the persistence of the people
involved in that room. For the discussion. The primary objective of a
phi y is that it is one of the most powerful
assessment methods of all non-statistical analysis. The process door approach. It can uncover and trace back to the problem that was
not very obvious. When applying the
fibroid technique, you'd need to get to the
problems and fix the root cause. The 5-Why me
demonstrate to you that the sources of the problem
are quite unexpected. Often the issues considered as a technical problem turns out to be a human or a process issue. Therefore, finding
and eliminating the root cause is crucial to
avoid hydration or failure. Asking why or more times? The first time we say
gather your team. The second important step is to define the issue. Ask the why. Ask the why four more
times I know when to stop, address the root cause
and monitor the measures. When we're doing
the 5-Why Analysis. The step number one is
to gather our team. The phi way abroad is not an
individual based activity. In fact, most of the Lean
Six Sigma project activities or a group activities and
you as a project lead, have to be a good
leader in communicating and getting your
team together to contribute to your
project's success. So coming back, they tend
to gather a team of people from various
departments so that you can get a cross
departmental view. Each representative
must be familiar with the process that
will be investigated. By forming the functional
team it requires. It will provide you a unique point of view
for all your issues. This will help you collect sufficient information to
make informed decisions. Keep in mind that this is
not an individual tasks. It needs to be executed by the The second step is
to define the issue, discuss the issue
with the team and make it concise
problem statement. It will help you categorize the scope of issue you
will be investigating. This is very important
step because if it investigates the
wide scope problem with a hazy boundaries to be as concentrated as possible and find the dynamic
solution in the end. Ask why. That is the step number three. Now, it's time for your team to inquire why the
problem is happening. These questions need
to be addressed. Concrete problems, not just
the theoretical problems. Look for answers
that are grounded in the fact that we
must be recorded of things that are
happening and not Quest at what might
have occurred. Ask why again, that we Let's continue with
the step number three. These blocks of phi
y's are becoming just a process of
detective reasoning. Why did it happen? Why did it happen? And generating many
possible root causes and sometimes creating more confusion that you're chasing down the
critical issues. The facilitator should
inquire why as many times as needed until the team figures out the root cause of
the initial issue. This is a very critical thing. Do we call it as a
firewall analysis? In recent times, we have
renamed it as YY analysis because we might get to the root cause after
seven or eight y's. Sometimes we get
to the root cause after the third or
the fourth way. So it's not compulsory that
you should stop after five. You should go till you
reach the root cause of the issue or the problem
that you're trying to solve. Ask why. Advise one. Don't ask for
excessive numbers of Y. If you keep going, you might end up getting tons of unreasonable citations
and complaints, which is not the purpose. Advice to the five-year
analysis will resemble a matrix with various branches
in these circumstances. This may even help you identify and eliminate
organizational issues. Ask why four more times. Asking why four
more times and get the answer as a base
for your question. This is an important way
of forming your questions. You will have five reasons for each y and the questions
whenever you have done this. As previously mentioned,
you might need to ask why more times than phi if you haven't got to the
root of the problem. Step number five,
know when to stop. This is very critical. You will know when
to stop asking by. When asking these questions no longer produces good response. On the off chance that if you haven't gotten to the
root cause of the issue, you might need to
consider a more in-depth problem-solving method
like FMEA or Fishbone, Ishikawa diagram or cause
and effect diagram. If you have received more than one causes in
the step number three, repeat the phi y for each of
these as various branches until one root cause for each of the issue has
been determined. It is also important to ensure you haven't
stopped too soon or aren't just accepting a
knee or a job or gut reaction. This is very critical because you feel or too
much, it's too much. Let me stop. Are we are we are given this answer because this
is what we were expecting. Then also, you're not
going to get the benefit. Please take it to the
point where the team produces no reasonable response. The root cause. This is a very critical and important
step in the 5-Why Analysis. It's not only about
identifying the root cause, but you need to address
the root cause, which many of the times
our people do not. Do. They say, okay, we found this. And then they go
with their own gut feeling approach to solve this. The correct way is
whenever you have identified the root
cause of the problem, the Internet team should discuss the list of corrective actions. Our counter measures to prevent the problem
from recurring. The five-year master should
then assign which he members should take
responsibility for each team on the list. Monitor your measures.
In conclusion, to record your findings and
distribute them throughout your organization so that everyone can learn from
this particular case study. Best practice sharing is a
very important step in all, in your Lean Six Sigma
project journey. Again, if this happens, it's a good idea to repeat
the five-step process. Ensure that you have
identified the root cause. When should we use
the 5-Why Analysis? And let's continue further. When you use vi vi for quality improvement, troubleshooting, and
problem-solving. But it's most effective to result's simple and
moderately difficult problem. If it's a more complex problem, you might have to go
through FMEA or hypothesis testing to be more concrete about the solution
that you're going to find. The root causes that
you're going to address. However, it may
not be suitable to tackle complex and
critical issues. This is because five, I can lead you down a single
track or a finite number of tracks of inquiry when
indeed when multiple causes. Extensive methods such as
cause and effect analysis. Failure mode effect
analysis may be more effective in
cases like this. Whenever simple technique can often direct you quickly
to the root cause. So whenever a process or a system is not
working perfectly, give it a short before you embark on the more
in-depth approach. And certainly before you
try to develop a solution, the simplicity gives its high
flexibility to the phi bi combines well with all
the other methods and techniques such as
root cause analysis. It is often associated
with lean manufacturing, identifying and eliminating waste practices or
non-value-added practices. The fibroid technique is a
simple and powerful tool. The main goal is to track down the exact reason
or the root cause of a given issue by asking the
sequence of why questions. The 5-Why method is
just your team to focus on finding the root
cause of any problem. It encourages each member shared plots of continuous improvement rather than accusing others. Gives you your confidence
so that it can eliminate any issues and prevents the process
from recurring failures. The two main techniques are used to perform 5-Why Analysis. The fishbone diagram
or the tabular format. Let's try to understand the fishbone diagram
technique of 5-Why Analysis. The fishbone diagram, also
called as Ishikawa diagram, cause and effect diagram
or fishy cover diagram. Our usual diagrams created by
the bike around Ishi cover that demonstrate
the potential cause of a particular event. Common uses of the
fishbone diagram, our product designs
quality defect, prevention to
identifying potential and events causing
an overall impact. Each cause or justification for implementation is a
source of variation. In a tabular format
of 5-Why Analysis, a table is an
arrangement of data, typically of rows and columns, or possibly in more
complicated structure. Tables are broadly used for communication research
and data analysis. Tables appeared in print
media, hundred and nodes, computers of this architecture, traffic signals and
many other places. The specific conversation
and terminologies describe the table vary
depending upon the context. Further table differ
significantly in variety, structure,
flexibility, notation, representation,
and use the rules for performing 5-Why Analysis. The phi bi systems can be personalized based on
the particular needs of a given facility. However, most
companies implementing this type of strategy will use some general rules or guidelines that will keep them
strategic focus. The following rules of
performing five whys are generally a good place to
start in most situations. It is important to engage the management in phi y
process of the company. Use a whiteboard or paper
instead of computers. Write down the problem and make sure that all the
people understand it. Distinguish between the
cause and the symptoms. The focus on the logic
of the cause and effect relationship ensure
that the root cause certainly lead to the mistakes. By reversing the sentence
create due to the analysis. Attempt to answer, which
make answers more accurate. Search for the
cause step-by-step. Don't make hasty judgment. The statement of
facts and knowledge, evaluate the process
and not the people. Never leave human error, blamed John or
workers in attention, etc, as a root cause. He doesn't want to do it. Or let's blame john that he
is the one who's responsible to establish an atmosphere
of trust and authenticity. Ask why until the root
cause is identified? Because the elimination of. Which will prevent the error. When you structure the answer to the question why it's used. It should be according to
the customer's perspective. Now, these are some
criticisms about phi way, why people do not
like using flyways. Many companies for training
and engineering services successfully utilize
the firewall techniques for fundamental
incidence or failure. By utilizing the right
placement of triggers, organization can
use the 5-Why for its fundamental
problem-solving and then program to form a
cause and effect analysis for more complicated problems like Apollo root cause
analysis method. A disciplined problem-solving
strategies should push, aims to think outside the box, identify a root
cause and solution. There are various reasons for the criticism of Phi, right? Results are not repeatable. Different individuals
using phi y come up with various causes
for the same problem. Tendency to isolate a
solid three root cause. Whereas each question should elicit many ways root causes. Daughter linear method
of communication for what is often
a nonlinear event. Now let's move to the
benefits of 5-Why Analysis. Help identify the root
cause of the problem. Understand how one process
can cause a gain of problems. Determine the relationship
between different root causes. Highly effective without complicated
evaluation technique. I will pause here for a
second to tell you that if you feel that you have
any doubts or questions, please feel free to ask the questions in the
discussion section below. I will be happy to
resolve your queries. Let's continue. What are
the limits of the firewall? The firewall method is an incredible technique
for getting to the root cause of the problem in a rather shorter
period of time. However, it's speed
and convenience of use sometimes can lead
to uneven results. When it comes to a
repeating failure. If the firewall fails to
deliver the true root cause. The following are few
of the limitations. It doesn't continuously lead
to the identification of group was when the cause is
unknown to the team members. It makes up a gradient analysis when symptoms are
discovered in strong, driving deep, deeper in
determine the true root causes. Different people may
get different answers, but the cause of
the same problem. Confirmation bias, the tendency to interpret new
data as a confirmation of one's own existing ideas can only be as good as
the people who use this. It's expertise and experience. Human not dive deep, love to reveal the root cause
of the issues entirely. The members tend to depend on the detective logic instead of observation when
recognizing radius factors leading to the root causes. Let's do an example
of fiber analysis. Let's see def boss Amazon example for
application of phi way. I have taken this from management study guide
for your reference. Both illustrated how the
phi y should be used. He has gone to one of his
shop floors at Amazon. On his visit, he noticed that the finger of one of
their employees were caught on the conveyor blood
and they employ got injured. The following is a record
of the meeting where Mr. Boss describes
this incident. Washington, what
caused the associate to damage his answer? Because his thumb got
trapped on the conveyor. Why did his thumb get
trapped in the conveyor? The answer because
he was teasing his bag which was moving
along the conveyor. Why was he chasing
after his bag? Because he put his
bag on the conveyor when but then turned
on by surprise. What was the purpose for his
bag being on the conveyor? Because he used the
conveyor as a table. Conclusion of the case. So you can see that
we just did four y's and we reach
to the conclusion. The logical root cause
of death associated damaging their thumb was that he needed a table instead of using the conveyor
belt to drop his back. Unfortunately, there were
there wasn't one around. So he used a conveyor
belt as a team. To eliminate further
safety incidents. We need to provide tables, add the appropriate station, and give portable light tables for the associates to utilize, update and focus on
the safety training. Conclusion regarding regarding the
methodology in general. Phi by acts as a powerful tool to help
shift to the symptoms. Solving this root cause
solves all the issues and between subjectivity involved
in the final analysis. The phi by process is
only semi-structure. Therefore, if different
people do it, they may come up with
different results. The process is only as good
as the person running it. This makes it important to
ensure that the team is cross-functional involving staining the best
results for the process. So the final conclusion, the firewall technique is a problem-solving method
that relies by asking the question why five times in a continuous sequence
to find the root cause? Each time you inquire why
the problem occurred, your answer turns out to be the reason for your
next question, compelling you to dig deeper and deeper into the true
cause of the issue. This informed decision-making
technique investigates the root cause or the cause and effect relationship hiding
behind the specific problem. Rather than coming
up with solutions that could only address
certain symptoms. Phi way process on a countermeasures aims to prevent the problem
from occurring. Again, wishing you all the best, and I'll see you in
the next lecture.
32. Vanilla icecream: Let us now understand a very important concept
through a story, root cause analysis, and
how we can investigate. The vanilla ice cream case
that puzzled General Motors, never underestimate your
client's complaint, no matter how funny
it might seem. This is a real story that happened between the customer of General Motors and its
customer care executive. Please listen to
it very careful. Fly a complaint was received by a Division Office
of General Motors. This is the second time
I have written to you. I don't blame you
for not answering me because it might sound crazy. But it is a fact that
we have a tradition in our family to have ice cream as a dessert
after dinner each night. But the kind of ice cream
varies every night. After we have eaten our dinner, the whole family votes on which kind of ice
cream we should have. I drive down to the
store and get it. It's also a fact that I recently purchased a new car
of your company. And since then, my trips to the store have
created a problem. You see, every time I
buy a vanilla ice cream, when I start back
from the store, my car won't start. If I get any other
kind of ice cream, the car starts just pile. I want you to know that I'm
serious about this question, no matter how silly it sounds. What is there about the car that makes
it not start when I get vanilla ice cream and easy to start whenever I get any other
kind of ice cream. The president of the
General Motors was understand understandably
skeptical about the letter. But he sent an engineer to
check out the situation. The latter was surprised
to have greeted by a successful and obviously
well educated man in a fine neighborhood. He had arranged to meet the man just after
the dinner time so that the two hopped into the car and drove to
the ice cream store. It was the vanilla ice
cream in that night, and sure enough, after
they came back to the car, the car did not start. The engineer returned
for three more nights. The first night, they got
a chocolate ice cream. The car started.
The second night, he got a strawberry ice cream. The car started. The third night, they ordered
the vanilla ice cream, and the car failed to start. Now, the engineer being a
logical man refused to believe that this man's car was
allergic to vanilla ice cream. He arranged therefore to continue his visit as long as it took to
solve this problem. And today, this end he
began to take the notes. He jotted down all sort of data, the time of the day, the type of the gas used, the time to drive back
and forth, et cetera. In a short while he got a cue. The clue was that the man took less time to buy a vanilla ice cream
than any other flavors. Oh. Why? The answer was that
the layout of the store, the vanilla was the
most popular flavor and it had a separate case in front of the store
for a quick pickup. All the other
flavors were kept in the back of the store
at a different counter, where it took considerably
longer check out time. Now the question for
the engineer was, why did the car not start
when they took less time? Eureka tying was
now the problem, not the vanilla ice cream. The engineer quickly
came up with the answer the vapor lock. It was happening every night, but the extra time taken to
get the other flavors allowed the engine to cool down
sufficiently to start. When the man took vanilla, the engine was still too hot for the vapor
lock to dispute. Even crazy looking problems
are sometimes real, and all problems seem to be
simple only when we find the solution while we
have a cool thinking. This is an amazing story
which tells us that sometimes our customers have a
practical problem, which sounds crazy. What is more important
is how we can use our logical thinking,
our rational thinking, our parallel and
perpendicular way of thinking to solve the problem
the customer is facing rather than telling that, Oh, my God, this is so
silly. Thank you so much. We'll continue in
the next lesson. Oh
33. 5s methodology: Hi. In this five S training. I'll guide you through
every aspect of the five S methodology
in detail. The five S methodology is a popular tool in
lean practices, designed to keep workplaces
safe, clean, and productive. But like any tool, it has its pros and cons. Let's start by asking, is it essential to begin your
lean journey with five S? Benefits of five S, it's easy to implement. It typically has
a positive impact on quality and productivity. It signals to the organization that lean practices
are underway. Disadvantages of five S, it might shift focus away from
more critical priorities. It can sometimes be perceived merely as
a clean up effort. Lean efforts might be narrowly associated only with
five S. Remember, the true goal of
a five S program is to reduce the seven wastes, decrease variation, and
enhance productivity. Successful five S programs are implemented in workplaces
with clear goals in mind. Five S is also about a shift in mindset from seeing
your company as disorganized and messy to having a well organized workspace where everyone knows
where everything is. The term five S originates
from Japanese words. Si St, sto, set in order, C, she, sku, standardized,
Shu k, sustain. It's important to remember these in the correct
order and to follow each step meticulously when starting a five S program. Starting with five S is
often a good choice, but make sure to execute each S properly for
the best results. Now I will explain how
to properly perform the sort step of the
five S methodology. SOT is all about getting
rid of what's not needed. First, you need to decide with your team on
the sting criteria. For example, items
used infrequently. Items needed for quick
customer response, items necessary for safety. Next, the team should
classify items, according to these criteria, scan every item in the area, and if an item is either never used or its purpose
is uncertain, it should be red
tag or discarded. A red tag is a label with the
date of the five S event. It helps track when the item
was reviewed by the team. You can place tagged items in a large box near
the sorting area. If an item remains untaged
after a set period, it can be disposed of,
recycled, or sold. The sorting process
should be conducted regularly ideally
every six months. However, be mindful
not to overdo it. Allow team members to
keep personal items in their workspace to ensure
they remain comfortable. After completing this step, your workplace will already
look significantly improved. How to implement
the set in order, step of the five
methodology properly. At this stage, you should only have the items you
need in the workplace. The goal is to place these items in the most
efficient locations. As my grandmother used to say, a place for everything and
everything in its place. To achieve this, you can use
tools such as shadow boards, labels, footprints,
flow markings, trolleys, and color coding. Position items based
on their frequency of use to minimize
unnecessary movements, such as stretching and bending. Spaghetti charts can be
useful for analyzing and testing different layouts
before finalizing them. Ergonomic principles and safety
are crucial in this step. For instance,
frequently used items should be located in a zone close to the point of use ideally between shoulder
and pelvis height. During the set in order phase, act like an engineer
working closely with the people who will
use these setups daily. Collaborate with
them to reduce waste and ensure they fully
embrace the new arrangement. It's important not
to force a solution. Instead, be open to adjusting positions as
needed in the future. Keep in mind that the
change is allowed to adjust positions in
the future as needed. The shine step of the five s methodology is often
under evaluated. This is not a simple
physical idea, but has to be done as a visual control to
correct immediately for anything out of place and asking why the item was
in the wrong position. Cleaning is checking. The team has not
just to clean up. They have to highlight
any abnormalities and perform the five is analysis
to find the root cause. For example, if they clean up a machine and oil
leakage is discovered, they have to clean up and
immediately ask themselves why the oil leakage is occurring and plan what should be
done for prevention. The shine step has to
be done regularly, too. You can decide what is
meaningful for you. Daily, weekly, monthly. You have to designate who is responsible for what and what
the cleaning standard is. Further, the equipment to perform the regular cleaning has to be located close to the point of use with
a visual station. Again, cleaning is checking. Into the shine step, you could include
gage checking, loop, keeping track of the
five S activities, old communications
to be removed. If you arrange the shine in a structured way with all
the team members involved, you will be surprised about what you can get
in 1 hour of work. The standardized step where most of the five S
program starts to fail. The team has to decide who does what and when in
a very detailed way. I already told you something
in the shine step, and the tool I would like to
suggest is the RACI table. My suggestion is to make
the RACI table visible in the area so everyone can always know what is task to carry out. Further, you have to remember
that in the standardize, you have to include measuring, recording, training,
work balancing. The last step of the five S
methodology is the sustain. This step is about
participation and improvement. The goal is to make
the five S a habit. The best way is to create something like a
competition among departments with the
leadership auditing the areas and giving
awards regularly. What is normally done in some companies is a
regular walk with audits. First line supervisor
audit on a daily base, area manager on a weekly pace, Section manager on
a monthly pace, plant manager on
a quarterly base. Some companies speak about
six S. They add the safety to the five S. There are
a lot of links between the five S methodology
and the safety because with an excellent
five S implementation, you can reduce a lot of risks. You can get ergonomics and
remove unsafe conditions. I strongly suggest starting
with a five S program, in some areas, you want
to learn the methodology. The best way to learn
five S is by doing it. So Oh. Oh She She
34. 5s with safety: In this lesson, we are going to understand about
the fives system. What is a fives system? And have you heard about
the sixth S that is safety? I will cover that as well. How is it going to impact
us and our organization? We are going to understand
the entire system in detail. Though the sixths is added, we still call it
as a fives system. Let's get started. Five x is a systematic approach
to workplace organization. It represents five Japanese
words that describe the series of steps
for the workplace. It organizes the whole process. Siri that is sort, sit on that is set in order, CSO, shine, C, kets, standardize, sit sok sustain. If you add the sixth
safety, it becomes six X. This is not six sigma. The fives technique was
developed in Japan, and it was identified as
one of the methods that enable just in time importantly, Fws is never meant to
be a one time activity, but an ongoing process that must be repeated
continuously. Five Wes activities help create good working environment
through reduction of Mura that is unevenness
in the process, Muri that is overburdened, and Muda, that is waste. Five Wes began as part of the
Toyota production system, the manufacturing method
developed by the leaders at Toyota in the early
mid 20th century. This system is often called as the lean
manufacturing system. The vest aims to increase
the value given to the customer by eliminating the waste in the
production process. In simple terms, FS
helps in the workplace removing unnecessary
items that is sorting, organizing the
items efficiently, that is set in order, create a work area to
identify problems, that is shine,
standardize the process. Standardize and
develop a mechanism, a discipline to maintain what improvement you have
achieved that is sustained. This creates a foundation
for continuous improvement, zero defects, cost reduction,
and productive workplace. Let's look at each
step in detail. The first S of
fives that is ser, that is SOT, SOT involves
going through all the tools, furniture, material,
equipment in your workplace area to determine what is needed and
what can be removed. This means removing items from
the work area that aren't needed for current production
level ask the question, what is the purpose
of this item? When was it last used? How frequently is it
used? Who uses it? Does it really need
to be here right now? Items that cannot be removed
immediately can be tagged for later removal to the
red tag folding area. This would be a designated
clearly labeled space where unnecessary items are placed until further
decisions are made. This creates a clutter
free environment. As illustrated by the before and after
example on the screen, on the left side is the
cut cluttered workplace. On the right side is a
sorted, well organized area. The second S of the fives is citon set in order
or straighten. This state says a place from everything and
everything in its place. A place for everything and
everything in its place. If there is no place
for a particular item, it means that you
don't need this item. Or if there is no place
to keep the item, you need to create one
if it is important, and it is not part
of the red tag area. Arrange the items so that
the workflow is efficient. Items are easy to access, and the workplace ergonomics and safety is taken
into consideration. Now let's consider a scenario. Which items are used
most frequently. The questions which you
will ask at this stage is which items are
used most frequently? Where would be the most
logical place to keep them? Should items be grouped by type, where should heavy
and light items be placed for easy safe access? The aim is to
minimize the moments, ensure stress free,
efficient workflows. The third S of the fives
is CSO, that is sine. It is about cleaning up
the work area, sweeping, mopping, dusting,
wiping the surface, putting the tools away. A clean workplace prevents
contamination and hazards. It helps spots
abnormal conditions very quickly like the leak oil, like the oil leak
on the machine. It promotes ownership of the workplace, cleanliness
among employees. Shine also includes the
planned maintenance to prevent breakdown and
reduce the downtime. Remember, shine is not just about making the
workplace look good. It's about making
the problem visible. It is part of the
visual management tool. The fourth S is
Sitsuke standardize. Once sorted, set in order, and shine is complete, we need to standardize
the improvements to ensure that the results are
maintained and consistent. The challenge is that
without standardization, the workplace quickly reverts to the original
state of disorder. In this step, we define
regular tasks and schedules, prepare a clear
instruction and SOPs, MFIs activities routine
and systematic. We standardize to ensure
that the most efficient and the least wasteful way of working are
followed consistently. The fifth S of the
fives, it sits okay. Sustain. Sustain means
developing the discipline to maintain the fives principles and practice it
over the long term. It is often the toughest step. Many companies clean up and get organized but fail to
maintain the improvements. Sustain ensures that everyone
follows the fives rule, the managers and the
employees, everyone. Fives becomes part of the
organizational culture. Progress is continuous and
improvement is endured. The most important thing is the communication
tools like the signs, the posters, and
the meetings can help keep FIS fresh
in people's mind. It prevents backsliding. The sixth S is safety. Safety is sometimes included
as part of the sixth S. As many organizations believe
worker safety is critical, and it should be an
integral part of FIS. Safety cannot be
a separate step. It should be considered
at every stage of firs. For example, during the SOT, replace the outdated
unsafe tools. During standardized,
arrange the workstation with keeping the employee's
ergonomic in mind. Some argue that properly
implemented fives automatically
improves safety while other prefers to
emphasize safety explicitly as part of
the S. Either way, paying attention to
safety is very essential. The benefits of fives implementing FIS can achieve
the following results. It reduces costs, higher
quality products, increased productivity,
greater employee satisfaction, safer work environment,
inventory reduction, minimum breakdowns, zero
injuries, zero delays. It reduces the change over time. Let's understand fives with
the help of an example. Before fives, we had a cluttered disorganized,
inefficient workspace. After fives, organized clean, efficient workplace, which
is shown on the screen. Items are scattered and hard to find if fives is
not implemented. Items get neatly arranged and easy to access, clearly labeled. This is what is
important for you to implement fives. Thank you. I will see you in
the next video.
35. Value Stream Mapping: Introduction to value
stream mapping. Value stream mapping is
a wonderful tool given by the concepts of N. As an, you know, focuses
on reducing waste. The value stream mapping
exercise helps us to have a very clear view and
focus on eliminating waste. Value stream mapping
is process mapping, but with a few differences. It's a tool that comes with lean manufacturing and works really well in manufacturing, delivery, shipping,
factory processes, service industries,
and even in BPOs. We call them as GCC, global capability center
in today's world. But it is also helpful in
other industries like the GCC. But it's also useful in other service industries like the GCC Global
Capability Center, back offices, BPOs, business
process outsourcing. If the Six Sigma expert knows how to adopt
it to their process, hence, the knowledge
is very important. What exactly is value
stream mapping? You would have heard the
word VSM multiple times. It's a pictorial representation
with the numbers. What shows the entire value, the stream of product or ideas. When used properly, it gives Six Sigma team a
very big picture of what's exactly happening. It helps us see the process
that looks like today. It helps us imagine how
it can be improved, and it connects the
flow of material, people, and information
all in one image. One big advantage of
value stream mapping is that this exercise helps you break the
communication barriers. The symbols used
are very intuitive. So everyone on the team can easily understand where
is the waste or Moda, and where does this happen? Now, let's look at the seven flows that can help you visualize
the value stream map. These are people raw material or information parts or
the files and folders, products, equipment or softwares and tools that you're using, the information flow,
the engineering flow, the logic, the Q weighting, the concept of FIFO and FO. The value stream map helps capture information
about all these flows. But most maps focus
on raw material, parts and products unlike
other process maps, value stream map has
a unique symbols. For example, if your
process involves trucks, the map might show the
actual truck icon, along with the details like how many shipment
occurs each week. It is encouraging to see that it's very easy for us
to understand the symbols. Now remember, you don't have to use the exact
symbols every time. In industries like healthcare, say an emergency room. Other symbols might
make more sense. So think of these symbols
as the starting points, not as a strict rules. That is the foundation of VSM. In the next part, I
will explain some of the common symbols used
in value stream mapping.
36. Total Productive Maintenance: Today, we are going
to learn about total productive
maintenance, TPM. In this module, we
will learn about TPM, and we will also apply some of the O EE overall
equipment effectiveness. That we just learned
and understand how we can improve the
reliability of a tool. This model will split
into three sections. First of all, we will go
through the definitions. We will then go through a
real world comparison between two companies and the
different approach they have for managing
their maintenance. Then finally, we will
go at some good KPIs, some good metrics on how you can measure and measure the
maintenance within your company. TPM example. In order to explain TPM, I will start with comparing how two different
companies operate. At Company A, a machine has been leaking
oil for past week, and finally breaks down. The machine operator calls the maintenance team
to come and repair it. The maintenance team takes
over 2 hours to arrive as they are busy fire fighting other problems and breakdowns
within the factory. The maintenance team arrives to find that the critical
gear is broken. They search the spare
parts store and look through all the shells and
boxes of replshment gear. Only to find that
they have a lot of supply of gears of
the previous machine, but none from the newer
machine with a correct size. As the machine cannot
work without the gear, they are desperate
for the replacement, so they pay an exorberant price to source the part and have
it delivered the next day. When the spare part arrives, the maintenance team drops
whatever they were working and come running to replace the
gear as quickly as possible. The maintenance department
is commandable for the speed at which they
sourced, replace the part, and the machine is
back up and running after a total of 29
hours of downtime. The maintenance team carries
on with their next job, which is to try and fix
another breakdown that has occurred in the other
part of the factory. Now, let's go to Company P. John, an experienced operator noticed quiet but
strange grinding noise coming from the machine during his morning,
10 minutes walk. And that walk is called
as a TPM routine. He follows a set of list scanning barcode
once is complete. John has been working with the machines for the
past eight years, so he knows it inside out. As he's carrying out
his root set tine of clearing lubricants and
realigning critical parts, he notices that a gear
is starting to wear, and a surface crack has formed. Because it is a low cost
and a critical part, there are spare parts stored just inches
away from the machine. In case they need replacement. John's manager has told to
fix any problem as soon as possible before they escalate and have given them
full responsibility to look after their machine. Now, not only that, but a member from
the maintenance team recently spent a day with John, educating him about the
most common faults, and what main things to look for look out for
within the machine. John replaces the gear
and puts the damaged one in the box next
to the machine, scanning the side of
the box as he does so. He starts up the
equipment and carries out with his daily
operation as normal. Feeling pleased that his machine is still working
as it should be. The maintenance department
is notified that John scans the box with
the replacement part. So only 1 hour into his shift, a maintenance team member comes over to ask him
about what happened, and finds out that John finds out what John thought might be the
cause of the problem. The maintenance team thanks John for spotting and rectifying the problem and takes the gear back to the
maintenance department. After inspection, the
maintenance department concludes that the gear
had been worn out as expected and was scheduled
for replacement in a couple of days as part of the plan planned
maintenance order. Since the gear is critical
for the machines operator, they order a
replacement spare gates to ensure that the calculated spare part levels
are maintained. The machine downtime was zero. The cost was minimal, and they had recorded
the data from the breakdown to help continuously improve their
maintenance strategy.
37. Total Productive Maintenance Part2: To learn about total
productive maintenance, TPM. The machine downtime was zero. The cost was minimal, and they had recorded
the data from the breakdown to help continuously improve their
maintenance strategy. This example explains many of the principles and
characteristics of TPM. If we compare company
A with company B, we can see that company B works in a superior
way in every aspect. The company B proactively prevents a breakdown
from occurring as opposed to the
maintenance team running around fire fighting
breakdowns for company A. The second point is that Company B empowers
and trained John to take responsibility
for his machine and solve basic problems. Company B has zero unplanned
downtime as a result, allowing production
to run as normal. Company B didn't have to pay the premium price for the
express delivery service. But not only that, because they look after
their machines, clean them, lubricate them daily,
the breakdown is much less and last the machines last longer, saving
additional cost. Throughout this module,
we will refer back to this example to relate
to the concept of TPM in a real world situation. So before we go further, let me define TPM. As for the definition, total production
maintenance is a strategy to maximize machine output
by reducing downtime, speed loss, and defects, while stimulating, promoting
the value of safe. Organized workplace
by involving people. Remember the definition
of lead to reduce waste, increase customer
value, involve people. This definition is somewhat
replicate in TPM as a means to reduce waste
of by involving people. If we break down the
definition of TPM, it is found that it is
made up of few words. That is total, which refers to the founder of the
Kaiser Institute, which has a true
meaning of Kiser, improving every day
everywhere, with everyone. In this case, it means that with the operators, maintenance, and managers, productive refers to making improvements in a productive, cost
effective way. And finally, maintenance
refers to the aim of TPM to reduce maintenance
machine downtime and optimize
maintenance activity. TPM is as much a switching
mindset as it is a tool. The tool itself enables stability and machine
effectiveness. But as with many lean tools, if not embraced properly, it will not have a true
impact that it could have. The main purpose maximize overall
equipment effectiveness, improving reliability, reducing
overall maintenance cost, and developing continuous
improvement culture. The examples of TPM
with a car ownership. If you have ever
bought a new car, you will find that the
first couple of months, you clean it up every
weekend and are very strict about the people
not eating inside the car. After a few months, you
still look after it, but perhaps don't clean it as quite regularly
as you did earlier. After one year,
your attention to cleaning and maintenance
has faded away. This is a human nature. TPM creates an initial need to clean and maintain
the equipment, but also provides a
routine and structured way to ensure it is sustained. TPM helps to develop a collaborative continuous
improvement culture where the paradigm is broken. Instead of saying, I operate U fixed attitude to the
new attitude which says, I take responsibility to
look after my machine and ensure it is always
available when needed attitude. Notice how it isn't about
keeping the machine always running as it could
promote overproduction. The machine needs to just be available to produce
whenever it is required. The principle behind TPM is that by operators taking ownership of their machines and it becoming their job to keep it in
good working condition, the equipment will
last much longer, break down less,
and the problems will be fixed before
they escalate. Just like the five S
methodology of Lean, the sustained aspect of TPM
is extremely important. A rather strange but effective
analogy for looking at this new operator
responsibility for equipment can be seen in the
way that we care for a baby. In this example, please think of a baby
like the equipment. A parent like an operator and a doctor like a
maintenance department. Just like how the doctor diagnoses and fix the
problem with the people, whether that is can be a broken
bone or a tone ligament, maintenance members fix
problems with the machine, whether that is a broken
gear or a worn out part. As a parent, if your
baby starts to cry, your first reaction
isn't to call the doctor or visit a hospital or
seek a medical assistance. Your job would be to carry out some normal expected tasks
to checking the temperature, making sure that your child
is hydrated and comfortable. As a operator, you're
expected to carry out the autonomous maintenance
for common faces. Just like the baby crying, this may include inspecting, cleaning, or lubricating
the machine. You should only go to the doctor That is the
maintenance department, when you have a
severe problem or an unknown or uncommon problem. This is exactly what TPM is, training the parents
on how to look after their children and take accountability for
their well being. I know this is a bit
of a strange example, but I think it is memorable and helps convey the change of responsibility
that TPM provides.
38. Banana Curve of Total Productive Maintenance : Today, we are going
to learn about total productive
maintenance, TPM. Okay. That's enough talking about crime babies,
back to the course. Just like how lean is an ongoing pursuit of journey
towards 100% excellence. TPM is about sliding
the scale from 0% uptime towards 100%
uptime to an 0% downtime. This is about taking steps in the right direction
towards this stage, continuously moving
closer to it. The fact of the matter is
machines do break down, people make mistakes,
and things do go wrong. However, much you try and
prevent them from happening. The point to stretch is
that the first thing you need to do is to minimize the amount of
equipment breakdown, which is where TPM helps. Secondly, when it
does break down, make sure it's fixed as quickly as efficiently at the
lowest cost possible. The good way of demonstrating
TPM shift is by looking at the makeup of both production and
maintenance staff time, and what they do. The number used
in these examples helps demonstrate
how the shift in the mind shet of TPM equates to the change of
roles and responsibility. With a traditional
maintenance strategy, production operators
spends roughly 5% of their time with their
machine breakdown, 5% of their time
cleaning their machine, and the remaining 60% of
their time in operations. The maintenance staff
spends roughly half of their time firefighting
and correcting problems. Think back of the company A example that we
learned earlier. Now, let's see how
this changed with TPM. With TPM implemented, production operators are more involved in upkeeping
their machines. They spent around 5% of the time cleaning and
maintaining their machines, reducing the breakdown
time to 10%, and thus increasing the
operational time to 85%. Maintenance staff now
spend only 20% of their time fire
fighting and 80% of their time in plant maintenance and continuous
improvement activities. This shifts result
in increased uptime, reduced cost, and a more efficient and proactive
maintenance strategy. TPM involves making
reliability improvements and proactively
maintaining the equipment. The point to stress
here is that breakdowns have reduced from
35% to just 5%, resulting seven times
less unexpected downtime. Although the operators
are now actually spending more time in carrying out their routine basic maintenance, the overall output and uptime for their
machines is much higher. To more easily predict
and plan the output for each day without
sudden surprises and the need for overtime. TPM is built on the
FiveS culture of operators ownership and prides
in their work environment. When deployed correctly,
it instills the feeling of responsibility for equipment
in all the employees. It also makes a huge
stride in removing the barriers between
the maintenance and the operation staff, treating problem solving
as a joint effort. L et us now learn about the
bath tub reliability curve. It wouldn't have been
possible to talk about TPM without mentioning the classic bath tub reliability curve, which many engineers
are very familiar with. This curve illustrates
the typical life cycle of an equipment,
showing three phases, the infant mortality, earlier failures due to design
or manufacturing issues. These are often identified
and fixed during the initial phase of
operations. Normal life. The equipment operators reliably with occasionally arana failures that can be managed with
failure maintenance. Payout. As the equipment age, the likelihood of
failure increases due to the natural degradation. TPM focuses on minimizing failure during the
normal life phase by involving operators to
daily maintenance and fostering a culture of proactive approach
for problem solving. By doing so, TPM extends the normal life phase and
delays the wear out phase, leading to a greater reliability and efficiency in
equipment operations. The bar tub curve shows how probability of equipment
failure changes over time. To some people surprise, when equipment is new, it often has the highest
chance of failure. This is followed
by a period where the failure rate plates down. And then as the machine
begins to wear and age, the chances of failure
begins to rise. TPMs target is about
three aspects of the curve is related
to equipment failure. The burnout period. Failures are reduced during the early phase by implementing early equipment maintenance and improving the understanding
of the equipment cubes. This counter initiative idea that equipment is
more likely to fail when new is truly because the standards may not have
been fully developed. The machine may not
have been adjusted to the quality capability stage. Additionally, the six
big losses of OEE, that is overall
equipment effectiveness may not have been
quantified and addressed. The plateau period. During this period, the
failure probability is reduced through
autonomous maintenance. I will explain exactly
what is involved shortly. Autonomous maintenance
includes routine tasks carried out by the
operators, such as cleaning, inspecting, lubricating,
which helps in maintaining the equipment in its optimum
stage and prevents failure. The way outut phase.
As the equipment ages, TPM helps in managing
the wear and tear through regular
planned maintenance, addressing issues before
they lead to major failures. By focusing on these areas, TPM aims to extend the
lifespan of the equipment, reduce downtime and enhance overall
equipment effectiveness. The way outt stage
is managed through predicted and
planned maintenance, thereby minimizing
unexpected interruptions and extending the life
of the machinery. However, the world
of maintenance has changed significantly over
the past two decades. Traditionally, machines
were much simpler and designed for to last
extremely long time. Today, technology
evolves so rapidly that many machines are
replaced before even they reach
the wayout stage. Just like the mobile phones, your iPhone is
unlikely to break from excessive wear because you want to upgrade and access
the latest feature. Similarly, machines
often rented and leased with
expectation that they will be upgraded
every few years. That said, I'm not
negotiating the impact of TPM as the life's extension. TPM provides stability
and assurance that machinery is
available whenever needed. However, in terms of extending
the lifespan of equipment, while TPM does achieve it, it is not the sole
and the main focus. Out of the three
areas of the curve, the plateau phase is usually
the main focus for TPM. This is because in this
section of the curve, it represents the
largest portion of the machine's life cycle. By focusing on reducing failure during the
plateau period, TPM has the greatest impact in the overall equipment
effectiveness and minimizing downtime. To improve reliability, you want to reduce the
area under the curve, so the machine has a lower overall
probability of failure. By reducing the chance of failure throughout
the plateau phase, you can see a significant impact on the area under the curve. I have just noticed that this curve looks a
bit like a banana, though that wasn't
the intention. It might be making it
easier to remember. TPM can be implemented at different levels
of severity. Oh.
39. Total Productive Maintenance KPI: Today, we are going
to learn about total productive
maintenance, TPM. TPM can be implemented at
different levels severity. But in this module, we will
focus on two main approaches, autonomous maintenance and
maintenance is events. Let's start by explaining
what autonomous maintenance. Autonomous maintenance
is achieved when production
operators can carry out all the necessary tasks by maintaining equipments
for common fats. This includes tasks such as cleaning, inspection,
and lubrication. The key concept here is
training and empowerment. Operators are trained to
perform these tasks and are empowered to look
after their own equipment. This approach does
not aim to upskill production staff to the level
of maintenance members, but rather to ensure
that the operators are comfortable inspecting and
working with their machine. During the TPM
transformation stage, operators might
express concerns and have questions about their
new responsibilities. They may wonder
about their roles in maintaining equipments and how
it affects the daily task. Some operators might
initially say, I'm not getting paid to
do a maintenance road. It's not my responsibility. To that, I would say, firstly, they will not be taking out
on all the maintenance task. Secondly, continuous
improvement should involve everyone every day and everywhere in
the organization. As the saying goes, you can lead a
horse to the water, but you can't make a drink. You can provide an
opportunity and training. But if the operator
refuses to engage, there's little you can do. Ultimately, as discussed
in the Kaizen model, a rotten apple can
spoil the whole bunch. You don't want any rotten
apples in your organization. When the operators take
the responsibility of autonomously maintaining
their equipment, maintenance staff have
more time to focus on improvement activities and
preventing maintenance. By working closely
with operators and training them on
basic maintenance. Staff also benefit by having
more eyes and ears around. Operators can now spread
the load of inspection and notify the maintenance team when something needs
further attention. Before operators
might not have seen skilled might not have Before, operators might not have been skilled in spotting problems, might not have seen it as their responsibility
to raise issues. This is where productive part of the total productive
maintenance comes into play. By upskilling everyone at least to identify
and report falls, resources can be used
more effectively. Looking back at the
four main objectives of TPM is to maximize overall
equipment effectiveness, improve reliability,
reduce maintenance cost, and develop a continuous
improvement culture. Autonomous maintenance significantly contributes
to this core. It helps to ensure that the maintenance resources
are optimally utilized, leading to more effective
and efficient operations. Continuous improvement culture
is a key aspect of TPM. Autonomous maintenance
helps achieve all the objectives by empowering
operators to maintain their own e. This allows maintenance staff to focus
on more preventive tasks, such as helping maximize OEE
while reducing downtime. This in turn improves reliability and reduces
maintenance cost. The second approach
through KISN events. These are focused workshops with specific aim in this case. To improve OEE of equipment, if we recall the OEE module, it's a function of availability, performance, and quality. The three aspects that
TPM aims to enhance. A Kaizen event or
a problem solving workshop focuses
on improving OEE, should involve a
detailed inspection of the losses to
uncover their roots. Once these causes
have been identified, measures are taken to prevent
them from reoccurring. The problem solving
modules explain the Kaizen event methodology
in much more detail. Lastly, to promote continuous
improvement culture, problems and success
needs to be visible. Metrics need to be
measured to achieve this. Remember, you can't manage
what you can't control. You can't control what
you can't measure. In terms of metrics to measure OEE or a continuous
improvement metrics, like the number of
machine enhancement or improvements are a
good place to start. The current way of working
for many companies with functional department in
silos makes no sense, especially for the
maintenance companies. Typically, maintenance staff
performance is just based on the number of repairs or the amount of work
completed each day. The more repairs they complete, the higher their
performance is considered. This is a wrong attitude. This is problematic
because it creates an objective that directly
opposes the organizational le. Unreliable unproductive
equipment results in a poor factory performance, results in waste and an inability to stick
to the production plan. On the other hand, it
doesn't make sense to have a large proactive
maintenance team. If the equipment is
always available, and it never breakdowns. Wouldn't that suggest an unproductive
maintenance department that isn't necessarily needed? This paradox highlights that why maintenance is a
function needs to be integrated into the
continuous improvement and the manufacturing process. Responsibilities such as
process innovation, research, improvement task needs
to be coupled with metrics like availability,
performance, and quality? Organizational
performance would be the top priority
for maintenance. While is challenging to select the right KPI
for maintenance staff, focusing on the leading KPIs like the number of
improvements or enhancement, and the percentage of operators trained in an
autonomous maintenance, more effective than sorely
counting the number of repairs completed per
maintenance member per day. And that concludes this module. Total productive
maintenance summary. In this module, we
explore the TPM and its crucial role in enhancing
operational efficiency. TPM isn't just an
improvement tool. It's a significant
shift in mindset. Operators being closest
to the machines are ideally positioned to
perform autonomous maintenance. They understand their machines
better than anyone else by sensing vibrations and detecting unusual smells and sounds. The goal is to eliminate waste of time and resources spend on maintenance by involving
operators in routine upkeeping. By fostering a sense of pride and responsibility
in operators, TPM not only enhances
machine reliability, but also cultivates a culture
of continuous improvement. Thank you for your attention, and I hope you found
the information of total productive
maintenance helpful. S.
40. Six Sigma Project real life Use Case explained: Et's prepare for interview
questions on lean Six Sigma. One of the common
question that is asked is why Six Sigma important
to any organization. As an interviewing, you should not only be giving
answers to the concept, but also explaining
it with examples. So let's get started. So I will be giving
you the questions, and I will also be explaining
you the possible answers. Six Sigma is a crucial
way to any organization because it provides
data driven approach to improve processes, reduce defects, enhance quality. By identifying and
eliminating the causes of errors and minimizing the
variability in the process, Six Sigma helps organization
achieve higher efficiency, lower operational costs,
and improved satisfaction. Now, this sounds a
little technical. If I have to explain it, let's understand a scenario. In a manufacturing company, a recurrent defect in
a product line we're causing delays and
increasing production costs. By implementing Six
Sigma methodology, the team conducted a
thorough analysis using tools and methodology
called DMC define, measure, analyze,
improve and control. That identified that a particular machine
can contribute to inconsistent product quality due to unmonitored
calibration issues. After addressing this problem, the process got in control, and regular checks
helped the company see 25% reduction in
the production defects, a significant decrease in waste which saved hundreds and
thousands of dollars annually. The explanation is that this
example clearly illustrates how Six Sigma helps organization identify the
root cause of the problem, implement corrective
vaccine, sustain improvements leading to enhanced
operational efficiency, and better customer experience. The next question which is asked is where is Six Sigma used? CICEMA is used across various industries to
streamline process, improve quality,
and reduce cost. It is applied in sectors like manufacturing,
healthcare, finance, information technology or IT, as we call it, supply
chain management. These are just to name a few. The methodology helps
organizations standardize process, improve efficiency, and
enhance customer satisfaction. Let's understand this with a scenario for a
manufacturing setup. A car manufacturer experienced high rejection rate due to
defects in the assembly line. By using Six Sigma
DMAC methodology, they identified
that variability in components fitting
was the main issue. After implementing
stricter quality controls and better training
for assembly workers, the defect rates
dropped down by 30%, leading to higher
production efficiency and reduced rework costs. Let's take an example
from healthcare. A hospital faced delays in patient discharge causing bottlenecks and patient
dissatisfaction. It's really sad to know
that when the doctor has told that you can take
your family member home at 10:00 in the morning and the patient is not being
able to be discharged till five in the evening because the process has some backlogs. So a six Sigma approach
can be applied involving a detailed process mapping,
root cause analysis. The team found that
delays were often due to inefficient coordination
between departments. By restructuring discharge protocols and
enhancing communication, the hospital reduced the
discharge time by 40%, improving patient throughput and satisfaction and higher
utilization of rooms. This scenario highlights that Six Sigma can
efficiently be used in any industry where there's a need to
optimize the process, eliminate cost,
eliminate defects, and improving experience
of the customer. Whether you are improving
manufacturing process, or patient care at hospital, Six Sigma can be a
framework that can help you achieve measurable
and sustainable results. A common interview question is, what is Six Sigma? Can you explain it in a
simple term with examples? Six Sigma is the answer
to this six Sigma is a systematic data driven
methodology aimed at improving process by identifying and eliminating defects
and inefficiencies. The goal is to enhance
the quality and consistency by minimizing
variability in the process. As we all know that
the customer always experiences the variation
and never the average. So the six Sigma is
used as a set of statistical tools and
techniques to analyze the data, drive process
improvement, following a structured framework
called a DMAC define, measure, analyze,
improve and control. If it's an existing process, but if it's a new process, then we use DMA DV
that is define, measure, analyze,
design, and verify. The term sixema originated
from statistics, where it refers to a
process that produces output within six standard
deviation from the mean, which can translate to near perfection process or less than four defects
per million opportunity. To be precise, it is 3.4 defects
per million opportunity. But as we always know, we can never make a half defect. This high level process control leads to higher perfect
products and services. In a manufacturing context, a company might use Six Sigma to analyze
their production line, find that variability in machine setting leads
to product defects. By applying Six Sigma tools
like root cause analysis, cause and effect analysis,
process mapping, Gemba, they can pinpoint the
root cause and implement improvements such as better
machine calibration, operator training, leading to fewer defects, and
reduced waste. SIXIMAs principles
are applicable not only in manufacturing, but across different industries
like finance, healthcare, logistics, and the focus is helping organization
improve efficiency, cut cost, increase
customer satisfaction. A common interview question is, where did SIEMA come from? CICEMA originated from
Motorola in the mid 1980s. Actually, it is more
than two centuries old, but it became visible after Motorola brought it
into operations. The methodology was developed by the engineer Bill
Smith to address quality issues and improve the company's
production process. Um, Six Sigma originated
from Motorola in 1980s. This methodology is
actually age old. It's more than a century old, but Motorola gave
it the blind light. The methodology developed by
the engineer Bill Smith to address quality issues and improve company's
production process. Motorola aimed to find a way to minimize defect in manufacturing and delivering high quality
products consistently. The approach gained recognizon when it helped Motorla save millions of dollars by reducing defects and
optimizing processes. The Six Sigma as a term
is actually referring to a statistical
concept of achieving a process that is within six standard deviation
from the mean, meaning it produces only 3.4 defects per
million opportunities. This high level of quality
control ensures that the product and the services meet customer expectations
consistently. The methodology was later popularized by
General Electric GE, under the leadership
of Jack Welch, who adopted Six Sigma in 1990 as a king
business strategy. GE reported significant
cost savings and improved operational
efficiency through the use of Six Sigma. At Motorla the engineers notice a small inconsistency in their manufacturing process
leading to high defect rates. Customer were dissatisfied. By adopting Six
Sigma principles, they analyze data to identify a root cause of variation, implementing systematic changes. This led to a
dramatic improvement in productivity and quality, a significant reduction
in production costs. The success of Six Sigma at Motorola's fulled
multi spread adoption across industry worldwide. What is a six sigma level? A Six Sigma level
refers to the degree of quality or defect control
within a process. It measures how capable a process is for producing
defect free outputs. The term Six Sigma denotes
statistical benchmark where the process produces only 3.4 defects per
million opportunities. Also called DPMO. Achieving a six Sigma level means that the process
is highly efficient with minimal variation
and high quality output. SIGMA scale ranges from one
Sigma to six Sigma with higher level indicating
fewer defects, more reliable performance. When we say the process is
performing at one Sigma level, it's a very low performance up to six lack 90,000 defects
per million opportunities. If a process is performing at three Sigma, it is performing. It's still making an average
performance with around 66,800 defects per
million opportunities. When the process is
performing at six Sigma, we say that it's making only 3.4 defects per
million opportunities. So we can see that as the
Sigma level progresses, it becomes purely
difficult to reduce the results because we are
going towards near perfection. Achieving six Sigma
levels involves vigorous data analysis, process
improvements, strategies, continuously monitoring to
ensure that the process remains within the
control limits and specification limits. Consider a company that
manufactures smartphones. If the assembly process
is at zero Sigma, it means that it's
making a lot of defects. But if the process is
performing at CIT Sigma level, then there are 66,800 approximate defects per
million opportunities. Obviously in a manufacturing
setup like smartphone, we can definitely
aim at Six Sigma, but it's very difficult
to achieve that. The high level of quality
ensures customer satisfaction, reduced cost related
to rework and recalls, strengthening the
company's reputation for reliable products. The Six Sigma level is used for benchmarking
the process capability and is often a key metric
for quality control, operational excellence in
industries like manufacturing, health care, finance, and more. Why is six Sigma important
to any organization? Why is SIXIMA important
to any organization? SIXIMA is important to organizations because it helps
improve process quality, reduce operational cost,
enhance customer satisfaction. By using a structured
data driven approach, Six Sigma identifies
and eliminates defects, minimizes process variability, drives continuous improvements. This results in more
efficient operations. Better products and
service quality, increased profitability. SIC Sigma focuses
on reducing defects as low as 3.4 defects per
million opportunities. This high standard ensure the process is
reliable, consistent. Implementing a SIG Sigma
will lead to reduced waste. Streamlined process
reduces unnecessary steps, saving time and resources. Increased efficiency. Process improvements
boost productivity, allows for a faster
turnaround time. Customer satisfaction, high quality outputs lead to
fewer errors and complaints, improves customer
trust and loyalty. Cost saving, fewer defects, and process variation means lower rework costs and
better resource allocation. In a financial service company, a Six Sigma was used to streamline the loan
approval process, which was slow and
prone to errors. By applying the D
MAC methodology, define, measure, analyze,
improve and control, the team discovered that
the redundant variation or redundant verification
steps were causing delays. By reworking the process, they cut down the
approval time by 30%, reduced error by 20%, and significantly improved
the customer satisfaction, which led to higher rate
of repeat business. The conclusion is Six Sigma
helps organization not only justify by improving quality but also foster a culture
of continuous improvement, data driven decision making. This leads to long
term sustainability and a competitive
advantage in marketplace. Sometimes the interviewer says, give me an experience. Me how can you
impress me that you know Six Sigma very well, right? So I'm going to take a
structured approach for this. I'm going to use the
star method situation, task, action, and results. In my previous role at Six Sigma Black Bell
for over ten years, I led multiple process improvement projects
across departments. For instance, we faced a high defect rate in our
manufacturing process, which was affecting product delivery timelines
and customer satisfaction. The situation was
that the company was experiencing
defect rate of 10%, leading to increased
rework costs and customer complaints. My task was to reduce
the defect rate below 2% within six months and enhance the
process efficiency. The action that I implemented was using a D MAC methodology. In define, I clearly defined
the scope of the project, identified the key stakeholders and customer expectations. Telling that our defect
rates are at 10% and our target was to get it below
2% in the next six months. I collected data on the
current process defect rates, analyze the defect types, and measured the cycle type. We did some process
mapping exercise. We did some data driven
decision data analysis, and this helped us
in our next phase. During the analyze phase, using the root cause analysis
and fishbone diagram, we identified that
calibration issue in machinery was causing
the variability. During the improve phase, the team led by developing new standard
operating procedures, implemented some real
time monitoring tools. To sustain the improvements
in the control phase, we created a control
plan that included regular training of operators
and monthly audits. The result was that the
defect rates dropped 1.4% exceeding our goals, and we saw an annual cost
saving of 0.5 million. The customer complaints
decreased by 25%, which was a significant
improvement in customer retention. So I combine both lean and Six Sigma to eliminate non
value added activities. In supply chain process using value stream mapping
alongside the DMAC. This help in reducing
the cycle time by 20%, improve my on time
delivery rate by 30%. All these saves were approved by the production head and also by the
finance department. When I conducted the workshop
and training sessions, I certified more
than 50 employees as greenbels facilitating cross functional
projects that further embedded six Sigma practices
throughout the organization. I would also like
to highlight that while I was mainly
working in manufacturing, I also applied Lean Six Sigma in service oriented projects like streamlining customer
support workflow, where we reduce the ticket
resolution time by 15%. I would also want to
demonstrate that I have an ability to do problem solving and continuous
improvement. I had established a continuous
improvement committee that meant monthly
to identify process inefficiencies.Thise
initiatives led to several small projects that collectively saved up
to 1 million annually. I was also awarded
$1,000,000 club member. So you can see that I have experienced across
different roles as leading in six Sigma. I hope you have liked
what I have covered.
41. Hypothesis testing Part A: Within Six Sigma, one of the most commonly
used tool is to test whether a change has made a difference
in your process. That is called
hypothesis testing. Hypothesis testing is
a statistical analysis where you are checking if the result is
statistically significant. As you predicted it. You're using data
from your process to test a claim about the
population parameter. How do you conduct
hypothesis testing? Let's understand
that. You conduct hypothesis testing
because you want to make data driven decision. You want to be able to provide an evidence to
support your opinion. And typically, that opinion is that you have seen a change
within your process. But now you want to use data to support that there
actually has been a change. You're going to use
statistical significance to quantify or show whether or not that change
is significant. You're using sample
data and drawing inferences about the population based on that sample data. Now let's understand
with an example. You should use hypothesis
testing within your Six Sigma projects
to determine whether a process improvement
effort that you have made has actually reduced the proportion of
defective items, or you can use a hypothesis testing
to investigate a claim that a new accounting
software package has reduced the processing cost. Let's understand
one more example where you could use hypothesis
testing to validate whether a loan processing
time at a bank has decreased since
the introduction of an online
application process. Within six Sigma, you start with a defined phase where you
determine that issues, whatever issues are there
within your process, you set up a problem goals and establish a business case for undertaking a
six Sigma project. Then within the measure phase, you actually start identifying the key variables or factors that are
impacting your process. In the analyze phase, you look closer to that factors
to determine if there is an impact on the mean of your output or a
variation of your output. Hypothesis testing
typically comes into play in the improve
phase, sorry, in the analyze phase of the DMAc and the
improve phase again, as you implement
improvements or changes, and then you go back
to the analyze to determine if you achieve
the intended results. There are several different
types of hypothesis testing. The first type is a one sample hypothesis testing where you're looking at the
mean, that is the average. For example, if you want to examine the
difference between the mean of your process and the industry standard based
on your distribution, you want to know if there is a statistical
significance between or a statistical significant
difference between the mean of your process and that of the
industry standard. You can also do a two sample
hypothesis testing of mean, where you're
comparing the mean of one process with the mean or the average of
another process. Then there are several more
advanced statistical analysis for hypothesis testing, such as paired T test, the test for proportion, test for variance and ANOVA. That is analysis of variance. The test of variance and ANOVA are used when
you're trying to reduce the variation within your
process and to see if there is a difference in the variation of your process once you
have made the change.
42. Hypothesis testing Part B: We can also do two sample
hypothesis testing for me, where you're
comparing the mean of one process with the
mean of another process. Then there are several advanced
statistical analysis for hypothesis testing, such as Pat test, test of proportion, test
of variance and ANOVA. ANOA stands for
analysis of variance. The test of variance and ANOVA are used when
you're trying to reduce the variation within your
process and see if there is a difference in the variation of your process once you
have made a change. The objective is to
reduce the variation. In hypothesis testing, one of the first thing
that you can set up in your hypothesis is that what you are trying
to prove or disprove, you can call that as a null hypothesis or and
an alternate hypothesis. Your null hypothesis
expresses the status quo. If you think about
the null hypothesis, it assumes that any
observed differences are due to chance or
random variation. Typically with a
null hypothesis, which is your H naught, we call it as H naught represented as H followed
by a small zero, you are setting it up
for two values being equal to each other and one being less than or
equal to another, and one being greater
than or equal to another. It assumed that any
observations are the result of chance
or random variation. With any alternate hypothesis expressed as
alternate hypothesis, this is what you are
trying to test or prove. With the alternate hypothesis, you are assuming that an observed differences are real and not due to chance or
any random variation. So this is typically
where you are changed or changed
something in your process, and you're trying
to see if that now makes a difference in the average or the
mean of your output. Your alternate hypothesis
needs to be mutually exclusive from your null
hypothesis. Remember it? In other words, you want to make sure that you are testing these the test that you have to fall in one
category or the other. With your alternate hypothesis, you're testing for the opposite
of the null hypothesis. So you will be testing that
the two values are not equal or the one is greater than or less
than equal to the other. In your hypothesis test, there are two primary goals. First, you want to see if there is a difference
between the two values. The outcome of your
hypothesis test could be that you reject your null hypothesis in favor of your
alternate hypothesis, which is essentially
meaning that the results are significantly
statistically significant. The second goal would be to fail to reject
your null hypothesis. This means that you do not have enough statistical evidence and hence you fail to reject
the null hypothesis. You're stating that there is no sufficient evidence
to claim that the null hypothesis is invalid and that the alternate
hypothesis is true. For example, in a hospital, you could set up
a null hypothesis that there is no difference in the processing time based on the improvements given by
the six Sigma process, and whatever improvement
you are seeing is just a random
variation or chance. Essentially, that your
improvement efforts have not made any difference
on the actual floor. So your null hypothesis
would state. There is no change based on the process
improvement effort. The alternate
hypothesis would state. The process has
actually improved based on your six Sigma efforts. If you know that the
average waiting time at an outpatient clinic at
that hospital is 10 minutes, then you would set up your
null hypothesis as equal to 10 minutes your
alternate hypothesis will be not equal to 10 minutes. It is important to
note that you are testing to see if
there is a change, and that's why you set up a null hypothesis and an
alternate hypothesis, which is equal to and not equal to because
the change could be either a reduction
or an increase in waiting time of your patient after your six Sigma project. It's also important to note how you can
present the results, which may not sound natural
at the first level. But as we go further,
you will understand it. You state your results in
terms of null hypothesis. For example, you would state, either you reject
the null hypothesis or you fail to reject
the null hypothesis. As a six sigma professional, it's important to understand
that the difference between statistical significance and practical significance. Have you heard these words statistical significance
and practical significance? If yes, please write down in
the comment section below. So coming back, we want to understand the
difference between statistical significance and practical significance
in hypothesis testing. When you think about a
practical significance, you really need to understand the rationale
for the decisions. Depending upon
your organization, even a small value might be very meaningful
to the business. For example, if you think about the healthcare
or air safety, where the health care
or human health or safety or a catastrophic
loss could be involved, then a small change might
be very significant. So it's important to understand the test limitations and how those relate back to the rational for
decision making. In addition, you need
to understand what your business goals are
because there might be seemingly large
difference that might not be much to
some organization, but might be very important
to your organization. So you need to consider
the business goal and how these changes relates
back to what you are trying to achieve
for your organization. When you are first testing
for practical significance, there are several key questions
that you need to ask. First, you need to
understand will there be an appreciable gain or
change in your process? When you are thinking about
practical significance, it relates back to the process, to the organization itself, and how it is going to
impact the organization based on the changes you have
brought in by your project. In addition, with
hypothesis testing, you are using a sample to make an inference about a
larger population. Depending upon your results, you need to go back and
look at some things. What is that? The first one
is what's your sample size? Two, was it significant? Three, if you have a smaller sample size and you are trying to infer
about your population, then you might have to
take into account or rethink that are your results telling you the actual story? Because sometimes
it could be too expensive to have a
large population size. You also need to
think about how easy the change is to implement
from a practical standpoint, when thinking about the
level of significance, you need to assess
that impact will be on the business and how expensive or easy it
will be to implement. In addition, since you're using samples to make inferences
about your population, you need to understand whether the difference in the
sample have a real meaning. Also in terms of
your sample size, what is a representative sample? Another key question is, is there a strong financial
case for the change? Just because something
is statistically significant does not
mean that you are making any change that
is going to be cost effective or make
the business sense for your organization. Then knowing that
there is a change could also need to think about how a potentially
small value may have a significant improvement in
your process and vice versa. Now, when you establish your
practical significance, there are three key areas
that you need to consider. Number one, is your
confidence interval, and it goes back to
your business case. What do you really need to have in terms of your
confidence interval to achieve a specific level of confidence in your process
improvement effort? It's important as a
six Sigma professional that you present a
complete picture of the test results and let
the business manager decide based on the organization and the business requirement. This allows management to
consider the organization and the process knowledge to
make an educated decision. You also need to choose
the sample size carefully. A small sample size means
there is possibility that a large difference won't be detected deeming
statistically significant. If you choose a
larger sample size, you might find a very
small difference, but it could be interpreted
as statistically significant, even though it is not
practically significant. Hence, it's important
to think about an important parameter called
strength of significance. This is your P value
that is going to be compared with your Alpha value along with your
actual difference. Between what you are comparing. With hypothesis
testing, you're using a sample to infer information and the data
about your population. So it's important to understand sample estimates of
population parameter. There are several
data characteristics used within hypothesis testing, the standard deviation
and the variance. Population parameters are always represented with
the Greek letters. For mean, we use Mu. For standard deviation,
we use the Sigma sign. And for variance, we
use the Sigma squared. When you come to the
sample statistics, it is represented
by the alphabets. For mean, we represent
it as X bar. For standard deviation,
we represented it by the small S.
For the variance, we represented by S square. This is useful to understand the difference between
these values because they are used to find a single value to estimate
the population parameter. So let's explore an example using the point estimate
in our next video.
43. P Value Simplified: You have probably
heard scientists quote P value whenever they report the results from
their experiments. But what exactly is the P value? Let me clearly explain
what is P value. P value is a short form
of probability value. The P value is a number
that can be any value 0-1. But what exactly does
this number represent? The official definition of P value is quite
difficult to understand. A P value is the
probability of obtaining the observed difference or a large one in the
outcome measured, given that no difference exists between treatment
in the operation. The best way to explain what P value is is to use an example. Let us say you want to perform
an experiment to see if a new type of weight loss drug drug X
causes people to lose weight. You randomly sample a
collection of volunteers, randomly assign them into two
groups group A and group B. You give group A a placebo, which contains no
active ingredients, making them the control group. You give group B the
new drug drug X. The participants are
weighed at the start of the study and at
the end of the study. This way, you can determine
the body weight difference. At the end of the study, you find that the
group A average body weight differs is 0 kilograms, meaning they did not gain
or lose any body weight. The group B body weight
difference is a negative one kg. So on an average, they lost 1 kilogram of weight. Does this mean that
the drug works? Now let's state the
null hypothesis. To determine this, we first ask ourselves what would
happen in a world where the weight difference
in the volunteer who receive drug
X is the same as the weight difference
in those who did not receive the drug X
or received the placebo. This is where the null
hypothesis comes in. Usually, the null hypothesis states that there is no
difference between the groups. For example, our null hypothesis is that the weight difference
in those who receive drug X is the same as the
weight difference for those who did not receive the drug X or who
received the placebo. Now we can ask
questions to ourselves. If this null
hypothesis were true, what is the chance
or probability of discovery that the 1 kilogram reduction or more
in the body weight in those treated with
drug X from our sample. This probability
P value measures the strength of evidence
against the null hypothesis. You can think of this
as a court trial where the defendant is the innocent
until proven guilty. In this case, the defendant
is the null hypothesis. The smaller the P value, the stronger the evidence
against the null hypothesis. Statistical hypothesis test. Scientists use what is known as statistical hypothesis test
to determine the P value. Common examples include
Student's T test, one way ova test. Since this is the
top line overview, I will not bombard you with a
lot of statistical jargons. But instead, let's
pretend we have performed a statistical
test using our data. After giving our data to
the statistical test, we get a P value in return. Let's say, for example, the P value is 0.02. It's worth mentioning that
the P value is a fraction, but it may be easier
to convert this into a percentage to understand
the concept better. So the value of
0.02 would be 2%. In simple terms, I have
multiplied it with 100. But what does this
2% actually mean? Essentially, this means that if the null
hypothesis were true, in other words, if the two population
means were identical, then there is a 2%
chance of observing a difference larger than what
we observed in our sample. In our example, it
would translate to in a world where the
weight difference in those who receive
drug X is the same as the weight difference in those who received the placebo. There is 2% chance of
observing a weight loss of one kg or more between
our sample groups. But with respect to two
person chance means that for every 50 experiments that one in every 50 experiments
would give such a result. So what is the coincidence? How would this happen? That accounts to the 2% p value. In simple terms, 2% can be accounted for
any random noise. But what does it mean? What does this 2% of
P value account to? In simple terms, this 2% can be accounted for
any random noise. Let's elaborate this. What exactly is random noise? There is quite a few things that we can impact by P value. Some of these factors are collectively called
as random noise. One type of factor is that the contributes
to the random noise, especially in human studies. It is a coincidence
of random sampling. For example, humans who exhibit large amount of variation due to genetic or
environmental influence. If we relate this
back to our example, some humans may contain an
unknown genes that speed up their metabolism and
causes them to lose weight more than others
without those genes. When the recruiting
volunteer in our experiment, we did not perform
any DNA analysis. We randomly took
people who came as volunteers and assign
them into two groups, group A, the control group, and group B, the drug group. So there was no way of knowing who is the
carrier on the genes. Imagine a situation where
by pure coincidence, more volunteers with
high metabolism genes were placed in group B
compared to group A. This scenario would
favor group B. Ultimately, you may see that
with pure coincidence and random sampling can knock off
the effect of the P value. To summarize, P value
is a value 0-1. This P value represents the
probability of obtaining the observed difference in the outcome measured
to the sample, given there is no difference between the treatment
in the population. In other words, when the
P null hypothesis is true and there is some random noise that
can affect the P value, the common example
of random noise is the coincidence of
random sampling.
44. Hypothesis testing sample size for TOH: Sample size and its role
in the power of test. Sample size is one of the most important factor to consider when discussing
the power of a test. As a six Sigma professional, it's critical to pay
close attention to your sample size whenever you're conducting
a hypothesis test. Sample size is not only one of the most
significant factors, but it's also something that
can easily be controlled. As your sample size increases, the power of your
test also increases. However, it's equally important to calculate the
correct sample size. This decision should be made. Or if you choose too
large or a sample, you will waste a lot of
time, resources, and money. On the other hand, if your
sample size is too small, your risk of obtaining
inaccurate results increases. This goal is to balance between too many and too few samples and determine the right amount. This can be done by calculating the
appropriate sample size. As part of this calculation, you need to consider
your margin of error. This is denoted by the letter E, which is calculated using
the critical value, standard deviation
and sample size. The objective is to minimize
your margin of error. The formula can be
rearranged to solve for N, N stands for the sample size, which represents
your sample size. This is important to note that
N should always be rounded up as it ensures that you meet your desired
level of confidence. For example, if your
result is 233.1, you should crowd it out to 234. This ensures that
your confidence level accuracy is taken care of. Let's take a sample
size example, a TV viewing case study. Let's explore an example of how to calculate
the sample size. Suppose you are
conducting a study for a local cable TV provider
or an OTT platform. You want to understand
how much time families spend watching
TV each day or each week. To ensure that the study is
a representative sample, you need to calculate
the correct sample size. Here, the assumption
and the values used in the calculation
are confidence level, which we set as 95.95%. Margin of error denoted by E, let's assume 2 hours a day. Standard deviation that is
Sigma is 22 hours a week. Based on a recent survey
that we conducted. The Z value for a
two tail test at 95% confidence is 1.96 which
we got from the table. Using the sample size formula, Z value for a two tail test at 95% confidence level
it's at 1.96 using the sample size where
N is equal to Z into Sigma divided
by E whole square. So if I substitute
the value 1.96 into 22 hours divided by
two, this whole square. This is 464.833, so I would take approximately 465 families. So I always round up so you can collect data from 465 families. This means you can be 95% confident that the
sample mean always falls within 2 hours of the true population when we are getting a
weekly TV viewing. Hypothesis test consists
of five important steps. Establish your hypothesis, define your null
hypothesis, that is H nut. This assumes that there is
no difference or no change. Alternate hypothesis is
denoted by H one or H A, and it assumes that there is a real difference or an effect. This includes four
critical elements. Select the appropriate test, select the appropriate
test statistics based on your test type. Here, I want to choose
the Alpha value at 5% to ensure that my
confidence level is 95%. So I set the Alpha 0.05. Now let's determine and collect an appropriate
sample size. We conduct with an assumption
check that normality, the data is normal and there is a assumed variance in the data. So to calculate the
test statistics, we use the samples data and
compute the test statistics. Typically, we get the Z value or the T statistics based on
the test we have picked up. So if you use a Z test, then your number of samples
should be greater than 30, and you use a T test when your sample size
is less than 30. We determined a critical
value or the P value. Choose one of the two methods, a critical value method where you use a table to determine the critical value
based on the degrees of freedom and the Alpha
level that we have agreed. P value method is directly used for calculating
the P value and we compare it directly with your Alpha level.
The choice is yours. Now, don't worry, Excel
can do it all for you. Now let's interpret
your results. Using the critical value method, what we are finding is that if your test statistics fall
within the rejection zone, that is, you reject the null hypothesis because
the P value is low. If it falls outside
the rejection zone, it means it is in the
acceptance region. So we fail to reject
the null hypothesis, stating that there
is no difference. Using the P value method, we compare the P value
with the Alpha value. We reject the null hypothesis
if P is less than Alpha. If P value is
greater than Alpha, then we fail to reject
the null hypothesis. Choosing the right type of
test we have one tail test, right tail test,
and left tail test. So you have right tail test, where the null hypothesis
states that the u is less than equal to the
population average. Alternate hypothesis says that the sample mean is greater
than the population mean. We reject the null if your test statistics is greater
than the critical value. For a left tail test, null hypothesis, Mu is greater
than equal to Mu naught. Alternate hypothesis is
Mu is less than unaut. We reject the null hypothesis. If your test statistics is
less than the critical value. In both cases, you
can check whether your test statistics fall within the rejection
region or not. And that can be determined with the help of your
Alpha value also. So if it does, you reject the null, otherwise
you fail to reject it. Remember, never accept
any of the hypothesis. Two tail test. We use a test when we are testing
whether a change has happened. It could be an increase
or a decrease. Null hypothesis is null,
there is no difference. Alternate hypothesis is
there is a difference. The rejection region is existing on both the ends
of the distribution. If the test statistics fall
outside the central region, that is the acceptant region, we go ahead and reject the null. If it falls within
the acceptant region, we fail to reject the null. Let me know if you
understood the concept, are you need more
examples by giving your comments in the
discussion section below.
45. Hypothesis testing Types of error: In hypothesis testing, we are taking information
from a dataset. It's our sample data, and we are trying to make inferences about the population. But statistically,
what we are trying to do is to make decisions
based on this information. And hopefully that
decision aligns with the true state of nature. What is actually
occurring on the floor? Ideally, when hypothesis
testing is done, we are trying to get
accurate enough information that you can make
correct decisions. So if your null hypothesis
is false and you want to reject the
null hypothesis and arrive at that conclusion. In addition, if your
null hypothesis is true, you want to make the
correct decision by failing to reject
the null hypothesis. Unfortunately, that's
not always the case, and different types
of errors can occur. In this topic, we are going
to explore type one error, also called as Alpha
risk and type two error, which is called
as the beta risk. Type one error is
the Alpha risk. Type one error occurs when
the true state of nature is that your null hypothesis
is true, but you reject it. This is like a false alarm. At the risk, you are willing to take that when rejecting
the null hypothesis, even though it is actually true. Sometimes this is referred to
as producer's risk because it's the risk of assuming that the product is defective
when it is actually good. This is resulting in discarding
a perfectly good product. This is a risk the
producer takes. The common value for
the Alpha is 0.05, which means that there is a 5% chance of committing
a type one error. It's important to understand the difference between
your significance level, that is the Alpha value
and your confidence level. When plotting your values to
determine the significance, you use a critical value, and this value serves as a
threshold that separates the acceptance region from the rejection region in
your test statistics, the region of
acceptance includes the set of values for which you fail to reject
the null hypothesis. The rejection reason
includes values for which the null
hypothesis is rejected. Depending on where your
test statistically falls within either
the rejection zone or the acceptance region, you make your decisions. This is all based on your Alpha value or
significance level, which again is typically 0.05. Your confidence level is
calculated as one minus Alpha. So in this case, it's 95%. Let's take an example of
a loan processing time. This example will give
us an understanding. It involves processing
loan on time. The director of a
consumer loan department of a retail bank claims that the average loan or
processing time is 8.9 days. However, the process
improvement team believes that the processing time
has changed in the recent month due
to automation efforts. The Six Sigma team wants to
test the hypothesis with 95% confidence that the
current processing time is less than the
claimed 8.9 days. The team collects a sample of 20 loan and understands
the processing time for these 20 loans and sets up
the data to test whether the current average
processing time is now less than 8.9 days. Since they are testing
whether the value is less than or a specific number, it is called as a one
tail test for the mean. In this case, the
Alpha value is 0.05. This means whether
there is a 5% chance to conclude and reject the null hypothesis
when it is incorrect. The confidence level is one minus Alpha,
which equals 95%. This represents
the 95% confidence that the population mean falls within the
confidence interval. Now let's understand the type
two error, the beta risk. In addition to the type
one risk, Alpha risk, we also have a type two error, also called as a beta risk. The most commonly used
beta risk is set at 0.10. Beta risk refers to
the risk of failing to detect a defect or a difference
when it actually exists. For example, it is like
failing to identify a defective product during the quality inspection and then shipping it
to the consumer. That's why it is sometimes
referred to as consumer risk. It's important to
understand that alpha and beta are irreversible
and they are related. It is if you're
reducing the Alpha, you indirectly increase
the beta and vice versa. So what is power of test? Another key concept in hypothesis testing is
the power of test. The power of hypothesis
test is the probability of correctly rejecting
the null hypothesis when the null
hypothesis is false. In other words, it's the
likelihood of making the correct decision when the real effect exist or
the difference exist. The power of test is
calculated as one minus beta. The higher the power means the greater the chance of
detecting a true effect. The goal is to improve
the likelihood of finding a significance
effect when one exists. Four factors that affect
the power of test. Number one, sample size. As the sample size increases, so does the power of your test. Increasing the sample size
is the best method and the most effective way for
increasing your test power. A larger sample size gives you more reliable estimates,
reduces your uncertainty. The second is the
population differences. The greater the
difference between the two population then means there is higher
the tests power. Larger differences
are easier to detect. Smaller differences
reduces the power because there is the
distribution that may overlap. The third thing that is there
to increase the power of the test is the variability
or the standard deviation. Less variability
within your sample leads to greater power. More variability
reduces the power. And therefore, power and variability are
inversely proportional. The Alpha level, the
significance level. Alpha is the threshold for determining the
statistical significance. We compare the P value
with the Alpha value. So lowering the Alpha
means if you want to reduce it from 0.05 to 0.01, it makes it harder to
reject the null hypothesis. Thus, reducing the power, increasing the Alpha
increases the power, but it also increases
the type one error, so we need to balance it out. So even when two
distributions are identical, changing the Alpha value can change the
outcome of a test. From failing to reject the null to rejecting
the null hypothesis. That's why choosing an appropriate Alpha
value is important. To summarize, higher
your Alpha value, higher the power of your test. However, increasing
the Alpha also increases the chance of
making the type one error. Finding the right balance is the key in hypothesis testing. I will see you in
the next video.
46. Hypothesis testing Confidence: In this class, we
are going to explore an example using
point estimates. We are going to
take a sample and infer information
about the population. Let's suppose that you are
conducting a survey for 2000 people from
across the country, so you can identify whether or not they are for or against the universal
healthcare policy. Based on the 2000 people
you have surveyed, you find that 1,100 of those are supporting
the healthcare service. The population
parameter in this case, is all the people
within the country. But the sample that
you are having is only 2000 people because that
is what you have surveyed. Now, with a point estimate, then it's a proportion of people who are for the
universal health care. In this example, the
statistic that you have reached based on
the sample population is that 55% of the people
in the country are for supporting the
universal healthcare plan. So that it gives a
point estimate that 55% of the population is in the favor of the
healthcare facilities. Now, it's important to
understand that there are some weaknesses if you
use a point estimate. It's highly unlikely
that the point estimate you are
using is exactly the same as a true population
parameter because you're using an information based on your sample data to infer
about your entire population. That's why it's important to
have a range or an interval over some set of other
values that you are using. So you need to use
information so that you are able
to estimate whether or not the true
population mean and standard deviation
is most likely to fall within the interval
that you have achieved. And this interval is called
as the confidence interval. And it's very useful because they provide a better measure. For example, if you're looking at testing the
confidence interval, they give you information
on the variability of sample statistics and whether two sample originate from
the same population or whether the target falls within the natural variation
of the process. You can see it by the
image on the screen. Let's say you're
trying to figure out the likely value of the
population parameter and you want a 95% confidence interval
or 95% confidence level. You're able to determine that your confidence interval is based on the bean
and the variation from your sample statistics
and provide you with a confidence interval that
it is anything between 9.1 to 9.3 centimeters. This would contain the
actual population mean, 95% of the time. There's another example of how you could determine whether the target value falls within the natural
variation of the process. Let's say you have a
pharmaceutical company, and then you have a new
drug that you want to test. The goal of the drug is to
treat high cholesterol. You want to be able to determine whether the drug improves the cholesterol level to a healthy target
of 200 milligram. So your target
value, in this case, is 200 MG. Based on the sample data that
you are collecting, you can now set a
confidence level of 95% such that 95% of the values should fall
within the specified range. Then your confidence interval
calculates values 195-210, it would contain
95% of the values. You can now use this
information to check whether the target value falls within your confidence
interval or not. If it doesn't, then
the sample is from the population with a mean that is different from
the target value. If the target value does fall within the
confidence interval, then you can be confident
that the sample is from the population with a mean that is same as
the target value. In this case, our
target value is 200, which is within our
confidence interval. So we can conclude at 95% confidence level that the drug is decreasing
the cholesterol level. Meaning the target is
195-210 milligrams.
47. DOE Design of Experiment Part 1: I Design of experiment DOE. Let's understand DOE, one of the critical things
in a Black Belt project. It is a structured
statistical method to make systematic intentional
changes to the input variable in order to measure the impact
on the output variable. It is also taught as
a response variable. Even without a clear dependency between the input
and the output, DOE helps uncover
the relationship. They will also talk
about the interactions and the significance
of different factors. This makes DOE highly valuable
in a six Sigma project, especially because there
are often multiple factors. They are also known as Xs. That can potentially impact your process outcome.
That is the Y. Y is a function of X. Why should we use a DOE? The purpose of using a DOE
is to reduce the number of input factors which
are affecting the output. We identify the most
critical ones that are significantly
affecting our output. We try to optimize
the process by determining the ideal
settings for these factors. We validate that the
optimized setting results in a consistent
improved performance. By narrowing down
to the key factors, you can manage or experiments more cost effectively
and efficiently. Effectiveness and efficiency
is very important. Where is DOE used in a DMAC process? That
could be a question. We use DOI typically in the analyzed phase of the
DMAC where we begin to identify and verify
the cause and effect relationship
between the input and the output variables. In the improve phase, we use the same experimental
data to determine the optimal factor settings
and implement those changes. Let's understand the
mnemonic for DMAc placement. Analyze to find the factors and improve using experiments. I repeat, analyze to find the factors and
improve using experiments. Let's understand with
a real life example. Suppose you are at a Barista
at a coffee shop and you are trying to optimize the customer satisfaction level. For your output, why using the factors like
coffee temperature, which is hot or extra hot, milk, froth level low or high, serving time under 2
minutes or over 2 minutes, DOE will help you determine
which combination of these input factors that are your s that leads to the
highest satisfaction score. There are different types
of experiment within DOE. And the three main
types of experiments in design of experiments is
a screening experiment. That's the first one. It is used when you have
multiple input variables, but you don't know which are most important or which are most important
for my project. The purpose is to screen out insignificant variables and
retain the critical few. The goal being
reduce the number of factors from many to a
manageable two or three, which is greatly
influencing the output. Screening experiment
helps reduce the noise, increases the focus, and think of them as a
short list phase. The second type of experiment is called as an
optimization experiment. This is used when screening. You want to find out
two or three variables that matter the most. The purpose of this
experiment is to find the best combination of factor levels that can
yield the desired output. You adjust the
settings low, medium, and high for each of the factors to maximize or
minimize the response. The third type of
experiment is called a robot nest or a
confirmation experiment. We also call this as a confirmation test
because we are using this to confirm or validate that our new optimized
settings are stable, reliable, and it ensures that the external changes
like temperature, humidity, et cetera, don't significantly
affect your outcome. Think of it as a stress testing. Of your improved process. Types of experimental
design in DOA. There are three key types
of experimental designs. One factor at a time, that is called as O fat. It is used when we
want to change or analyze only one factor or
one variable at a time, keeping all the other
variables constant, but it's very expensive. Let's understand it with
the help of an example. You want to test that a material weight has two
levels that is high and low, so you go ahead and
design an experiment, which is simple, but it is inefficient when you have multiple factors
that are involved. Typically, what happens is there are four
experimental runs. The limitation of one
factor at a time is that it doesn't take into account the interaction effect
between the variables. Hence, we avoid it. The second is a full
factorial design. It is used when you have
multiple variables, and each of these
variables you want to test for every
possible combination. Let's understand it with
the help of an example. Three factors we have
their material weight. Can it be high or low? Material density, it
can be high or low. Temperature, it can
be high or low. So with its three factors
at two level each, we will have a total number of run that is eight runs two
to the power of three. How will we design
this experiment? We will test all
the combinations, giving a complete
interaction insight. It's more accurate, but it is costlier
and time consuming. Hence, we come to the third one, which is called a fractional
factorial design. It is used when you want
to reduce the number of experimental runs while still gaining insights
about your factors. Again, let's understand
with an example. We have the same three
factors that we used. Each of these three
factors have two levels. Instead of eight runs, we will do only four runs. Now, which four runs
you have to identify, that is called as a subset
of a full factorial design. It is cost effective, it is faster, but sometimes
we may miss some interaction. So the mnemonic for this is
OF F for you to remember, O stands for one factor only. F stands for full factorial
design, all combinations, and the second F stands for
fractional factorial design, which is a subset
of the combination. If I have to summarize
the DOE application, the simplified
roadmap of how DOE fits into six Sigma
in the defined phase, sorry, define the output of the goal and the
list of possible Xs. Screen the factors
to reduce the number of optimize the
factor experiments, validate via robustness testing,
standardize and monitor. If I have to summarize this, the experiment types is you have a screening experiments which can identify
critical few inputs. Number of factors can be many, and the purpose is to understand or analyze In the
optimized phase, we tune the settings
of key factors. Maybe we take two
or three factors. We use the optimized type of DOE during the improve phase. Robustness or a conformation
experiment is to ensure that the process
stability and repeatability. Again, we take two
to three factors, we use it during the control
phase of our project. But summarize the design
of experiment OFAT, which is simple test with
one variable at a time. Number of runs are low. Pros is it's easy to implement, but no interaction
can be detected. Full factorial design is all the combination
of all the variables. Number of runs are
too many or high. It's most accurate and detail, but it cost a lot of
money and resources. We go to the third one that is a fractional factorial design. Limited resources,
fewer combinations, number of runs are medium, cost and time efficient, but may miss certain
interaction info.
48. DOE Design of Experiment Part 2: Let us now understand
the benefits and the components of DOE
design of experiment. DOE offers several
significant advantages in the process
improvement world, and it also helps
in data analysis. So why should we use DOE Number one, it's
about efficiency. You must test you can test multiple input factors
simultaneously, making it far more efficient than testing each
factor one at a time. It's cost effective because fewer runs is equal
to reduced cost, especially when using
fractional factorial design. DOI are very insightful. By testing combinations, we understand the interaction
between variables. We understand the
relative importance of each input factor
on the output. And we can also use
DOE for creating predictive models
because DOE enables you to analyze large
dataset and build prediction models to forecast the outcome based on the inputs. Let's understand with an
example, loan processing. In this example, let's consider a bank's loan processing system. The response variable is
the loan processing speed, how quickly a bank is able to process the
loan application. The input factor
or the excess is the experience of the
loan processing staff, modes of application, is
it online or in person? Is the loan amount, whether it's a large
amount or whatever, the number of
applicants in the loan, is it a co applicant? Is it a single applicant? Using DOE, you can
change the levels of these factors
high versus low, and you can even measure it at the speed of
loan processing. And you can optimize the
process accordingly. Let's understand an
important concept called factors and levels. A factor is any input
variable into the process. A level is a value at which the factor is tested,
high versus low. What is important for us is to understand the levels
you choose should be distinct enough to detect a measurable difference in
the response variable Y. If we look at the table, if you have a two level, it means high and low settings. For example, staff experience
one year versus ten years, so it's a significant
difference. Then the assumption is that
there is a linear effect. Sometimes we might
have a three level. Which is high, medium
and low temperature, example, 100 degrees,
125 degrees, and 150 degrees centigrade. It means there is a
non linear effect. So with this, we can understand that you are free to choose the factor levels and study
the response accordingly. Why understanding the response
variable Y is important. The response variable is
a dependent variable. It means that Y is
a function of X. So it is measurable. You can measure it
quantitatively or categorically. It is sensitive to change
in the input factors, and it is aligned with your business goals or the business objective why
you are running the business. For us to understand
this more clearly, let's go back to our
loan processing example. Our processing time in minutes, defect rates in percentage, customer satisfaction
score one to five. Avoid qualitative or
subjective output unless they are converted
into measurable scales. Otherwise, you'll not be
able to get the output. Now we need to understand
the difference between controlled and
uncontrolled factors. Control factors
are those factors which you can manipulate
during experiment. Example, I can change the speed of the machine
from high to low. Uncontrolled factors are the
external conditions that cannot be changed but should be measured
and accounted for. Example, the ambient
temperature. If an uncontrolled factor
have a significant effect, they must be recorded and
included in the analysis. Now let's understand what
are treatments and runs? Each run is a unique
combination of input factor. Let's say you are studying a tensile strength of an iron
bar using three factors, material type A versus
B, processing time, 30 minutes or 60 minutes, temperature 100
degrees centigrade versus 150 degrees centigrade. So we have three factors
and two levels each. So the total number of runs in a full factorial design is two rays to three,
which is eight runs. So let's understand
the run example. As you can see in this table, we have runs where we have given the settings
which can help us design that in how we will be setting up the material
temperature and the time. Each run gives a data point for analyzing how the input combination
can affect the output. A mnemonic for this or an
acronym over here like flow can be remembered to remember the critical
components of the DOA. So the flow FLOW stands for factors which are your input variables or
independent factors. L stands for the level
high, medium low, O stands for the output
or the response variable, which is a dependent variable. And W is what you want to change in each run or a
treatment configuration. So let's do a quick recap
of what we have learned. So we have factors
and input variable. We have levels, we have
response variable, we have control factors,
uncontrolled factors. So final final note before we
jump on to the next video, is that using screening. To identify key factors, we use optimization to tune
the factor levels and we use robotness testing to
ensure that the process performs consistently
under varying condition. Design your experiment
very carefully, avoid choosing factor
levels that are too similar and you may
mask the real effect. I will see you in
the next video. And
49. DOE Design of Experiment Part 3: Let us now understand the
purpose and the process of DOI. DOI is a structured approach that helps you understand how input variables affect or impact the output variable
or the response variable. Let's explore this with the
help of a practical example. Suppose you have a
drilling process and your goal is to achieve
precision in a whole depth. There are multiple input factors like what is a drill speed, what is the type of
drill you are using, and what is a material hardness. You want to understand
how each of these factor is going
to affect your output, that is the drill hole. How DOE can help. Using DOE, you can choose
different alternatives. For example, you can
evaluate two suppliers of drill bits based on the
quality and the cost. Identify some key input factors. Determine which among
those several variables actually impact
drilling precision. We want to achieve
specific performance goal. So set your design to a
target or a specific value. Example, extract
depth tolerance, reduce the variability, reduce the fluctuation around
the target performance. Example, the depth consistency. How can I improve
the robust nest? We ensure that the process yields consistent
results over time. We want to optimize
the process setting. Find the most precise and cost effective settings
for your key factors. The six steps of a DOE process is typically conducted
in the following manner. Number one, define the goal, clearly define the objective
of the experiment. Example, minimize the
porosity in the casting. Number two, identify
the key elements, define measurable
response variable or the output variable, the Y. List all your input
factors, the X factors. Decide how you will measure both the input and the output. Choose the experimental design. Based on the number of
factors and the levels, you can decide whether
you want to go for a full factorial design or a
fractional factorial design. In a full factorial design, you will test for all
the combinations. In a fractional
factorial design, you will test for a subset. You are free to choose
between two levels versus three level design based on linearity or non linear effect. If I go back to our
casting example, three input variables
and two levels, it means I will have
eight experimental runs. So number four, run
the experiment. Perform the experimental runs by setting factor levels and
collecting the samples. This ensures
consistent measurement and process control
during each run. Step five is to analyze the data that you have achieved after
conducting this experiment, and you have to
determine what are the optimal settings for your factor by analyzing
the main effect, the interaction effect,
and the variability. We will now verify the results. That's the step
six by confirming the improvements by running the part using optimal settings. Make sure that the results match the expectations
before implementation. A detailed example
of casting process. Our goal is to minimize porocity in a metal
casting process. The elements that we are
using or the response variable Y that we want to
study is the porocity level, and it is measured using
the caliper device. The factor is X, where we are deciding
the pouring temperature, the mold hardness,
the silicon content. So I'm take them three factors. For each of these factor,
I have two levels. I decide it as high and low. So now my design is three
factors and two levels, which is equal to eight runs
in a full factorial design. Now, while running the DOE, the team runs all the eight
combinations of settings. And for each of the run, three samples are
collected and measured. In the next step, we
analyze and verify. After analyzing the data, the team identifies
the optimal level for the factors like
pouring temperature, the mold hardness, and
the silicon content. Pick those ones and
the process is run at these optimal settings to confirm that the porosity
is indeed minimized. The key learning point is that X factors are your input
variable that affect the output. Wife response is the
output being measured. Runs is a unique combination
of factor levels, and levels are the settings of each of the factor like
high and low or ABC. Verification is the
testing to confirm that the optimized settings actually deliver the desired results. We can try to
remember this using an acronym called as DDAv W D
stands for define the goal, I stands for identify the
factors and response. D stands for design
the experiment, R stands for run the trials, A, analyze the results, and
verify the improvements. So with this, I will see
you in the next video.
50. DOE Experimental Errors: When we are doing a
design of experiment, we also experience
experimental errors. One of the key challenge in a DOE is managing these
experimental errors. The variation that is
observed in the output, that is not due to change
in the input factor, but it's due to
some random things. There are two main types of experimental
errors that happen. Systematic error,
it means there are consistent repeatable
errors that occur every time an
experiment is run. They are often caused by faulty equipment or a
miscalibrated device. Measurement instrument are
not calibrated enough. Error in how the
data is handled, improper use of experiment
by the experimenter. Example, if the weighing
scale is miscalibrated and always adds 1 gram, every measurement is
bias by a same amount. And this type of error
technically introduces a bias, which is defined as bias is observed value
minus the true value. And this can be measured against a known calibrated standard. Let's understand some
examples of the bias. If your true part weight or a certified standard
is 1.346 grams, but your instrument
consistently measures is at 1.446 grams. The bias in this case
is plus 0.1 gram. Another form of bias can
arise in a clinical trial. Scientists may
unintentionally select healthier patient of one group, and sicker patient might self select into a group
which skews the result. The second type of error
is a random error. These are unpredictable
unknown variation, typically caused by external
environmental factors. The sorts of random errors include electrical noise in electronic
measurement devices, variation in ambient
temperature, humidity, vibrations
or operator fatigue. A slight fluctuation in heat can treat ovens and thermal chambers
in a very different way. These errors are
not consistent and can change from run to
run of your experiment. So the important point
to note over here is that random human
mistakes like recording a wrong number or not considering the
experimental errors, but an operator error. However, if the limitation is in the resolution of
the measuring device, this is leading to a
recurring inconsistency, then it becomes part of an
experimental limitation. Controlling an
experimental error. If it's a systematic error, you can regularly
calibrate the instruments, use an SOP that is standard
operating procedures. Train your operators thoroughly. How do we control random errors? An average multiple measurements to increase the
sample size per run, use a blocking and
randomization technique. This will help you take
care of the random errors. What about the noise factors
or the lurking variables? Uncontrollable causes of errors
fall into two categories. These are noise factors
and lurking variables. Noise factors are
those variables that cannot be controlled, but they affect your process. Let's understand a noise factor with the help of an example. When you open a pizza
oven during a baking, it releases heat and lowers
the internal temperature. This is affecting
the cooking time. Lurking variable, variables
that may not have identified, but influence your
experiment indirectly. For this, let's again, understand it with the
help of an example, a miscalibrated
scale influencing all weight measurement
without your awareness. Both the types of error
causes variation and bias and must be considered when designing
your experiments. Balanced design in DOE. A balanced design ensures that all the treatment combinations have equal number
of observation. This is critical for accurate
statistical analysis. Let's understand with
the help of an example. We have two factors
and two levels, so two rays to two,
we have four runs. So let's say we have a factor A, which should be at
either high or low, and we have a factor B, which should again be
at a high under low. Here, each factor is tested twice at low and twice at high. This is a balanced and a
full factorial design. An unbalanced design
is a design where not all the combinations are
studied or they are not tested. Some combinations are repeated more often than the others. The problem over here, let's understand with the
help of an example, the run. Look at the table on the slide, it very clearly says that
it's not a balanced design. This setup does not cover
all the combinations and it introduces bias and
it weakens the conclusion. It limits the ability to
analyze interaction effect. Randomization in DOE
is very important. Randomization is a process of shuffling the order
of the experiment. This shuffling of the experiment runs is to minimize the
effect of the bias, and there is an effect on the learning curve the
environmental drift. The purpose here
is to ensure that the treatment combinations are performed in a random sequence. This is improving the
statistical validity. So when randomization
is happening, the process set up allows
flexible sequencing. And when the learning curves or the time based variables are there like the machine
warming and cooling, it can influence the result. When you do not randomize and there are some
physical constraint, make it impractical
for you to randomize, like adjusting the casting
furnace temperature up and down repeatedly
can be a painful task. So let's understand
randomization with help of an example, a federal health study scenario. We are evaluating two
types of cancers. We are evaluating two types
of cancer awareness ad, a message type A and
a message type B, two levels of
screening resolution, 1,200 pixels and 2,400 pixels. Two level of exposure duration, 2 minutes versus 5 minutes. Now we have three
factors and two levels. Totally eight total runs. The standard order
is not randomized, is run one run two run
three till run eight. This introduces the risk
of machine warming up or people looking at
the same ad repeatedly. Or it can create operator error, and hence it's important for
us to randomize the order. So when we use random
number generation and then shuffle the
runs, for example, the first run can be run six, the second run can be run three, the third run can be
run one, and so on. This helps the distributed
bias and the noise evenly. So to summarize the
different types of errors that occur in DOEs, systematic error, which is caused by the faulty experiment. The control method is to
calibrate SOP, and so on. Random errors are
environmental changes, noise factors are uncontrolled
but known variables, lurking variables are
unknown influenza. The key takeaway is that a systematic error is still
predictable and correctable. A random error is unpredictable
but must be averaged. A balanced design is equal to equal representation
of factor levels. Randomization is
equal to the spread out by as making
conclusion more reliable. Always assess the feasibility when applying randomization, especially in complex
physical setups. With this, I hope
you got a clarity of DUI experiments and I will
see you in the next video.
51. Pearsons Corelation simplified: Yes. Directional and non
directional hypothesis. With correlation analysis
can be tested for directional or non directional
correlation hypothesis. What do we mean by non directional
correlation hypothesis? You are only interested
to know whether there is a relationship or a correlation
between two variables. For example, whether there is a correlation between
age and salary, but you are not interested in the direction of
the relationship. When you are doing a directional
correlation hypothesis, you are also interested in the direction of
the correlation, whether there is a positive or a negative correlation
between the variables. Your alternate hypothesis
is then example, age is positively
influence on salary. What you have to pay attention to is in the case
of a directional hypothesis, you will go with the
bottom of the example. So you will go telling that, is there a positive
influence or not. So normally we say there is no correlation and
there is a correlation. But here we'll say there
is no correlation, and the alternate
hypothesis we say that there is a positive
influence on the salad. Right? So now let's
go to the next part. That is Pearson's
correlation analysis. With a Pearson's
correlation analysis, you get a statement about the linear correlation between the metric scaled variables. The respective covariance is
used for the calculation. The covariance gives
a positive value if there is a
positive correlation between the variables
and a negative value if there is a negative correlation
between the variables. The covariance is calculated
as CV or covariance of X comma is calculated using the formula given on the
screen. Do not worry. We don't have to
calculate it manually. We have systems and tools which can do
that analysis for us. However, the covariance is
not standardized and can assume values between
plus and minus infinity. This makes it
difficult to compare the strength of the relationship
between the variables. For this reason, the
correlation coefficient is also a product
movement correlation. And this is calculated
in a different way. The correlation coefficient is obtained by normalizing
the covariance. For this normalization,
the variance of the two variable is
calculated as given below. The Pearson's
correlation coefficient can now take values of minus one to plus one and can
be interpreted as follows. The value of minus one
means that there is an entirely positive
linear relationship, and the more the minus one indicate that there's an entirely negative
relationship exist. The more and the less. With the value of zero, there is no linear relationship. The variable does not
correlate with each other. Correlation of plus one will
look something like this, which is only
possible in theory. Correlation of 0.7 plus will look something like this where it's going in a positive side, and most of the dots are
closer to the regression line. A correlation of plus
three will be scattered, but it's going in a
positive direction. When you do a correlation you
have a correlation of -0.7, they are all scattered
moving downward. So as the value of X increases, the value of Y is reducing. And most of the dots are scattered around the
regression wide. We get the correlation value
of zero in multiple ways. Either the dots are
completely scattered, or you might get some
perfect lines like this or like this, which again, would not be, which
means that you need to take some other analysis for interpreting the variables. Now, finally, the strength of the relationship
can be interpreted, and this can be illustrated
by the following table. The strength of the correlation. If it is 0-0 0.1, there
is no correlation. If it is 0.1 to 0.3, there is a little correlation, 0.3 to 0.5 medium correlation, 0.50 0.7, sorry,
high correlation, and 0.7 to one is a
very high correlation. To check in advance whether a
linear relationship exists, scatter plot should
be considered. This way, the
respective relationship between the variables can
also be checked visually. The person's correlation
is only useful and purposeful if linear
relationships are present. Pearson's correlation
has certain assumptions which you should be
keeping in mind. For Persona, whenever
you're using this, the variables must be
normally distributed, and there must be a linear relationship between
the variables. The normal distribution
can be tested either analytically or graphically
using the QQ plot, which I will teach
you how to do. Whether the variables have
a linear correlation, it is best checked
with a scatterplot. If the conditions are not met, then Spearman's
correlation can be used. So I hope you are
clear till here, and let's continue our learning. So if my data is not
normally distributed, it's a non parametric
data or non normal data. Then for correlation test, I will be using Spearman's
rank correlation test. The Spearman's
correlation analysis is used to calculate the relationship
between two variables. That can be ordinal
level of measurements. Spearman's rank correlation is a non paramatic equivalent of Pearson's
correlation analysis. This procedure is therefore used when the prerequisite for the relationship
correlation analysis is equal to a parametric
procedure is not met. When there is non metric
data, no metric data, and non normal distribution,
in this context, we often use Spearman's
correlation or Spearman's row. If the Spearman's rank
correlation is meant. The question is that, can it be treated by
rank correlation or similar to those of Pearson's
correlation coefficient? Is there a correlation between
two variables or features? For example, is there
a correlation between age and the religiousness
in the France population? Here, the level of religiousness can be
a different number.
52. Correlation Simplified: Welcome to the next lesson of our analyzed phase in the DeMac life cycle of
a Len Six Sigma project. Sometimes we get into
a situation where we would want to do a
correlation analysis. And hence, I thought today, I should be diving
you deep into what is correlation what
is the difference between correlation
and casuality? How do I interpret correlation when I look
at the scatter plot? What significance level
can I set up when I'm doing my hypothesis testing,
Pearson's correlation, Spearman correlation, point
B serial correlation, and how to do these calculations online using some of
the available tools. So let's get started. So what exactly is
correlation analysis? Correlation analysis is a
statistical technique that gives you information about the relationship
between the variables. Correlation analysis can be calculated to investigate the
relationship of variables, how strong the correlation is determined by the
correlation coefficient, which is represented by
the number letter R, which varies from
minus one to plus one. Correlation analysis can
thus be used to make statements about the strength and the direction
of the correlation. Example, you want to find out whether there is a correlation
between the age at which a child speaks his first sentence and
later success at school. Then you can use
correlation analysis. Now, whenever we work with correlation, there
is a challenge. Sometimes we get confused with
things that are a problem. Like, if the
correlation analysis shows that two characteristics are related to one another, it can substantially
be checked whether one variable can be used to
predict the other variable. If the correlation mentioned, the example is
confirmed, for example, it can be checked whether
the school success can be predicted by the age at which the child speaks
its first sentence. It means that there is a
linear regression equation. I have a separate video on explaining what is
a linear regression. But beware, correlation need not have a causal relationship. It means any correlation that can be discovered
should therefore be investigated by the subject matter
expert more closely, but never interpreted
immediately in terms of content, even if it is very obvious. Let's see some of the examples of correlation and causalty. If the correlation between the sales figure and
the price is analyzed, there is a strong
correlation identified. It would be logical
to assume that the sales figure are influenced by the price
and not the vice versa. So the price does not happen
the other way around. This assumption can, however, by no means be proven on the basis of a
correlation analysis. Furthermore, it can happen
that the correlation between the variable X and Y is
generated by the variable Z. Hence, we will be covering that in partial correlation
in more detail. However, depending upon
which variable can be used, you may be able to speak a causal relationship
right from the start. Let's look at an example. If there is a correlation
between the age and the salary, it is clear that age
influences salary, not the other way around. Salary does not
influence the age. So just because my
age is increasing or just because I
have a higher salary does not mean that
I will be old. Otherwise, everyone
would want to earn as little
salary as possible. That's just laugh.
Interpret the correlation. With the help of
correlation analysis, two statements can be made. One about the direction of the correlation and one
about the strength. Of the linear relationship of the two metrics are the
ordinary scale variables. The direction indicates whether the correlation is
positive or negative, whether the strength
dictates whether the correlation between the
variable is strong or weak. So when I say there is a positive correlation exists between it we are trying to say that the larger values of the
variable X are accompanied by the larger values of variable Y and not
the other way around. Height and shoe size, for example, are
correlated positively. The correlation
coefficient lies 0-1. That is, it's a positive value. Negative correlation
on the other hand exists if a larger value of variable X is accompanied by the smaller value of variable
Y and the other way around. The product price and the sales quantity usually
have a negative correlation. The more expensive a product is, the smaller the sales quantity. In this case, the
correlation coefficient will be between
minus one and zero, assuming it's a negative value. So it results in a negative one. How do I determine the
strength of the correlation? With regards to the strength of the correlation coefficient R, the following table
can act like a guide. If your value is
between 0.0 to 0.1, then we can clearly say
there is no correlation. If the value is
between 0.1 to 0.3, we say there is a little
or a minor correlation or a correlation. If the value is between 0.3
to 0.5, medium correlation. If the value is
between 0.5 to 0.7, we say there's a
high correlation or a strong correlation, or if the value is
between 0.7 to one, we say it's a very
high correlation. At the end of this module, I'll show you how to calculate
the correlation question directly on an online
too. So let's go further. When you do it online, you will get one
of the tools that we use to analyze
the correlation is a scatter plot because
both the X and the Y are variable data type or metric data type,
as you call it. Just as important as considering the correlation coefficient
is in graphical way, we can use a scatterplot. So as the age, the X axis will always have the input variable and
the Y axis will have the output variable
because Y is equal to function of X. I can see that
as my age is increasing, my salary is increasing. The scatter plot gives you a rough estimate the
correlation whether there is a correlation and whether
there's a linear or a non linear correlation and whether there
are any outliers. When we do correlation, we might also want to do
our hypothesis testing, test the correlation
for significance. If there is a correlation
in the sample, it is still necessary to
test whether there is enough evidence that
the correlation also exist in the population. Thus, the question arises when the correlation coefficient is considered statistically
significant. Right? The significance of correlation coefficient
can be tested using the T test as a rule. It is tested whether the
correlation coefficient is significantly
different from zero. That is, a linear
dependence is tested. In this case, the null
hypothesis is that there is no correlation between the
variables under study. In contrast, the
alternate hypothesis assumes that there
is a correlation. As with any other
hypothesis testing, the significance level
is first set at 5%. The Alpha value is set at 5%. It means I should have 95% confidence in the
analysis that I'm doing. If the calculated P
value is below 5%, the null hypothesis is rejected, and the alternate
hypothesis applies. If the P value is below 5%, it assumes that there is a relationship
between X and the Y. The T test formula that we
use for hypothesis testing is R into under root of N minus two divided by under root
of one minus R squared. W N is the sample size, R R is the determined
correlation of the sample, and the corresponding
P value can be easily calculated in the
correlation calculator.
53. Lean Six Sigma Summary Part 1: Pase overview, foundation and principle of six Sigma and Ian. In this course, we
will be introducing you to the foundation
and principle of six Sigma and lien
along with the values these quality and productivity
improvement methodologies bring to the organization. We also cover the key lean
tools commonly used in Six Sigma projects and
explain what is N, what is six Sigma, and what is the integrated or a unified approach
called Lean Six Sigma. So what exactly is six Sigma? It all begin with an
important metric defects per million opportunity, DPMO. DPMO is a scientific measure used to calculate the number of potential mistakes or defects in the delivery of
products and services. This DPMO metric sits within the broader
organizational system where six Sigma operates. The core competence of this system is the
improvement methodology. Which is known as
the DMAC cycle, which stands for define, measure, analyze,
improve, and control. So together, the metric and the DMAC process forms the foundation of
Six Sigma projects. This enables the organization to systematically improve the
business process of all time. Why do we need six Sigma? There are several compelling
reasons to adopt. The PruATrack record
of Six Sigma, which was popularized
by Motorola and General Electrics
in 1980s and 1990s. Moreover, the COR techniques
have been used to nearly a century and
have been adopted by leading organization
across the industry. The powerful tool kit, Six Sigma offers a
structured methodology and a robot set of tools. It identifies and
eliminates defects, reducing variation,
and improving quality. Though it was born
in manufacturing, the Six Sigma has been successfully applied in a
wide range of industry, including financial
services, government, non profit organizations,
healthcare, logistics, and many more. Currently, BPOs use Six Sigma from the last three decades. The key benefits of Six Sigma
is that all organizations, whether they are for
profit or non profit, everybody faces the challenge of controlling operating cost. While ensuring sustainable
revenue growth, Six Sigma addresses these
challenges very well. So what are the ways
in which Six Sigma helps you manage
this cost reduction? Six Sigma has a proven method called cost of poor quality, famously known as
COPQ which is used. Six SIGMA emphasizes on
the voice of customer VOC, to understand the customer
satisfaction level. We are aiming to
reduce variation, eliminate inefficiency, and improve the
process reliability. Six Sigma helps in profitability
and long term value. By improving quality
and efficiency, Six Sigma contributes to
increased net profits to the organization and improve the value system in
the organization. It builds a culture of
continuous improvement. So when we focus on
continuous improvement, Six Sigma ensures that
the organization remains customer focused while enhancing
internal capabilities, process controls and
process performances.
54. Lean Six Sigma Summary Part 2: All right. Pace over. Foundation and principle of six Sigma and Lian
In this course, we will be introducing you the foundation and principle
of six Sigma and IN along with the values these quality and productivity
improvement methodologies bring to the organization. We also cover the key lean
tools commonly used in Six Sigma projects and
explain what is N, what is six Sigma, and what is the integrated or a unified approach
called Lean Six Sigma. So what exactly is six Sigma? It all begin with an
important metric defects per million opportunity. DPMO. DPMO is a scientific
measure used to calculate the number of
potential mistakes or defects in the delivery
of products and services. This DPMO metric sits within the broader
organizational system where Six Sigma operates. The core competence of this system is the
improvement methodology, which is known as
the DMAC cycle, which stands for define, measure, analyze,
improve, and control. So together, the metric and the DMAC process forms the foundation of
Six Sigma projects. This enables the organization to systematically improve the
business process of all time. Why do we need six Sigma? There are several compelling
reasons to adopt. The fluid track
record of Six Sigma, which was popularized
by Motorola and General Electrics
in 1980s and 1990s. Moreover, the core
techniques have been used to nearly a century and have been adopted by leading organization
across the industry. The powerful tool kit, Six Sigma offers a
structured methodology and a robot set of tools. It identifies and
eliminates defects, reducing variation,
and improving quality. Though it was born
in manufacturing, the six Sigma has been successfully applied in a
wide range of industry, including financial
services, government, non profit organizations,
healthcare, logistics, and many more. BPOs use Six Sigma from
the last three decades. The key benefits of Six Sigma
is that all organizations, whether they are for
profit or non profit, everybody faces the challenge of controlling operating cost. While ensuring sustainable
revenue growth, Six Sigma addresses these
challenges very well. So what are the ways
in which Six Sigma helps you manage this
cost production? Six Sigma has a proven method called cost of poor quality, famously known as
COPQ which is used. Six Sigma emphasizes on
the voice of customer BOC, to understand the customer
satisfaction level. We are aiming to
reduce variation, eliminate inefficiency, and improve the
process reliability. Six Sigma helps in profitability
and long term value. By improving quality
and efficiency, Six Sigma contributes to
increased net profits to the organization and improve the value system in
the organization. It builds a culture of
continuous improvement. So when we focus on
continuous improvement, Six Sigma ensures that
the organization remains customer focused while enhancing
internal capabilities. Process controls and
process performances. You need to understand
that DPMO and process performance are very important when it comes
to Six Sigma projects. The concepts like DPMO is the fundamental
basis for six Sigma. Once you can measure
and capture the data, you can then check the
chart performances, compare the actual results
to a defined goal or mean. Evaluate deviation from
statistical tools. By applying standard deviation, we access how process performs relative to its
specification limit. Anything outside the upper and the lower specification
limit is considered as out of spec and meets and it fails to meet
the customer expectation. A performance chart
typically includes a mean, which is the goal line, a range measured as standard
deviation or Sigma levels. While many organizations set the tolerance of limit as
plus or minus three Sigma, Six Sigma aims for plus
or minus six Sigma, resulting in only 3.4 defects
per million opportunities. This means there is a
dramatic improvement in the process quality. If our process is operating
at Six Sigma quality level, we are setting a much higher
standard for quality. And operating performance
at this level is 99.997% defect free. Meaning there may be only three defects per
million opportunities. Why am I not saying 3.4? Some of you might wonder
because the textbook definition says 3.4 defects per
million opportunity. Understand, can you
have a 0.4 defects? No. So we are expecting
the defects to be around three for 1
million opportunities. What's the difference between an operation where
deliverables are expected to fall within three Sigma versus the operation
that works at six Sigma? Do all the operations have
to work at that level? The answer is no.
The main difference which can surprise
you when you look at the numbers is that
if an operation limits the defects at just 3.4
per million opportunities, the improvements are dramatic. At three Sigma, it
could mean losing 20,000 emails on the
mailbox per hour. But if the same department
is operating at six Sigma, it can be only seven pieces
of mail getting lost. Now consider 5,000
incorrect surgeries per week versus just two
surgeries with six Sigma. Our electricity
outage, and many more. Understand a process
which involves humans should be operating at Six
Sigma or beyond six Sigma. For other departments, you can work with two Sigma and
three Sigma as well. Think about landing airplanes. Thankfully, airlines
today mostly operates at six Sigma
level of quantity. Why that plane crash are rare? It is because it is not
operating at three Sigma, if it is operating at three Sigma or anything
less than six Sigma. Six Sigma is highly
adaptable and is commitment. Any organization, regardless of the size and the industry, work towards the
level of performance. From manufacturing
to consulting, from profit to nonprofit, government agency
and private sector. Everyone can apply Six Sigma. The great example of six
Sigma application is customer facing organizations
such as call centers. We also call them
as contact centers. But there is no restriction. Any organization can adopt
and benefit from six Sigma. We will explore the timelines of six Sigma and understand
the evolution over time. The importance of
Six Sigma concept is the standard deviation. This was defined
in 19th century. Going back to the late 1800s, we find that Frederick Taylor, the rise of Taylorism. His economic theory
and divisions of labor laid the groundwork for many principles we
associate with Six Sigma. In 19 twentyes, pionists
like Henry Ford, Walter Shuart, George
Box contributed to what would be evolving into today's modern six
Sigma practices. In 1940s, the US
government began publishing quality control in
the military manufacturing. This led to the rise of
statistical process control, SPC, as we call it, thanks to this part of early teaching by the statistician
Walter Stuart. After the World War two, figures like doctor
Edward Deming, doctor Joseph Juran, worked
extensively in Japan. Their contribution
helped transform quality into a competitive advantage
for Japanese industry. It was during this time that the Japanese Union
scientists and engineers, JUSE Jews was established, laying the foundation of many practices will later
adopt as Six Sigma.
55. LSS Quiz Questions 1 to 10: Let's now practice
questions to understand the lean Six Sigma concepts more in detail and practically.
Are you ready? Quarter, T test. You are about to run a T test on shield thickness from two
suppliers when you determine that the data from
one group is not normally distributed and
cannot be transformed. Your next step would be to A, use the Shapiro Wilk test. B, proceed with the T test. C, use a non parametric test. B, discontinue the analysis. Correct answer. C, use
a non parametric test. Explanation. A T test assumes that the data in both groups
are normally distributed. If the data is not normal and cannot be transformed to
approximate normality, then the T test is
not appropriate. In such cases, a non
parametric test like the Mann Whitney U test is used because it does not
assume normal distribution. A manufacturing test process has three parallel machines
performing exactly the same test. The data from this test process can be assumed to be
normally distributed, and the variances within
each machine are the same. To understand if there is a significant statistical
difference in the average test, value between machines,
what test should be used. A Kruskal Wallace, B chi square, C ANOVA, D, Bartlett or levine. Correct answer C
ANOVA. Explanation. ANOVA. Analysis of variance is used when comparing the
means of three or more groups. Since there are
three machines and the assumptions of normality
and equal variances hold, ANOVA is the correct
statistical test. Third quarter, discrete test. Which of the following is
a commonly used test that examines the association between multiple
discrete variables? A, Crystal Wallace test, B, Shapiro Wilk test, C, students T test, D,
Chi square test. Correct answer. D,
Chi square test. Explanation. The chi square test is specifically designed for
categorical discrete data. It assesses whether
observed frequencies and categories differ significantly from
expected frequencies under the assumption
of independence. Fourth quarter
statistical hypothesis. An engineer is trying to increase a product
characteristic, mean from the current
production value of 850 to about 855. The standard deviation
of the current process and the proposed process
are assumed to be the same. If the current value is 7.7, the engineer wants to verify that the average difference of his new process compared
to the old process is statistically significant
and greater than five. What are the correct
statistical hypothesis for this engineering problem? A, null hypothesis nu
minus, old equals five. Alternate hypothesis, Nu
minus, old greater than five. B, null hypothesis, nu
minus, old equals five. Alternate hypothesis, nu minus, old does not equal five C. Null hypothesis equals 85o. Alternate hypothesis,
greater than 85o, D. Null hypothesis,
Sigma u equals 7.7. Alternate hypothesis,
Sigma Nu greater than 7.7. Correct answer A minus
null hypothesis, new minus old equals five, alternate hypothesis, new
minus old greater than five. Explanation. This is a one
sided hypothesis test where the engineer wants to
prove that the new mean is greater than the old
by more than five units. Hence, the null hypothesis
sets the difference at five and the alternative
hypothesis tests if it's greater than five. Statistical procedures. Which of the
following statistical procedures is appropriate. When there is one continuous
input variable selex and one continuous
output variable Y, A T test, B, chi square test, C, one way ANOVA, deep correlation. Correct answer D correlation. Explanation. Correlation
analysis examines the strength and direction of the
linear relationship between two
continuous variables. It is the appropriate
method to study the relationship between a
continuous input and output. Ir qu six, statistical analysis. In statistical analysis,
the beta risk beta is A, the probability of rejecting the null hypothesis
when it is true. B, always equal to 0.10 C, driven by the cost of sampling. D, the probability of failing to reject the null hypothesis
when it is false. Correct answer D. The probability of
failing to reject the null hypothesis
when it is false. Explanation. This is
known as Type two error. Failing to detect a real effect or difference when
one actually exists. Beta risk beta quantifies
this probability. E qu seven, saving and loans. Sigma saving and loans processes loans and leases
from around the world. The CEO wants to know if the current cycle
time for processing is less than 9.5
days on average. To test the claim that the average cycle time
is less than 9.5 days, use A, one sample T test. B, two sample T test. C, one way ANOVA. D, Chi square test of means. Correct answer is a
one sample T test. Explanation. This
situation involves comparing a sample mean to
a known target, 9.5 days. Since only one sample
is being tested and the population standard
deviation is unknown, a one sample T test
is appropriate. Our eight, two
different samples. Two different
samples were pulled randomly from the
same population. One sample has
size N equals ten, and the other N equals 100. A two sided confidence interval, for the mean was calculated
separately for each. How will the intervals compare? A, the confidence interval for N equals ten
will be smaller. B, the confidence interval for N equals ten will be larger. C, the confidence intervals
will be the same for both. N equals ten and N equals 100. B, there is not enough information
given. Correct answer. B, the confidence interval for N equals ten will be larger. Explanation. Smaller
samples yield less precise estimates
of the population mean resulting in wider
confidence intervals. Therefore, N equals ten has a larger confidence
interval than N equals 100. Ir qu nine, screening
experiment. The purpose of a screening
experiment using DOE is to A, optimize the response by determining the best levels
for the input factors. B, separate the vital few
from the trivial many. C, compare various
levels for one factors. D, find a set of
levels for the inputs that produce a robust
product. Correct answer. B, separate the vital few
from the trivial many. Explanation. Screening
experiments are typically used in early stages
to identify key factors, vital few that significantly
affect the outcome, distinguishing them from less impactful
factors, trivial many. O qu ten. Based on the DOE results illustrated
in the image below, and considering the
hierarchy of effects, what term should be left in the model use Alpha equals 0.10. A, temperature, time,
temp into pressure. B, temperature, time, pressure,
temperature into pressure. C, time, temperature
plus pressure. D, temperature, time. Correct answer B, temperature, time, pressure,
temperature into pressure. Explanation. Following
the hierarchy of effects principle, lower order terms main
effects should be retained if higher order interactions
involving them are significant at
Alpha equals 0.10, keeping the main effects and the significant two
factor interaction is appropriate. Great progress. I will see you in next video
with more questions. Oh
56. Quiz Questions 11 to 20: Qu 11, model DOE steps. What is the correct order of
steps in a DOE experiment? Design the experiment and
plan data collection. Run the experiment
and collect data, state the problem or objective, analyze the results,
interpret the results. Correct answer B
three, one, two, four, five, three, state
the problem or objective. One, design the experiment
and plan data collection. Two, run the experiment
and collect data. Four, analyze the results. Five, interpret the results. Explanation, this
sequence reflects the logical flow of a
well designed experiment. You first define the objective, then design the experiment, followed by executing it, and finally analyzing and
interpreting the results. Our 12, model design selection, which of the following
experimental designs? Could you run if you
had five factors and a maximum of 21
experimental units? A, two to the power of six minus two with
six centerpoins. B, two to the power of five
with three center points. C, two to the power of five minus one with
five centerpoints. D two to the power of four
with five center points. Correct answer C two to the power of five minus one
with five center points. Explanation. A full
factorial with five factors, two to the power of five equals 32 runs exceeds the run budget. E, a fractional
factorial design, two to the power of five equals 16 runs plus five center
points totals 21 runs, fitting within constraints while still providing
valuable insight. Ir qu 13, experiments
objectives. The four basic objectives
for experiments which are vital to Lean's Sigma
include screening, optimization, and which
of the following. A, result comparison, B,
comparison, robust design. C, reduced variance
parsimony, D, comparison result. Correct answer B. Comparison, robust design. Explanation. Beyond
screening and optimization, DOE is also used for
comparing alternatives and developing robust designs that perform well under variability. These are fundamental
DOE goals in six Sigma. Qu 14, experimental error. Experimental error
includes the dash in the experiment caused by uncontrolled and unknown
nuisance factors. This is also called dash
fill both the blanks, A, noise pure error. B, noise signal. C, signal noise. D, pure error signal. Correct answer. A
noisPued error. Explanation. Noise refers to random variation
in an experiment from sources you can't control. Pure error arises from
repeated measurements under identical conditions and reflects inherent
process variability. Q 15 process factors. A black belt candidate
has found that three process factors
significantly affect process throughput
and variability. He suspects that the
influence of one of the factors is non linear
over the range of throughput. Which of the following
tools should be used to determine the
relationship between the factors and responses? A, screening
factorial experiment. B, response surface
method, RSM experiment. C, multiple linear
regression analysis. D, two level full
factorial experiment. Correct answer B, response surface
method, RSM experiment. Explanation. RSM is
specifically designed to model curvature and non
linear relationships between factors and responses, making it the correct tool when linear models are insufficient. Ir qu 16, RSM experiment
full factorial. A full factorial experiment
is characterized by all of the following
properties except A, all factors in the
experiment are controlled. B, higher level interaction
effects cannot be estimated. C, all combinations of the levels of the factors
are run in the experiment. The two factor two
level design is the simplest full
factorial experiment. Correct answer. B, higher
level interaction effects cannot be estimated.
Explanation. This is false. A full factorial can estimate
higher order interactions. That's what distinguishes it
from fractional factorials. So this statement
is the exception. Ir qu 17, factorial experiment. A black belt has run a
full factorial experiment. The image below illustrates an interaction plot
from the analysis. What level of interaction is there between
these two factors? A, no interaction. B, strong interaction, C, weak interaction, D,
three way interaction. Correct answer B,
strong interaction. Explanation. If the lines in an interaction plot are non
parallel and intersect, it indicates a
strong interaction between the two factors. The presence and pattern of
crossover indicate the level. Ir qu 18, strong interaction. A black belt runs
an experiment on two different shifts comparing two different methods
for data entry. The black belt wants to learn if there is a difference
between methods. She suspects that shifts have
an impact on the response. However, she is not interested
in optimizing the shift. What experimental
design technique should the black belt use? A, repeats only. B, replication and repeats. C, run in standard order. D, blocking. Correct answer, D blocking. Explanation. Blocking is used to control nuisance variables, EG, shift that may
affect the response, but are not of primary interest. It helps isolate the effect
of the factor under study. Ir 19, AB interaction. What is the AB
interaction effect? A four, b2c minus two, D, six. Correct answer is
two explanation. Although the specific
numerical logic depends on the image
mentioned, not shown here, typically the AB
interaction effect is calculated using
contrast between combinations of factor levels. The answer provided is two, indicating a measurable
interaction. Quarter, A, B, interaction. Given the image below, what is the main
effect of factor A, A minus three, B, three, C minus six, D, six, Correct answer,
A is minus three. Explanation. Man effect equals average response when A is high, average response when A
is low, divided by two. A negative value
like minus three indicates that
increasing factor A decreases the response. The exact calculation depends on the data provided
in the image, which is not included here, but the answer reflects
a negative main effect.
57. Submit your project LSS: Now that we have completed
the entire learning, I request you to go down to the project and resource section to ensure that you
complete the project. Let's kin share, the
project instructions are very clearly given in the
project and resource section. Now that you have successfully
completed the training on Lean Six Sigma made simple
for giving you results, it's important for you
to complete the project. The project instructions
are given in the project and resource
section where we have given you an idea about what type of project
you can complete. I'm going to walk you
through a demo to give you a basic understanding of how you can submit a project. So applying the Lean Six
Sigma basic tools to uncover eliminate small
inefficiencies in your daily routine or workplace. Choose your processes. Pick up any daily task
or simple work process. Example, morning coffee routine, email or filing documents. I have cleaned up my desk, and I'm going to submit
that as my project. You're also free to use CIPOCOFlow charts to
submit as your project. The objective is to spot the waste or variation
in the process, apply some basic lean principle to identify the inefficiencies. You need to propose a quick
fix of how you are making the change or reducing or
eliminating the waste. We need to measure the impact
before and after metric, or you can show a
picture which can show the results.
How do you upload? You can upload a single
image containing the original process map or the process that
you have improved. Please write a description that what exactly have you done. I have also given you Skillshare project template
for you to have an idea. I'm going to upload my project by clicking
on Submit Project. So it is very clearly showing me the image of
before and after. You can submit the image
has been uploaded. I'm also free to
attach an image over here so that it can clearly show the picture
of before versus after. That's all by
clicking on publish, I'm ensuring that my project is published and it's visible. This helps me in
submitting the project, and my project will
be visible over here. Thank you once again
for the time that you have taken in
investing in yourself. You have completed an
important milestone, and I hope you will feel
proud of your progress. Remember, Six Sigma isn't just about tools and techniques. It is about thinking
differently, solving problems, and feeling better, and it's about leading change
wherever you are. So you keep applying
what you have learned, submit your class project, and don't hesitate
to reach out if you need guidance
or want feedback. I will see you in
the next class. Up till then, keep
learning, keep improving, and most importantly, keep believing in your
potential. Thank you.
58. Conclusion-Big Thank you: I would like to thank you
for completing this course. It's important because
whatever we start, we need to complete. Now it's time for you
to submit the project. This helps me understand that you have understood
the concepts, the lessons, and the course
that I have covered. If you have any queries, please do not forget to ask questions in the
discussion section below. When you submit your project, I will definitely
review your project and give you a personalized
comment on your project. People on Skillshare
will like your project, which will help you
motivate you to complete more courses on Skillshare
and submit the project, which also means that you are applying the knowledge
that you have not. I would like to give
a short brief that whom were you listening
to all this way? So my name is Dan Wilson v, and you can find me on LinkedIn. You can just go to
Google and type them. Birdsong, V, D, B and E space, some way, S and G hedge. The first link that
comes up is mine. I'm not dead on any of this social media
platform as of now. But I do run my
Telegram channel, which is 66 Sigma, it is the alphabet six. Sax underscored the number
six, underscore sigma. You can get connected
with me with one of these tools or platforms. Or you can also write an
email to me on my Gmail ID. As you can see from
the photographs, I am then worst with conducting
trainings in-person. And most of my
trainings are gamified. There is a lot of activities
that are done during the training program which helps the participants learn
the concept in Boston. These are some of
the snippets of the different exercises that I do during my training program. And you can see that these corporate training
program participants are very energetic and
connector in the training. These are highly interactive. Gamification is the
key theme for me. And the concept is
learned when you play. They are very effective for you to learn any complex
topic as well. I also do online
training program and I have covered more than
thousand hours of training, not thousand man hours. I will have trained more than thousand people for more than thousand hours
in the last two years. So I can easily see that I have done 1 million man
hours of training. These are the some
of the snippets of the various culprits
were involved with me in the different Zoom sessions or WebEx sessions that I have conducted in
the last two years. All these online trainings have mainly started
post the pandemic. I have quickly adopted to the
new things that are bare, as you would have seen
in my training program. You would have enjoyed by
learning with the concepts. So I thank you very
much for completing it. Once again, trust you have learned a lot and hope your
concepts are more clear. Now. You can the new watching my other programs which are
available on Skillshare. And this will help you understand different
topics that are present. I also run vice Wednesday. This is a session which I do every Wednesday
at 08:30 P.M. IST. The cost of this training
for this workshop or this whenever they meet
up is 1,000 USD. But if you are part of
the Skillshare community, you can join this for free. Just go to Telegram and
search for six alphabet six MSIX underscores the number
six and Sigma SIGMOD. I will just go back to
that slide to show you what those Sigma training
is. Just a second. Yes. So this is my
Telegram Channel 66 Sigma. So I would want you to
participate if you are interested in being part of the continuous
learning journey. Because continuous
improvement comes and starts with our
personal session. See you in the next class. Thank you and do share
your reviews and feedback for how did
this training Thank you.
 Dimple Sanghvi, AI Consultant, Lean Six Sigma Master Black Belt