The Pulse of a Restless Planet
Fifty years of global earthquakes, read as the vital signs of a planet that never
rests. Somewhere on Earth, roughly every five hours, the ground breaks hard enough to register a
magnitude 5 earthquake. Most happen under the sea and are never felt, but seismometers record them all.

The U.S. Geological Survey publishes that record as an open catalogue.
This report treats the catalogue as a vital sign and asks one central question:
What can the spatial and temporal patterns of earthquakes reveal about the
restless nature of our planet?
Data collection method:
The USGS API returns at most 20,000 events per request, so the M5+ catalogue was requested in eleven windows (five years each, one year for 2025) and stitched together. The total, 85,022,
matches the API’s own count endpoint for the full period.
The Global Pulse
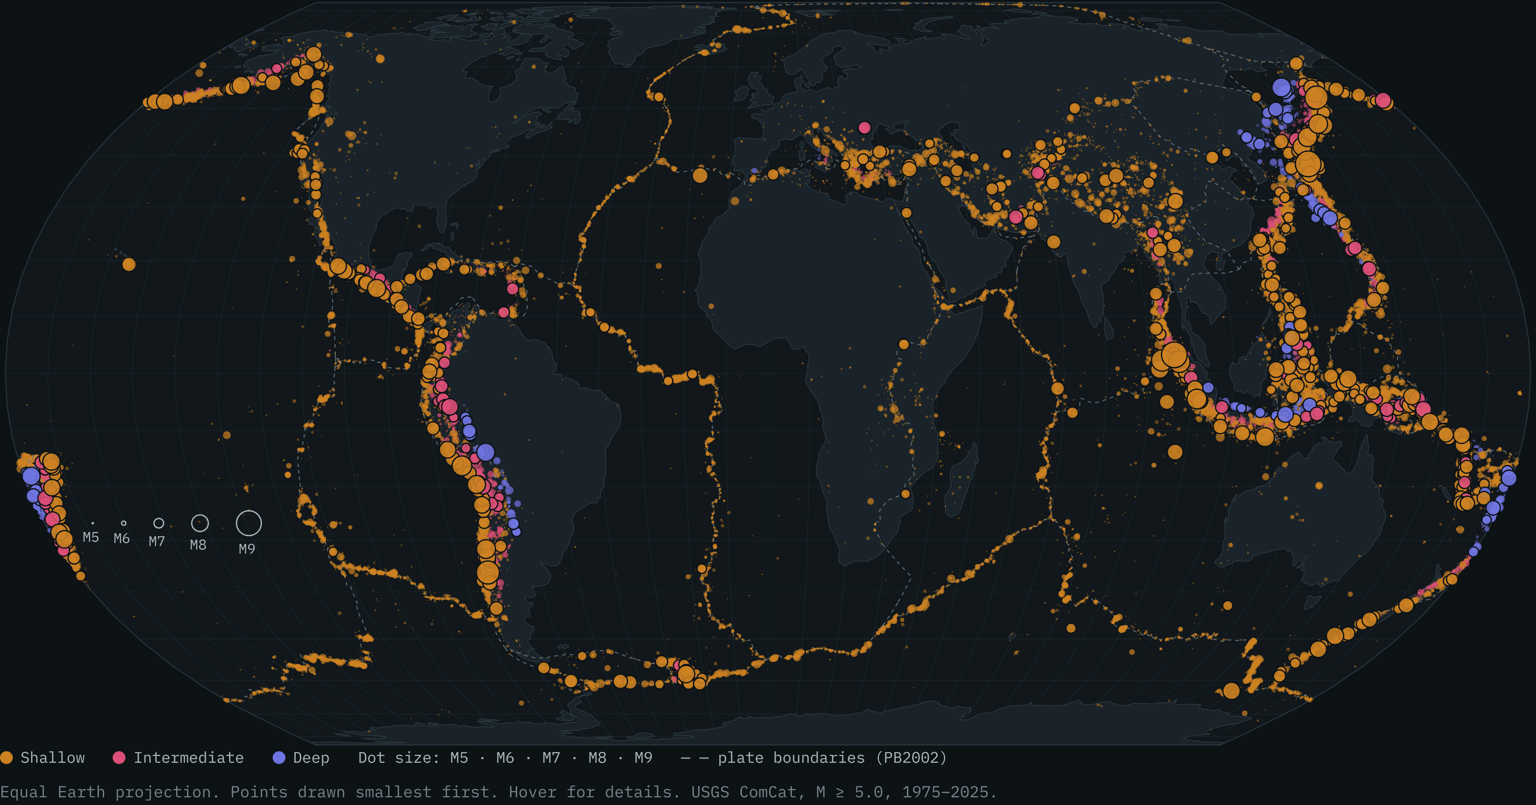
Plotted without emphasis, 85,022 epicentres trace the rims of the Pacific, the arc of Indonesia,
the spine of the Andes and the thin seams of the mid-ocean ridges. 67.9% lie within 100 km of
a mapped plate boundary and 86.2% within 200 km. Colour shows focal depth (amber shallow,
rose intermediate, violet deep); dot size grows with magnitude. Deep earthquakes cluster beneath the western Pacific and South America, where old ocean floor sinks into the mantle.
Seismic Hotspots
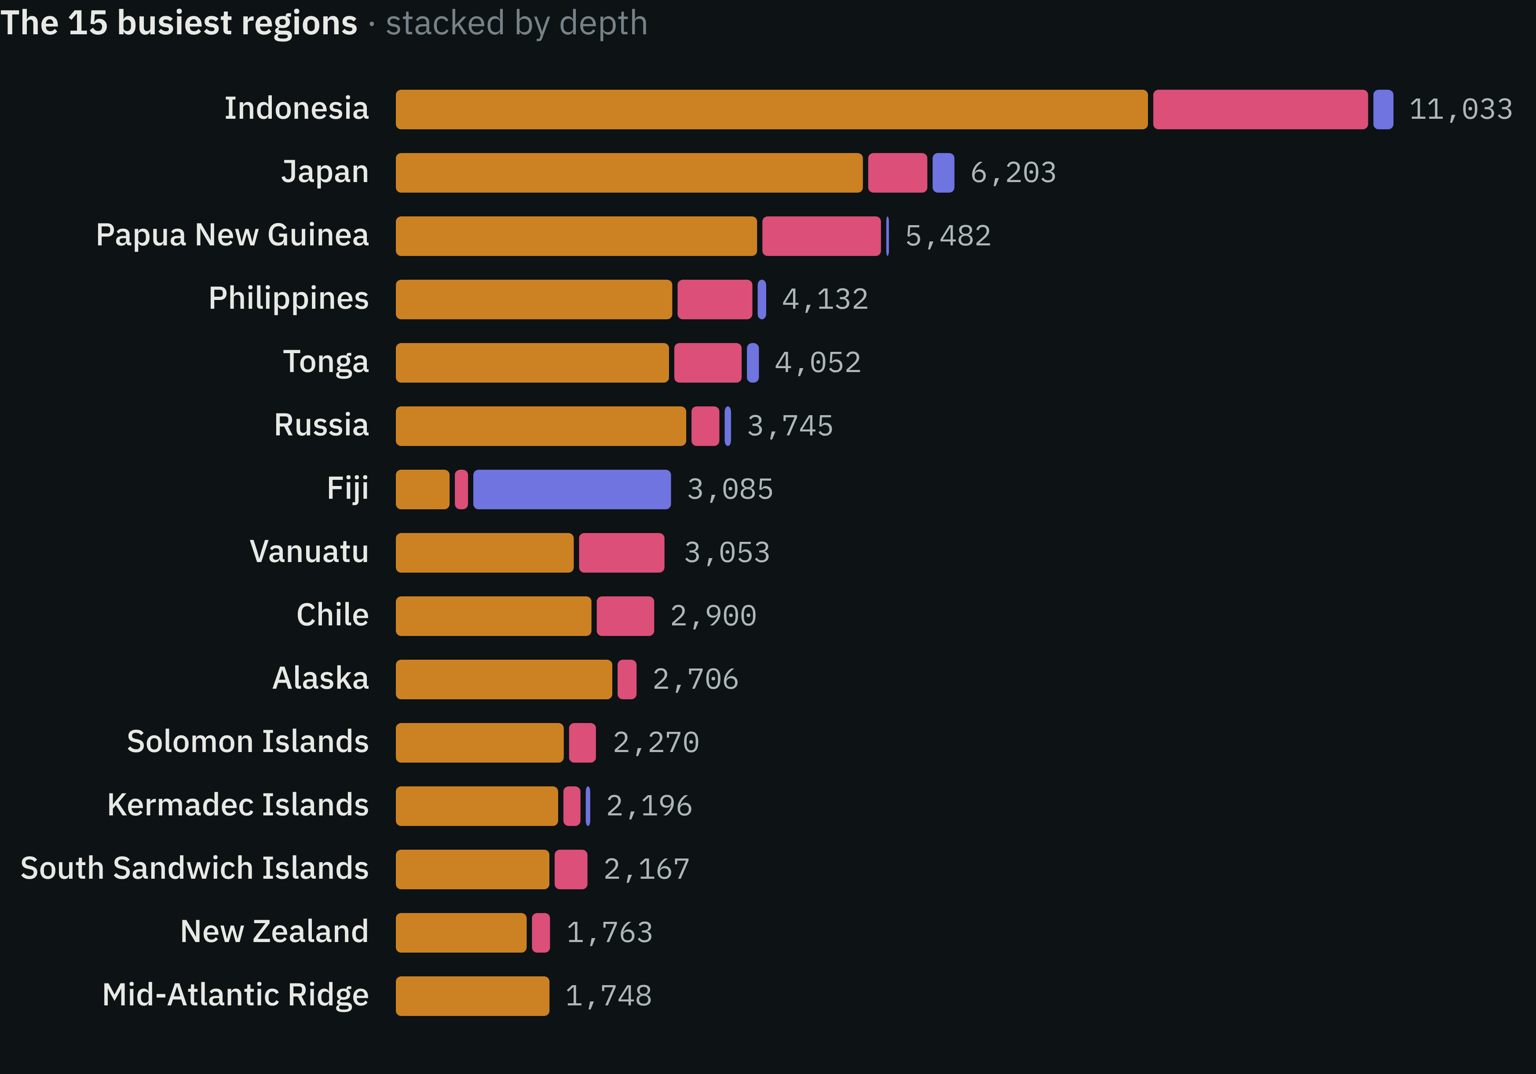
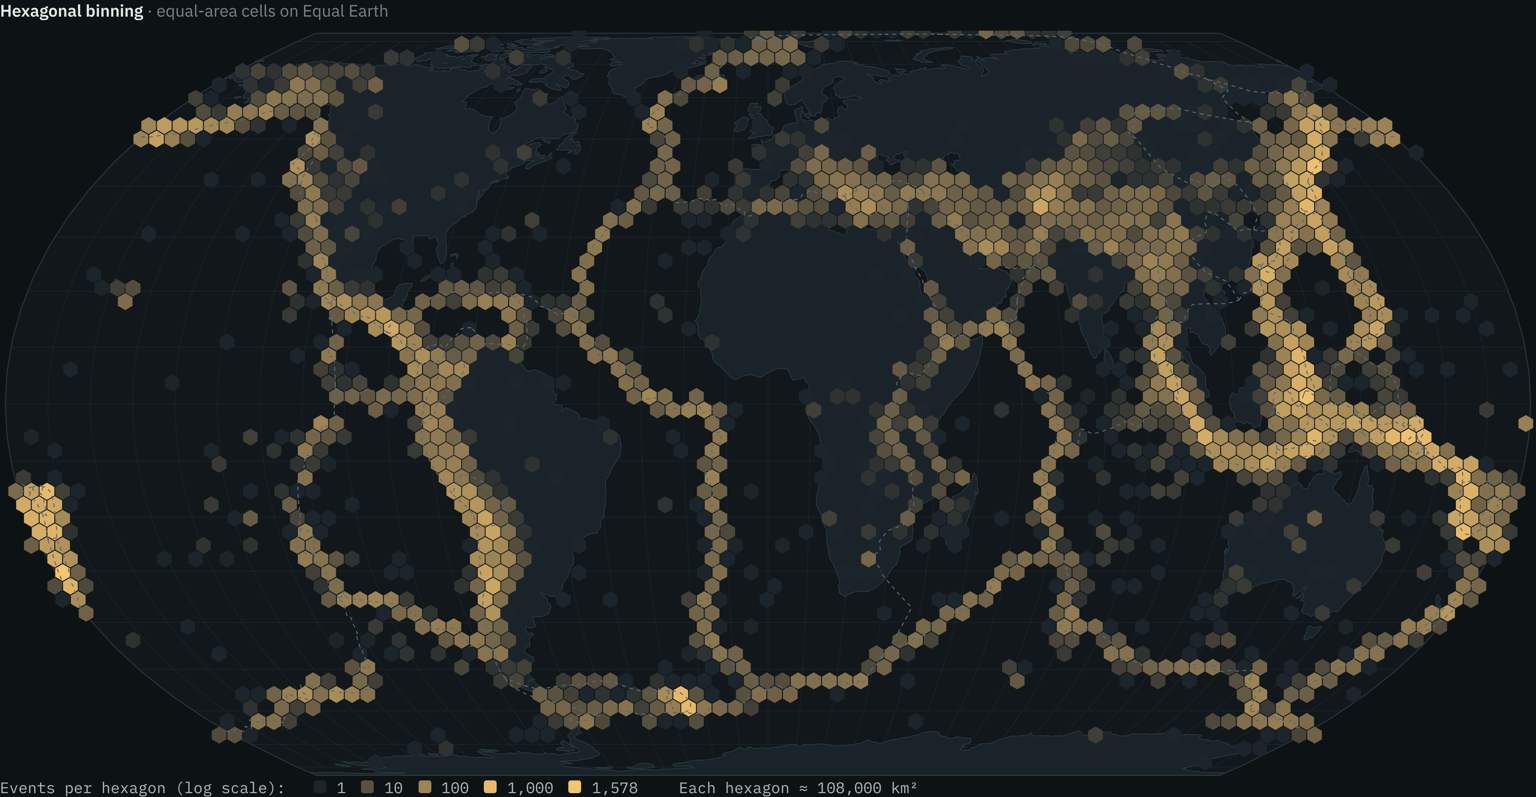
Each hexagon covers the same area on the Equal Earth projection, so colour compares densities fairly. Indonesia alone recorded 11,033 M5+ events in fifty years; the ten busiest regions hold 54.6% of the catalogue. Mid-ocean ridges are long but quiet, with 6.4% of events.
The brightest cells sit on subduction zones of the western Pacific, Japan, Chile and Kamchatka.
Where Plates Meet
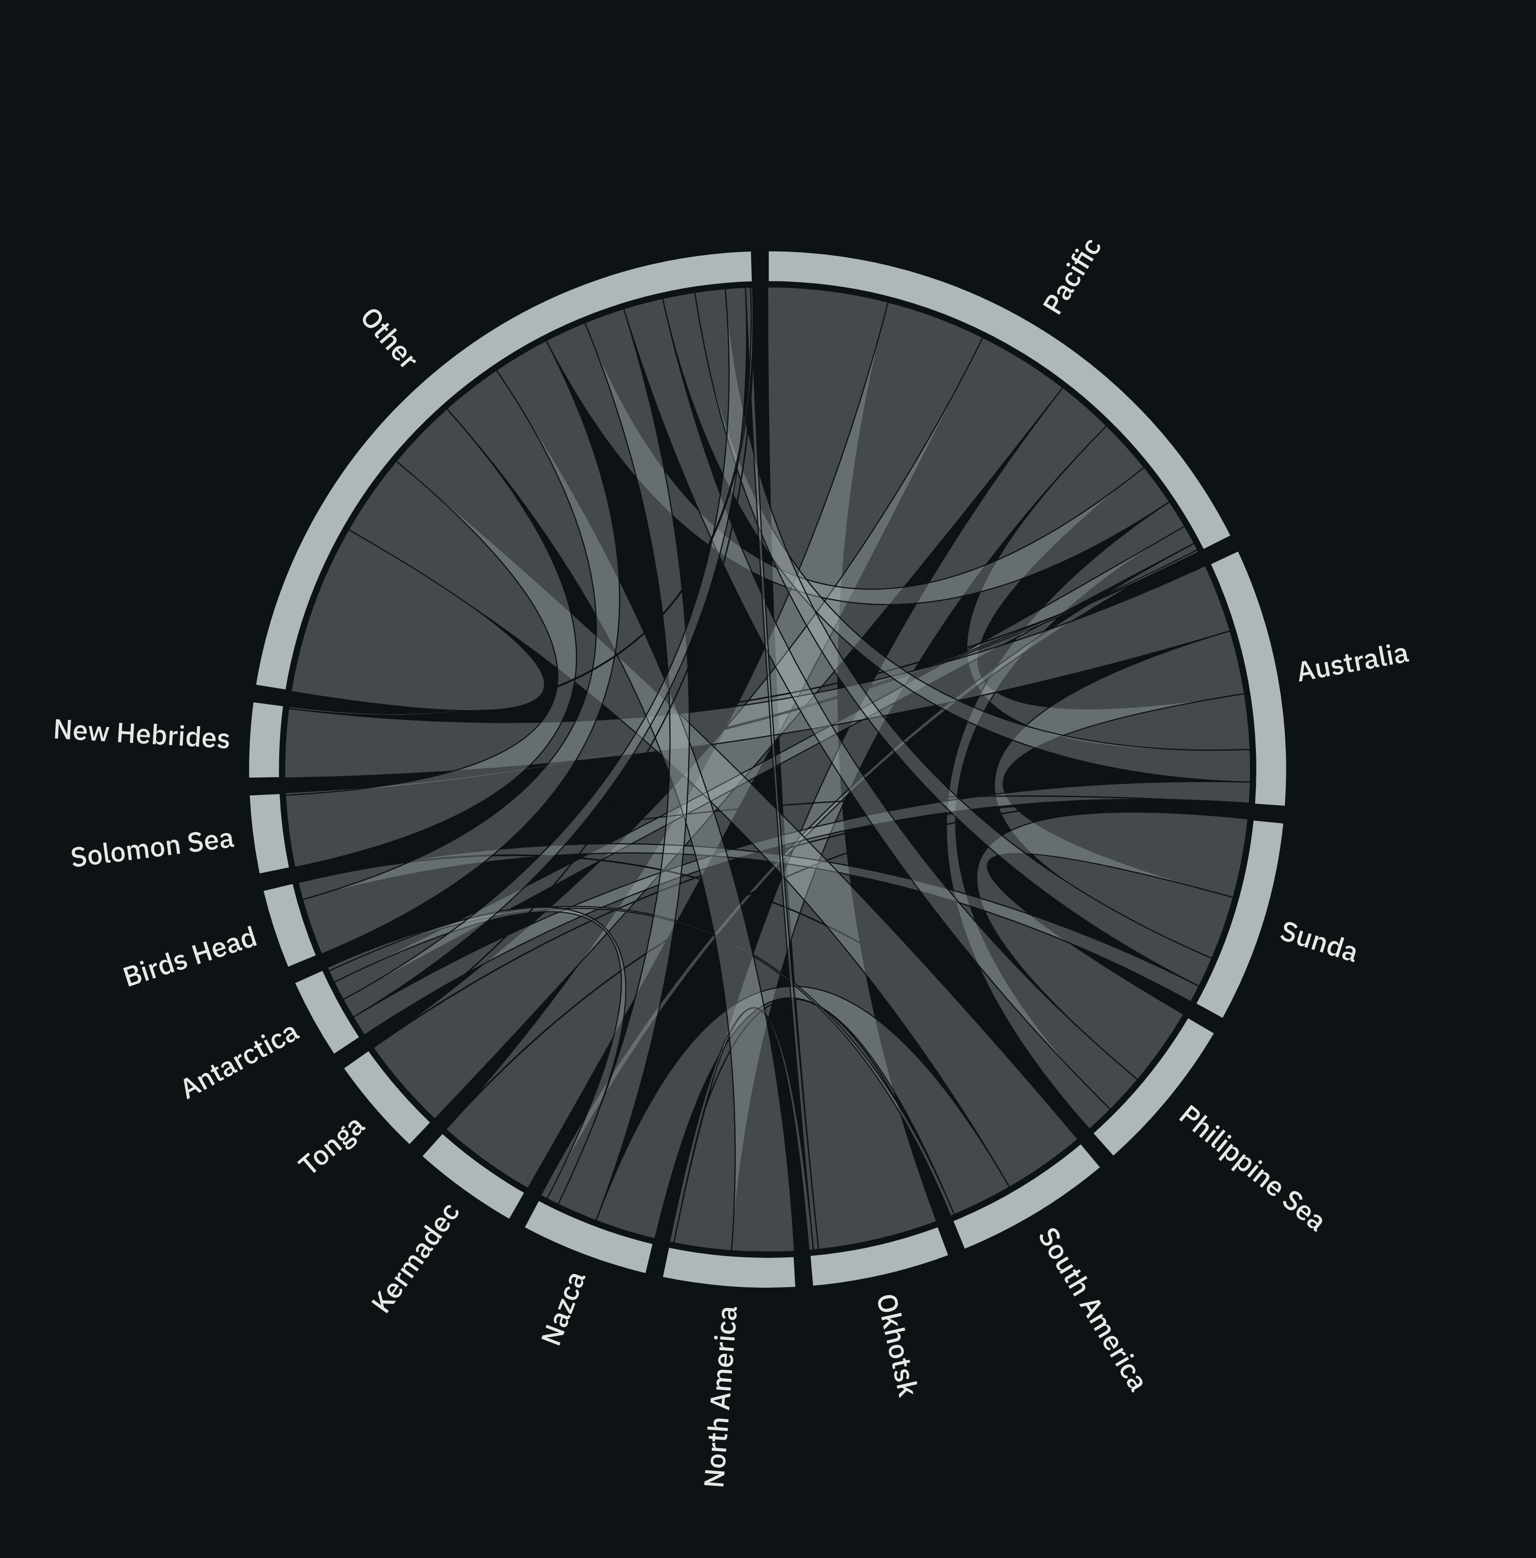
Chord diagram of plate contacts weighted by M5+ earthquakes. A network. Every earthquake linked to a PB2002 boundary step joins the two plates on either side, giving 80,653 earthquake–contact links among 52 plates.
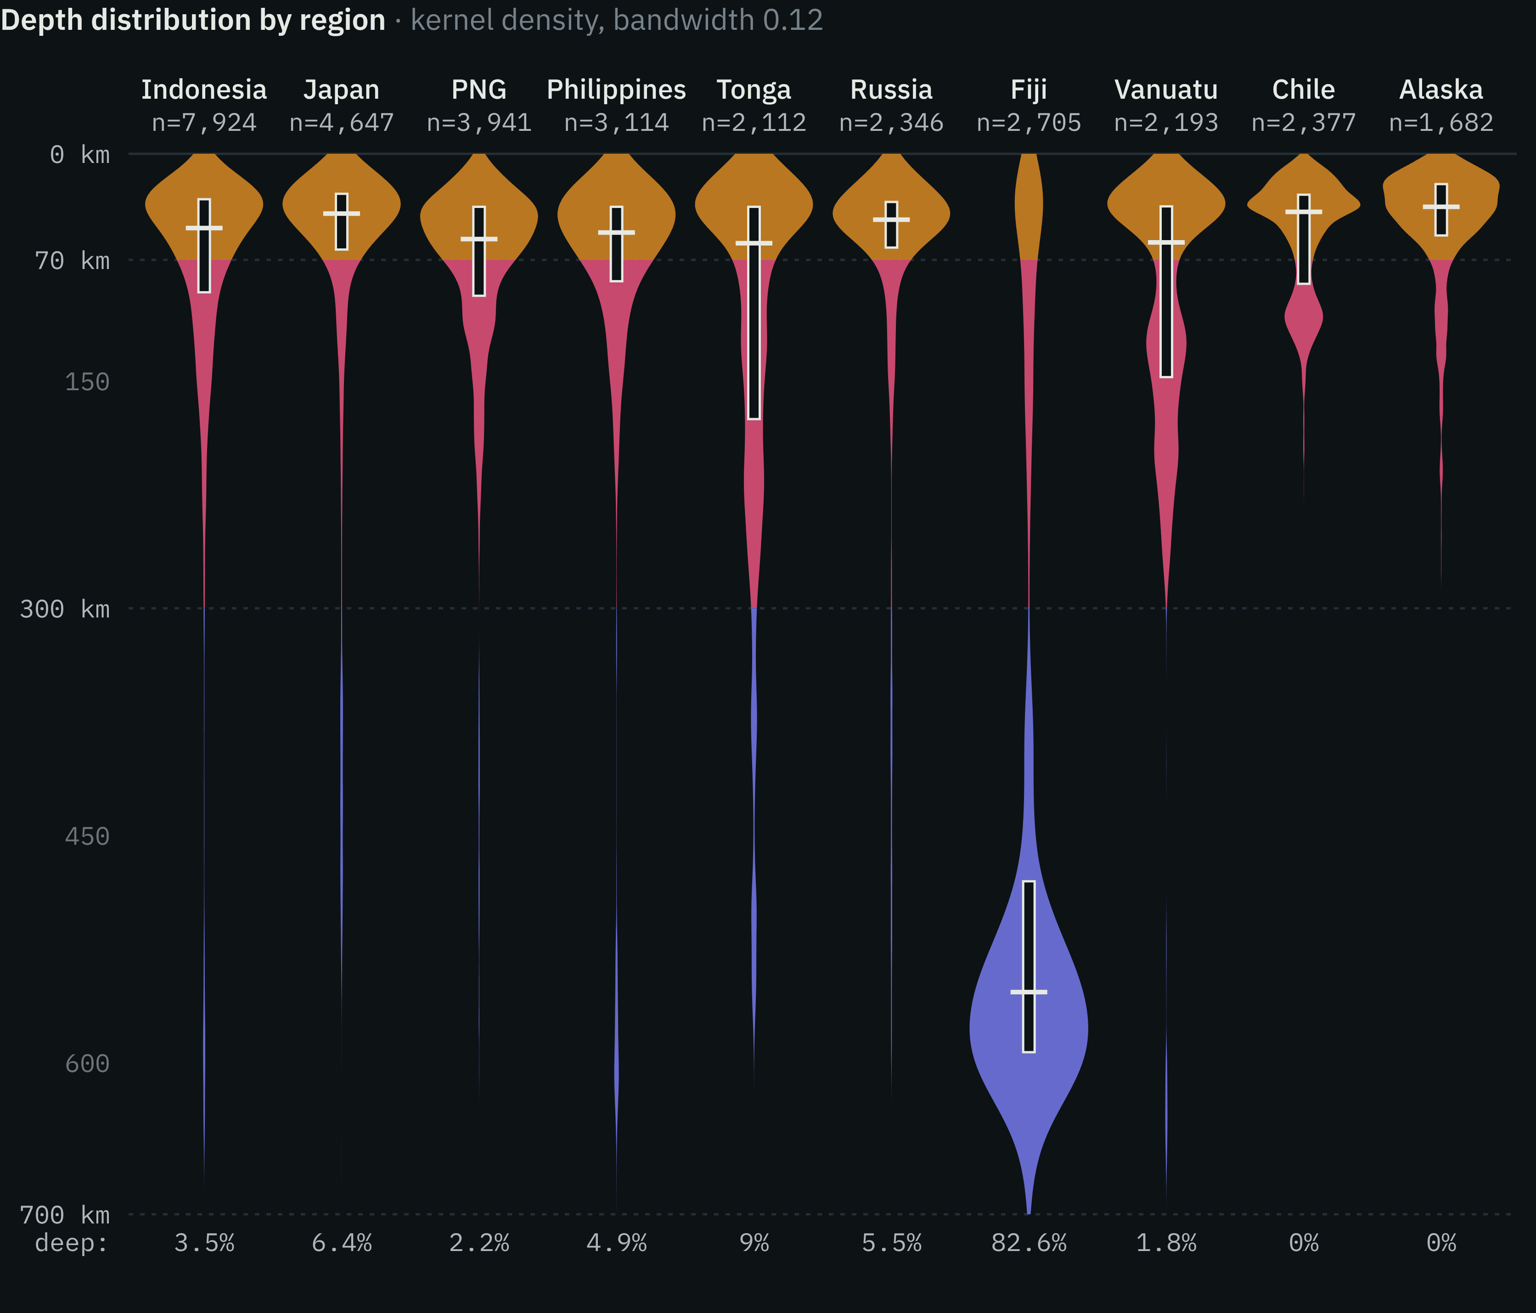
Depth Fingerprints: Violin and box plots of depth by region
Violins show the full kernel density of computed depths (fixed-depth events removed), and boxes show the interquartile range and median. Fiji is the outlier: 82.6% of its computed depths are deep, because it sits above the Tonga slab. 69.5% of all deep events come from three regions. The contours use 16 log-spaced density levels, so the rare deep-focus band near 500–650 km stays visible next to the shallow mass.
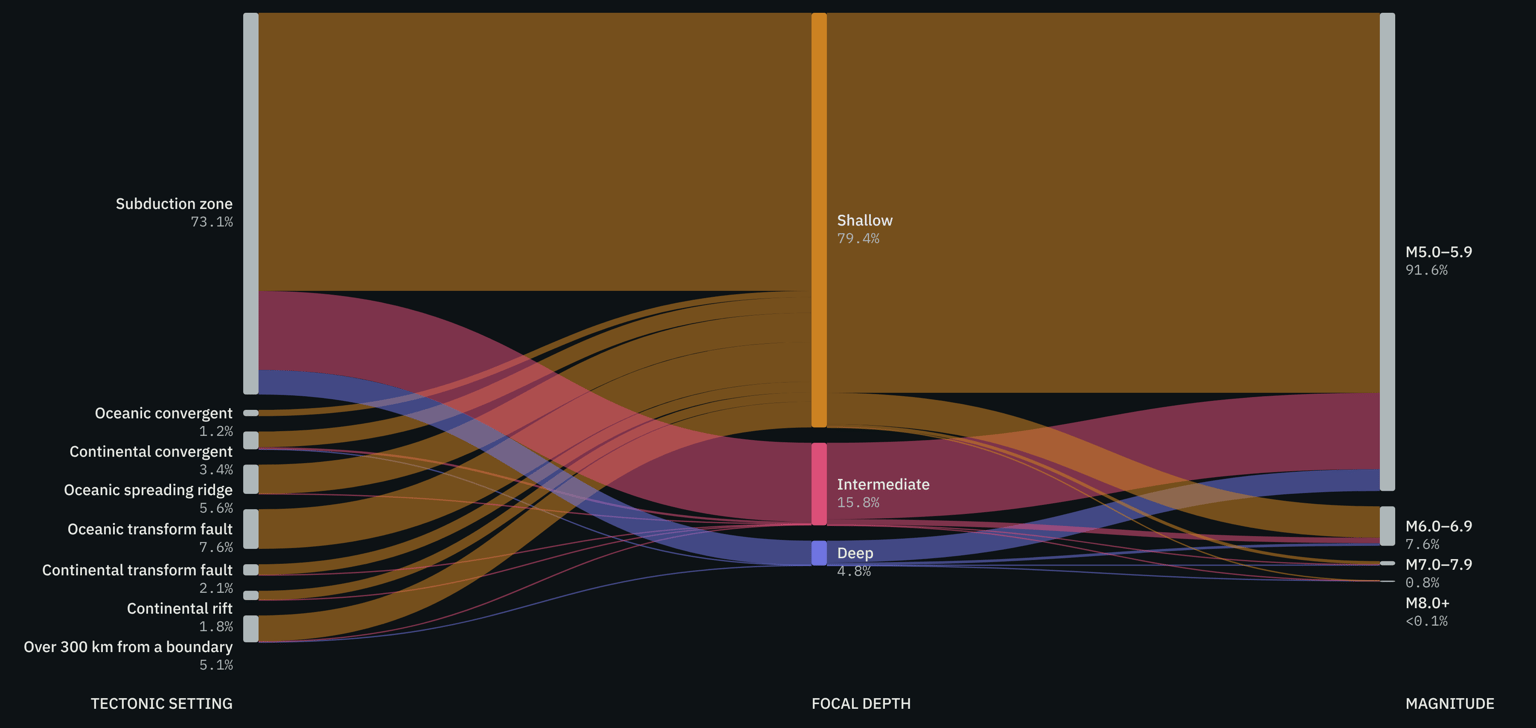
The Seismic Budget
This is a budget, not a physical movement: each event flows once from its setting (PB2002 boundary class) to its depth class and then its magnitude class. Subduction zones host 73.1% of events and release 89.9% of the energy, including 92.5% of all M8+ events and 99.2% of deep
events. Spreading ridges contribute 5.6% of events but only 0.4% of energy. The three stages
also read as an alluvial (parallel-sets) diagram.
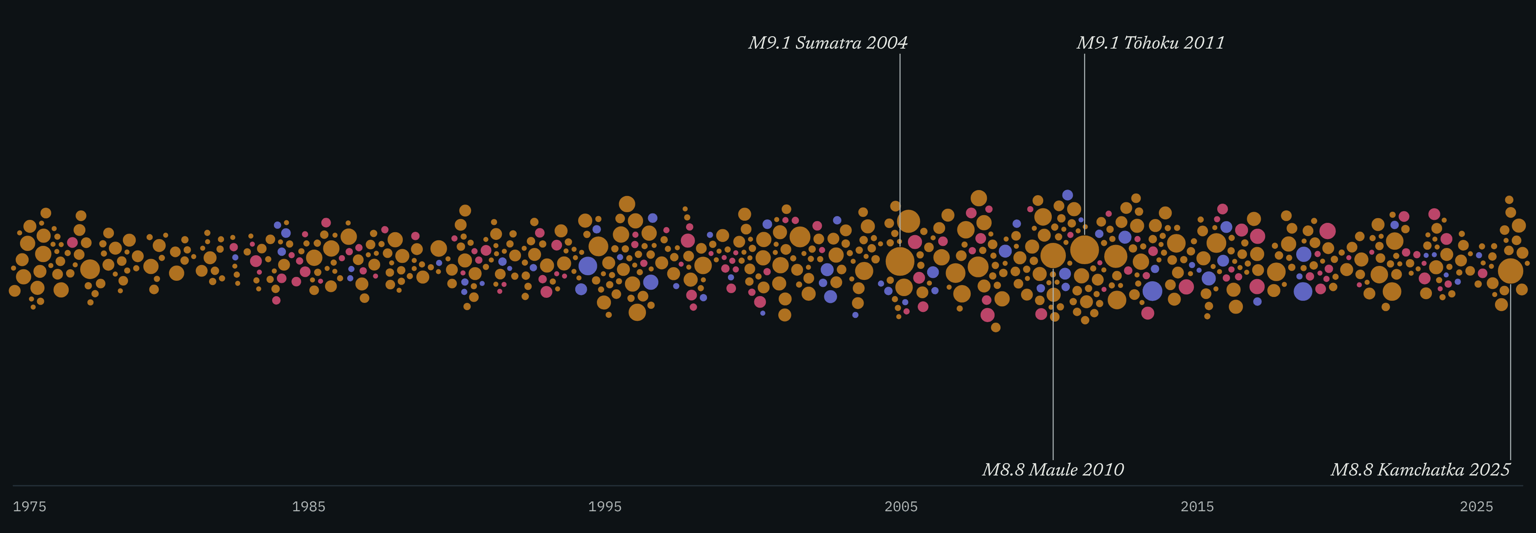
Every Great Shock
Each circle is one event, pinned to its date and sized by magnitude; a force layout stacks circles instead of overlapping them, so column height shows clustering. Major earthquakes arrive at a broadly steady pace with clusters; 2004–2012 holds five of the six largest. Colour confirms they are overwhelmingly shallow.
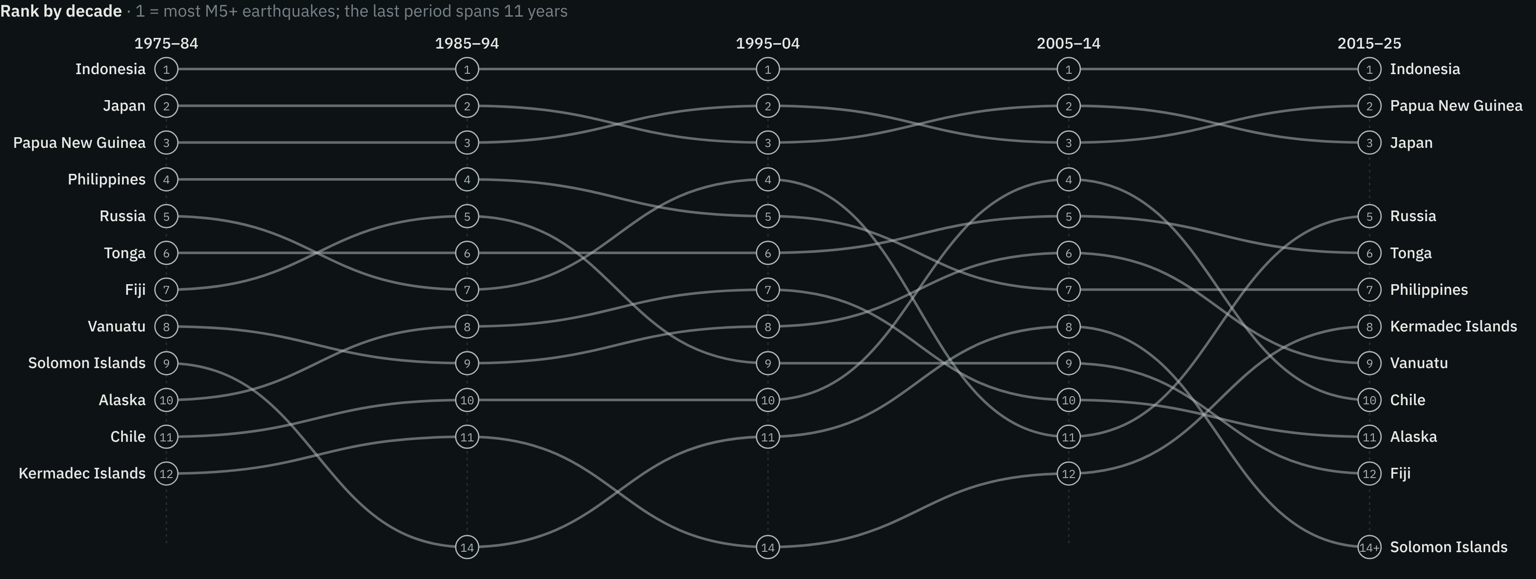
Rank by decade
Indonesia ranks first in every decade. Japan and Papua New Guinea trade second and third. Chile jumps to fourth in 2005–14, the decade of the 2010 Maule earthquake; the Philippines slides from fourth to seventh. The final period spans 11 years (2015–2025); ranks, not raw counts, are compared.