Statistical Process Control Analysis of Defect Rate Using Control Charts
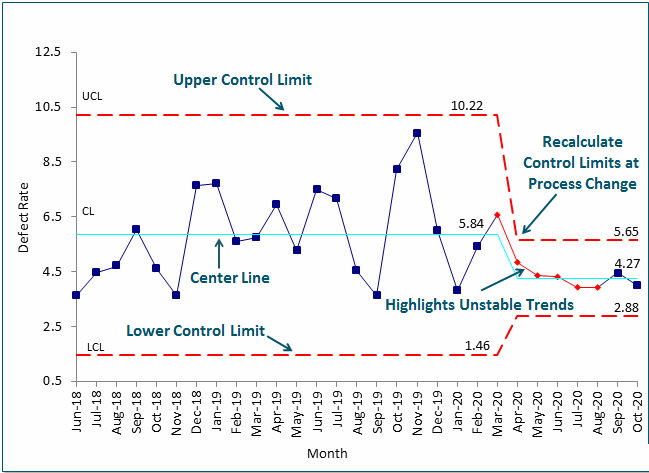
The control chart shows that the process was initially stable with normal fluctuations around the center line, indicating common cause variation. A significant spike in defects and a later sustained shift in performance reveal the presence of special cause variation, suggesting a process change or corrective action. After this change, the defect rate reduced and new control limits were established, confirming process improvement. Overall, the chart demonstrates how control charts help identify instability, validate improvements, and distinguish between normal variation and meaningful process changes.