Bar graph
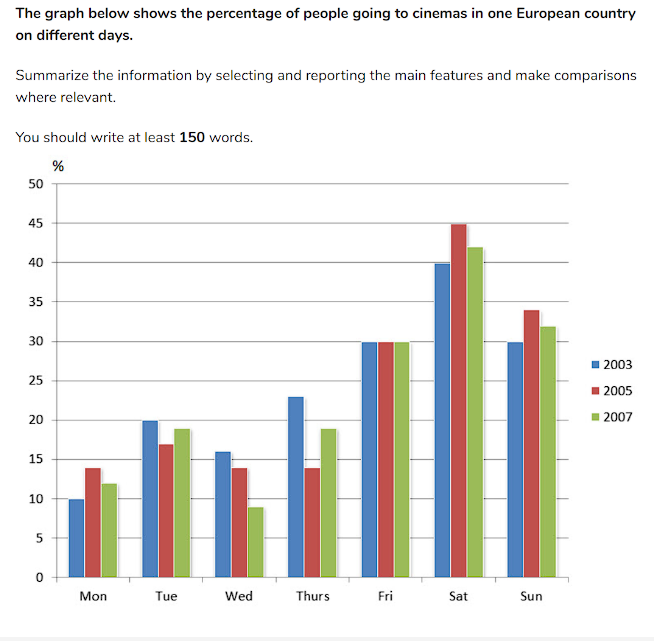
The bar graph illustrates the amount of visitors that attended cinemas on different days of the week in a European nation for the years 2003, 2005 and 2007.
Overall, the attendance was lower from Monday to Thursday. Whereas, the ones with a higher demand were Friday to Sunday. Being the lowest point of the general data Wednesday in 2007 and the one with the biggest percentage was Saturday in 2005.
In detail, from Monday to Thursday in 2003, the day with the minor percentage is Monday with 10%, followed by Wednsday with nearly a 16% , and Thursday showed a 20%. In the case of 2005 and 2007, follow the same trend: Mondays near 14% for 2005 and decreaning to 12% in 2007, while Thuesday has aproximately 17% , slightly climbing to 19% during 2007, and in Wednesday it dropped around 5% from the 14% of 2005 . Finally, Thursday fluctuated being at the top in 2003, but it decreased two years later to near 14%, going up to 19% in 2007.
On the other hand, there is Friday to Sunday. . An important highlight is that Friday percentage was steady for the three years, being it at 30%. While Saturday is the day that have the highest percent of people going to the cinema with almost 40% in 2003, 45% in 2005 and around 41% in 2007. Finally, Sunday is the second popular day with an average of 31%.