Avoid compare pie charts
BEFORE
Using two pie charts to compare proportions in two periods is a common visualization practice. If you're using two pie charts, it's fair to assumed that you're more interested in the changes than in specific proportions in each year.
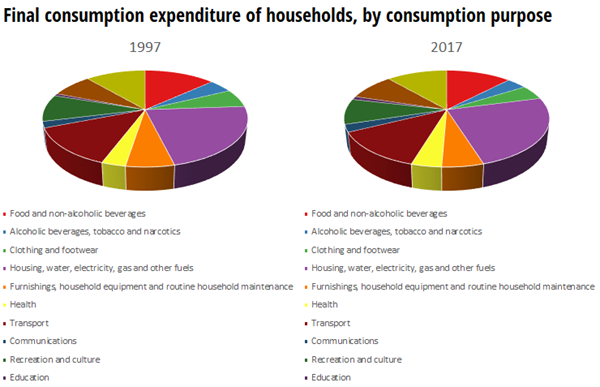
Applying the video lessons to this case suggests that this is a very poor visualization:
- It's hard to compare the two years, since there is't much change, so we need a more precise tool to compare the categories.
- The 3D effect emphasizes the slices closer to the reader.
- Since there are 9 slices, color encoding gets harder, because some colors are similar
- It uses a legend instead of labeling the slices directly
- The title is purely descriptive.
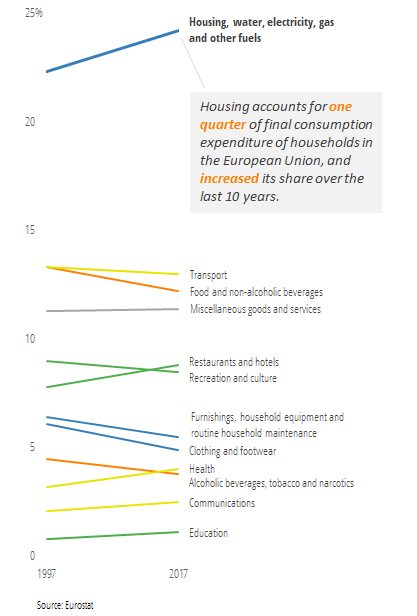
AFTER
The "after" chart uses a slope and addresses those issues:
- The larger category stands out and its change is clear.
- While you can see in the pie charts that Housing expenditure increased, that's not as easy to see with the remaining categories. Using the slope chart, even the small changes become visible.
- The lines were labeled directly, so there is no need for a legend.
- The title focus on the main insight.
- Color is not needed to encode categories, so it is used to group expenditure by proximity (orange for food and beverages, for example).
What could be done to improve the chart? Making the grouping by color mor explicit would probably be a good idea. Also, there could be a version with a log scale to show that the rate of change in Education is actually higher than than in Housing.