Student Performance Analysis Dashboard
This project was completed as part of the course “Excel – Beginner to Advanced in Under 4 Hours.” The objective of this project was to apply fundamental Excel concepts to analyze and present student performance data in a structured and meaningful way.
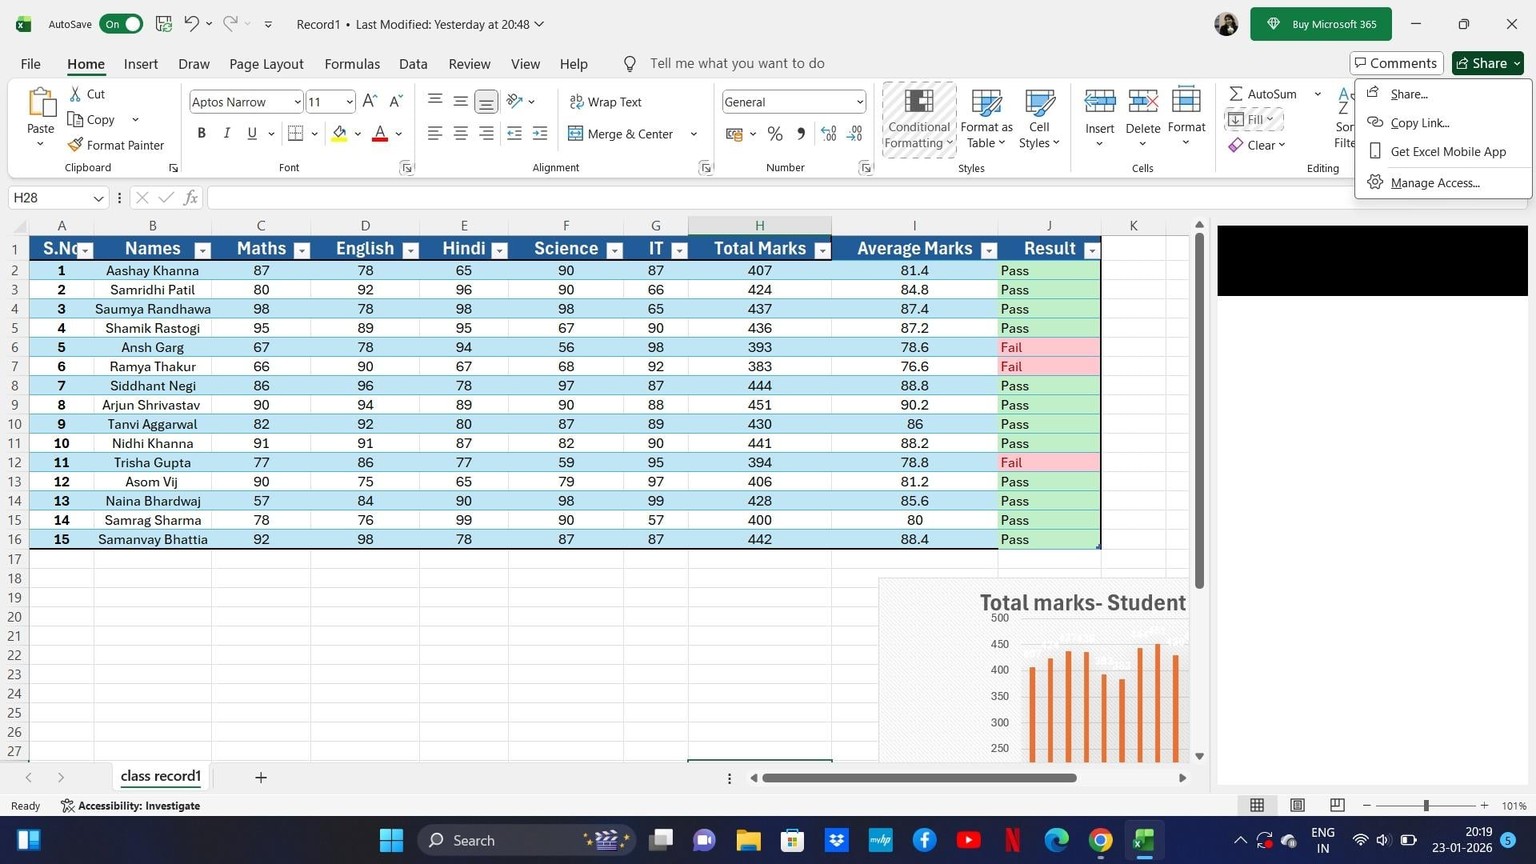
The dataset contains marks scored by students across multiple subjects, including Maths, English, Hindi, Science, and IT. Using Excel formulas, total marks and average marks were calculated for each student. Logical conditions were applied to determine pass and fail results based on overall performance, and conditional formatting was used to visually distinguish outcomes.
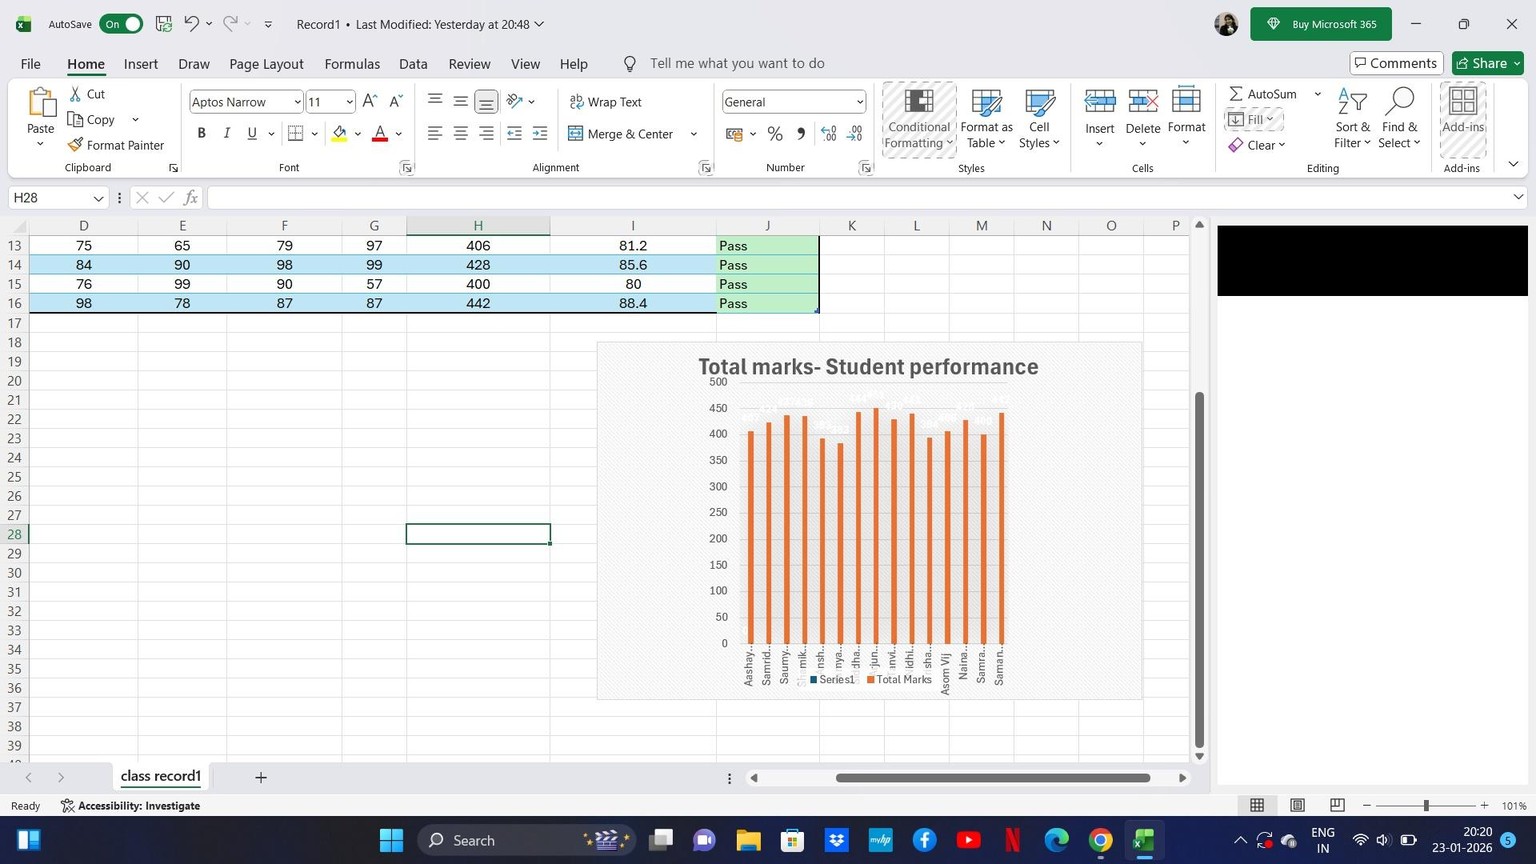
To enhance interpretation of the data, a column chart was created to compare total marks across students and identify overall performance trends. The final worksheet presents organized data, calculated metrics, and a visual summary in a clear and readable format.
This project helped reinforce my understanding of Excel formulas, data organization, conditional formatting, and basic data visualization techniques used for analysis and reporting.