Real-Time Case Study: Bitcoin Charting
Hey everyone! Here's a quick update on BTC/USD. Refer to my previous classes on Intro to Crypto Trading and Advanced Charting Skills to follow along and structure your own plan.
BTC/USD had a wild start to the year, but it appears that shorts are gradually covering positions as upside momentum builds.
We are still stuck in a tight zone, and will need to clear $11,800 - $13,000 for upside confirmation. Continue to use the 30-day and 200-day moving averages to confirm support.
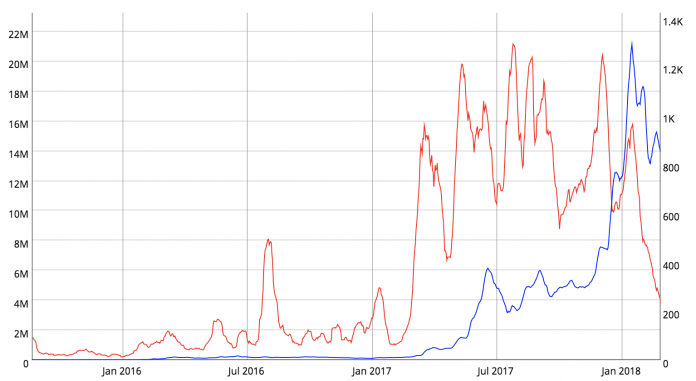
News-flow is driving bearish sentiment with recent government crackdowns. The chart below shows a sharp decline in Ethereum transaction velocity (red) vs. ETH price (blue). I typically use these as contrarian indicators, especially after sellers confirmed bearish fundamentals with force. To bypass noise, we will operate within chart parameters to confirm high probability entry/exits based on price action.
Exciting content coming up! Collaborations, enhanced visuals and new trading tools for crypto and beyond. Follow my profile for updates and watch prior lessons to catch-up with the crew.
It's now 3 AM in New York and I'm tracking crypto. Never a dull moment.
Cheers!
Damanick