Playing with processing
Hi!
Thanks a lot for the toolkit! I'll have a lot of fun with this.
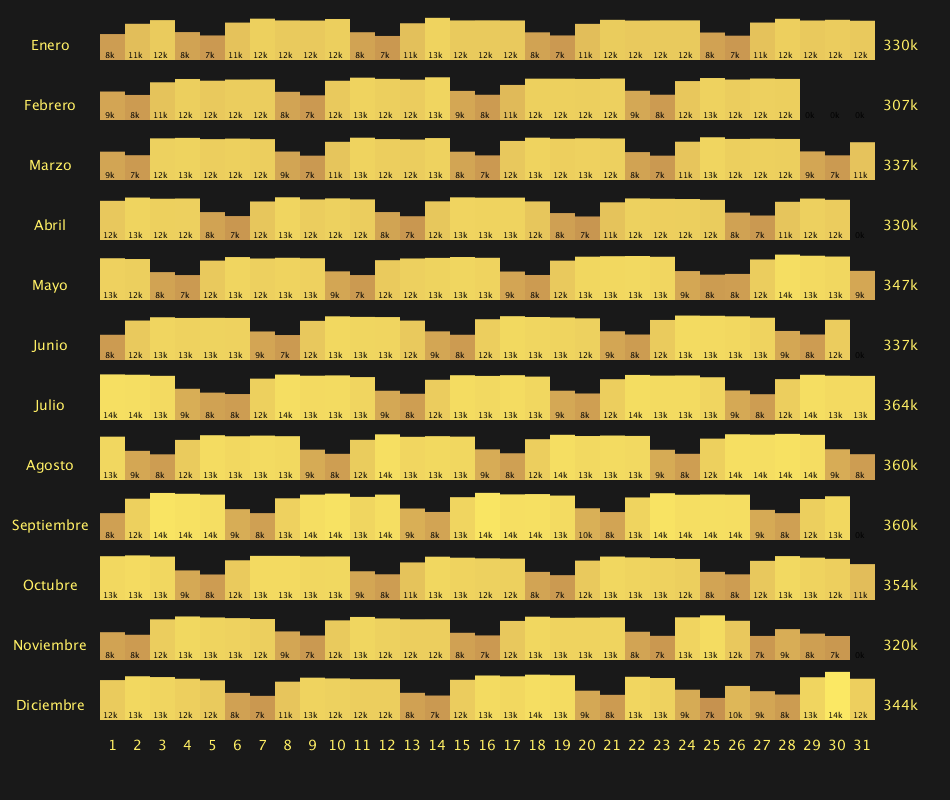
1) With the birth data dataset, I saw less births over weekends systematically, and also less on Memorial day in May, 4th July, labor day in September, Thanksgiving, and Christmas and New Year.. Some fast fact checking with friends confirmed that this is typically true. I did not know that.
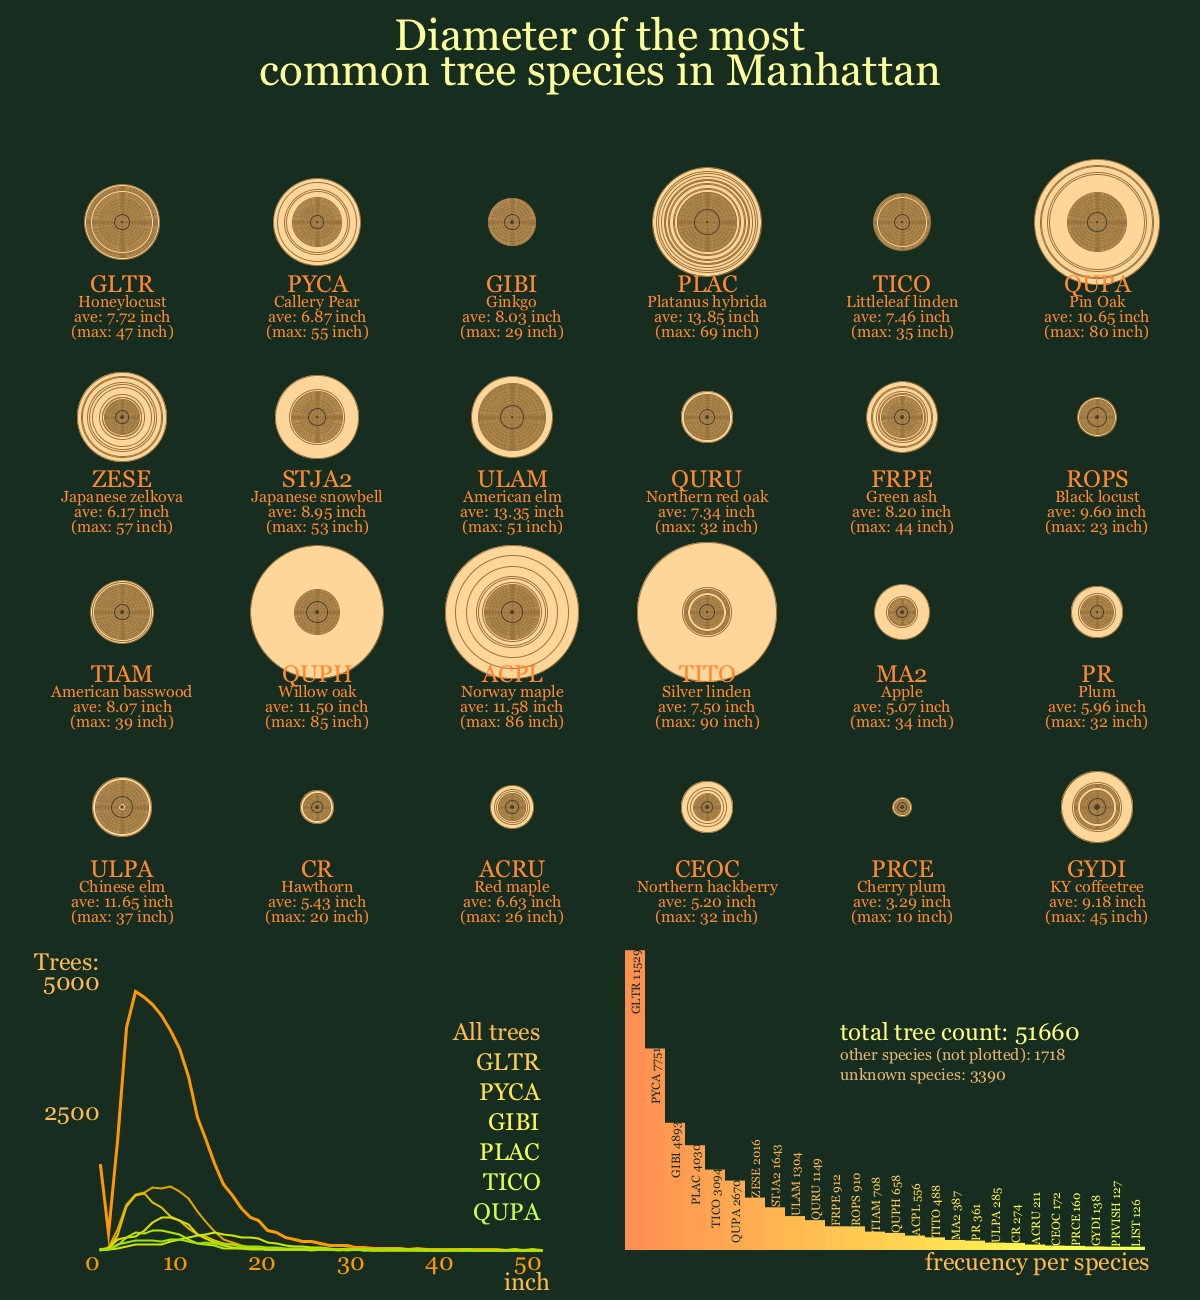
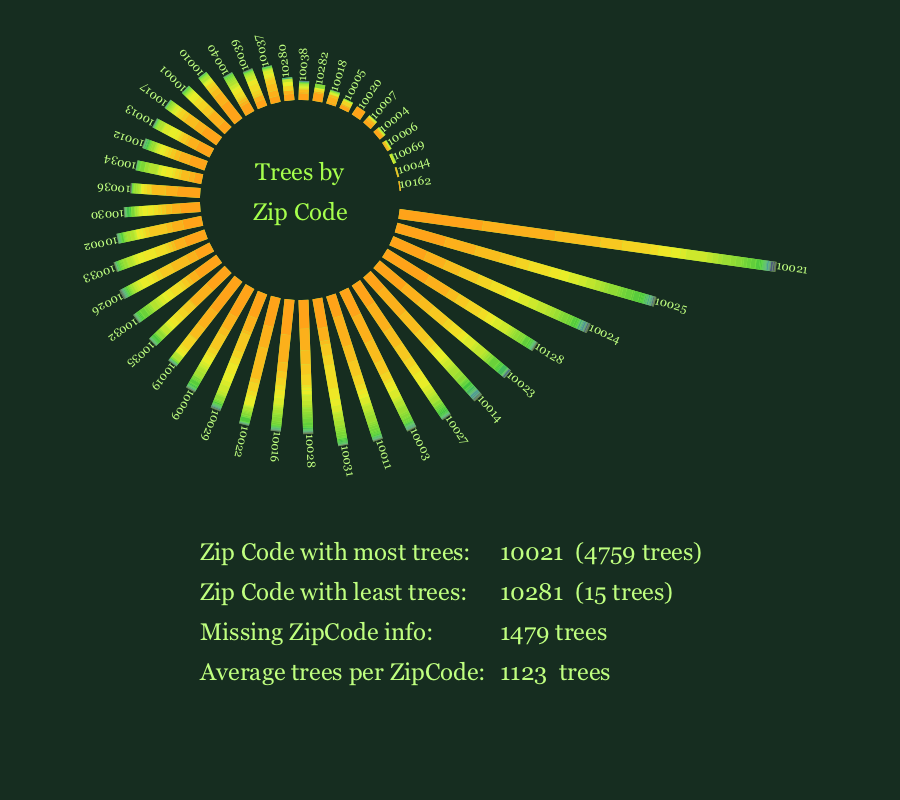
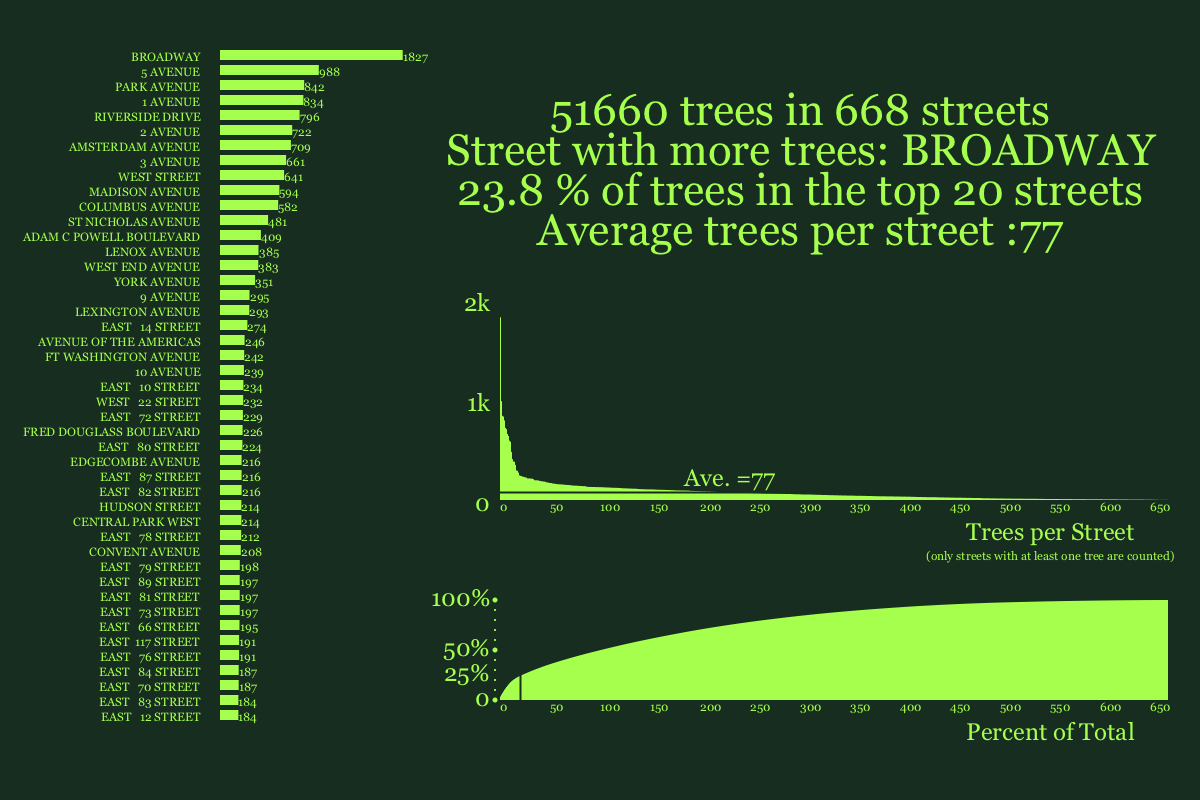
2) With the tree dataset, I played mostly with the diameter of the different species; and then I also checked a little bit the location of the data by zipcode & street. I uploaded three sketches with the summary.
(I think the location can be checked further, as you explained in your other class, and the condition of the tree is also interesting to check I think)
I found challenging that some of the lines are not filled (0 diameter for many trees, for instance), and I believe some rows were mistyped when they were introduced into the database while doing the survey (eg: two of the trees are listed as having a 505 inches diameter that really contradicts the rest of the data of the species so I think its a typo... some zipcodes are missing... etc)
Anyway: thanks so much for the examples and the introductory code and the class!! It was great :).
I have a background in scientific data analysis & want to try to cross the bridge to do beautiful infographics instead of just doing ol' boring plots. Your classes in skillshare are just what I need :). As I know look at the plots I made with a critical eye, I keep on doing the same style (histograms) all the time, I need to think a bit more out of the box.
Best,
Maria
2) Trees:
1) Birthdates: