Journals - My Data Story
Some things I learned about my journaling habit from looking at my data visualization, is that I LOVE journals without lines! This was my primary takeaway. And it's very true - lines are too restrictive. My only lined "journal" was actually a calendar that I use as a to-do list, mostly. Also, I realized through this project that the number of art journals I have is now on par with the number of non-art journals. I think my art practice is slowly out-pacing my writing practice, which I love. :-)
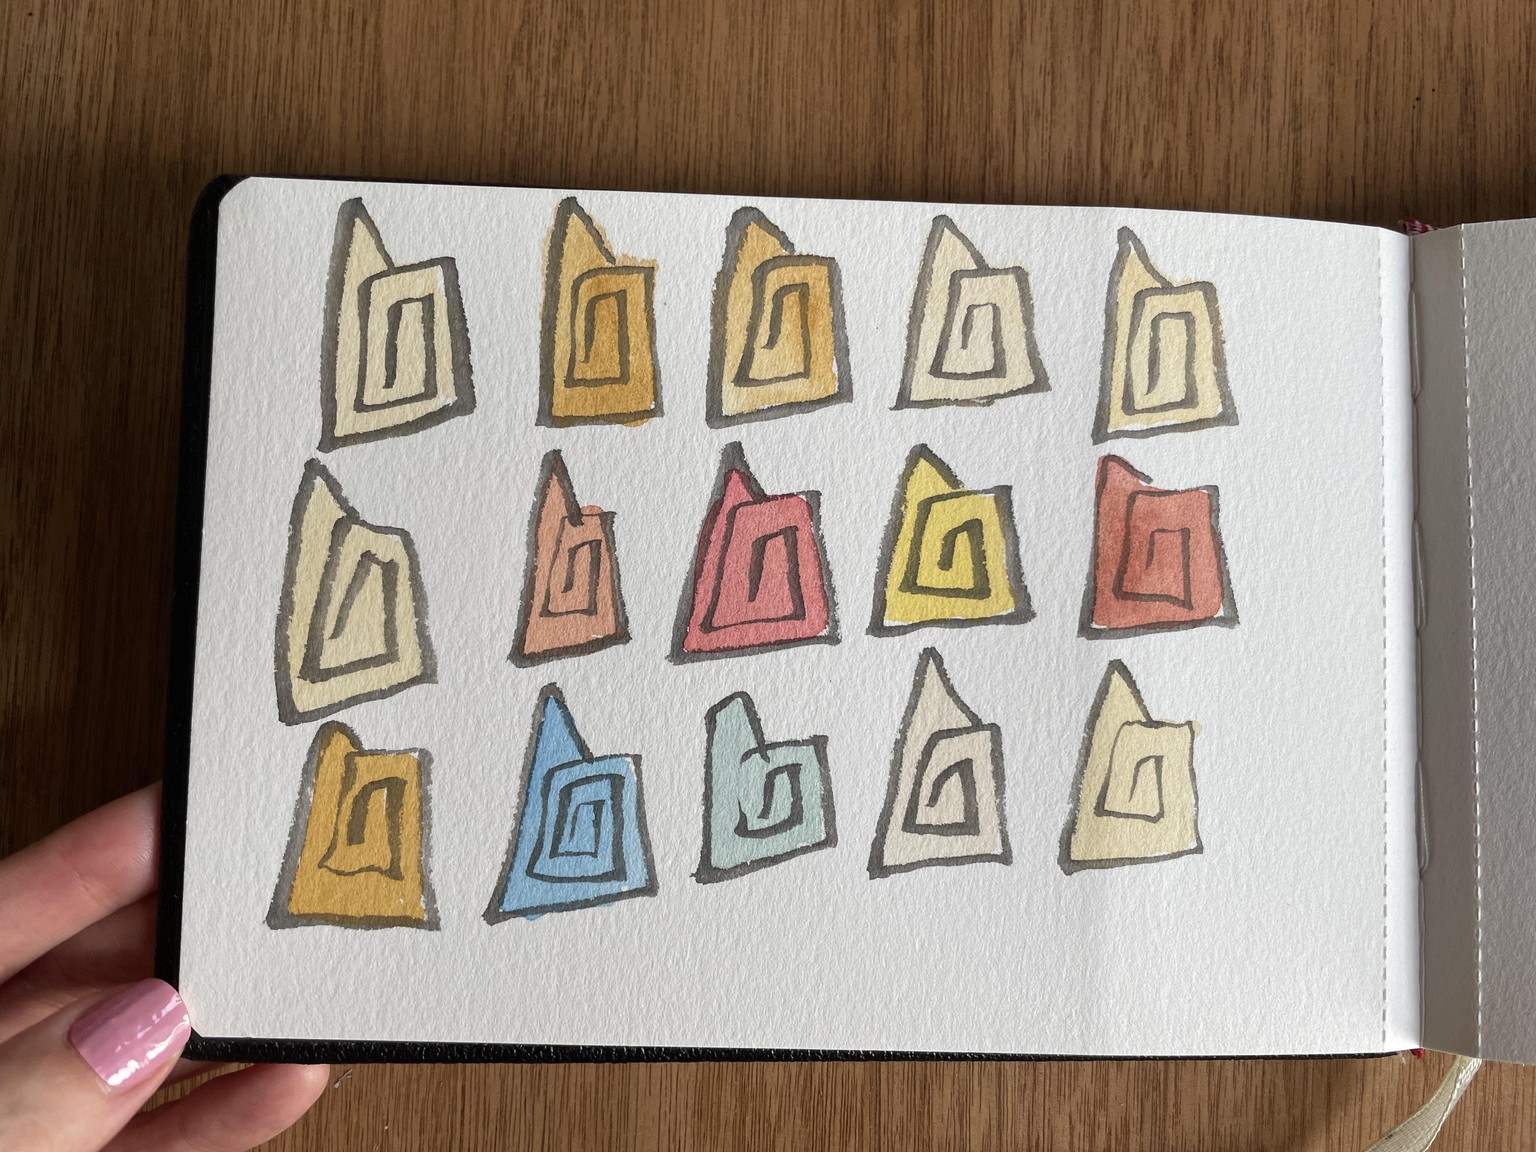
Here's my favorite visualization mockup. I decided not to use color on my visualization, cause I was going for a much simpler look. But color can be such a powerful way to illustrate certain data aspects. Like, your feeling about something....dark red = very excited, and down the value scale to light red being less excited.
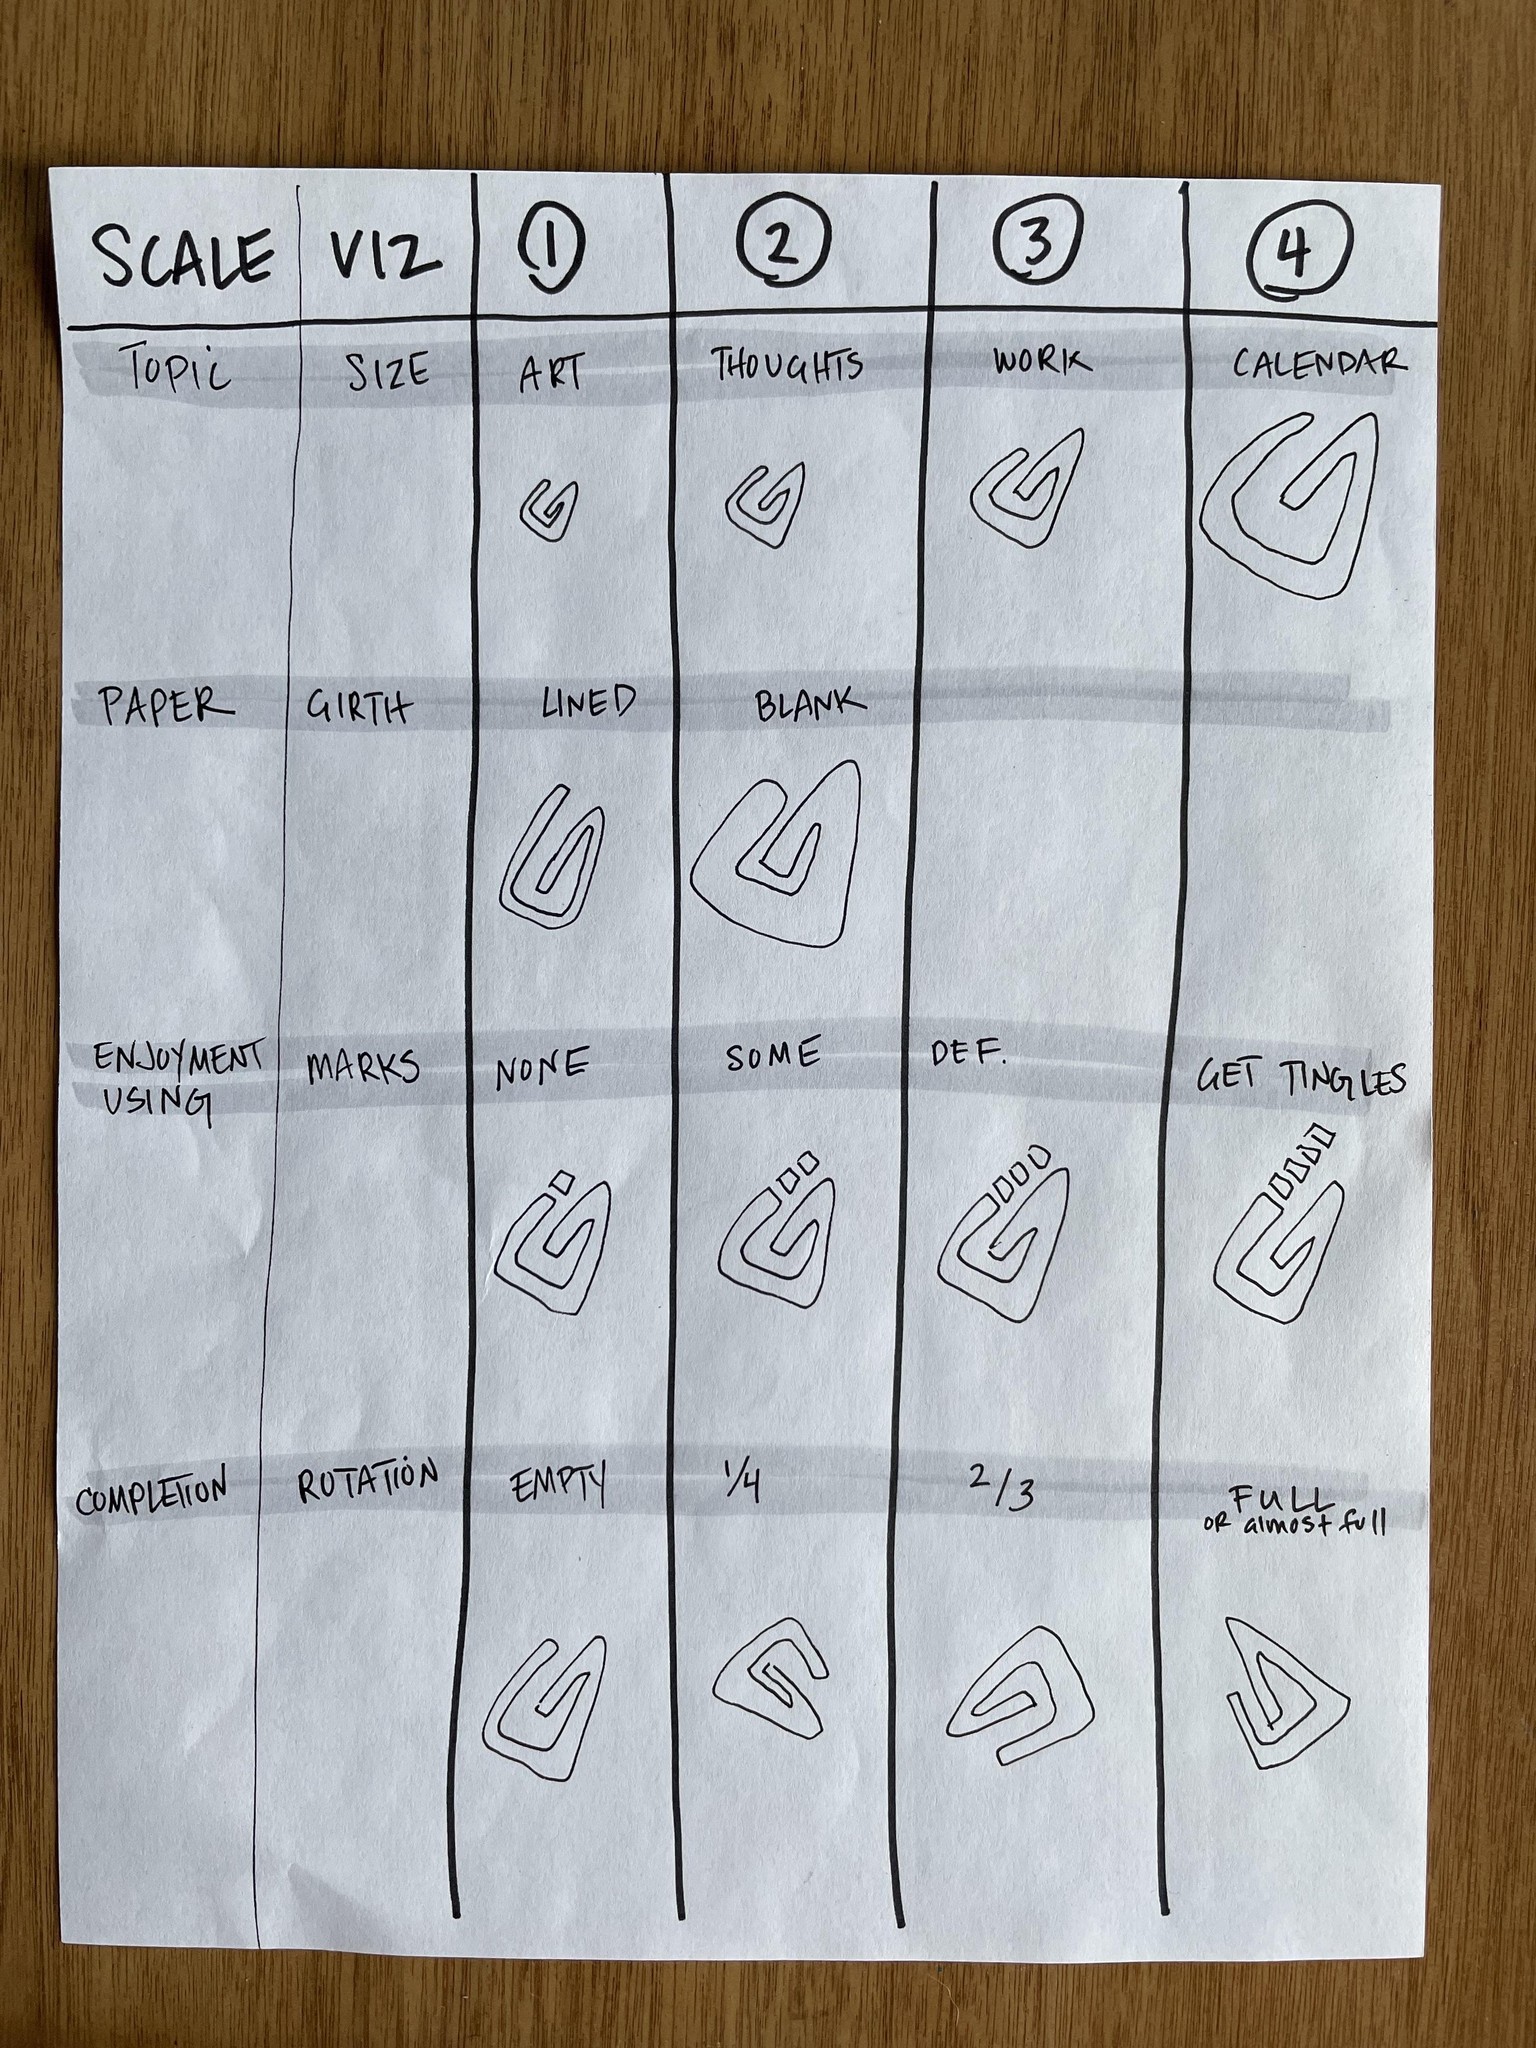
Here is my legend.