Data analysis and visualisation using gapminder dataset in R
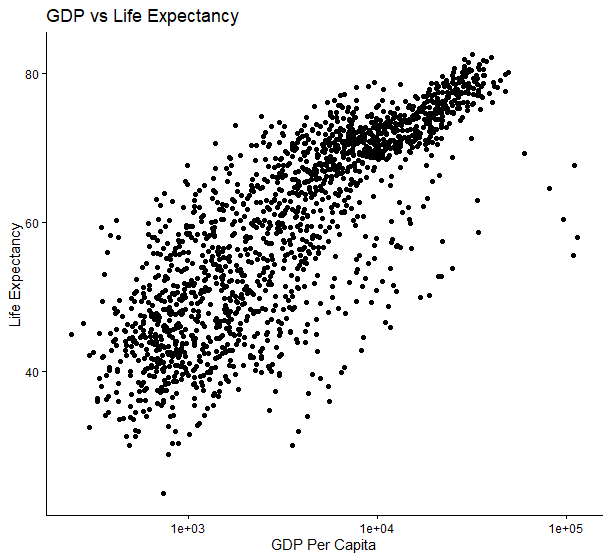
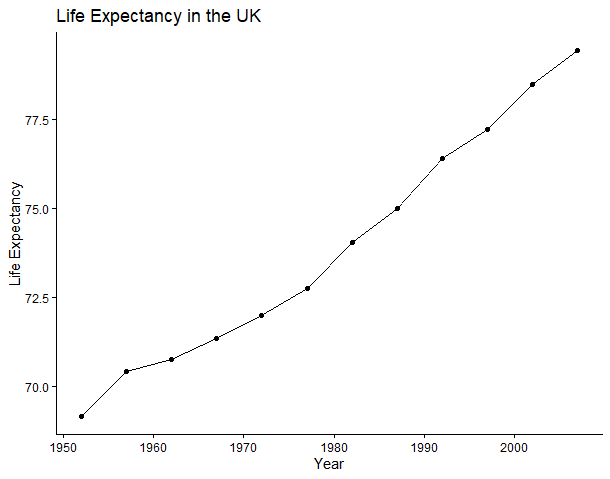
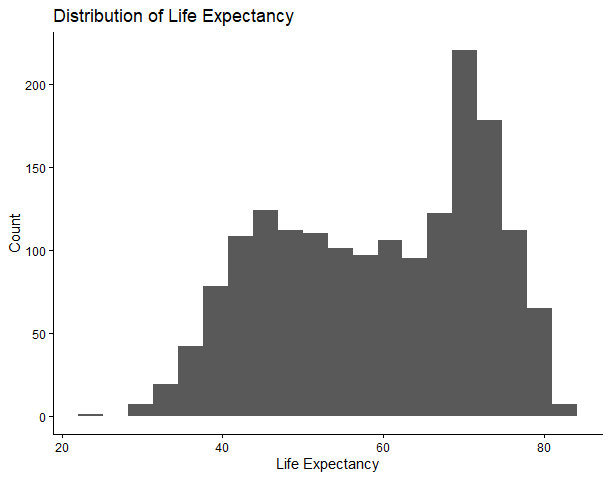
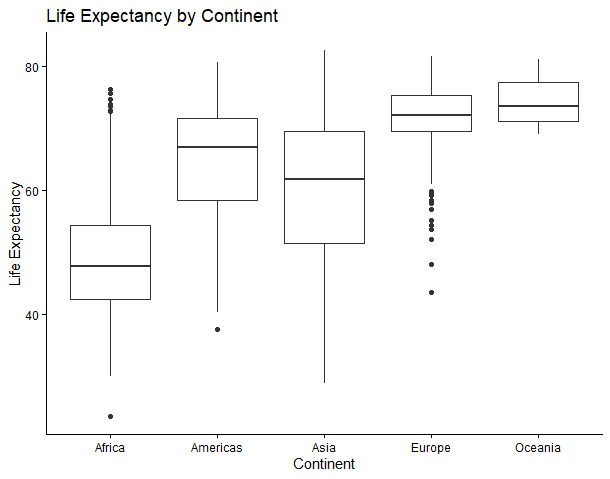
This project demonstrates the use of R, tidyverse, and ggplot2 for data analysis and visualization. the gapminder dataset was explored using the pipe operator (%>%) to manipulate and filter data. Several graphs were created, including scatter plot, line graph, histogram, and box plot from the data. This helped develop fundamental R programming, data manipulation, and visulization skills for data analysis.