Transcripts
1. Intro: Hello guys, welcome to
my new notion class. Do you think Notion
is too complicated with all its databases
and formulas? Or you've heard nothing of Notion databases and
just find yourself confused with all
these people being so excited about another
note-taking app. If you answer yes to
any of these questions, this class might be
very helpful for you. In this class, I will do
my best to help you to get a deep understanding
of Notion databases, formulas, relations,
and rollups. I will explain in details this most powerful
notion tools so that you get an idea of when
and how to use them. We all know that
learning by doing is the most efficient way
to obtain a new skill. That's why the learning
process in this class is built around creating
a Notion project. Together, we will build a
smart habit tracker in Notion, if you don't need
a habit tracker, you might just go through the topics that you
need most right now and then apply this new knowledge to
your own Notion systems. If you aim to become an
advanced notion user, I would suggest you to build
this project in order to get the experience of building
advanced notion systems, the project will include interconnected databases
with rollups, progress bars with
plenty of formulas. With this tracker, you
will be able to easily get weekly and overall
statistics for your habits. You will get a place
to store all of your current and
future routine ideas. Also, we will learn how to build an appealing and
capacious views for your Notion databases
and how to accelerate the process of adding new
habits with Notion templates, the things you will learn while creating the habit tracker will definitely help you to create your own
systems in the future. And I'm pretty sure that far before finishing
the project, you will get many
ideas of how to apply this new knowledge to
your own Notion systems. In this class, I will
not explain the very, very basics, like how
to create an account, how to download the app. I will not explain the basic
blocks like text, to-dos. They are pretty intuitive. What we are going to do
in this class is to learn a bit more advanced notion
topics like databases, formulas, relations,
and roll-ups. Please don't give
up at this point. If you have just installed
the app, give it a try. Notion is not that hard and I will do my
best to prove it. As soon as you get familiar with Notion databases and formulas, you will open new
incredible horizons of structuring your data and
organizing your workflows. So no more delays. Let's dive right in.
2. Project Demo: The class project that we
will create together during the class is ready to use
system for habit tracking. This system consists of three databases: for
habit, trackers and weeks. It lets to assess the progress for every particular habit from
a high-level perspective, together with the possibility
to see the detailed stats, the project includes
the dashboard for planning habits. With
all the knowledge shared within this class, the initial structure of
the project can be easily adjusted to one's particular
needs and preferences. And the project can be connected to your
existing planning system.
3. Navigation: In the beginning
of every lesson, you will see the time
codes so that you could easily navigate between
different lesson parts. The hammer sign means that it's a practical part - building
our class project. And I invite you to do this practical parts
together with me. Еvery lesson starts with a short description of what
we are going to learn and is wrapped up with a recap of updates made to
the class project. If you have any
question related to the class project or to the topics that we're going
to learn in this class please feel free to ask them. I will be glad to help you. Now you are all set,
so let's start.
4. Databases: Welcome to the first lesson. Here we will talk about Notion database concept and start building the
habit tracker project. At the end of this lesson, you will have an idea
of Notion databases, why this feature is so powerful
and how you can use it. After finishing the
practical part, you will have a notion page
with trackers database in it. Your database will
have columns for a tracker name and
seven days of week with either checkboxes or emojis to track your daily
habits progress. So let's start databases. Databases. Database in Notion is the way to structure and organize any
similar pieces of data, like books, data about clients, projects, weekly reports, database might sound
boring, but in fact, it allows you to
organize your life in a beautiful and
well structured way. Let's see an example. This is a movies database. Every row represents
a distinct movie. And columns describe properties
of movies like gender, year of production, how do I
rate it, etc. Pretty similar to what Google
tables or Excel can do. At some points Notion is less capable and less flexible
then these tools. But it has a great advantage
over them in how you can customize the way your data
is shown and operated. Also, unlike Google tables, every database record in Notion is actually a
separate page itself. You can open it, add
some content into it and edit as any
other Notion pages. You even can put inside
another database. So Notion gives you huge freedom on
structuring your data. Ok, with Notion, you can see your data
as a table with rows for records and columns for
particular record properties. But there are some other
interesting view options. Let's check them out. The board view allows you to
create a Kanban-style board which is perfect for tracking a step-by-step
progress of your tasks, projects, publications
for social media, and any type of data which has
a step-by-step workflow. With this view, you can use
drag-and-drop to easily make, for example, status changes. Also, you might want
to use board view to see your data
grouped by categories. Optionally, you can
add a picture to your record preview to make it more attractive or informative. The timeline view
represents data similar to Gantt charts and
it's suitable if you want to see timeframes
of your projects, employee vacations or
pretty any type of data which has both
start and end dates. The calendar view is good
for tracking your deadlines, important events, seeing the
whole month workload, etc. The list view is the
most minimalistic one. It works perfectly for any types of lists
like tasks for today, shopping lists, project wiki, course outlines, etc. The gallery view is
perfect for books, movies, wishlists,
recipes, outfits, and other types of
data which might be easily visualized. In Notion you can configure
several different views for the same database
and switch between them. Notion allows you to apply filtering and sorting
rules for a particular view. You can make notion to filter out movies you
have already seen. Or if your friends ask you
for a movie recommendation, you can filter your
movie database to only see the
top rated movies. In this class project, we will use the filtering for several cases. For example, to only see the habit trackers related
to the current week. Another powerful
Notion feature is possibility to create linked
views for a database. It allows you to work with the same database on
different Notion pages. And this feature opens
incredible possibilities in organizing your workspaces
and workflows in Notion. Let's imagine you have a
database with your tasks. And there is a today
page on which you want to only see a list
of tasks for today. But on the planning page, you want to see all
the uncompleted tasks together with their deadlines. It is possible with Notion. And note that updating
database on one page, will make changes
to other pages with this linked view
of tasks database. Like if we add a new task on the planning page and
assign it for today, it will automatically appear
on the today page. Or another case, you have a database for
your projects and another database for your
tasks. And on the project page you want to only see tasks related to this
particular project. It is possible with Notion and it's database Relation feature together with Templates.
You even can place several linked views for the same database
on the same page. Let's imagine you want to
see waiting, in progress and completed tasks as three
separate lists on the same page. Linked view and filters
will do that for you. Moreover, you can use drag and drop to move a task
between the lists. Notion will change task status implicitly according
to filter settings. I hope now you're
much more inspired on how Notion databases
can be helpful for you, and it's time to start
our class project. First of all, let's create a new empty page for your
habit tracker project. I recommend to enable
full-width page mode as we're going to have a
lot of data on this page. Now we have to create
a trackers database. Let's do it by typing
"/database" and choosing "Database - Inline"
in the drop-down menu. Newly created database
in Notion has these two columns or
properties: "Name" and "Tags". And property in Notion databases belongs to one of the
predefined property types. You can see it by clicking
on the property name, then "Edit property" and
here in the "Type" menu, you can see all the
available types. Property types are
pretty intuitive. And in this class, we will actively use these ones. Every type has its
own unique icon. So you can get the
property type just by looking at the icon to
the left of its name. We don't need "Tags"
for our system, so we can just delete it. "Name" property is a
special one, it is Title. Title property is created automatically and can never
be deleted or hidden. Sometimes it is
really inconvenient, but for this project it's
okay to have it here. Just, let's give
it another name. Now let's add seven
new properties. One for every day of
week so that we could track habit progress
on daily basis. For this purpose, we will
use Checkbox property. Checkbox type is perfect
in case there are only two possible
values for a property: yes or no, true or false. In the context of
habit tracking, we're going to mark if a habit related action is done on not - just two
possible values. So our needs are satisfied pretty well with
Checkboxes here. You can create every
new column from scratch or do the duplication, which will save you
some time because the type and the
column widths will be inherited from the
source column and you will only have to
rename the property. The cool thing about Checkboxes is that once you
create a new record, empty Checkboxes are already there, and you only need to tick it
if a neccessary is done. But if you want to have a
bit more colourful system, then try to use Select type
instead of Checkboxes, Select columns allow to choose one option from a
pre-configured drop-down menu. This column type is helpful
if many different records in your database might share the same values
for some property. For example, many books will
pertain to the same genre. Or your tasks will have statuses
from a defined list of possible values like to do,
in progress, etc. It is good if you know
beforehand the list of possible values for
the dropdown menu, but it's not mandatory. You can add new items
for dropdown menu later. And now, I will show you an alternative
database for trackers for those of you who prefer to have a more colourful system. Let's start from
this point and add the first Select
column for Monday, I will add three
pre-configured values: one for success,
another one for fail. And the last one for rest days, which might be used to
point out that habit is not supposed to
be done in this day. And now I will duplicate this column for
all the other days. Time to add tracker
names for these records, that Notion automatically added when creating the database, it's up to your imagination
which notation to use: emojis, words, or numbers
with coloured backgrounds. Now you have to spend some
more time to fill the tracker. And actually you will have a bit more complicated formulas for Select columns later. But your system looks
more colourful and has three instead of two
options to choose from. I will return to the
version with Checkboxes, as I will use this
one for our class, but I will add additional explanations
for the version with Selects where necessary. So you are free to choose
the one you like the most. At this point, you actually can add trackers for
your real habits. I will add names and some
random progress to the records. We are done with this lesson. Now you are familiar
with databases, their views, filtering options, and I hope now you have an idea of Linked
views in Notion. We've also learned how to
create a database and use Checkboxes and Select
properties in practice. And in the next lesson we will start working with formulas. I'm waiting for you there.
5. Formulas: Welcome back. In this lesson, we will learn one of the most powerful features
of Notion databases. I'm talking about Formulas. After finishing this lesson, you will get an idea
of Notion Formulas. What are they for? How to add a Formula? What are the limitations? And we will talk in detail
about if-statement. In the practical part, we will create a formula for
calculating the amount of successful days in our
habit tracker project for both Checkboxes
and Selects versions. Okay, let's start. Formula is one of
the property or column types in
Notion databases. This property type is indispensable
when you need to take a value from a database column and transform it in some way. You might want to
sum expenses in different currencies or
transform minutes to hours or concatenate several
columns' texts to get a summarized description of the whole record or even visualize your progress
with the progress bar. We will create one
soon in this class. Of course, we could do all these calculations
by ourselves. Getting back to the example with converting minutes to hours, I could fill the values
for every task manually. First of all, I would have to do a lot of tedious additional work. But what is more important
if at some point I realized I had made a mistake and then corrected the time in minutes. I would have to
remember to change the corresponding hours value. And there would be a
high probability that at some point I would just forget
to do such corrections. And eventually my records would contain
contradictory data. But dealing with Formula, you construct it once and
it immediately starts to work for all your existing
and future database records. And you don't need to fill out the Formula column manually. It calculates the result for you. After finishing the
habit tracker project, as users, we will have to
only mark the progress in day columns and Formulas will calculate all these
statistics for us. Obviously, you have to
instruct Notion to do the transformation you
need in Formula property. To do this, we have to
use a special language. Partly this language is
described in the formula editor. Let's learn some of the most
important constructs of this language so that you could start using it as
soon as possible. And function number one is prop(). You will need this
function to take a value from a distinct column to
work with it in a Formula. The column name must
be placed within parenthesis after the prop()
and be rounded with quotes. You will see that parenthesis follow most of the
Notion Formula constructs. Parenthesis tell
Notion that everything, what's inside relates to this particular
command on the left. It's also called function. We may think of
prop() function as of a reference to a
distinct column value. Let's return to the example with time log and see how the
prop() function works. I can either type the function
with the "Time spent in min" column name
or pick the column from the property list
in Formula editor. The second way allows you to avoid making mistakes
in a column name. Anyway, if you make a mistake, Notion will tell
you that it can't find a column with the
name you've provided. Ok, this construction doesn't
convert minutes to hours yet, but it already works. Let's see what
this formula does. Look, under the hood Notion replaces the prop()
construction with the actual value of the
referenced column. Once I change a value
in the minutes column, it immediately affects the
corresponding hours column. So Formulas in Notion
or alive constructs. They dynamically respond to the changes you make
to your records. In Notion Formula, we can use same arithmetic operators
that you can see in your smartphone calculator:
plus to sum, minus to subtract, Asterix to multiply
and slash to divide. So, Notion sees a number instead of this long prop() function under the hood. To get amount of hours, we need to divide amount
of minutes by 60. Let's add dividing by 60 to our Formula and
check the result. Easy, right? Later in this class, we will learn how to make such long numbers look
more attractive. There is one important thing to know about how Notion
Formula works. Within every Formula cell, we can only access the
data from the same record. Formula cannot get data from
records below or above. I cannot get the time
spent for the yellow highlighted task within the
violet highlighted record, at least with Formula property. Later in this class, you will learn Relations and
Rollups. These two allow us to access data beyond the particular record
and do much more magic. Okay, time to return
to our project. Let's add a formula
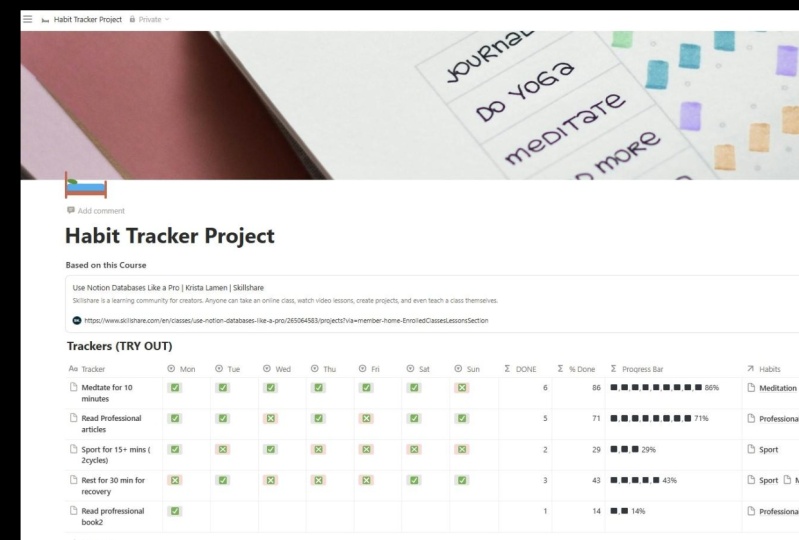
column and name it "Done". I want this formula to calculate the amount of successful days. Let's think of underlying
calculation logic. If a day is checked, I want Notion to see it as
1 and 0 for the opposite case. Eventually I want Notion
to sum up all the numbers. Let's see how this approach is supposed to work for
the "Meditation" tracker. We have 0 for Wednesday and
1s for all the other days. The sum in "Done" column
is supposed to be 6. Summing up in Notion
formula is easy. I'm going to use a
plus sign for it. A bit more tricky
part is to teach Notion to see day columns
as 1s and 0s. And this trick is easy doable with the help of if-statement. This function is one of the most useful Notion
Formula construct, so it's time to figure it out. The skeleton is never changed. But these three blocks will change
depending on your needs. The first block is a condition. We have to put a question
here which may only be answered by yes or
no, true or false in other words. We put the instructions for the yes-case
to the second block. And for the no-case
to the third block. Notion will execute instructions from either the second
or the third block, depending on the answer to the question in the first block. Notion will never execute both the second and the third
blocks instructions. It will always run
only one block. Let's see how it works
for Monday checkbox. The condition or question here sounds like 'Is "Mon"
column checked?'. If yes, we need 1,
if not, we need 0. In fact, after figuring out the answer to the question
in the first block, Notion will replace the
whole if construction with either the second
or the third block. In our case, Notion will replace the if-construction
with either 1 or 0. In more complicated cases, there could be nested if-statements
instead of 1 or 0. And in such case, Notion would continue
to calculate what is the final value to replace this whole initial
if-construction with. Now let's ask our question in the proper way so that
Notion could understand it. It's pretty easy for
Checkbox properties. We only need to mention the property with
the prop() function. Under the hood Notion understands checked
state of a property as "yes". And unchecked as "no", which is pretty logical. Okay, now we know how to
transform a Checkbox day column to
either 1 or 0. To get the sum of successful
day for the whole week, we have to build
if-statements for every day and sum
up their results. Great! "Done" column is ready. For the version
with Select properties we have to update
the question for our if-statement for the
day columns. For a Checkbox, we could just mention
the property with prop() function and Notion is able
to figure out what we mean, because the Checkbox might either be checked or unchecked. Just two states. For
Select columns there might be lots
of possible values. So we have to give some more details to
Notion. In this example, checkmark means that
habit action is done. The red sign means that
habit action is failed. And the white one
means a rest day. And if we think in terms of
1s and 0s, the checkmark is 1 and any
other value is actually 0. So what would be the question that is supposed to be answered "yes" for the checkmark and
"no" for any other values. Obviously, the question
sounds like "Is there the checkmark in a
day column?". Or to be more specific for Monday column, the question would sound like 'Is "Mon" property value
equal to checkmark?'. To write it in Notion language, we will use the prop() function together with equals operator, which looks like
two equal signs. It's not the only way to compare values in
Notion Formula, but we are totally satisfied
with this one for now. For your project, just
replace the checkmark with the value you use for successful state in
your Select columns. And remember to round it with quotes. To get the final result
for version with selects, we have to build
same construction for every day column and add plus sign to sum up
all the 1s and 0s that Notion
sees under the hood. Let's test the result. Once I make changes to a day column, it immediately affects
the corresponding "Done" cell. It works the same way for the trackers
with Checkboxes. Congratulations! Now
you are a big step closer to building really
cool systems in Notion. You can do simple
arithmetic calculations and add some complexity to it with if-statement. In the next lesson we will
add a column to calculate the percent of successful
days. And you will learn how to troubleshoot "Property is
not a Number" situation. So see you there.
6. Numbers: Welcome back. Here we're going to get an
idea of how Notion perceives numbers in
Formula properties. This knowledge will
help you to deal with "Property is
not a Number" error, which you might see a lot while building your own
Notion Formulas. After finishing the
practical part, you will have added
to the project a new formula for calculating the percent of successful days. All the further project changes
are supposed to be the same for both Checkboxes
and Select version. I stick to the version
with Checkboxes, but you are free to continue
with the Selects version. Okay, time to dive in.
For all the arithmetic operations. Notion wants to be 100% sure that you provide
it with numbers in Formula, not with text or some
other type of data. I will explain.
If you explicitly use a distinct number,
like in this example, with converting minutes
to hours than Notion believes you that this
is definitely a number, no doubts. Just never
round your numbers with quotes. Quotes would
convert it to a text. But if you mention a
column with the help of prop() function in a Formula
for arithmetic operation, Notion becomes very strict and only wants to work
with number types. Pay attention, Notion
check types, not values. You might input numeric value for the properties
of several types. Not only Numbers, Text, Selects, but Notion needs guarantees. See the example. I will create a Select
column and try to multiply it by 10
in a Formula column. Hmm. Error. Type mismatch,
property is not a Number. Let's try to hack Notion and add a numeric value to
this Select column. The same result. This error
occurs because Notion knows that even if I typed
a numeric value this time, there is no guarantee that I won't ever add a
textual value to the Select column.
And Notion doesn't know how to multiply text.
Probably nobody knows. so it is safer for
Notion to push users to give some proof of intention to only use numbers. I mean, the explicit Number
type setting for your column. Note that you can use other types of data
in Notion Formula. And we are talking here only
about arithmetic operations. Okay, let's think of a little
bit more advanced example. What if I want to
use the output of my Formula in arithmetic operation
within another fFrmula. Good news is that Notion
is smart enough to analyze the Formula logic and predict if it always returns a number. If Notion finds that
it can be 100% sure that only number might be a result of calculation
done in Formula, then it implicitly thinks that this Formula column
is of Number type. But if Notion is not sure, you will see "property
is not a Number" error. In some cases you might see
"property is not a Text". We will touch this error later. Here is a life hack of
how to understand which implicit type
Notion associates with the Formula column. Open the Formula editor and
see the list of properties. Every property has a type
icon to the left of its name. And you can see that there is a Number icon to the
left of the "Done" column. Explicitly "Done" column
is of a Formula type, but implicitly Notion thinks
that this column is of Number type. In the "Done" Formula
we sum up 1s and 0s. And Notion is smart enough
to understand that summing up. 1s and 0s may only lead
to the numeric result. There is one more
cool life hack. If for some reason you can't change
the type of your column, but you still need to use its value in an
arithmetic operation use function toNumber(). Just wrap a construction
with toNumber() and Notion will start considering
this construction as a numeric one. And you will no longer see the error "property is
not a number". Just be mindful that
if your construction happens to provide a
non-numeric value, the formula might not
be working correctly. Now when we know that we can use our "Done" column in any
arithmetic operation, let's add a new
Formula column to calculate the percent
of successful days. Formula for percentage is known: divide PART by WHOLE
and multiply by 100. In our case, the WHOLE is 7 - seven days of week and the PART is the
amount of successful days, as we want to know the
percentage of successful days. And we already have this
value in the "Done" column. Now when we know
the formula itself, we only have to add it to
our Trackers database. Okay, work is done. We have percentage calculated. Let's add some beauty. This long numbers look confusing. To get rid of
this fractional part, let's round percent number
with round() function. This function returns
the rounded version of the number you put inside. So just wrap with it the whole formula construction
and enjoy the result. Okay, now both "Done" and "% Done" column values are
updated accordingly. If I make changes to
the tracker days. We are done with this lesson. Now you have everything to easily get rid of
"property is not a Number" error and the habit tracker system has
become a little bit smarter. In the next lesson, we are going to add some visual magic. I mean, dynamic progress bars, progress bars add readability and make Notion systems look
much more appealing. So I'm impatient to show you its capabilities in
the next lesson. See you there.
7. Text and progress bar: Welcome back. This
lesson is going to be very practical here you have an opportunity to learn how
to create a progress bar in a database to visualize the progress of any
Notion document, no matter it is a habit
tracker or a working project. Also in this lesson, you will learn how
to concatenate text pieces in Notion formulas. So let's start. First of all, let's prepare the emoji for our progress bar. Here are the emoji codes that
I use for the project. You can find them in emoji menu. Depending on
the operating system, you have to use a combination of hotkeys to get
access to this menu. For Mac, it is
Control + Command + Space. If you have troubles
accessing the emoji menu, you can just google
the codes and copy the emoji from the
search result page. We will need ten
black squares in a row. Anyway, I suggest
to find out how to access the emoji menu on your system as you might
want to use them a lot in order to create
appealing Notion systems. I placed the emodjis
under the Trackers table. If you have troubles adding new Notion blocks under the Trackers tables,
do the following. Create a new page for
habit tracking system, return to the
initial page and move it to the new one you
have just created. Navigate to the upper level. You should appear on the
newly created page and make the nested page turn
into inline database. Now you should be able to add
new blocks under the table. The problem is related to the way you created
the database. It's very likely that instead of adding a nested table block, you converted the whole page to the database by clicking on one of the Notion suggestions. Now we're going to
learn a new function which will help us to
build a progress bar. This is slice() function. Slice() cuts a part from a text piece that we give to slice()
in the first block. And we can tell this
function where to start slicing and
where to end it. Text pieces or strings
consist of symbols. Every symbol in a string has its sequence number.
0 for the first symbol, 1 for the second, etc. Similar to floors numbering, which starts from 0
for the ground floor. We can use the sequence
numbers to tell Notion where to start and where
to end string slicing. Note that Notion understands these numbers as
before which symbol it should start slicing and before which symbol it
should end slicing. Thus the symbol mentioned in the second block will be included in the
resulting slice. And the symbol from the
third block will not. After the slicing Notion will return this part of the string. It will contain the 0 symbol S and will not contain
the symbol O, which is of number 8. I want to only get the
last word in this example, I have to instruct slice()
function this way, providing 11 and 18 to the second
and the third blocks. Note there is no
visible 18th symbol, but we refer to it as if it were there in order to get
the tail of a string. Actually, we might only tell Notion about
the second block. Notion will understand
that we want a tail and will give
us what we want. Okay, remember we have a
sequence of ten black squares. It's time to slice them. Let's copy them and add
a new Formula column. The string to be
cut should go to the function as the first block. Let's paste it right after the opening parenthesis,
quotes are required. Quotes is the way to tell Notion that we are
typing a string, not a number or something else. Black squares look
like a solid line. But Notion understands
that under the hood there is actually a string
consisting of ten symbols. Starting point will
always be 0 and ending point will dynamically change depending on the
percentage value. It means that we don't have a particular number that
we can insert here. We have to figure out it first. For now let's insert 10
as the third block. And I invite you
to think on what should eventually be
inserted here instead of 10. First of all, we should
decide which amount of squares we want to show for
different percentage ranges. I want to do this way. 0 squares for 0 progress, 1 square for the progress
in range between 1 and 10, etc. For every
of these ranges, Notion should do
the slicing with different values for
the third block. And we should take
care of transforming the percentage ranges
to the desired values. For this purpose, we will divide percentage value of property
"% Done" by 10. And round up the result. With this approach for the
range between 11 and 20, we will always get 2 and right the same way for all
the other ranges. To build this formula piece, we will use slash for
dividing and ceil() function, which works the same way. round() function does with the
only difference that ceil() always rounds the value up
to the next larger integer. That's how it deserved
its name: ceil() from ceiling. This piece of formula goes at the third block to the slice()
function instead of 10. Look at this. As soon as I
change a Checkbox state, I immediately see the changes
in the progress bar column. It looks nice already. Cool, but I don't
like that there is no special mark for 100
percent situation. Let's use the green checkmark we prepared it in the
beginning of the lesson for 100 percentage value. We will need if-statement here. Do you remember its syntax? The first block is for the
question or condition. The second block
is four yes-case, and the third block
is for no-case. In our case, the question sounds like 'is "% Done" column equal to 100?' for yes situation we want to see the green checkmark,
for no situation. We want Notion to use the construction with slice()
that we have just built. Do you already have an idea of how this if-statement
would eventually look? I suggest you to pause this
lesson and try to update the progress formula with
if-statement by yourself first. Okay, here we go. We use prop() function and
the "==" operator in the question to check if
"% Done" column value is 100. In the second block, we just use a quoted
green checkmark symbol. And note the way I
updated the formula. Let's use the fast-forward trick here. I will do it again. Notion
doesn't format formulas, so it's quite difficult
to realize what is going on if a formula
gets quite long. That's why as the first thing, I type a formula skeleton and place the existing part
to where it should be. Now, it is much easier
for me not to lose any comma and finish the
formula with less confusion. Okay, we are done with
the hardest part. Let's add some final details. I want to see percent
value separated by a space symbol right
after the progress bar. To put together the progress
bar, a space symbol, "% Done" column
value and percent sign I will use a
plus sign. Surprise. Surprise! plus sign
may be used for both summing up numbers and
concatenating text pieces. Okay, let's try to concatenate all the pieces in the
formula with the plus sign. Note that if you use a
particular text piece, you should always
surround it with quotes. So that Notion could
understand that it is a text, not a function, not a
number or something else. In our case, I'm talking about a space symbol and
the percent sign. But we could have text piece consisting of many worlds here. And look what happens. Notion tells us about an error "type mismatch
property is not a Text". "Oh my! Notion is
so annoying with these types!" you might
think and you'll be right. The thing is that for Notion, it looks like we want
to concatenate strings, but it also see the number
among pieces for concatenation. Look to the properties
list. Notion Considers "% Done" column as a Number. Plus sign is used for both summing up
and concatenation. So it's crucial for Notion to
avoid any ambiguity here, the pieces you use with
plus operator must either be all of Number
type or all of Text type. You can't use a
mix of numbers and text pieces with plus operator
in Notion formula. Do you remember toNumber()
function which makes Notion to think of any value placed
inside of it as of a number? There is a function to
do the same for text. We can make Notion think of any number as of text
using format() function. So to finish our formula, Let's surround "% Done" property reference with
the format() function. Congratulations! You've finished the
progress bar formula, and once you check all the days, you see the green checkmark in the progress bar property and feel very good about
your progress. Actually, not many habits are supposed to be tracked daily. And later in this class, we will update the
system in order to support non 7-days habits. Well now you're able to add progress bars
to your systems. You may copy the
formula we created and replace "% Done" with the name you have for percentage column in any of your Notion systems. I'm very glad you managed
to come to this point. In the next lesson,
you will learn the power of Relation
property type. So see you there.
8. Relations: Welcome back. In this lesson, we will talk about connecting different Notion databases with the help of Relation property. After finishing the lesson, you will know how to connect database documents and
why would you need it? In the practical part, we will create two
more databases, one for weeks, another habits and connect
trackers records to corresponding habits and weeks records. Relation property type. Have you noticed a Relation type among other predefined
property types? We are going to talk
about this one. Note that it is placed in the advanced section
together with Formula. But Relation is
much easier to use. This property type allows us to link records from
different databases. Let's assume you
create videos for other people. To organize
your working process, you could create
one database for your video projects and
another one for your clients, and then add a Relation
column to connect them. Choose the database name
to configure the Relation, you can find a database name
here in the upper left area. Once you add a Relation
to a database, mirroring property will be added to the connected database. You can rename
Relation properties same way as any other property. In fact, a Relation column is kind of a bridge to
another database, which gives you
the possibility to connect any particular
document of one database to one or more particular
documents of another database. Let's add some connections to the example with video projects, you can see, once I add a
connection to one database, it is mirrored in
another database. Actually, you could even connect records of the same
database to each other. For example, if you
have a tasks database, you might want to link a task
to the ones it depends on. But what is the benefit for us? First of all, Relations help you
to reduce the amount of data. It's very likely that
client data would contain some contacts info.
Like email or something. Let's imagine I decided not to mess up with Relations and put all the data about
video projects and clients into
the same database. In this case, I have to
duplicate client data to every video projects
with the same client. If I make a mistake or
an email is changed, I will have to do a lot of
updates to fix it. Okay, In this example, I could pull together all the
necessary records by appropriate search query and do the batch update
for all of them. But it's not always the case. And still this method
is error prone, at least because I could
input email with mistakes for some records in the
first place. With relations. I can store emails in the corresponding
clients documents. If any changes happens
to clients info I have to update it once, I can easily go
from a project to the corresponding client
to find the email. And if you still want to see email column in the
project database, it is doable with
Rollup property. In the next lesson, we will talk about Rollups in details. In addition
to getting rid of duplications and unnecessarily tedious
work Relations are indispensable when it comes to making
calculations and analysis beyond one
particular record. And while you may be
more or less satisfied with formula capabilities for doing analysis
within one record. When it comes to analyzing
several records in a database, you will definitely need Relations together
with Rollups. For instance, if I track time spent on every task
for my project, I will wonder how much time I spent for the whole project. What is my total income from all the video projects I made
for a particular client, I may track my spendings and be curious about my average
restaurant bill. You will see several
examples in the next lesson, which will bring us deeper
into the Rollups topic. And now let's have
some practice with Relation property type
in the class project, every tracker
document pertains to one particular habit and covers one particular
week timeframe. If I didn't want any
analysis, any history, I would be satisfied with having this single
table and I would just clean it up and adjust the records in the
beginning of every week. Or I could have a clean table as a template and duplicate
it for every new week. But I want to show you
the power of Notion. So we're going to
add some complexity. Let's create a new database for habits and add to it
a Relation property, connecting Habits
database to Trackers. Now let's add habit records and connect them with the
corresponding trackers. You might wonder, what is the difference between
habits and trackers? Well, while the habit is
more about routine itself, trackers are about
your progress for this habit within
particular time-frames, weeks in our case. And it is supposed that
after a week is finished, you add a new tracker record for this same habit to continue
tracking the progress. Eventually one habit will have more and more trackers
connected to it over time. In the next lesson, we will start building
the statistics for our habits based on the
connected trackers data. And you will see the benefits
of this connections. Okay, now we have
several trackers looking very similar
and it's hard to understand what
is the timeframe for every particular
tracker. To fix this, Let's add a Weeks database with Relation to the Trackers. Okay, I will add current week
and several next weeks. You can use any week
names you like. I prefer to add with
numbers to the names. Now we may connect trackers
to corresponding weeks. Moreover, we can
filter the records to only see the ones connected
to the current week. By the way, if you already
have weeks database in Notion for tracking
weekly tasks, insights or something else, you might want to connect
these existing database with Trackers to also see the habits you work on within
a particular week. Okay, we're done
with this lesson. Now you know what is a Relation property
for and how to add one. We have also added
two new databases to our Notion project and
link them to the Trackers. In the next lesson, we will cover the
missing piece of the puzzle for understanding
the power of Relations. We will talk about Rollups. I'm waiting for you there.
9. Rollups: Welcome to one of the
most exciting lesson of this class because we're going to talk about Rollups here. What is it for and
how you can use it. In the practical part, we will add several
Rollup columns to our databases in order to see some basic statistics and add support for non
7-days habits. Rollup property type. Rollup is one of the
advanced property types. To explain the possibilities
of Rollup column, I will use this example with video products produced
for different clients. We may think of Rollup column as of a Relation
property enhancer, Rollup column cannot
work by itself. It always needs a Relation
column to work on base of it. And while the Relation column connects the whole
rows to each other, Rollup allows you
to get a peek at a particular cell of
the connected records. So Rollup column is
kind of a spy column, which tells you about the changes in connected
cells in real time. To configure Rollup column, you have to set the
Relation column to be used as the base and tell which exact property of related records
you want to show. Actually, you might want
to not just show them, but to do some calculations
based on them. In this example with
projects and clients, I will configure Rollup
to show the income for all the projects done
for a particular client. The Rollup cells only show the numbers from
related records. If I delete a record from
the relations list, it will immediately affect
the output of Rollup column. And important thing
to know is that you cannot edit any data
in Rollup cells. Rollup only shows you the value stored in
another database. All the calculation done
based on that value. The value itself may only
be changed in the source. And once I change income amount in video
projects database, the changes are
immediately propagated to the Rollup cells in
the clients database. Let's add some magic to
the Habits database. Every habit has a bunch
of related trackers. Every tracker has a progress defined as percentage
of checked checkboxes. Rollup will help us to
calculate minimum, maximum, and average value based on all the trackers related
to every particular habit. Let's start from average at Add a new Rollup column and configure it to use Trackers Relation as
base, "% Done" value as property and Average
calculation mode. Easy, right? Now, let's do the same thing
to Min and Max values. Cool. Now we can see this basic stats for
every habit. Good enough, but you already know how
to create progress bars. Why not to add some? I recommend you to
pause this lesson and try to add the next
columns by yourself first, and then return to the lesson. Ready to check yourself? Okay, let's start from the
progress bar for average. Actually, I'm going to
copy the formula I've done for Trackers and replace
the percent column name. Quick and easy. This technique saves
a lot of time. It's good to have a library
of formulas you like and use often to not write them from
scratch every single time. The only thing I
have to add here is rounding the present number.
In Trackers database. present number is rounded by
the "% Done" formula. However, I don't have a way to make Notion to
round a percent. which it calculates for
me in the Rollup columns. So I will add the round() function to the
progress bar formula. We will do the same way with
Min and Max progresses. Okay, It looks
better now. Actually, we may even hide
the properties with initial percent numbers as
progress bars look better. It is possible to show previously hidden properties
via database menu. I will hide the
trackers links as well. You can also hide stats, percents in a habit page and rearrange the properties
in the way it looks most attractive and
readable. Notion still knows the hidden
properties are in place. Just hide them from you and actually you can still access
them anytime you need. This adjustments affects all
the pages in this database. So if you.open
another record, you will see the same
properties hidden and the order of visible properties will be the same for all the pages. But it doesn't affect the view configuration of
the database itself. I mean here, on the higher level. Let's add a progress bar
column for average progress of all the related trackers
for the Weeks database. Now we can see the
average progress for all the habits within every
particular week timeframe. Rollup properties work
in two directions, as long as we have
Rollups based on connected trackers data
in the Habits database, we can have Rollups based on connected habits in
the Trackers database. Let's use this possibility
to make the system a little bit more flexible and support
non 7-days habits. Currently, the progress of every particular tracker is calculated in "% Done"
formula. This formula uses
hard-coded value of seven days to
assess the progress. Obviously, some habits are
supposed to be less intense. So it would be nice to set a different weekly goal value
for non-7 days habits. If we lived in the world
without Notion Rollup, We would have to add a column, go to Trackers database and fill it manually for every
single tracker. But with Rollup, we can set this value once for every habit and then get the value of corresponding habit
in Trackers database. So let's add a goal property of Number type to
Habits database and add a corresponding
Rollup to the Trackers. I will fill this property
for some habits. And now we have to update the "% Done" formula so that it uses goal value instead
of 7 if it is not empty. Let's take a closer look
to this new if-statement. First of all, empty()
function is new for us. This function is pretty easy. You place link to an existing database property
inside of the parenthesis and the function
returns either false if the property has some
content or true. If not, if you add NOT
operator to empty() function, then result is the
opposite: true for the case when the property has
some content and false if not. You can think of
this as of the question, is this property not empty? Or does this property has content? In the context
of our if-statement the answer to this
question leads us to either yes-block or
no-block. Notion eventually replaces
the whole if-statement with the value of "Goal"
property or 7, depending on the answer. Note that I use
"Min" Rollup mode. Why? Because I want Notion to
think of this column as of Number type. In "Show
original" mode, which is set for Rollup
columns by default, Notion implicitly
thinks that Rollup contains textual value
because if there is more than one connection all the values will be listed
being separated by comma. In this system, one
tracker is supposed to always be connected
to only one habit. But Notion has no
idea about this. "Min" mode makes Notion
show only one value: the minimum one. And Notion
knows for sure it's numeric. That's why I can use it as
a number in any formula. And I know for sure that this
"Min" value will always be chosen from just one candidate of the single connected habit. So this mode serves perfectly here, Actually "Max" and "Avg" would serve just the same
way in this case. By the way, these modes are only available for
numeric columns. So if I create a Rollup for
another habit database column, let's say habit "Name", I will no longer have
this "Min" mode available. So Notion wants to
be pretty sure about column types and tries to restrict you whenever
it's possible. The final adjustment should
be done for progress bar. As now we can face the case with more than 100% progress
for a tracker. An easy way
is to change "equal" operator to "higher
or equal" operator. Or you could emphasize this big success
with another emoji. Like a star for instance. Same change should be applied to all the progress
bars in the system. Okay, We're done
with Rollup basics. Now you know how to add
simple calculations over several records and
your project gives you some statistics about
the habits you track. Now the project supports non-7
days habits and you can set custom weekly goal
for every particular habit. In the next lesson, we will get familiar with Date property and add
some more updates to Weeks database. Okay, see you there.
10. Dates: Welcome to this lesson. Here we will talk
about Date property. We will add week start dates
to our Weeks database, and then we will learn some formula functions to
work with the date type, we will use this new
functions to update Trackers database formulas to calculate the progress for only
current and past weeks. I will explain why we need it. Let's start. Notion
support dates in database pretty well. There is a special property
for storing dates. This property type
allows to either set a single date or a range
with start and end date. The great advantage of Notion
is possibility to configure date based views such as Calendar
and Timeline. Calendar. In a Calendar view, we may specify which
exact date property should be used to
build the calendar. We can also drag and drop database records
over the calendar, the underlying
date property will change accordingly
for date ranges, Notion will expand
the records to cover all the days included
in the range specified. Calendar view covers a lot of use cases, tasks or projects deadlines, team members vacations management training
plan for a marathon, etc. Timeline. Timeline view is another way to represent
calendar related data. It makes much more
sense for date ranges than for a
single date value. On Timeline view, we may
specify property sources for start and end dates and
then see our records stick to a corresponding
timeline, kind of Gantt diagram, perfect for project
timelines visualization. Let's return to a
Table view for now. If you haven't added a
week "Start Date" property yet I suggest you to do
it right now and fill this property with the
corresponding values for several future weeks. Now let's talk a little bit of how Dates can be used in Formula. Let's start from the
easiest function. now(), this function always returns the current
date and time, and it doesn't need any additional arguments
inside of parenthesis, but we still have to use parenthesis even
if they are empty, because this is the way to tell the formula that we
mean a function. And functions are
always followed by parenthesis with or without
arguments inside of them. So to get the current
date and time, you don't need to have it held
in some property. You can always just call
now() function in your formula. Why would you use this function? There are a lot of cases. Let's take one of
them: calculating time remaining to a
project deadline. For this case, we have
a date property with deadline value set and
the formula property, which should show
amount of days between now and
the deadline date. There is a special
function for this purpose, dateBetween(). In the
first two blocks, you have to specify
the dates: deadline property and now()
function in our case, in the third block,
you have to tell which time measurements
should be used here, years, months, weeks, days, etc. The chosen mode
should be quoted. Let's check the result. If deadline is passed, we will see a negative
number of days here, okay, time to practice. And within the practical part, Let's take a quick
look at how notion supports Date properties
within Rollups. Let's pull a corresponding
weak "Start date" value to Trackers with the help
of a new Rollup property. Note, that Notion
has several date specific modes for a Rollup
built over a Date property. If for some reason we had several weeks connected
to a single tracker, we could ask Notion to
choose, for example, the earliest or
the latest date, or an approximate
range between them. Let's use "Show original" for now and see how Notion works with Date Rollups in "Show original" mode in the
Formula property. Note, it doesn't think of
it as of a date. Notion, thinks of it as of Text. It is common Notion behavior for Rollup in "Show original" mode. This mode is supposed to
be used to show a comma separated list of related
records property values. And we have only one week
connected to every tracker. That is why we only have
one value displayed, but potentially we
could have more. And sometimes you might
get stuck in building some formula over Rollup
property because you expect the formula to see Rollup as
a date or as a number, but it is perceived as Text. And often you only need to
change the Rollup mode. In our case, we're
going to always have only one week record
connected to a tracker. For the next week, we will have a new tracker. So in order to make a Formula, see this Rollup
property as a date, we can change the mode to either earliest or latest date, the result will be the
same because there is always only one
day to choose from. Now let's check the
formula editor. Our Rollup property is
perceived as a date, which means we can work with this property as with
Date and apply date specific formula functions. Few words on what we are
going to do right now. Currently, there is
a bias in habit stats. Average, Min and Max
progress values are calculated over all the
trackers connected to a habit. No matter it is a past week tracker or
a future week tracker. And if I add new trackers
for the whole month ahead, it may affect drastically
the stats values. But if we had empty "% Done" values for all the incompleted
trackers than statistics Rollups would not take
those values into account and we would see
the correct stats numbers. I still want to see
"% Done" value for the current week in
order to get progress bars built for the active
trackers and see how the average progress is changing in the
current week record. That is why I decided to add
a new property which will only show % done value
if a tracker is completed. Let's think of the
if-statement for this case. If tracker is completed, then show percent of checked checkboxes, and show nothing in the opposite case, how can we understand if
tracker is completed? I will give you a clue. Now that we have a "Week Start Date", Rollup in Trackers database. We actually can calculate how many days have
passed since this date. Obviously, if the amount
is more or equal than seven, then we can say that
the related week is over and this particular tracker is
considered to be completed because the week passed. And we already know how to
calculate the amount of days between two dates dateBetween() function
together with now() and link to the "Week start
date" property in days mode. And to compare the
resulting value with 7, we will use greater
than or equal operator. Let's go to the second block. This one is easy. We already have
percent of checked days, calculated in the "% Done" property. So we just mention it
here and the last block, empty value for the case
when "Week start date" is either in the future
or on the current week, empty value may be defined by two quotes without any
content between them. But there is a requirement
for if-statement that both yes- and no-cases
must be of the same type. And while we have a yes-block
to be a number, no-block should also be a number. So let's round two quotes with a toNumber()
function in order to force Notion to perceive
it as a number. This is a weird
trick, but it works. Let's type the final formula. Now we have to update
Habits database to use the new property
for stats Rollups. Done. Okay, we're done with
Date property type. In this lesson,
we've got an idea of date based view types,
calendar and timeline. We've learned some date
specific functions and how to pull date value as a Rollup
property in different modes. We also have added two
updates to our project. Now, every week in Weeks database has a
starting date specified and stats bias is fixed
with the help of new formula property
in Trackers database. In the next lesson, we will learn filters and
sorting and start to configure database views so
that they would serve in the context of habit
tracking, waiting for you there
11. Views I: Hello again. In this lesson we are
going to learn how to customize your database views
with filtering and sorting. Also, we will configure several views for our
project databases. First of all, let's
talk about views. In fact, Notion database
view is the set of rules for displaying
Notion database content. Every view setting includes
the view type, a table, board, list or another
filtering and sorting rules, list of properties to show and their order. And several other
settings such as subgroups, amount of initially
loaded records. Views allow to show the data
in the best possible way for every particular purpose. You don't need to update the settings every
time you need to work with the database
data in some specific way, you configure a view once
and then just use it. Within this lesson, we will configure several
views for our system. Let's start from the
Trackers database. Obviously, now it's not very
friendly for the purpose of tracking the progress because all the
trackers are visible. In fact, I only need to see the trackers for
the current week to be reminded what I'm focused on and
input the progress. So I will need a view for
the current week trackers. Also, sometimes I will input the progress via my cell phone, not via my laptop. So let's create a separate view "Current
week | Phone" for this case, because I know from my
personal experience that views for a laptop
and for a cell phone. for habit tracking in Notion should be a little
bit different. Okay, now it's time to
configure these two views. Let's start from the "Current
week" view for a desktop. In order to make visible all
the current week trackers, we will definitely
need a filter. Filters are the
rules to check if a database record is eligible
for being visible to you. These rules are supposed to be set over the
database properties. For instance, I can configure
the filter to only show me trackers related to
Meditation habit. Filtering rules may include
several properties. I can configure it to only
show me the trackers for Meditation habit
with 100% progress. If you need to specify a
filter with OR condition, then you should use an
advanced Notion filter. Advanced filter allows to choose if records should meet
all of the restrictions, or one restriction
would be enough. For instance, a dumb example, I might want to see
the trackers which have either Saturday
or Sunday checked. In this case, I will see all the records which have
at least one weekend day checked. Filtering
groups allow you to add more complicated
and nested rules. Also, depending on
the property type, you may find flexible filtering
options. Like checking if a textual property contains some string or comparing
operators for a Number. There is a batch of cool
options for Date filtering. Remember that filters
cannot delete any record. Filters only can hide them in this particular
database view. And once you clean
up all the filters, you get all the
records to be visible. Also, hiding the records
by filters doesn't affect their visibility in the connected records
from other databases. Like if I open a habit record, I can see all the
related trackers, no matter which filters are applied to the Trackers
database right now, in any of the Trackers
database views. Filters just help you to find quickly or show all the
records you need for any particular purpose
without having to do this tedious work of checking every single record
in the database. One more thing you
should know about filters is that if you add a record while
filter rules are enabled, then, if possible, this new
record will be automatically updated by Notion to be
eligible for being visible. For instance, if I filter out the records based on
the related week and add a new record
it's automatically connected to the week
mentioned in the filtering rule. Note that this
trick doesn't work. if a filter rule
is configured based on a Rollup or a
Formula property. Okay, time to apply
this new knowledge to configure the "Current week" view for the Trackers database. The straightforward way
to accomplish this is to set week property to match
the current week record. This will work. But it has a drawback. I have to update the filter every new week to align it with an appropriate
week record, it would be much better
to have a kind of dynamic filter which is configured once and
serves forever. Let's play with "Week
start date" Rollup property and check the
filtering options for it. Notion provides a variety of filtering options
for the Date type. It allows to specify time
ranges quite flexible. And values available
for matching the properties are not
just static dates, but dynamic date options. To filter the records with
"Week start date" within the past week will
suit the best for our purpose. With
this configuration the view will always
show trackers connected to the week started within
the past seven days, no matter the exact today date. It also makes sense to hide all the columns that you don't
want to see in this view, I will leave days, "Goal" and "Progress" columns. "Current week" view is configured. Let's go to the next one, Current week view for a phone, the filter should be
configured the same way we've just done for
the previous few weeks. Start date is within
the past week. And now let's apply xome
adjustments to make ticking Checkboxes from your cell phone screen
more convenient. First of all, it's better to place fully narrowed Checkboxes
to the left side. You can make Friday column
a bit wider to separate visually the weekdays and then place either tracker
"Name" or "Habit" column, "Goal" and "Progress bar". Thus on your phone screen, you will see at least
part of habit name and all the Checkboxes to
quickly input the progress. The view for cell
phone screen is ready. We can delete the
initial table view. We're done with updates for the Trackers database
within this lesson. Now you might wonder, how are new trackers supposed
to appear in this database views and how you can see the progress for
the past trackers. The views we have just
created will only serve for tracking the progress. In
the lesson about Templates, we will add possibility to
check the past trackers progress on a page of related
week or a related habit. In the lesson about
Linked views we will create a separate
habit planner page for adding new trackers. So don't worry,
eventually we will collect all the pieces
of the process together. Now let's move to
the Weeks database. After some time of
using the system, we will have more habits
and Weeks database will disappear somewhere
on the bottom. In order not to lose it there, I suggest you to move the Weeks database
to the right side. Notion supports a columned
layout for its pages, you can easily drag and drop Notion blocks to
create a new column, but you can't do this
with a database block. So we have to use, for instance, an empty text block in
order to create a column. And right after that, the Week database can be
moved to this new column. Obviously table is not the best possible view
type for this situation. Gallery cards will serve
much better here. We don't need preview here, and let's adjust the card size. This preview card and
card size setting options are only available for
Gallery and Board view. Now we turn on the displaying
of necessary properties. Let it be the week "Start date" and the average progress. I think it would be nice
to see the amount of habits that we work
on every single week. To display this data, we have to add a Rollout, which calculates the amount
of connected trackers, which is equal to the amount of the habits that we work
on every particular week. And with the help of a Formula property and
text concatenation, we create a string
with trackers or habits amount and enable this new property on
the gallery cards. Note that we don't need a table
to create a new property. You can do it on the page
of any database record and all the new properties will
appear for all the records. You might notice this
NaN% values instead of progress bars for
some habits and weeks. They appear because
for this records, we don't have stats numbers. Stats
numbers are missing if there is no trackers
linked at all, which means there is
no base to calculate the statistics on. Or
in case of habits if all the connected trackers are linked to the future weeks and thus have empty
"% Done | Completed" property. So Rollup doesn't have any
numbers for calculations. To get rid of this NaN% values, we can add one more if
statement to the formulas. This statement will check if the corresponding
percent column is empty. If yes, we will get an empty
string instead of NaN%, otherwise, a proper progress
bar is built as before. So, add this new if-statement to the existing progress
bar formulas in every column with this
disturbing NaN% problem. Just remember to use the correct property reference
with percent value: either Avg or Min or Max. Obviously, we need
some sorting here, time to talk about
sorting rules. Sorting is obviously the way to set the order
of your records. Sorting works differently
depending on the type of a column for which you
apply a sorting rule. Let's try to sort the weeks by "% Avg" value
in ascending order, "% Avg" column is Rollup, but under the hood Notion, perceive it as a Number. That is why numeric sorting
applies here. For Textual property Notion
uses alphabetical sorting. Let's see how it
works for week names. Notion sorts the weeks alphabetically based
on their names. If I add a Week 2, it will go after Week 19. It happens because Notion thinks of week names as of Text, and it doesn't
compare the numbers, but compares characters
and digits one by one. The first characters are the
same for all the records. And once we get to
week sequence numbers, Notion compares 2 and 1, not 2 and 19. Sorting based on Date property
is quite straightforward. So the easiest way to set
the appropriate order for the weeks is to sort
them by start week date. Let's set it in the
descending order to see the latest weeks
bubbled up to the top. And I prefer to have here a filter to only show
the last month weeks. If you want to see more than
four or five last weeks, you may add a filter
for custom periods and updat it manually
from time to time. And let's rename
the views and put the gallery view to the top
to make it the default one. Okay, now we know
how Notions sorts textual, numeric
and date columns. What about Select properties?
In order to see how Notion works with sorting
for Select properties, let's move to the
Habits database and add a "Status" property to it. This column is for
designating which habits are just ideas which are to-dos in progress, sustainable,
or archived. Actually, you are free to add
the status you prefer. As we learned in the
beginning of this class, Select columns are perfect
for such cases when we have a limited amount
of value options which are supposed to be
used by many records. Now, let's apply a sorting rules for this new status column. As you can see in
this case Notion, do the sorting based on the
order of Select options. You are free to
change the order of the options based on
any logic you have, like here ordering "Status"
in its natural cycles, looks to be the best and quiet
intuitive solution. Okay, we are done with
filters and sorting. We've got several new views for the Trackers and
Weeks databases. We've also learned that
Notion allows you to use different filtering and sorting options depending
on a property type. And we will continue
talking about views in the next
lesson where we will create a board view with habit guidelines for
our Habits database.
12. Views II: Hello again. Here we continue talking
about database views. We will mainly talk
about Board view here and configure "Guidelines"
view for the Habits database. Theory
and practical part are very interconnected
in this lesson. So remember, every time you see the hammer sign
somewhere in the corner, consider it to be
invitation for you to join me in updating
the class project. Now, let's adjust the Habits database view so that
it become really helpful for us in the context of daily work on our
habits progress. First of all, habit records definitely miss some
important information. I mean the detailed guidelines. Some habits may be
added to the system as ideas long before you
start working on them. And it would be nice to
have a special place to add some instructions and maybe
a source of this idea. And while working on habits, we usually need a lot of energy to develop
this new behavior. And it makes the process so
much easier to just follow the strict instructions
instead of trying to figure out what exactly
is supposed to be done. And in the context of
daily work on our habits, it would be nice to see
the guidelines for in-progress habits in
our Habits database. So let's add a new text
property for guidelines for our habits and fill it for
every habit we have here, I will use what-when-where schema, you are free to either
use it with me or implement another one
that you like more. Two tips that I want
to share with you here. The first one is possibility
to format the text in a Text property just the same way you can do it
outside of databases. And the second one is
starting a new line within one textual property by using the Return key while
holding the Shift. Okay, we're done
with guidelines, but it doesn't look quite
pretty as a table. I think to see them as
cards would be much better here. We have two view
types for displaying records as card:s
Gallery and Board. Gallery would suit
perfectly for our purpose. But Gallery view has limitation. It only allows to
show a short part of record properties content
in one-line mode. While Boards allow to show the whole content of
record properties. So we're forced to switch to Board view in order
to see records as cards with the habit
guidelines fully visible. In the context of daily
work on our habits, we probably don't need any statistics beyond
the current week. So let's make sure only the "Guideline" property is
enabled. And it also makes sense to filter out habits which are not relevant
for us at the moment. So let's add a filter to
only show the habits with in-progress status in the
context of guidelines view. We actually don't need a
drag-and-drop feature and this columned layout doesn't
work quite well here. But because Gallery cards don't display the full
guidelines content, let's see what we can do with all the Board
settings options. One of the options is
to group habits by status and only leave
in-progress column visible. But in this case
we have a lot of empty space in the
middle of the page. And another option
is to group habits by their names and
disable empty columns. This is important here. In this case, every
habit will be placed in its own column as long
as every habit name is unique and it's very
likely that we will not work on dozens of new
habits at the same time. So probably if we have to scroll to see the
guidelines for some habits, it will not be a long scrolling. We also can hide the guidelines
that we don't need, change the order of columns
or change the size of cards to a small one to get rid
of horizontal scrolling. I guess there can be several dozens of habits that for
track at the same time, but it's very likely
that a big part of them will include
sustainable habits. And probably we don't need guidelines for sustainable
habits that much as for fresh or in-progress ones. The last adjustment
that we will do here is a card preview. Both Boards and Gallery views allow to configure
card previews. We will learn how to
configure card previews on the example of our
"Guidelines" board view, but it works just the same
way for Gallery view as well. Notion allows us to provide previous pictures in
several different ways. It may be configured
through database settings, "layout", and here it is:
"card preview" drop-down. "None" means no preview at all. Page cover will
force Notion to use picture which you set
as the page cover. You may upload your own image or use one from the
predefined libraries. Let's use Unsplash library here. Unsplash allows you to use
keywords for image search, which is pretty convenient. Let's go back to upper level. Now we have an image
for Meditation habit. You also can use page content
as source for the preview, in this case, not only image but any other page content will be
displayed on a record card. Not the whole page, some top blocks, depending
on the card size. If you have a database
for your tasks, you might find it
convenient to use page content as preview
to show subtasks. They're not clickable on
the cart itself, but still, it allows us to see a task
workload at one glance. And the last way to configure
page preview implies adding a database property
with Files & Media type. The properties of this type
appear in "Card preview" drop-down and maybe chosen
as the preview source. This property
allows us to attach any type of files to
our database records. So they might be used for
a wide range of use-cases, but now I will use it just for uploading an image
for card preview. Let's go back to
upper level. The image I've uploaded
is in place. Okay, now I will delete this Media
property as we're going to use page covers as card
previous in the project. But you are free to choose
the option you like the most. You might want to disable
the "Name" property as names are already placed
on the columns top. Let's rename the board
view to "Guidelines" and delete the table.
We won't need it here. We're finally done with the "Guidelines" view
for Habits database. Okay, now you know how to create custom views for your
Notion databases. And actually main
page is ready to be used in the context of
daily habit tracking. In the next lesson, we will add a habit planner page in order to be able to maintain habit workflows and add new trackers for
the future weeks. So I'm waiting for you there.
13. Linked views: Hello again. In this lesson, I will show you a very
powerful Notion feature, which allows to create
complex dashboards and customize your
pages depending on the context I mean
Linked views. And we will apply
this knowledge to create a habit planner
page in this lesson. Let's dive in. What is Linked view in Notion? Let me explain. When you create a
database block, you create a home for both data and its views. Under
the data I mean database records and
their properties and view is the way to display
them. From scratch you have an initial table view and you can add as many views as you need later to see the
same data in different ways. So data and views live together here in
the Database block, but there is another block -
Linked view of database, which is a home for views only. This block
doesn't store any data, but allows us to invite
any other database data. Look at this block. It looks pretty the same as the original database
with the only difference: it has this arrow sign to the
left of the database name. We actually can hide it. Now the only way to
understand that it's a Linked view and not a database itself
is to open properties. There is possibility to specify the source for Linked view.
For the database itself the source is always its data
and you can't change it. Actually, Linked
view block allows us to add several views just the way a regular database does. With the only difference
that in Linked view block, you can add views for
different databases. You can work with data
in Linked view block just the same way you do it
with the regular database. You can add, edit,
or delete records, making changes to data
through a Linked view, you affect the original
data, not its copy. So you will see the changes
in the original database. You may add many linked
views for the same database. Important thing to remember: if you delete a linked view, you only delete the bundle of views that you have
configured in it, and you don't delete
the data itself. But if you delete a
regular database, both its views and
data will be gone. So it's important to
be very careful here. What could be the use
case for Linked views? As an example, we
might want to see today's and tomorrow's tasks as two lists on the same page. Or we might want to see
the same database on several different pages built
for different workflows steps. Like on the
task planning page, I might want to see a
Kanban-board or Calendar. And on the action dashboard, I just want to focus on
today's tasks. In our system, Linked views may be
used to add a list of related trackers as a
content of a week page. This is an upgrade we will do to the project on our next lesson by the way. There
is another idea for our project that we're going
to implement in this lesson. This main page is supposed to be used within daily
work on habits. I didn't want to decide which
habits I should work on. Here. I want all the decisions
to be made beforehand and only focus on
making the progress and aligning with
habits guidelines. But obviously, I need an infrastructure for
making the decisions, for planning my habits ahead. And I would rather have it on a separate page configured specially for this
planning purpose. And I will definitely need views for Habits database in order to maintain habits status there
and views for Trackers database in order to add new
trackers for future weeks. And I will need a view for a Weeks database so
that I could verify if all the active habits have corresponding trackers for
current and future weeks. All of this is doable with
the help of Linked views. So let's create the habit
planner page together. I think the upper right corner is quite good place
for this new page. Let's add a title.
Planning board. First of all, let's add a
Kanban board so that we could easily maintain habits
statuses by drag-and-drop. To add a new linked view, we have to type "\Linked" and choose "Linked view
of database" item. The next step is to choose the source database.
Habits database in our case. Here you can either copy an existing
view or create a new one. We need a board, so let's create a new one.
Choose a board. And here you can play
with boards settings, I like colouring columns. "Group by" setting should
be set to status. I will live "medium" card
size and "none" card preview. Now let's adjust the
order of columns. We actually can hide the
one without status. Rename the view
to "Planning board". And I prefer to hide the title. Okay, now we can change habits
statuses quite easily. Note how the changes are reflected in the
original database, which only shows guidelines
for in-progress habits. So now I can visit this
page every Sunday or in the beginning of every month and update habit statuses. In the result, I
will have a list of habits that I
want to track. I mean the in-progress column. My next step is to add
corresponding trackers for every habit with in-progress status for the
next week or several weeks if I do the planning for the whole month
ahead, for instance. For this purpose,
I will add a linked view for Trackers database. And I have to say that
unfortunately there is no way in Notion to add all necessary
trackers in one-click. The brute force option
would be to set the filter for a
target week, the next one, for instance, and add trackers one-by-one linking them with
corresponding habits. We could add a small
update to this view in order to avoid manual
linking to habits. I'm talking about
grouping by habits. In this case, instead of
having a single table, we will get a
separate table with trackers for every single habit. And if you add a
record to any group, it will immediately
get connected not only to the week
mentioned in the filter, but also to a
corresponding habit. From my personal experience, this view is the
best possible option for adding trackers
on the phone screen, but it still involves this
one-by-one tracker creation, which is pretty bad. So I will offer one more
option for adding trackers. Before that, let's
spend a minute to get familiar with one of the coolest Linked
views mechanics. I will explain it through the alternative
planning board. Let's say I'm not
that happy with a Kanban board
suggested by Notion, and I want to
implement my own one. For simplicity, I will use
three instead of five columns. I add a Linked view
for To-Do column. Let's make it a list and add a filter to only
show to-do habits. I will copy this view to other columns and adjust
the filters accordingly. And here is the magic. If I do drag-and-droping
between these three views, I have my record
statuses changed. You can see it above
in the planning board. Why is it happening? Because of the filters. Notion updates record in
order to align it with the filter of the view to
where I put a record. And I also can do a copy
through duplicating or just holding my Option key
while doing drag-and-drop. And my copy will have all the same values like
the original record has, except for the values mentioned in the
filter, the status in my case. This
is magic. Really, I love this fissure so much
and I use it very often. But now I want to show
how we can use it to add a bundle of trackers instead
of creating them 1 by 1. First of all, let's create
a Linked view with trackers for building kind of a
draft trackers list. This view will have a
filter for records with clean progress and empty week. And now let's add a second view with the filter for
a particular week. I will delete all
the trackers for the future weeks to show how to add them with this new page. Okay, how am I suppose
to work with this views? At this point, we
may already have some trackers for ongoing
habits for the current week. This is my case, so I will add some progress to the current week's trackers
and update the filter in the right view to point
to the current week and copy all the trackers for in-progress habits
to the draft view. Note how trackers
have gotten cleaned. This is the magic
of the filters. To match the draft list to the in-progress
habits column. I will add manually a tracker
for "Morning walk" habit, as I don't have a source to copy from. And the draft
list is ready. Now we have to update the
right view filter to point to the next week and copy to it all the trackers
from the draft list. And if you plan for
several weeks ahead, just update the
filter to point to the desired week and repeat
the copying operation. Instead of manual
duplicating trackers, you can just hold
Option key while drag and drop trackers
to the right view. Thus, instead of moving
trackers between tables, you will create copies
in the right view. This draft list may live here without affecting any
statistics because our smart formulas.
"% Done | Completed" will always be empty for trackers which don't
have related week. So this value will
not be taken into stats calculation
in habit records. And when I come to this page in a week or two or in a month, I will still have this draft
list here to start from. I will make some status changes, delete obsolete trackers, add several new ones and copy
them to the next weeks. It's very likely that the
list of ongoing habits will not change dramatically
from week to week. It is really hard to start ten new habits in the same time. Usually I add from one to three new habits every
like three weeks and move some existing habits
from in-progress column to either sustainable
or archived column. So my draft list of trackers
usually need a few updates before copying it to the next weeks. To make
this page more convenient, I suggest you to add
several additional views. First of all, a few with the current week so that
you would not have to spend time trying to recall what is the number or a start
date of the current week. Let it be a Gallery
without preview, with medium-size
cards with only week name visible. To make the view to only display
the current week, we have to set the filter to "Start date" within the past week. And let's rename the view. And the view with in-progress habits as it's
a bit more convenient to have it here near the draft table instead
of scrolling to the top. I often add trackers for sustainable habits to make sure they're still sustainable. So I will show in this list both in-progress and sustainable
habits subgroups. Now let's rename the view. Actually, you can rearrange
the views the way you like. For instance, without
this collapsible headers. I don't recommend to place
anything to the left from the draft table as it makes harder the selection
of draft trackers. And in order to see in one place if next weeks
have necessary trackers, I suggest you to add
a Linked view for Weeks database with
the next configuration. It should be a Board
grouped by start week date. And by weeks. It is important to
hide empty groups, because we will apply a
filter which will make many columns empty and we
don't want to see them. Let's apply a filter to only show the current
or future weeks. We could rely on
Tracker names and make visible Trackers
here on the cards. But at some point, tracker name might be empty for some reason or it might be a bit different from a habit name. So it's better to
show habits which stand behind connected trackers. Currently there is no such
property in week records, but we can pull this
data by Rollup property. This new Rollup property should
be built over Trackers, point to their "Habit" column
in "Show original" mode. Let's enable this
new habit property and rename the view. We're mostly done here. Let's add some adjustments. If you don't like the
horizontal scroll in the planning board, you might make the card small. Then let's add some
colours to headings, Some columns adjustments to get rid of these
horizontal scrolls. The last section
may look a bit more colourful if we add icons
to the habit records. And why not to add an
icon to the page itself. Okay. The planning page is
officially ready. Now you can visit it
from time to time like every Sunday or every two weeks to plan your habits ahead. Or just set a reminder
for the next planning date. Probably it was the
hardest lesson. We have created a lot of stuff for the habit
planner page. And now you can see how powerful Notion databases together with Linked
views can be for building the systems which serve your personal needs. Notion is flexible to be adjusted
to your processes instead of adjusting you to
the soft limitations. Notion is kind of a LEGO constructor for crafting your own systems. In the next lesson, we will learn the last crucial
piece of Notion databases, I mean database Templates. It will be a short
and easy lesson. So please join me there.
14. Templates: Hello again. In this lesson we're going to learn how to boost creation of new records in Notion databases with the help of Templates. Within the practical part, we will add templates
to the Habits and Weeks databases.
Let's start. What is a database Template
in Notion? To understand it, let's go to the Habits database. Look at this "Guideline"
property values. They have the common what-where -when structure with
some colouring. Once I create a new habit, I have to add a new
guideline from scratch. But what if I had this base guideline
structure pre-filled? Actually, that's exactly what a database template
my help with. Let's create our first template
for the Habits database. To create a template, we have to go to the dropdown
menu on the right of the "New" button and click
on "+ New template" menu item. This page looks like any other Habits
database record page, but it's not a record. It's a Habits database template. The note on the top
proofs my words. Let's give it a name. I prefer to name all
the templates starting with T and vertical
line. A new habit. And let's add this what-where-when structure to the
habit "Gguideline" property. That's it for now. Let's test how it works. I will create a
new habit record with the help of this
new template. Look, the base guideline
structure is in place. And now I don't have to
fill it from scratch. There is the base structure. That's how Notion
templates work. They allow us to prefill
some record data, not only the property values, but also page content. Let's see how it works. That would be nice
to be able to see all the trackers related to a particular habit
on the habit page. Thus, instead of adjusting the filters on the main
page of our system, I could just open a corresponding
habit record and see all the trackers for this habit as it's page
content. Looks nice, but I don't want to add
these view manually to every habit that I already have and to all the habits that
I will have in the future. And that's the perfect case
to use a database template. So let's add an update to our existing habits
database template. We have to add a
new linked view for the Trackers database and configure the filter for the "Habit" property to
point to our template. And when we create a new habit with this template or apply it to an existing one,
Notion will adjust this filter to point to
the real habit record. Let's add a sorting
and see how it works. I will create a new
habit record with the template and
look at the filter. It points to the
new habit record, not to the template. I can even add new
Trackers here. They will immediately be
connected with this habit. Let's apply the template to an existing habit which already has some
trackers connected. To do this, we have to open an existing record and click on the template link
in the page body. And we can see all the related Trackers here in place, just several clicks. Note that it's only possible
to apply a template to an existing record if this record doesn't
have any page content, otherwise, you will see the page content instead of this
database template links. Also, applying a template to
an existing record doesn't affect the values of the properties that
are already filled. It only affects
empty properties. So if I have the guideline
property already filled, its value will not change
after applying the template. But if it were empty, it would get the value
from the template. To finalize the Habits
database template, I suggest you to add some more updates before we
move to the Weeks database. Let's adjust the Trackers
table to only show the data we need: day progress,
progress bar, and a week. Under the table there is a hidden menu for every
column which allows to do some calculations over all the records
shown in this view. Depending on the column type, you will see a different
set of options. So we can add the
percent calculation for checked days for
everyday column. And thus, we will see the statistics for
every day of week. And probably in some way
this information may help to notice some recurrent problems
with the habit behavior. Like for instance, you
may notice that you fail to do sports for
a lot of Wednesdays. And thinking of the
possible cause, you may find out
that your Wednesdays usually are full of work
meetings, for instance. And probably your meetings schedule conflicts
with your sporting habit because you are too exhausted in
the end of the day and maybe it's better to move your workout to the
morning time or to another day. Let's also add an average
progress calculation for the "% Done | Completed" column. Okay, they view is ready. Optionally, you may
duplicate this view and add a filter to only show the
trackers for the last month. Thus all the calculations
below the table will be done only for
the last month trackers, which allows to see the most
recent habits statistics. Of course, this view will
be empty for the habits for which you haven't added trackers covering the last month weeks. And now let's apply this template to all
the existing habits. To replace the
existing page content with the new template content, you can delete all
the old information from the page and apply
the template again. The new template version
will take place here. Let's move to the Weeks database and create a new
template for it as well. It makes sense to
see the table with all the trackers that we work
on every particular week, similar to what we have
in the habits template. But here we will
filter the trackers by the "Week" instead
of "Habit" property. It is possible to add
an icon for a template. The only thing that
can't be updated by applying a template
is the page title. This title is a template title, not the record title. And when you create a new record with or without a template, it will have an empty title. The last thing to know
about templates is that you can create several templates
for the same database. For instance, to
separate meeting tasks from coding and learning
tasks by applying different icons together
with different values for some properties and maybe
even for page content. Now let's apply a new eek template to all the
existing weeks. Okay, now you know how to boost addign new pages with
a proper content to your databases with
the help of templates. And our project is updated with the new templates
for the Habits and Weeks databases. Actually we are mostly done with the
main Notion topics. And the only thing
left is building a separate page with views
for habits statistics. That's exactly what we're going
to do on our last lesson, where I will share some tricks
and new formulas with you. Okay, See you there.
15. Card view enhancements: Welcome back. Here, we will wrap-up building
our class project by adding to it a separate
page for habit statistics. We will add several new views
for Habits database and learn some tricks for enhancing board and gallery card previews, such as separating the
data and text alignment. We will also learn new
formula functions: replace() and replaceall(). Let's start. First of all, let's add a new page
and name it "Statistics". The first view that I
suggest you to add here is a gallery for the
Habits database. This view is supposed to show the summary statistics
such as minimum, maximum and average
progress bars. Let's add a title
"Summary stats", and configure this
gallery to show page cover as card preview
and enable average, maximum and minimum
progress bars. It's time to add pictures to
the habits where necessary. It makes sense to update the progress bar
formulas so that we could easily understand which exact progress bar we see. Pretty good already. We can also filter out
habit ideas and to-do habits as they're not supposed
to have any stats yet. Optionally you might enable
grouping by status so that habit cards become organized into groups depending
on their status. It may be especially
useful later when you will have many habits records
in this database. Summary view is done. Now let's add a view with
detailed statistics. Let's add a new board view for the Habits database and name this new view "Detailed stats". Enable card preview from
a page cover and enable properties with average, minimum and maximum
progress statistics. The order of the
properties displayed may be adjusted in
the Properties menu. The main reason why we use Board instead of Gallery for
the detailed statistics is the gallery limitations for displaying long
multiline properties. And now you will see why
we actually need it. I want to add to
the card preview the progress of every
connected habit tracker. For this purpose, let's
add a Rollup column pointing to the Trackers' "Progress bar" in
"Show original" mode. Okay, actually, it looks messy and definitely
needs more work. It would be great to see not only progress bars
for connected trackers, but also their related weeks. But one Rollup column may only point to one property
of related records, and we need two of them here. And fortunately, we know how to concatenate text
pieces in a formula. So let's add a new
formula property to the Trackers database, which will concatenate weeks
with progress bars. We can add a new property, not only at the
original database, but also at its
any Linked view. So I will add this
new property to the Trackers database at the Linked view inside
of a habit page. Let's name it "Week
+ Progress bar". Now update the Rollup with detailed statistics to
point to this new property. Okay, it looks good. There is a trick
that will help us to visually separate week names
from the progress bars. We are going to use a
special character set here, which is "\t", a tab. You can add it to a "Week + Progress bar" formula in
the Trackers database and Notion will show it as a tab after the colon character. If there is no visual change after adding a tab character, try to add another one. Tabs will work good if week names are approximately
of the same length. For other cases, the result
might look not that good. So this trick is not always applicable without
additional formula updates. Let's take a look at the "Detailed stats"
view one more time. Some of the progress bar stick
together on the same line and it would be nice to move every progress bar
on its own line. Unfortunately, I can't add some text alignment
to a Rollup property. Its content is built by Notion, but I know the trick to make proper columns, no matter what. We can think of this Rollup
column as of a raw piece of data and add a new Formula column
where we will have all the weekly progresses
properly columned. Note that Notion always uses commas to separate progresses of all the
related trackers. And we can aim our
goal by replacing in the formula all the commas with the "new line" character set "\n". "\n" or "new line"
character set is a brother of a tab
character "\t". It is used in programming
languages for designating a new line when
building textual data. Notion formulas also understand this character set as "new line". By the way, if I disable
a "Wrap cells" toggler in a table layout settings Notion will ignore the "new
line" character. So you have to enable "Wrap cells" setting to have it
worked in tables, but in Board views, new line designation is
never ignored and you don't need any special settings here. To replace
the commas we will need replace() function, replace() functions
will do substitutions to the text pieces we
provide in the first block. The second block is for instructing which
part to substitute. The third block for instructing
with what to substitute. Let's see an example. Replace() will substitute
only the first occurrence of characters mentioned here. replaceAll() will substitute
all the ocurrencies. If Notion doesn't find any occurrence of string
from the second block, then the initial string
will not be changed. Now we need replaceAll()
function. In the first block. we have to reference
target property, which is the detailed
progress Rollup. In the second block we will write comma sign. The third block should be filled with the "new
line" characters. Note that all the
textual pieces must be included into
a pair of quotes. By the way, this trick
will not work if the values shown in Rollup
column contain a comma. Now I will hide the initial Rollup column and show the one with
proper alignment. Now the details statistics
is columned properly, no matter the card size or
the progress bars length. Note that Notion doesn't apply any sorting
to Rollup property. The values in Rollup are
listed in the same order. You add them in the
corresponding Relation property. To change the order, you can open the Relation
column and drag and drop related records
to fix the order. Note that you can't change the order on the
Rollup column itself. You have to apply changes to the corresponding
Relation column, "Trackers" column in our case. Let's take one more look to the Board view that
we have so far. It has several lines of data and summary stats such as
progress of average, minimum, and maximum
are not perfectly divided visually from
the details stats. They're placed on
different lines, but it's hard to perceive the difference
with a glands. To divide these different types of statistics in a more solid way, I will use the separator trick. Let's do it together. I will add a new
Formula property named "Separator" and make formula always return static
value of a dash sequence. Now, I will make it visible between summary and
details statistics. I use formula here
because I don't need to fill the property
for every new record. The formula will
do it for me and I can easily adjust
the way separator looks for all the
records in one shot. There is no possibility to show one property more than one
time on a database card. So if you need more
than one separator for a Notion system, you should create as many separator properties
as you need. I will enable the same separator on the "Summary
stats" view as well. If gallery cards
supported multiline view... By the way, you might check, probably it does support
multiline view in the latest Notion version, but now it doesn't. And that's why we have to use this board view for building the detailed stats.
With galleries we would have this
nice grid layout, but the board columns may become very unbalanced
at some point. And that's why I suggest
you to do the following. So I suggest you to group habits based on their names
instead of status. It's important to hide
empty groups here and configure the filter to only
show in-progress habits. Optionally, we can
disable name property as we have it on top
of every column. Thus we will have every
habit in its own column. And then let's copy
the whole view and adjust the filter to only
show sustainable habits stats. And let's repeat one more time for
the archived habits. Well, now we have our
habit board cards kind of grouped by status on these
three separate views. After sometime of
using this system, you will see your cards growing
up with progress data. Let's add an icon to this page. Separate the "Week" view
on the main page. And it looks like that's
it for this class. Okay, we are done
with the stats page. Now you know, new functions, replace() and replaceAll() together with at least
one use-case for them. And looks like we're
done with the project. My congratulations! I'm very glad you've
made it to this point.
16. Outro: Congratulations!
You've done it! And now you have all the
tools in your hand to start building your
own Notion projects using its most
powerful features. You did a great job going
through all the lessons. And I hope that you found
what you were looking for and now you are an
advanced Notion user. I also hope that at this
point you already have several ideas of how you can apply this new knowledge
to your own projects. I share more tips
on using Notion for organizing different
life areas on my blog. I'll be glad to see you there. Thank you for taking this class. I hope you enjoyed it. So that's it for now. Have fun with Notion
and good luck.
 Krista Harlamenkova, Notion Ambassador