Transcripts
1. Welcome: Hi, I am Viki. I am a bookkeeper and
a bookkeeping coach. I show small businesses how to stay on top of
their finances. Developing different simple
bookkeeping practices, I help them to get organized and have the best view
of their finances. If you are watching this video, maybe you've already
decided to try to do the bookkeeping of your own
small business on your own, or maybe you've already
made a decision to make a few steps further and start your own
bookkeeping business. If so, this series of videos
will be very useful for you. All materials used in this
course have been prepared for informational
purposes only and are not intended to provide
tax or accounting advice. Before engaging in any action, consult a CPA expert
in your location. Now, what is bookkeeping? It is just a process of
recording and tracking all revenue and expense
transactions within a business. But why is bookkeeping so
important for the business? It helps businesses get organized and stay on
top of their finances. Only this way, business owners can make the right
business decisions. Now, a little bit about the content that you can expect
in the following videos. This series of videos will focus only on cash bookkeeping, which is applicable
for small businesses. Cash bookkeeping is
more than simple. In addition, it requires
zero investment and can be done by everyone even if they don't have any
bookkeeping knowledge. So let's look at the
schedule of this course. First, I will clarify which businesses can
use cash bookkeeping. Second, I will explain how the cash bookkeeping
cycle is working. Then I will introduce the
Google Sheets templates that we will use in this course. Fourth, I will go through the invoice template
and tell you which functions I've
used for this template. Next, I will talk about
the chart of accounts, its meaning and cash
accounting and how to add it to your revenue book and expense book and Google Sheets. After that, I will
show you how to set up the profit and loss
report to automatically pull information from the
revenue book and expense book. Once we are ready with
the understanding of cash bookkeeping and
the technical part of creating Google
Sheets templates, I will walk you through the practical use of the templates. This means I will
show you how to accurately and
effectively record and track your business
money in and money out using all four Google Sheets
bookkeeping templates. I will give you some
suggestions on how you should make records in
your bookkeeping system. Last but not least, I will show you how to read the financial information from your profit and loss statement. As you can see, we have a lot
of work. Let's get started.
2. Google Sheets Users: You choose to work as a
freelancer or sole proprietor, you can benefit
from Google Sheets and use it to track
your accounts. Or if you want to start your
own bookkeeping business, but you are completely new, you can start with a few
small business clients and do their bookkeeping
using Google Sheets. From an accounting point
of view, freelancers, sole proprietors and
independent contractors don't need to do double
entry bookkeeping. They only have to
track their income and expenses and estimate
tax payments. This type of bookkeeping system is known as single bookkeeping. It is simple, easy to
follow and accurate enough. Since single bookkeeping
is cash based, it records transactions only when money is going
in or going out. This information is used
when filing Schedule C. It helps small businesses maximize tax deductions and
minimize taxes as well. Therefore, managing an
effective bookkeeping process is essential for
small businesses. No matter if you are a
small business owner or a bookkeeper whose clients
are small business owners, you should try to save
money when you can. You can save from bookkeeping software as you choose
to use Google Sheets. It is a powerful tool that simplifies the process
of creating invoices, tracking revenues and expenses, and preparing financial reports. This way, you are aware of your own business
financial situation. You are well prepared
for tax time and you can make the
right business decisions. In case you use
Google Sheets to do the bookkeeping of your
small business clients, you will provide them
an accurate overview of their finances and
help them stay organized and on top
of their finances. If you are not sure
if Google Sheets is the right bookkeeping
tool for you, the rest of the video will help you to find the right answer. If you are a small
business owner and don't have employees
or have only a few, then you can use Google
Sheets as a bookkeeping tool. Logically, if you are
a bookkeeper and have small business clients who don't have employees or
have only a few, then you can use Google
Sheets as a bookkeeping tool. Google Sheets is suitable for businesses that don't need
to track inventory as well. The volume of transactions can also affect the choice
of a bookkeeping tool. Let's assume your small business only has a few
transactions a week. You can definitely use Google
Sheets to record them. It's the same if you
are a bookkeeper and your small business clients have only a few
transactions a week. Let me give you some examples. A small online store that offers digital products
or print on demand IEMs, can track its revenue and
expenses using Google Sheets. An online instructor who sells online courses or
a coach who sells different coaching programs can use Google Sheets as a
bookkeeping tool too. All the businesses
I've mentioned don't have inventory
and have no employees. Of course, these
four businesses are only a small part
of all examples of small businesses out there.
3. Google Sheets and Business Organization: Cash accounting is suitable
for small businesses that shouldn't track inventory
and don't have employees. Let's clarify what cash
bookkeeping is and how it works. If you use cash
bookkeeping to record your business transactions or the transactions of your
small business clients, you should record all money
out at the moment they are gone and all money in at the
moment they are received. In other words, if you got a bill from marketing
services in October, but you paid the
bill in November, you would record those expenses
as a November expense. Let's assume you delivered a service to a
client in October, but they paid the
invoice in November. According to cash
bookkeeping principles, you would record those revenues
as a November revenue. Let's see how a cash
bookkeeping system of a small business
can look like. First, you should create an invoice every time
you make a sale. To record the invoice
amount as revenue, you have to receive a payment. For every purchase or service you get, you need to get a bill, but you record the amount of the bill not at the
moment you get the bill, but at the moment when you make a payment to the supplier. When you add revenues
and expenses to your bookkeeping records or the bookkeeping records
of your clients, you should categorize them. This means that you
put each payment made or received into a group. This way, you or
your clients get detailed information about
your business finances. Using this detailed information, every small business can stay organized and manage its
finances the best way. And always, when you
as a business owner need to find some information relating to a
particular expense or revenue, you can find it fast. When your small
business client asks for some particular
financial information, you as their bookkeeper
can immediately answer and provide the
necessary information. The difference between
total revenues and total expenses is the
business net profit. This information needs to be summarized in a report called
profit and loss statement. In this report, you clearly see how much the
business has earned, how much it has spent, and the difference between the cash inflow
and cash outflow. It shows how the
business is doing. Based on this profit
and loss statement, your tax accountant will help
you to file the Schedule C that you need to submit together
with your C thousand 99. Of course, you have the
freedom to choose to use either Google Sheets or bookkeeping software to record and track your
revenues and expenses. But in this course,
I will show you how you can do your accounts
using Google Sheets. In my opinion, this is the best solution for
startups in small businesses, especially in the first year. Let's summarize how the cash
bookkeeping system works. Every time you get a
payment from a client, in case you are a
business owner, or when your client
gets a payment, in case you are a bookkeeper, you enter the transaction
into the bookkeeping records. Once entered, this
transaction needs to be categorized to show exactly
where the money comes from. Every time you make a
payment to a third party, in case you are a
business owner, or your client makes a payment, in case you are a bookkeeper, you enter the transaction
into the bookkeeping records. Once entered, this
transaction needs to be categorized to show where
exactly the money goes out. To be sure that you've recorded all transactions over
a particular period, you need to reconcile
the bank statement and your bookkeeping records. The total bank deposit over the particular
period should equal the total revenue
amount that appears in the bookkeeping records
in exactly the same way, the total bank payments over
the particular period should equal the total expense amount that appears in the
bookkeeping records. If there is some difference, you need to find the
error and correct it. The most important report in the cash bookkeeping system is the profit and
loss statement. This is a summary of
all transactions that you've entered into the system and shows the business profit. In this video, I've made a quick view of the whole
bookkeeping process. I'll walk you through each part of it in the following videos. So keep watching.
4. Google Sheets Pros : You are doing double
entry bookkeeping of a business with many
employees and inventory, I would definitely advise you to use bookkeeping software. But when it comes to a sole
proprietor or freelancer, there isn't a better
solution than Google Sheets. First, using Google Sheets
is completely free. You shouldn't pay any
monthly or annual fees. All you need to do is
create a Google account. Once done, you have free
access to Google Sheets. Second, you can access your Google Sheets files from any device and
from any location, just like each Clad
accounting software. You just need an
Internet connection, browser, and your email and
password to access the file. For example, you
are odd holiday, but you want to enter
some data related to your own business or your
client's business. No problem. You can do it anytime using either your laptop or
your mobile phone. Next, Foogle Sheets
allows sharing documents. On one hand, if you
are a bookkeeper, you can give your
clients access to the table with their
financial information. On the other hand, if you are a small business owner and you are doing your
bookkeeping on your own, maybe you would like an expert to look through your records. Just click the Share Bn at the top of the screen
and that's it. Another advantage of
using Google Sheets is the fact that you just
set up the tables once, and after that you just
enter the data on a daily, weekly, or monthly basis. Based on the formulas you've
integrated Google Sheets, displays all the data entered. As you can see,
Google Sheets provide the most important
features that bookkeeping software for sole proprietors
or freelancers offers.
5. Business Categories: Before we start to
create templates, I will explain what a
chart of accounts is. A chart of accounts is a
tool that bookkeeping uses to record all transactions
that happen within a business. Since most sole proprietors and freelancers are doing
cash accounting, the chart of accounts
is just a bunch of categories that helps bookkeeping divide all business transactions into
different groups. As I've already explained, a business that applies this
type of accounting records its transactions when they cause real cash inflow
or cash outflow. To understand the meaning
of categories better, I will give you the
following illustration. If a business sells
three products and offers two services, it would be good if
the business creates five separate income categories for each product and service. Usually, the expense categories are more than the
revenue categories. Some typical expense
categories are advertising, rent, utilities, insurance,
telephone, and Internet. All these revenue and expense categories are just an example, and they can be
changed depending on the type of business
you are running. Maybe you would ask, why does a business need
to group its expenses and revenues when it can just sum them up and
have the total values? The answer is, this way your own business or your
client's business can get detailed information on where the business biggest
revenue comes from and where it spends
most of its money. Grouping all transactions
helps a business keep track of its revenues and
expenses and have detailed information used
for decision making. Transaction categories
allow a business to compare detailed financial
information between different fiscal periods and find what has caused
the difference. I've prepared a very
simple example. The total expenses of business, say in 2021 are higher
than those in 2020. Comparing each expense category, you can immediately find out which expenses have
caused this increase. Once you found out which
category has increased, the business owner, no matter if this is
you or your client, can make a decision
to reduce them. Let's assume you found out
that the advertising expenses have rapidly increased the
owner of the business, no matter if this is
you or your client, should either negotiate with the advertising agency to
try to reduce the price or find a new agency that offers the same advertising services,
but at a lower price. I would like to share
one more reason why transactions
should be categorized. Categorizing all
business money spent is the most important requirement
to pay lower income taxes. The reason is that
only some expenses are recognized for tax purposes. To know what amount of
the expenses can be deducted from the revenue
for tax purposes, you need to put them into
different categories. And now a little bit
about how to add the chart of accounts
in your bookkeeping system with Google Sheets. You should create a
drop down menu with revenue and expense categories and integrate them into
some of the templates. This way, you will
be able to choose the most appropriate category
for each transaction. After selecting the correct category for each transaction, all these categories
will appear on the profit and loss
statement that a business uses to
file its income taxes.
6. Business Templates: This video, I will
quickly walk you through all the bookkeeping templates that we will be using
in this course. The first sheet includes
an invoice template. As you can see an
invoice created with Google Sheets
can also look fancy. The invoice template
is editable. It allows you to enter
any information you want. You can add information about
the seller and customer. You can also write the date
and the invoice number. When you add items quantity
and price per unit, the template
automatically calculates the total amount for
the particular item. The template
automatically calculates the total amount of all items, the sales tax if applicable, and the invoice price that
the client should pay. Let's see the next
template we will use. It's called Revenue
Book and includes information for all items or
services that you've sold. You need to enter the
date, description, amount, and category of
each revenue transaction. In the first three columns, you need to manually
enter the information, and in the fourth column, you will use a drop down menu
with all income categories. In this table, you will enter all money that comes
into your bank account. The third template we
will use is called expense Book and includes information for all
expenses you make. You need to enter the
date, description, amount, and category of
each expense transaction. In the first three columns, you need to manually
enter the information, and in the fourth column, you will use a drop down menu with all expense categories. Here you will enter all money that goes out from
your bank account. The fourth template is called
Profit and Loss sheet. It automatically pulls
all the information from the revenue books and expense book and calculates
the total gross revenue, total expenses, and net profit. As you can see, the templates are simple but really powerful.
7. Organization of Invoices: When it comes to invoicing, I personally believe there are two main points that
need attention. The first point is
the invoice design. The way your invoices
look tells a lot about your business and your
attitude to the clients. The process of invoicing itself is the second point I
would like to mention. It should be as
simple as possible. That's why I was looking
for a free way to create professional looking invoices
in less than a minute. Then I found that Google Sheets is the right tool
for these purposes. Google Sheets offers a
variety of fonts and colors. You can add an image, as well. All these features
help you create a stunning appearance
of your invoice. Google Sheets offers functions that you can integrate into your invoice and save time in calculating all amounts
on the invoice. You only add the quantity
and the price per unit, and the invoice calculates
automatically the amount that the client owes for the whole quantity of the particular item. When you sell two or more items, the invoice can calculate
the total amount that your client should pay after discounts and applying taxes. Let's go through the formulas that are used in this template. The first formula
I've integrated into this template is the
multiply formula. This formula multiplies
the quantity sold of a particular item by the price per unit and shows the result in
the amount column. The second formula I've
used is the Sun formula. It sums up all the numbers in the amount column and shows
the sub fritle amount. This invoice template
automatically calculates the sales tax. I've just used the
multiply formula again. This time it multiplies the sub fritle amount
by the tax percent. Of course, the invoice template calculates the total invoice amount that the
clients should pay. Guess what? I've used
the sum formula again. It sums up the subtotal
amount and the tax amount. In conclusion, I can say that the main two formulas
used in this template are the multiply formula
and the sum formula. Using only these two
simple formulas, I've created a completely
functional invoice template.
8. Organization of Sales: This is a revenue book. The first thing I will
show you is how to add a currency to the amount
column. There are two ways. The first one is short and the second one
is a bit longer. Let's start with the easy part. Select the first cell from the column and then
the dollar icon. To apply this formatting
to the rest of the column, we just need to click on
the right corner with plus of the selected cell
and pull to the row we want. It is possible that your
top menu has disappeared. In this case, you should use the second way of
adding a currency. Once you've selected the
first cell of the column, click on format in the top menu. Select number and
click on currency. Now click on the right
corner with the plus of the selected cell and
pull to the row you want. The most exciting part of this she is actually the
category column. This column allows you to choose one from a few
revenue categories. To add this functionality, you need to create a
drop down menu and add all income categories
that fit your business. To apply this option, you should take a few steps. Let's get started. Go to data
and select data validation. In the cell range field, enter the area where the drop
down menu will be applied. To do that, click on the
field and after that, select the column, where the
drop down menu will appear. In this case, this is the category column of
the transaction sheet. From the criteria menu, select list of items, and in the right field type all income categories
related to your business. Remember, you should separate the categories with a comma. Now save, and that's it. As you can see, all cells of the category column have a
small arrow on the right side. And when you click on
some of the cells, the drop down menu appears, and you can choose
the income category that matches the
particular transaction.
9. Organization of Expenses: In this video, I will
show you how to create a drop down menu with
categories in the expense book. You've already seen
the process of adding income categories into
a drop down menu. Now you should do the same thing but with expense categories. First, you need to add a
currency to the amount column. I am sure you remember what I've shown you in
the previous video. Although I will show you one more time to be sure
that you will do it right. Select the first cell from the column and then
the dollar icon. To apply this formatting
to the rest of the column, you just need to click
on the right corner with the plus of the selected cell and pull to the row you want. If you want, you can
do it the other way. Click on format in
the top of the menu. Select number and after
that, click on currency. Then click on the right
corner with the plus of the selected cell and
pull to the row you want. Let's move to the
category column and add a drop down menu with all expense categories that
fit your business. Only this way, you will have detailed information
about your expenses, and you will be able
to deduct your taxes. Go to data and then
select data validation. In the cell range field, enter the area where the drop
down menu will be applied. To do that, click on the
field and after that, select the column where the
dropdown menu will appear. In this case, this is the category column of
the transaction sheet. From the criteria menu, select list of items, and in the right field, type all expense categories
relating to your business. You should separate the
categories with a comma. Just click Save to add
the drop down menu. Clicking on the small arrow on the right side of each cell
in the category column, the drop down menu appears, and you can choose
the expense category that matches the
particular transaction. So we are ready with
the expense book. In the next video, you will see how it create a profit
and loss statement.
10. Business Report: The profit and loss
statement shows what your business has made
and what it has spent. It compares these two
components and calculates if it has made a profit or loss
within a particular time range. The information in this
report is detailed, and you can see where the
business money has come from and where your business has spent the most of its money. The profit and loss
statement provides this detailed information
using a really simple design. It consists only of two columns, and these two columns
give you key information. The first one shows all
transaction categories, and the second one shows the total amount
of each category. The most interesting part is that the profit
and loss statement automatically pulls
the information from the revenue book
and expense book. And in this video, I will show you how to add
this functionality. Let's create the formula that will pull over
the total amount of each income and
expense category and put it into the second column of the profit and
loss statement. I will use the sum of formula, which is really easy to understand and very
powerful at the same time. This formula goes
through a range of cells to find those that
match a given condition. Then it takes the
numbers relating to the matched cells
and sums them up. There are three arguments
in the brackets. The first argument
is the range of data that should be
evaluated by criterion. In this case, this range is the category column in the revenue sheet
or expense sheet. The second argument called criterion is the
condition to be met? In this case, this argument
will change for each row, and it will be the category name from which you want
to pull information. Let's assume you want to pull information from the
advertising expenses. The condition will
be advertising. You should be careful and
write the categories the same way they appear in the category column in the revenue sheet. The argument called
sum range shows the area in which
to sum up numbers. This will be the
amount column in the revenue book
and expense book. Let's see how this formula looks when apply to the
revenue categories. This formula says to Google
Sheets the following. Look at the cells
from D six to D 28 in the revenue
sheet and sum up all amounts from the
amount column related to the revenue category shown
as a second argument. For each revenue category in
the profit and loss report, you need to adjust the formula as you change the
conditional argument. The condition for the
first revenue category should be sales product one. The condition for the
second revenue category should be sales product two. In the same way,
the condition for the third revenue category
will be sales product three. Following this logic, you should adjust the formula for
all revenue categories. I will use the same formula for the expense categories in the
profit and loss statement, but I will edit all arguments. This version of
the formula says, look at the cells from D six to D D eight in the expenses
sheet and sum up all amounts from the
amount call related to the expense category shown
as a second argument. For each expense category in
the profit and loss report, you need to adjust the formula as you change the
conditional argument. The condition for the
first expense category should be ad kaise. The condition for the
second expense category should be continuing education. The condition for the third expense category should
be subscription. Following this logic, you should adjust the formula for
each expense category. Once you've adjusted the formula and all cells from
the amount column, you can add total revenue
amount, total expense amount, and net income, which
is the difference between total revenues
and total expenses. To calculate the total
revenues and expenses, you will use the sum function. First, select the
cell that will show the total revenues and
add the sum formula. Then select all revenue
range you want to sum up. To calculate the total expenses, select the cell that will show this number and add
the sum formula. Then select all expense
range you want to sum up. To calculate the net income, use the subtract formula. Select the cell that will show the net income and add the
cells you want to subtract. Here, you want to subtract the total expenses from
the total revenues. Once all formulas are apply, the information in the profit
and loss statement updates every time the information in the revenue book and
expense book changes.
11. Recording Sales: You can make records in the revenue books as
often as you want. It depends on what
type of person you are and how many revenue
transactions you get. If a business gets a
few payments every day, then maybe it would
be reasonable to enter them on a daily basis. If a business gets a few
clients payments a week, then I will suggest you make records into your sales
book once a week. And if a business gets a few
clients payments a month, then you can enter them into the income book once a month. There isn't a right
way and wrong way. Just try different
options and see which one works for
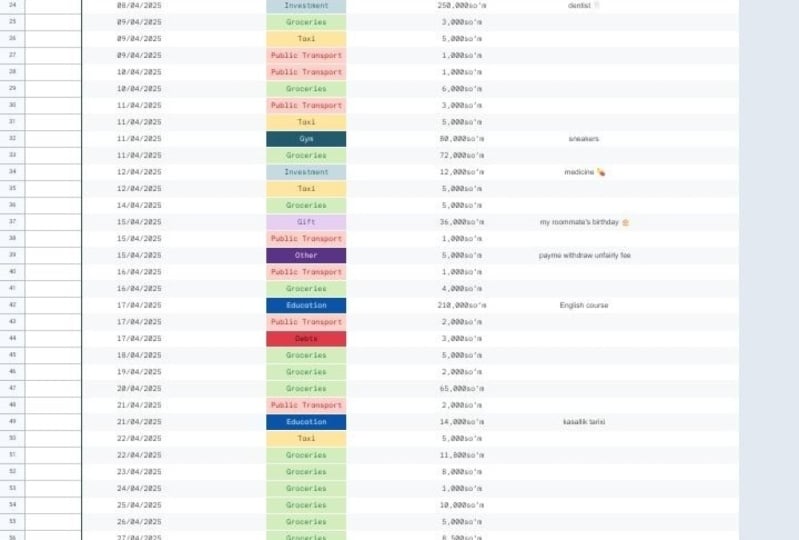
your business needs. When you record the
business cash inflow, you need a bank statement for the period you will enter data. Once you've got it, you can start entering the
sales transaction. It is essential to concentrate
and work accurately. All bank transactions are
in chronological order, exactly the same way you should enter them into
the revenue book. First, you write the date of
the particular transaction. In description, you can write the invoice number
in the name of the le Then you write the amount
the business has received. And, of course, you categorize
the sale transaction. As you can see you enter
one transaction in less than a minute,
just imagine. If you have ten sales
transactions per day, you need less than 10 minutes
per day to record them. If you have 20 sales
transactions per week, you need less than 20 minutes
per week to record them. It's not so much time, I guess. These 10 minutes
of work will help you a lot when tax
time comes and you have to file your
Schedule C. Once a month, you can reconcile the
revenue transactions in the book keeping records with the revenues in the
bank statement. If the total revenue amount in the revenue book equals the total revenue amount
in the bank statement, your income transactions
are reconciled. If there is some difference, you should find the
error and correct it. There are a few common errors
that happen very often. Even if you are focused
on what you are doing, it is likely to enter a wrong amount for a
particular transaction. Another possible error is to enter the same
transaction twice, or maybe you haven't entered one or more transactions at all. A very common error is to enter an expense transaction
into the revenue book. No matter what the error is, it is important to find
it and correct it. You don't need to have worries. It is absolutely okay if
you've made some mistake. It is just important to find
it and correct it on time. Therefore, reconciling
is an essential part of your bookkeeping process.
12. Recording Expenses: Similar to the revenue book, you can make records in your
expense book depending on what type of person you are and how many expense
transactions you make. If your own business
or the business of your client pays only a
few bills for Internet, telephone, utilities, and
website subscription, you can record them
in the expense book at the end of the month. But if we talk about a
print on demand business, every time the
business makes a sale, it needs to pay the print on demand company to produce the item and send it to the cli. In this case, it would
be reasonable to record the expenses paid
to the print on demand company on a daily basis. When the transactions
are not so many, you can enter data into the expense book
on a weekly basis. There isn't a right
way and wrong way. Just try different options and see which one fits
your business needs. When you record the
business cash outflow, you need a bank statement for the period you will enter data. Once you've got it, you can start entering the
expense transactions. Similar to the
revenue transactions, you should manually record
the expense transactions. That's why it is essential to concentrate and work accurately. All bank transactions are
in chronological order. Exactly this way you should enter them into
the expense book. First, you write the date
of the expense transaction. In description, you can write the bill number and the
name of the third party. Then you write the
amount you've paid. And, of course, you categorize
the expense transaction. Be very careful with
expense categorizing, because this reflects the
taxes you should pay. When you accurately categorize
your business expenses, you are a few steps further
to paying less taxes. As you can see, you enter one expense transaction as
fast as a revenue transaction. The process is simple
and not time consuming. When you do it regularly, you will definitely have an
effective bookkeeping system that allows a business to
stay on top of its finances. This way, you or your clients, depending on if you are a
business owner or a bookkeeper, can make the right
business decisions and improve the business
financial situation. And not only this, but such regular bookkeeping records
will help you a lot when tax time comes and you have
to file through Schedule C. Once a month, you can reconcile all
expense transactions you've put into the bookkeeping system with those in the
bank statement. If the total expense amount in the expense book equals the total expense amount
in the bank statement, the expense transactions
are reconciled. If there is some difference, you should find the
error and correct it. There are a few common errors
that happen very often. Even if you are focused
on what you are doing, it is likely to enter a wrong amount for a particular
expense transaction. Another possible error is to enter the same expense
transaction twice, or maybe you haven't entered one or more expense
transactions at all. A very common error is to enter a revenue transaction
into the expense book. No matter what the error is, it is important to find
it and correct it. You don't need to have worries. It is absolutely okay if you've made some mistakes
in the expense book. But it is important to find
it and correct them on time.
13. More about the Report: Once all formulas are applied, the information on the profit and loss statement updates every time the information in the revenue sheet and
expense sheet changes. If you add a new
revenue transaction, this amount will appear on the profit and
loss statement and increase the total revenues
and the net income. Every time you add a new
expense transaction, this amount will appear on
the profit and loss statement and increase the total expenses and decrease the net income. For example, if you
add a new transaction that shows $1,000 income
from service one, the total revenues
from service one in the profit and loss
statement will also increase by $1,000. Let's see how it works. Go to the revenue sheet and
add the new transaction. First, add the date
of the transaction, then add the invoice
number of the transaction. Now you can write the
amount of the sale. In this case, it is $1,000. To complete the record, you need to select a revenue category. Let's look at the profit
and loss statement. You see that the
total revenue of service one has
increased by $1,000. The total revenues
have also increased. Of course, the net income has automatically increased
by $1,000 as well. The profit and loss statement will update the same way when you add a new expense
transaction to the expense book. Let's assume you've
paid $100 monthly rent. You should add this transaction
to the expense book. Start with the date
of the transaction. Second, write the number
of the bill you've paid. At the amount you've paid, And select an expense category. Now go to the profit
and loss statement and see what has changed. The total rent expenses
have increased by $800. The total expenses
have increased, too. Of course, the net income has also changed and it
has decreased by $800. You see how dynamically this profit and loss statement works and how powerful it is. Exactly, this is the
biggest benefit of Google Sheets as a
bookkeeper assistant.
14. Data Visualization - 1: In this second bonus video, I will show you step by
step how to add charts to your profit and loss
statement using Google Sheets. It sounds complicated,
but it is not at all. You should only know which
data range to use and where to find the chart
functionality in Google Sheets. The software takes
care of all the rest. The information I
want to display relates to the revenue
and expense categories. First, I want to compare
all revenue categories and see which product or service provides
the highest income. Second, I want to compare all expenses and see where my business spends the
most of its money. To visualize all
this information, I will create two
separate charts in the profit and loss sheet. To create the revenue chart, I need to select the columns which information
I want to display. I go to Insert, and
then I click on Charts. I want to change the
name of the chart. I go to customize in the chart Editor and select
Chart and axis title. Then in the title text
field, I write the name. The chart that appears
is a pie chart. The pie chart is suitable for
the data I am visualizing. But in case I want to change it, I go to the chart editor. And from the drop down
menu in the setup section, I choose the type of
chart that fits my needs. Although the pie chart fits perfectly with the revenue data, this information can be displayed in the form of
other charts as well. For example, I can
choose the line chart. It looks good, but I still think that the Pie
chart is the best solution. Let's see how the
revenue information will look in the form
of a column chart. The revenue information
is easy to read, but I really like the Pie chart. Therefore, I will
select it again. As you can see, there are a
few options to choose from. The first one is Pie chart. The second one is
doughnut chart, and the third one is
three D Pie chart. Although there is a
big variety of charts, I prefer to use the first one. I am ready with
the visualization of the revenue information. Now I will create a chart
that represents all expenses. I select the column with all expense categories and the column with all
expense amounts. Then I go to Insert
and click on Charts. To change the name of the chart, I go to customize in
the chart Editor. I select Chart and axis title. Then in the title text field, I write the name of the chart. In less than a minute, I visualize the whole
expense data. Feel free to select
another type of chart. You can also
customize the look of the charts using the customized section
in the chart editor. In the next video, I will show you how to read
information from charts. If you are interested,
heap watching.
15. Data Visualization - 2: In this CRD bonus video, I will show you how to read the information from the charts. Let's give a quick look
at the revenue chart. Each product or service has a different color and is represented as a part
of the whole pie. In addition, the chart
shows what percentage of the total revenues is generated by each product or service. The blue part of the chart visualizes the revenues
generated by Product one. It is obvious that the blue part of the chart is the biggest one. This means that Product one has generated the
most of the revenues. The chart shows that
this product has earned 47% from the total revenues. The second big part of the
chart is colored in orange and it represents the revenue
generated by Service two. Service two has also generated a big part of the
total revenues. This service has earned almost 20% from the total revenues. Service one is
represented in green, and it has generated 12%
of the total revenue. Product three is
colored in yellow, and it has earned 16%
from the total revenues. The smallest part of the
chart is colored in red, and it displays the revenues
earned by product two. This product has earned 4%
from the total revenues. The most profitable
item is product one. Product two has earned
the lowest revenue. Based on this information, the business can make a decision
to stop offering product two and concentrate on more profitable
products and services. Let's move to the next chart. Each expense has a
different color and is represented as a
part of the whole pie. In addition, the chart
shows what percentage of the total expenses is generated
by each expense category. The biggest parts
of the chart are colored in orange and blue. The orange part represents the amount the business
spends for RAP. These expenses are 21% of the total money that
the business has spent. The blue part represents
the advertising expenses. They have generated 23%
of the total expenses. The two smallest parts
of the charts represent the postage and
shipping expenses and legal and professional fees. The shipping expenses are
3% of the total expenses, and the legal and
professional fees are only 2% of the
total expenses. All other expenses are between 4% and 11% of
the total expenses. You see how understandable
the financial information can be using collars and
geometric figures. Google Sheets makes
the information from the financial reports
comprehensive and easy to compare. Data visualization is not
something you must do, but it is very useful
and will help you to see the trends in your business
only with one quick view.
16. Google Sheets Pros for Print-on-Demand: Google Sheets is a
powerful tool that you can use to record and track
your sales and expenses. Here, I would like to reveal
some of the advantages of Google Sheets as a
bookkeeping tool for your print on
demand business. First, as you already know, Google Sheets is totally free. You don't need to pay anything
to use all its features. You can create as many
spreadsheets as you want, and it will always be free. No matter how big your date is, there is no way Google
Sheets to charge you. Second, Google Sheet
is Cloud based. This means it could
be used exactly like a Cloud based
bookkeeping software. This gives you the freedom to access your data
anytime from anywhere. Not only this, but you can
make your files accessible to your accountant or tax advisor and ease the
communication with them. Next, Google Sheets is
user friendly and simple. Most people are familiar with it because it is very
similar to Excel. So if you know how
to work with Excel, you will find it
more than simple to work with Google Sheets. Google Sheets allows you
to add invoices as a link. Using this functionality,
you can attach an invoice to each transaction and organize your
finances better. Charts are another advantage
I would like to mention. Google Sheets allows
you to visualize your financial data
with only a few clicks. Of course, it is not
possible to talk about advantages without
mentioning some disadvantages. One of the disadvantages of
Google Sheets is that you need to create your spreadsheets before you start to use them. I mean that you need to decide
how to organize your data, which formulas to use and just put everything into action. It's not a hard task at all, but you need to
spend some more time setting all these things up. Another disadvantage is that Google Sheets is suitable
only for cash bookkeeping. If you do accrual accounting, you need to choose
another bookkeeping tool. But in case you do
case bookkeeping, Google Sheets would be
the perfect assistant. I close my eyes to these two disadvantages and
highly recommend spreadsheets for small print on demand businesses that
do case bookkeeping. The main reason for my
opinion is its simplicity. It doesn't require any
special tech skills. If you are curious to
learn how to organize your print on demand business finances with Google Sheets, I will do it in the next videos.
17. Sales Book - Print-on-Demand: Before I start to talk
about Google Sheets and how it can be beneficial for your print on
demand business, I want to emphasize that I
suppose you've already used Google Sheets and
you know how to work with the basic
common formulas. The purpose of this class is not to teach you how
to write formulas, but how to transform
Google Sheets into a bookkeeping tool and how to use it to organize your print on demand
business information. So let's get started. In this video, I will show you the three
bookkeeping templates that you can use to record and track the finances of your
print on demand business. You can use them
as a backbone and adjust them to fit your
print on demand business. In the first spreadsheet, you could add all
sales transactions. In the second, you could
enter all expenses. The third spreadsheet
is automated, and it pulls out
all the data from the first two spreadsheets
and summarizes it. Let's begin with the
first spreadsheet. This is a file that contains all the information about
your sales revenues. Here you add all sales
to the accomplished. Now we will go through all
columns that are included here. The first one is date. The date is essential
because it helps you to organize your transactions
in chronological order. This way, you can track all
transactions effortlessly. The second column
is invoice number. The invoice number is
necessary because it links your bookkeeping records with the real invoice that is evidence of the
recorded transaction. The third column is
called category. This column is important
because it gives detailed information
about the items you sold. If you don't divide your sales transactions into
different groups, you won't have information on how much profit generates
each group of items. You will only have one
total revenue amount. It wouldn't be
wrong, but it won't be effective for making
business decisions. That is the reason why
I recommend to make detailed records
of everything that happens within your print
on demand business. The next column shows
the amount of the sales. This column is a must
because it is a metric that shows how much
money your business generated from each
sales transaction. The invoice column is where
you can provide a link to the actual invoice that shows
the particular transaction. This column is not a must, but I would include
it because it helps when reconciling the
sales transactions. In case of some errors, you need to compare
the information in your sales spreadsheets
with the information on your sales invoices. Having links to all
sales invoices in your spreadsheet will
save you time and effort. I don't recommend deleting
any of these four columns. You can only add more columns. For example, you could add a column with the
location of your clients. This way, you will know in which countries you made
the most of your revenues. You can add any other
information you want. Let's pay attention to
the category column. Here I added a drop down menu where I can choose the
items that I sold. The store sells nine products,
and I added all of them. If the number of
items is too big, you could group the items
and add only the groups. For example, here I included
three types of t shirts, three types of hoodies, and three types of shoes. But you could group them
into only three categories, T shirts, hoodies, and shoes. It is up to you how to organize
your revenue categories. I believe that the data
should be detailed, and therefore I created nine categories
instead only three. My advice is to organize your revenue
categories depending on the number and types
of items you sell. To adjust the
revenue categories, click on some of the cells in the category column and select
view more cell actions. Then click on data validation. Here you can delete, head and
edit the sales categories. Depending on the monthly
number of sales that you make, you can add all
sales transactions to the same spreadsheet. But if the sales
volume is too big, it would be more effective to create a spreadsheet
for each month. This way, you will have 12 separate spreadsheets
and each one will contain only the
sales transactions incurred in that
particular month. It would be easy for you to find the information you need. I advise you to use the same
spreadsheet for all sales in case you make up to
25 30 sales per month. The template that I've
showed you is exactly for such a small sales volume. But
18. Expense Book - Print-on-Demand: It's time to walk through
the expense spreadsheet. The template that you
see is suitable for small print on demand business that makes up to 30 purchases. If the volume of the
purchases you make is bigger, I recommend creating a separate expense
spreadsheet for each month. It would be easier for you
to track your expense data. The expense spreadsheet is almost the same as the
sales spreadsheet. We have, again, a column with
the date of transactions, which will help you to make
chronological records. The invoice number will
help you when you want to reconcile all the
expense transactions. For example, you can check if the payment on
your bank account matches the amount
in your spreadsheet tracking the particular
invoice number. The category column will allow you to get
detailed information about the different
expenses that your print on demand
business makes. You can see how much money your business spends on
product costs and shipping, how much on different
ecommerce fees, and how much on other expenses. Having this detailed
expense information will help you make decisions
relating to item prices, the ecommerce
subscription plans, and any other services you use to realize your print
on demand business. As you can see, the most
important expense categories are included in a
drop down menu. In my opinion, it's
more convenient instead of adding a category for each transaction manually. But of course, you shouldn't add a drop down menu
if you don't want. You can just type the name
of the expense category. But I think using a
drop down menu will help you to make your
expense records faster. In this template are added some essential and most
common expense categories that may be a part of one
print on demand business. You know better which expenses
you make every month. Just adjust the drop down menu to suit your print
on demand business. To do that, click on
some of the cells in the category column and select
view more cell actions. Then click on data validation. Here you can delete, had, and edit the expense categories. The bookkeeping records
must include the amount of each transaction to be able to calculate the profit
in a term of money. That's why the amount
of money together with the other three columns
are essential and should be included in
your bookkeeping system. Of course, you can add any
other information you want, but don't delete any of these four columns I was
talking about. When it comes to
the invoice column, I will repeat it one more time. This column is where you
can provide a link to the actual invoice that shows the particular
expense transaction. It is not a must, but I find it useful because it helps when reconciling the
expense transactions. In case you find any errors, you should check if
the information in your expense
spreadsheets matches the information on
your expense invoices. Having links to all
expense invoices in your spreadsheet will
save you time and effort. After watching the
last two videos, you have some humerized idea
which information you need to record and how to organize
it using Google Sheets. In the next videos, we
will make a deeper look at the organization
of the information of your print on
demand business.
19. Report - Print-on-Demand: It's time to see the
profit and loss statement. In this spreadsheet, you can see all revenue and
expense categories, the total revenues
and total expenses, and, of course, the difference between them called profit. This spreadsheet gives
you a summarized and detailed picture
of all sales you accomplished on your
online store and all amounts you paid to
realize these sales. You can see where your
business spends the most of its money and which items
generate the most profit. All the data you see on the
profit and loss statement is directly pulled from the
previous two spreadsheets. I open brackets and
say that the formula I use to create this
functionality is suf. The charts take information from the profit and loss statement
and visualize the numbers. The data presented
in the form of a chart is understandable
for all people. Therefore, all bookkeeping
software shows the financial data also in the form of different
charts and graphs. This drove me to the
idea that it would be good if I include charts
in the spreadsheet. Adding these two charts, I tried to make the
Google Sheets bookkeeping template similar to any
bookkeeping software. If I convince you
that Google Sheets is a good bookkeeping assistant for your print on
demand business, I will show you how to organize your business information and what would help you to build and manage an effective
bookkeeping system.
20. Recording Sales - Print-on-Demand: After you saw which basic information you need to have
in your bookkeeping system, it's time to see how to record
your sales transactions. By creating these records, you will be well
prepared for tax time, and you will be able to
provide all information that your tax advisor
requires to file your taxes. Before you start
adding transactions to your bookkeeping system, be sure that you have
consulted with your accountant or tax advisor and
follow all their advice. To enter a sales transaction into your bookkeeping system, you need to open the
invoice and transfer the information from the invoice into your Google
Sheets revenue file. If the invoice includes
only one item, it's easy to record it. You add the date,
the invoice number, the category of the item, and the amount, and that's all. But what happens when two or more items appear
on the invoice? Here you have two
options depending on how detailed you want
to be your records. The first option is to
make one record with the total amount of all items
that appear on the invoice. If you choose this option, you will make the record faster, but the information
that you will have in your bookkeeping system
won't be detailed. And if you want to
see how much revenue a particular item has generated, you won't be able to
find this information. It is not wrong, but
I recommend making more detailed records to
make sure that you have a better picture of your
print on demand business. If you choose to make your
bookkeeping records this way, you don't need to
create a drop down menu with all revenue categories. You need only one category
called sales revenue. The second option is to add every single item
to your bookkeeping system as a separate record. It will take you
a bit more time, but you will have a
detailed picture of all your revenues and can see the amount that each
item generated. This information
is essential when you make decisions
relating to pricing, adding new items, or removing
some of the current ones. Therefore, I recommend
a second option. As I already mentioned, the invoice number is unique. In this case, unique means that each invoice has its own number. But why do you see rows with
the same invoice numbers? This is because I record in each sales position
of the invoice as a separate
bookkeeping record. This doesn't mean that I issued a few invoices with
the same number. It only means that the
particular invoice has a few positions with different items that
are recorded as single sales transactions
in the bookkeeping system. Regardless of which
option you choose, the total revenue on the profit and loss statement
will be the same. But in the first case, the revenue information
won't be narrowed down. In the second case, the report will show the revenue for
each revenue category, and you will know which items are profitable and
which are not. Both options have advantages
and disadvantages. The first option is faster, but the data is too summarized. The second option
takes more time, but it is more accurate. It won't be wrong if you
choose the first option, but I recommend the second
one because the main role of the bookkeeping system
is to create and manage accurate and detailed
business information. If you decide to
link an invoice to each record you make in
your sales spreadsheet, I would suggest having all sales invoices on Google Drive. To add a link to a
particular invoice, go to Insert and select Link. Add the invoice file
and click Apply. You already have evidence for the sales transaction
you entered. If you want your account
to have access to your sales transactions
and your invoices, you can share them with a link. Make sure that your links
are restricted and only add the emails that you
allowed access the files. Only this way your data
is protected. Okay.
21. Recording Expense - Print-on-Demand: Let me clarify why
it's important to record and track your
print on demand expenses. Adding all expenses related to your business
will help you have detailed and
summarized information about all deductible expenses, which is a key moment when your accountant or tax
advisor files your taxes. Before you start adding transactions to your
bookkeeping system, be sure that you
have consulted with your accountant or tax advisor and follow all their advice. I only give you ideas
on how you can manage an effective bookkeeping system for your print on
demand business, but your accountant
should confirm that all practices
you're going to apply will meet the
legal requirements in the country where
you run your business. To enter an expense transaction into your bookkeeping system, you need to open the expense
invoice and transfer the information from the invoice to your Google
Sheets expense file. When you have different types of expenses on the same invoice, you can choose how to
enter the information. You can choose
between two options. The first option is to add the total expense amount as
one business transaction. In this case, the information for your expenses
isn't detailed, and it would be a big
challenge to make decisions relating to
the money you spend. If you want more
detailed information, you should enter each row as a separate expense transaction
into your expense file. For example, on the Printify
invoice appear two rows. The first one is
the product cost, and the second one is
the shipping cost. You could add the total
amount of these two expenses and categorize the amount
as a Printify expense, but you won't know what
part of this amount you spend on the product and what
part you spent on shipping. Therefore recommend entering both costs as separate
transactions. This will help you to have
more detailed information on how much money your
business spent on different expense categories. Depending on how you want
to enter your expenses, you need to edit your
expense category column. If you prefer to enter the total expenses that appear
on your expense invoices, you need a few
expense categories. For example, you can add the following expense
categories, Printify, Shopify, utilities, Internet, and other
business expenses. But if you want detailed
information about your expenses, who can use a list similar
to the one that I use? I highly recommend having detailed information
about your expenses. Only this way you can make
rational business decisions. By choosing to make
detailed records, you should add every
single expense to your bookkeeping system
as a separate cord. It will take you
a bit more time, but you will have a
detailed picture of all your expenses and could track where your
money is going out. This information is
essential when you make a decision relating
to choosing vendors. Country is where to
sell and much more. In the previous video, I mentioned that each invoice
had its unique number. And maybe you would ask if each invoice has
a unique number, why do I see expense
transactions with the same invoice number? This is because each
expense position of the invoice is added as a
separate bookkeeping record. But this doesn't
mean that I received a few invoices with
the same number. It means that the
particular invoice has a few positions with different expenses
that are recorded as single business transactions
in the bookkeeping system. Regardless of which
option you choose, the total expenses on the profit and loss
statement will be the same. In the first case, the expense information
won't be narrowed down. In the second case,
the report will show the total expense for
each expense category, and you will know where you
spend most of your money. Both options have advantages
and disadvantages. The first option is time
saving but too summarized. The second option is time
consuming but more accurate. It is up to you to choose the
one that suits your needs. It won't be wrong if you
choose the first option. But I recommend the
second one because only this way you can manage
your expenses properly.
22. Inventory Management: The Google Sheets
table that you see tracks various accessories
available in a store. It contains a few columns. However, we'll move our focus
to the last two columns. The column named
availability shows the current availability
of each accessory, indicating how many units
of each item are in stole. The column named status
is where we will integrate the I
formula to determine whether a new order
should be placed for an accessory or if there is enough stock to
meet the demand. Let's set the function
that we will use to fill out the last
column of the table. The first element
of the function is the cell from row two and column D. It refers to
the value in this cell, which represents the
currently available units of the accessory
we are evaluating. The second element of the
function is less than ten. It shows the condition
and checks whether the value in the particular
cell is less than ten, which is the threshold we
set to trigger a reorder. The third element is
the word reorder. If the condition is met, I mean availability of the particular accessory
is less than ten. The formula returns reorder, indicating that a new
item should be ordered. The fourth element is
the word in stock. If the condition is not met, I mean availability of the particular accessory
is ten or higher. The formula returns in stock indicating that there
is enough availability. Then we just apply this formula to all cells in
the status column, and it automatically evaluates
each item's availability and provides the
corresponding status based on the defined criteria.
23. Inventory Categorization : Suppose you own a store
and want to categorize your inventory as
high, medium or low. You can use the I
statement to automatically populate the category column based on the quantity values. In this table, the
category column groups the items into high, medium or low, based on
the quantity in stock. Before we add the I function, we should determine the criteria that will categorize the items. We can apply the
following conditions. High for items with 50
or more units in stock. Medium for items with 20
to 49 units in stock, and low for items with fewer
than 20 units in stock. Once we've identified
the criteria, we can move to the function. We just click on
the first cell of the category column and
type or add the formula. Here, I've copied the
formula we're going to use. Therefore, I just paste
it into the cell. As you can see, there
are two functions. The first if function checks
if the quantity in stock. This is the value
in cell but two is greater than or equal to 50. If it is, it categorizes
the item as high. If the quantity is less
than 50, the second, if statement is used to check if it's greater than
or equal to 20. If it is, it categorizes
the item as medium. If the quantity is less than 20, it categorizes the item as low. You can then copy
this formula down for the rest of the items
in your inventory list, and Google Sheets
will automatically categorize each item based
on its quantity in stock. For example, if you have
an item with 65 in stock, the formula will
categorize it as high. If you have an item
with 30 in stock, it will be categorized
as medium. If you have an item
with 15 in stock, it will be categorized as low. This approach simplifies
the categorization of inventory items and helps in making informed
decisions about restocking or managing
existing stock levels.
24. Discounts : In the provided table, we have a list of books
with their prices, the number of units ordered, and the corresponding discounts. I will show you how to
calculate the discounts in the last two columns depending on how many
books are ordered. First, we will calculate the discount in the discount
percentage column using an if statement to determine the appropriate
discount percentage based on the number
of units ordered. If the number of units
ordered is ten or more, a 10% discount is applied. If the number of
units ordered is 5-9, a 5% discount is applied. If the number of units
ordered is less than five, no discount is applied. Knowing the condition that we will apply to the
discount column, we can add the I function in the discount
percentage column. The formula checks the value in SLC two and based
on the criteria, assigns the appropriate
discount percentage. A book that has 21 units ordered will receive
a 10% discount. You can then copy this formula down for the rest
of the book list, and Google Sheets will
automatically apply the discount percentage for each book based on how
many books are ordered. The last column calculates the actual discount amount
in dollars for each book. It does this by multiplying
the price per unit, the number of units ordered, and the discount percentage. By using these formulas, the table provides a
clear breakdown of the discount percentages and the actual discount amounts
for each book order. This information is valuable for the online bookstore to offer
bulk purchase discounts to customers based on
the number of books they order while ensuring
accurate calculations. You can easily apply these two simple formulas
for your business, no matter which items
or services you offer.
25. Payment Reminder : We suppose that you as
a small business owner, want to remind customers of
upcoming invoice due dates. You have the due date
for each invoice, and you want to send reminders if the due date is
within seven days. All you need to track
the due date of your client invoices
is the I statement. You should click on
the first cell from the reminder status column and
add the following formula. The I statement
calculates the difference between the column named due
date and the current date. For this class, we accept that the current date is
eight of November 2023. If the due date is within seven
days of the current date, it prompts to send reminder. If the due date is more
than seven days away, it indicates no reminder. This formula helps
you proactively send payment reminders to customers with approaching due dates. This way, you save time and organize your business
workflow better. Using its statements to
automate payment reminders in a small business streamlines
the whole business workflow. It allows you to
focus on growth and strategic initiatives
rather than spending excessive time
on administrative tasks.
 Viki, Feel Good Manager