Transcripts
1. Introduction and First Tip!: let us talk about a large data and content heavy presentations. This sculpture class is not on how to create such presentations, but how to present them and how to make them a bit more enjoyable to preview for your audience. If you'd like to learn how to design a slight and presentations, you have plenty off classes on that on my skills for Paige. Here in this class, I'll take an existing example content, have representation and show you tapes and tricks how to manage it and simply how to make it more enjoyable for your audience. Those will be no golden rules, which you have exactly to follow. Those will be self proclaimed tips and tricks invented by me during my career, which I would like to share here in this course exclusively with you. So let us make together even this introduction informative. The biggest problem here is that when we do content have representations. So we at one data second later, more later, a table and it's getting crowded in there. But we still as creators know what we're doing. But when we present it to an audience or someone outside sees this, he can get very easily confused and lost in the amount of data and information that's being thrown at them. This is simply why I do want to give you a couple off recommendations and tricks, how to chop up slights and make them visually more appealing. I also like to give a huge shout out and credit to two of my students who sent me example. Presentations and content. Heavy large data presentations, basil, anti war and a doctor. Jamel Ahmed. You are the real MVP's year. We'll take apart a couple off their slides here. Let's not waste time. Let's start electric. See you soon.
2. Start a project!: Hi, it would be amazing. And you can help
me on Skillshare by starting a product
for this class. Nice. At first, it doesn't have to be the ready product is go to the
Project and Resources tab. Hit on Create Project. And right, You're
welcome message. Later on when you create
slides from the lectures, you can share a
screenshot of that slide. You can do this by going to File Save As Selecting Browse. And you can select to
save as a JPEG there. By saving JPEG, you can select all slides
are just this one. Then you can come
back to the project, select Image and to just add
a slide that you created. I will be really happy to see it and it will also
be very helpful. Please start the
product right now. It will take only a few clicks and helps me a lot
here on Skillshare.
3. Switch Attention: Hello and welcome in this lecture. If you have a crowded slide with this lecture, I'd like to show you how you can split the viewers attention by, for example, setting items on two new separate slides. Let us assume that this chart and this text is connected. I'm not going into the details. I'm not a reading exactly what you're is. Let's just assume that when you give a presentation, you give all the informations on one slide. There are possibilities to split it up. Let me show you what I would do here. I would create a new slight or I will even take this existing slide. I would duplicate it. I would delete everything besides the actual text I want to have in the next slide. Let me delete those items. I am just taking this text, making it bigger with my control and right bracket key like this. And I'm putting that in the middle now from the previous light, I would just delete it. Once I've done that, I would just take this existing slight and I would again duplicated and put it below this information. So now let's see how that would work in practice. I have a still a content heavy presentation. But I'm not talking about the right side right now. I want you to focus on the left side. I would explain to you this graph one by one. And then as a confirmation, I'll go to the next light to explain you what I've just said. And this would be a little summary off the left side of this light. Once I would be done with the summary. I could then go back again to this slight because I duplicated it. And now we could switch our focus, our attention onto the right side. This will be kind of a attention switch. And possibly the interests of your audience would be reignited by just moving this little object onto a completely separate slight, making it bigger, Making it easier to understand. I hope this is a meaningful tipping trick for you and I. I recommend you use that in content. Heavy presentations toe split up the focus as much as we can
4. Organize Layout: Hello and welcome. In the next lecture here, I'd like to show you how you can take a crowded slight like that. Organize it a little up so it will, at least visually look more understandable to you. All right, consider very minor redesign. I'm not talking about a redesigning the slight right now, but it would be also useful. I'm talking about making some split changes to the slide. This is the original scope of this light. And look how many colors we do have here. We do not have to redesign everything. But for example, this slight is using a theme that he moved it away. And as you can see, this ingredient start here on the left side is like limiting the area where we can put the content. But since we have this used and the original presentation creator used that, let's just follow this. I would take the stable and at least aligned it here to this star because previously it was said here, this is unacceptable. In my opinion, as a designer, this would be unacceptable. Then on the right side, we have those two boxes and you can see one off those boxes covers up the box behind it. This is also, in my opinion, unacceptable. I would need to move this box a little bit to the bottom here, who have no spacing on the right side. In my opinion, again, as a designer, this is again unacceptable. I know this might be a pictures might be a table or something that we need to give some space on the edges off. A slight you, you like, never want to fill up the entire slide off course. There are certain situations where this can be plausible. But here, I wouldn't think so. So I would align those top boxes with this top design here with this top graph. All right. We kind of refocused it a little bit, redesigned it a tiny bit. I still do not like the bottom box. I would be forced to make it smaller. I would maybe consider to make this entire graft a bit wider and a bit a bit smaller in that department. Now, I could place it here. I could make this box bigger. Maybe also this text books a little bit bigger. The text inside can be bigger but discreet. Another problem. This problem here is that this is a text box and we cannot easily change the size of the shape. Now you understand why I always use normal boxes instead of just text boxes. At this point, this slight I wouldn't call it redesigned. I just refocused also the title. Why not make the title in one line? I made the title in one line right now here and look at that. With a few clicks and changes, we at least organized the slide. We have some higher king now, now, as a viewer, as if you are now on the left side. I see that there is some data. Probably the presenter will present this data to me Then since these books on the right side is so big, probably this is something important and the de presenter will switch his focus After he explained this graph to me, he'll switch the focus to this box. I would still off course change the colors because I do not like that. There are so many colors on this light yellow, green, blue, dark blue, red, um, another blue in the background. But that's redesigning, and that's for something completely different. And other parts of this course are about that Here. I wanted to give you information that even content heavy and large data slight can be arranged in a way that the visuals are more set into place. We'll see each other in the next lecture because I want to show you a few more tricks like that.
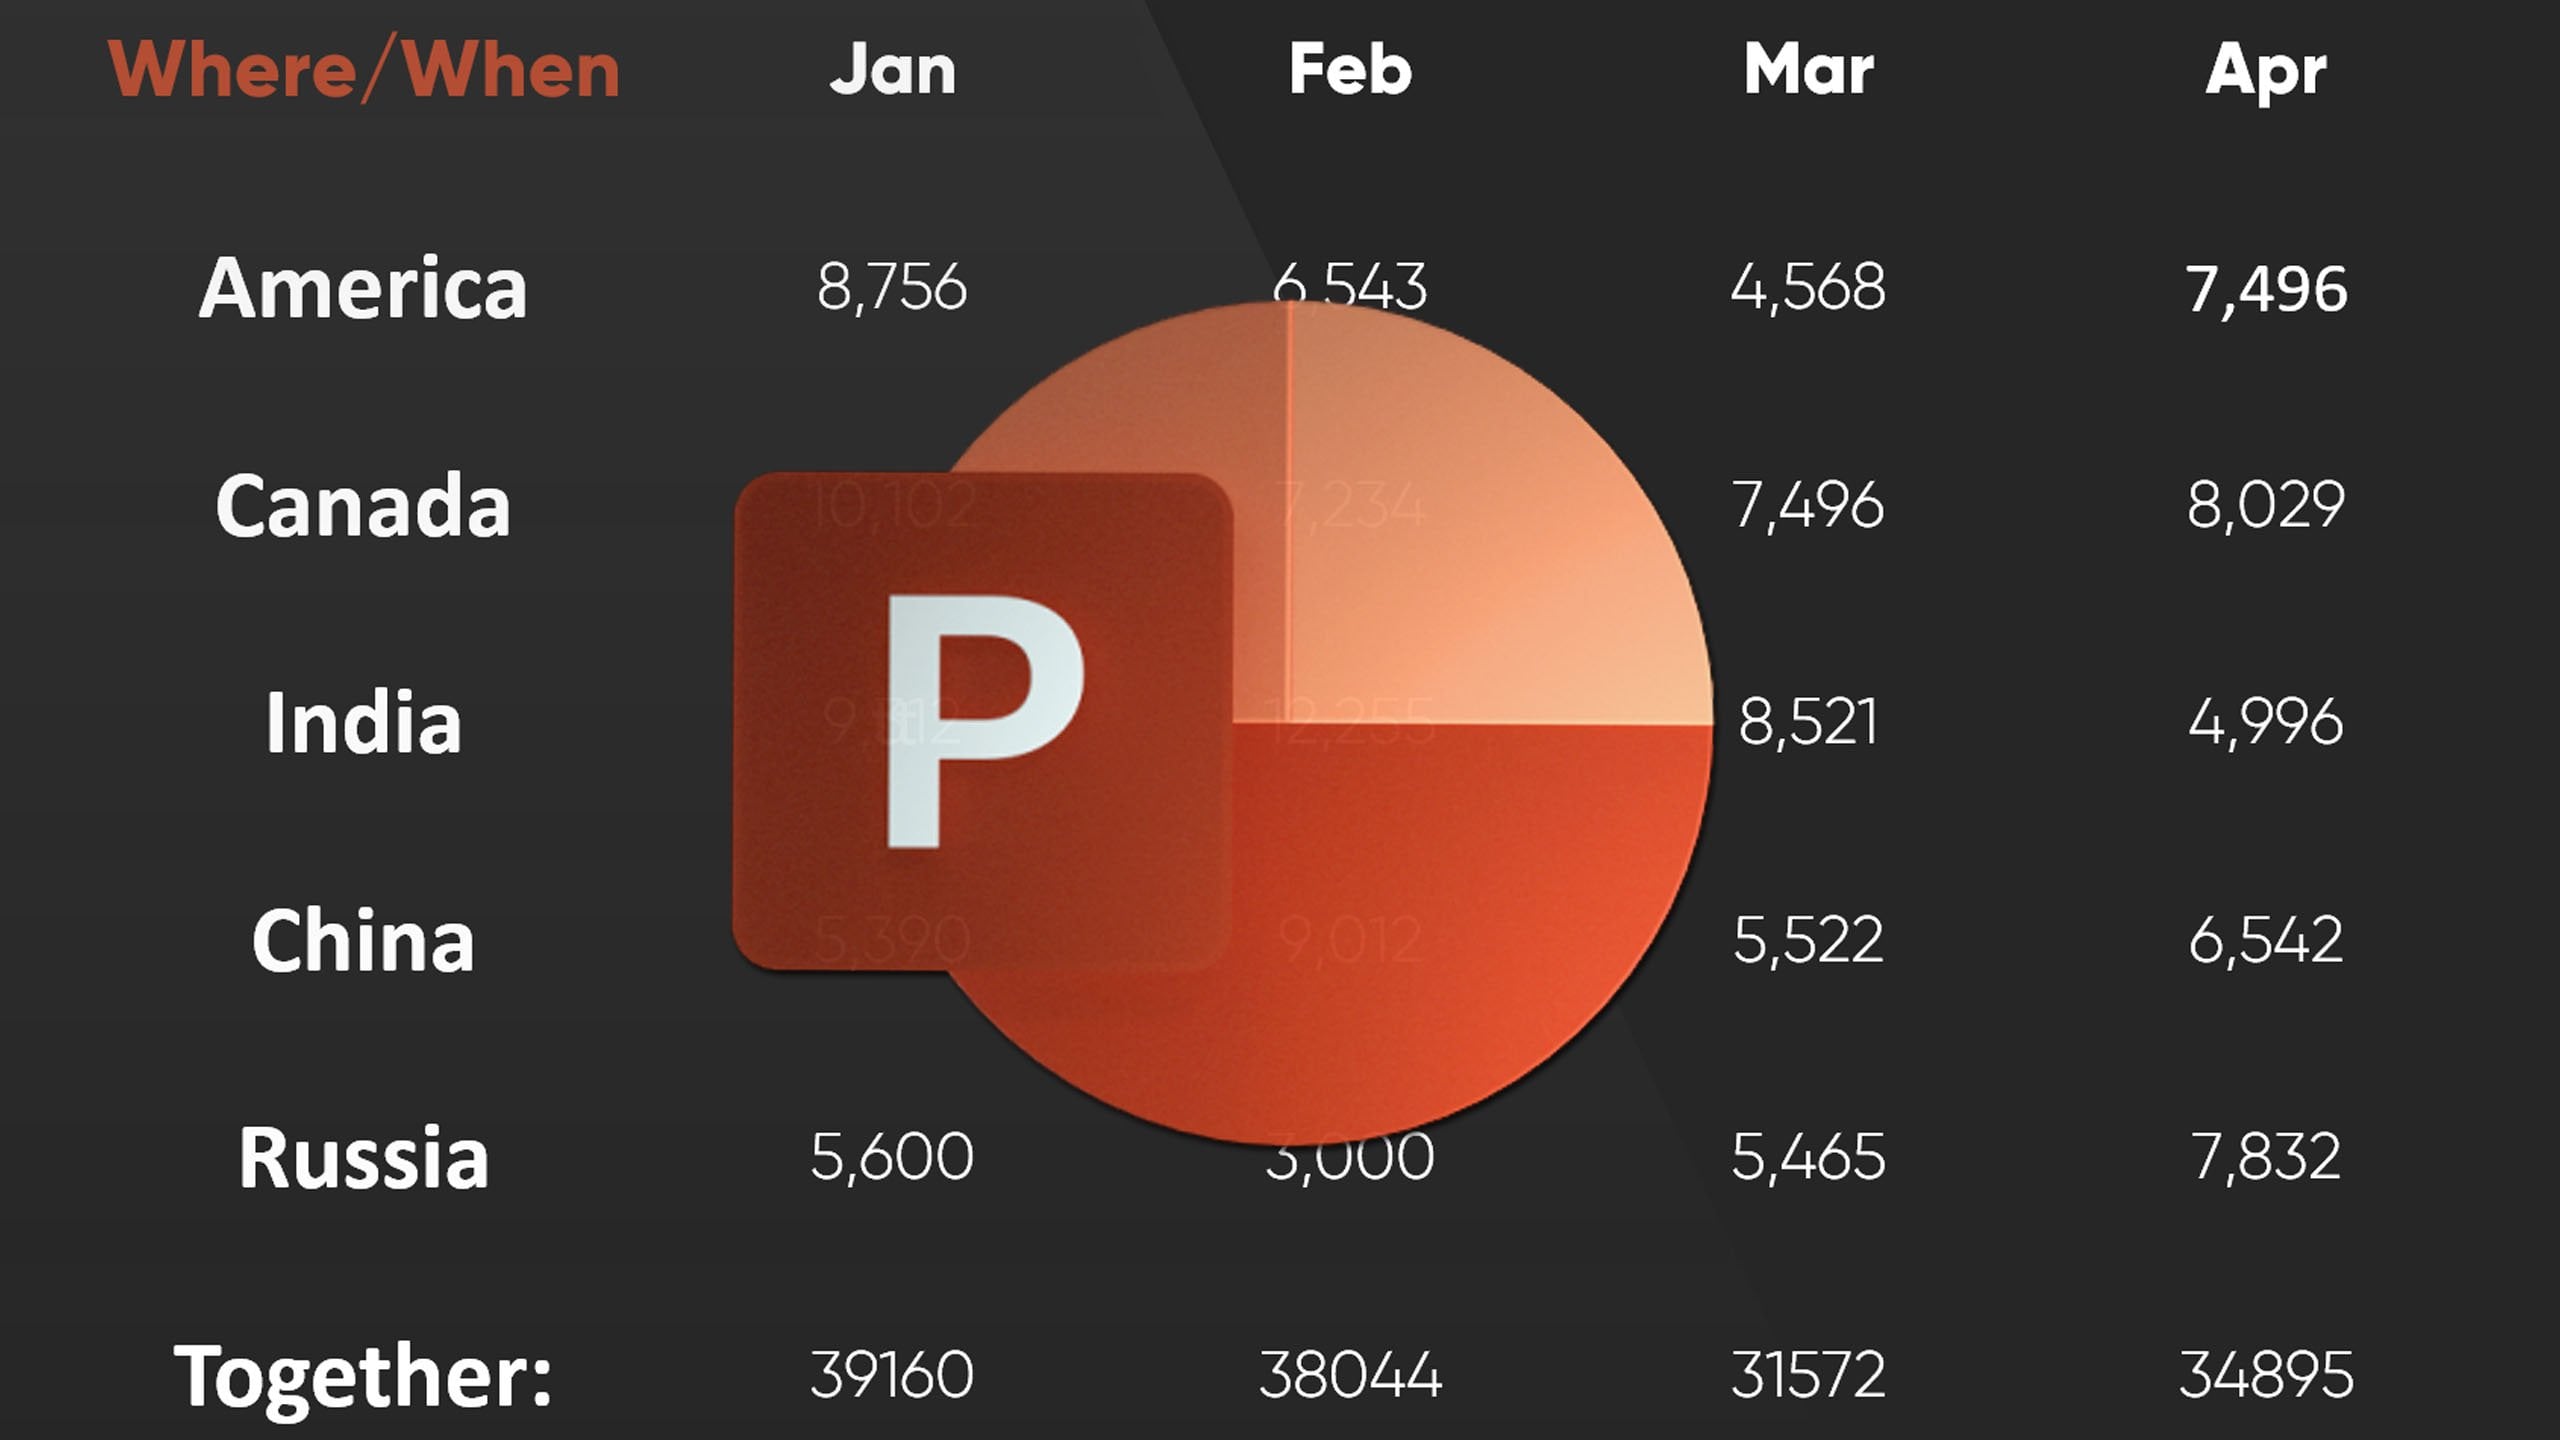
5. Make data Cohesive and Understandable: Perhaps I already introduced what? I will talk in this lecture in the previous lectures because I am going not towards a redesign, but towards simplifying slight this slide right now, it looks kind of okay, but why don't we make such a slight out of it? I don't mean the colors. I mean the simplifying off things. The most striking thing here is, in my opinion, that we have completely different colors for this chart. And for this, which probably is like, also very important information that this has completely different colors and values as this on the left side. What I did what I recommended here is to delete those informations, put them summer separate or make the presenter just safe. But perhaps they're so important, they should be visualized. I'm not judging that. I'm just judging from a viewer point here, I would at least consider putting those two boxes what I personally would do. I would just quickly go to insert shapes. I would insert another shape, and I would at least try to make boat boxes similar and size. Let me quickly bring that to back. So I will make this one a bit bigger. because this is a native PowerPoint chart. I have complete freedom off its redesign, and I can resize it at any given point. Then I only this book's a smaller so it matches this box. But we also have here some credits, and maybe this credits should be also considered, So I'm making that bigger now. What about the textbooks? Since this is a textbooks, I can go to shape format shaped Phil and give it no Phil. Also old line, no line. Now I can adjust the text a little bit, at least in its with. Maybe not in the height, and I could put this text on this box. Now those two boxes already look a tiny bit more consistent with each other. Off course, we have different colors, but that's not a big issue. The colors could stay the same way they are, or I could consider to make it a white background. It's nice that this year this team, which is used in the background the blue theme, has its own colors. But I'm not a fan off this design because the layout itself is very limiting. But we are working with that. What we have I would just take this outburst control G. I will goto animations and I would give it any information, even fate. It doesn't matter. Then I would present this slide and I would probably explain to you those data, no matter what they would be. Then with my next mouse click, I would just fate that second books in Then I would talk about this second box. This will be my approach for this light if it would have to stay like that. If it doesn't require any redesigning what will be the take away off the selector, consider simplifying slight splitting later and making boxes on a slight at least visually consistent towards each other. Well, if this information is less relevant off course, we can make it smaller. This now would indicate to the viewer that this is more important than this. Thank you for listening to this lecture. I know this might be like not very pretty to listen to its It's a complicated topic and not eat. Presentation will be treated the same way here. I just wanted to show you what I possibly would do. And this is more off a tip entry personally from me, then a golden rule guidance which I want to give
6. Expressing Large Data on Tables: hello and welcome. In this lecture, I found this beautiful table and I'd like to show you a couple of tricks which you could do to make them a bit easier to understand and watch for the viewer. When it comes the tables and large data, this presentation is just something amazing. Look at all those tables. Oldest later. And each of them isn't difficult to present to anyone. For example, this one is an absolute thing of beauty. Not only is the content interesting, but it's a great example for us to talk about watching this slight right away. What is coming to my attention? I'll just press control de to duplicate this slide. There is absolutely plenty off unnecessary information here. The table in itself is already difficult. So why do not we just delete this first part? Also this on the left side top markets, All of those are top markets. Why do we need this year? We don't. So I'm simply deleting it. What else do we have on the slide? This slide is about users off Excel spreadsheets and what I like about this light is that we have low, medium and high with low medium and high. All high values are highlighted with the red color. This is something I really like about this table because we instantly see where the like crucial and the high usage off Excell is present in which categories. And this is a something very positive about this table. What? I also notice that this table, if we go to the top site, you can see table design. So this is a native Power point table and this is for us, absolutely amazing, because we can take any information from here. We can change the text. We can change, the color, decides the borders everything. So this is an amazing information for me. What I would personally do if I would be maybe not to redesign. But if I would be to help this person to make this a bit more visual, I would place the table in the middle of the screen. I would take the legend off this table and I would present it on a completely different slide. Simply news, light, delete everything and just put the legend here and let me show you the trickier. Since this is a native Power point table, I can take any data from here. Control See and control V and make it bigger. And my left control and right racket to make the text bigger. Do not do this now. I just want to show you my personal tricks for it. So we have low, medium and high. Before presenting this table, I would as a presenter softer, new down and tell you Hey, On the next light, we will face a very big and content heavy table. But do not be afraid. I'll break the data The most important data for you down. And we will discuss about what we found here. Our key observations before we do before we proceed to the table, I just want to give you a quick heads up. You will see a lot of letters in the stable. The letters will be L M H. And right now I would explain the legend. All those letters are low, medium and high usage Off excel spreadsheets in countries in different categories. Blah, blah, blah. OK, now, since you are a bit soft and down, I can present you the table itself. But do not get afraid. I'll tell you which informations you should look at OK, at this point I have a big an overwhelming table in front of me. But since this is a power point table, you can take here the left slide, just a duplicated. And do not be afraid of duplicating slides because no matter how much slice you have in the presentation, you can always right click select at section and overwhelming people. Now you can always break it down into sections. So this section will be my overwhelming table. OK, what I would do, I would go to my freshly duplicated slight. And let's say that I want to explain Canada. No problem. I'm selecting it. Control right bracket key to make the text a bit bigger because I can. And because I have a very little text here, I can make it bigger. Then I go to a table design borders outside borders. Okay, I have a big outside border. I selected an orange in because here on the right side, you can select the size off a border. I selected three with pen colorize like orange. And now click on Borders. Okay. No, it's a explain Canada to my viewers. I know that later on For some reason, I will explain Japan and I just duplicate the stable. I do the same. Please do not do that. Now I just want to show you what My usual recommendation for people who present would be eso. I have now two additional slight showcasing this information so worried I was showing you this overwhelming table and I want to switch your focus to Canada. Now now held would explain Canada in those categories and so on and so on. After I would be done I know that I have prepared to Japan now I would like you to compare Canada to Japan. And why is that? Why is that? And I would explain all the informations here. You see my reasoning behind it. Watching at such a table in about 10 or 15 seconds. No one knows where to look at. Yes, I can say Canada. But who really sees that? And who will interpret those informations? It's of course, up to the presenter. This is my key. Take away for you for this lecture. I hope this is a very useful knowledge
7. Leave a Review, Please: Hey, it would be extremely helpful for this
class if you go to the Review tab and click on leave a review and
write something there. If you don't see
this button yet, you need to watch a
few more lectures and it will become available. Sculpture now requires that classes have recent
reviews on them. So it would help me greatly. You just click here, you tell if you'd like
to class or not, and you write a simpler
view and click Submit. I would be very obliged if
you can do this right now. Thank you so much
and see you soon.
8. Working with Data on Inserted Pictures: with this lecture, I'd like to present you a couple of tricks that you can do to a table. If the table is an image, you can, for example, give them borders or do some custom animations, which will really enhance the viewer's experience. In the previous light, we had the luxury that this was a native Power point table. What if I have a new slide and this table is here, pasted just as a picture, so I wouldn't have any control over it? I would just have a picture here. Well, we can do some things. One thing we can do is to duplicate this light as usual. And, for example, you can go to picture format Krupp, and you can crop it to the place you want. For example, I was talking about Canada. I would crop Canada. Either I presented on a separate slight, or I bring it to the original slide here, and I make it a tiny bit bigger. If I give it animations. If I give it a fight animation, you can see on this slight I would like you to focus on Canada, and it's a tiny bit highlighted another way to highlight is to go to insult shapes and insert arrows. Remember, you can always insert a narrow. What's also a very cool trick from me personally is Goto animations. Select any animation. It can be fate. It doesn't really matter. You can always open the animation pain. You can double click and you have sounds here. And those sounds are pretty horrible. Let's face it. But at least one off those sounds. I like the click sound. It's a simple click sound, okay, and you will notice that once I have Canada and I have this little click, it's like always sweating the attention off people a little bit so you can do multiple off those off those animated into the presentation. You can highlight certain sections. And remember, since this is a picture, you can also click on it because right now it's a very little visible I goto picture format . We can always go to corrections toe, brighten or darken it down. Brightness isn't helping care much, or we can recall. We can only recall aerate in the scope which PowerPoint allows us here. What I would do. I would either lower the temperature so the white collars will become blue and cannot there would be better visible. The last week I want to show you here is to simply take a rectangle, place a rectangle around the object you want to explain shape filled. No Phil shape, old line. A big outline. I would even consider going to more lines. Selecting a solid line and giving the wit really like 20 points. It doesn't matter, and again so right now we have this big rectangle shape around it. I will goto animations. I would fade to this shape in, and I just need to remember that I want toe all three items I've selected here. I want to add animation disappear because after I am done explaining with the fourth mouse click, I want all this to disappear. So let's face it, we have this table. I want to switch your focus to Canada. I was able to separate Canada. I was able to give it in this little arrow. I was able to give it this really big outline. If I wanted to remember, you can animate all things off with my next click, and we are back to the basic table. This is a more animation oriented trick, but still I think it is very valuable
9. Utilizing Office 365 ZOOM: with this Lecter, I'd like to show you a cool, powerful in future, which is called Zoom. This Fisher is brought in office 3 65 subscription and available since power 650.2019. But if you have an older version of PowerPoint, I'll show you a little work around what you can do to achieve a very similar result to the zoom feature. We have everything said here on one big slide. Why not chop it up into four smaller slights? If you are using at least power point to those 19 or the office 3 65 subscription, you will have access to the zoom future. Let me show you what I mean by using the zoom feature in this particular slide. Let's take this information control X to cut it down new slight, and I'll bring this exact information to a new slide. The problem here is I would need to take everything I would need to make it bigger and resize it. But let me do it in a few seconds. All right, I have this light a bit bigger, so this information is now on a separate slide. If you have the zoom feature you can simply click on this slide. You can drag it into this part of the presentation, for example, make it a bit bigger. What is a very interesting here that when I played the presentation this is now alive? Slight. This is what was added to power point. And not only can I read this a conflict, this slight and power point will automatically zoom into this slight. What's important with my shift and left click? At least this is the current shortcut. If I have a keyboard, I can just shift and left click so I can go back to the original slide. This is a very interesting way off doing this. I could separate all this into separate slides and then I could just drag and drop and portal slight here, and they would all be zoo mobile with this one slight. The little downside is that our presentation would have more slight. But if you want to continue this presentation, you can always go straight to the last slide. For example, put it here on the very bottom. And if you want to continue the presentation and not click on any off this, just go to the right side. Click on this and this would bring you to the end off this section. It doesn't have to look like that. You can put anything here. You can just write, take, change, image. You can change the image. You can even use an icon. For example, this would be next. This is one of PowerPoint icons insert. And now, if I would just want to continue this presentation I wouldn't want to explain you all those slights because this will take me too long. I'll just click on next. It'll bring me to the end of the section. If you do not have the zoom feature, you can always impress. Shift A five to play a slide breast print screen on your keyboard. And once you arrived back in Power Point, just press control V. This will paste a screenshot off this slide, and you could place this screenshot anywhere you want. For example, on another slide like I did here. This screenshot is a normal image, so you can always go to picture format. You're gonna crop it. You can make it bigger, smaller, But the trick here is that you can right click. You can select link. Want to sell it link instead of current folder, You can simply select place in this document so you can link this print screen to another slide in your presentation. For example, here we have Flight number 30. Let's make this as an example. Okay, now I will play this slide, and I know that when I take my mouth and I click here, this is a life link. This will take me immediately to this next slight. This is a little way to overcome. If you are not having the zoom feature, I hope this is also a very valuable tip. It's not for every user, and it's not always usable, but I just want you to know that something like that exists.
10. Summary: We were talking about large data and content heavy presentations, not how to do them. But what can we do to make them a little bit easier to read? And easier to understand s a summary. I created this slide and I will start with mind your audience. Just because you understand complicated tables and data doesn't mean that the audience will exactly know what you are talking about, especially since you're the one creating it in the next lecture. I was talking about switching your attention, and that's exactly what I did here. I am not presenting you this entire slide because I thought this will be like, hard to understand what I'm talking about. I'm switching your attention toe one consistent topic at the time, and then I am proceeding forward. So while telling about moving forward as the next, this lecture was connected with other electors. Because here I was talking about organizing your layout. We were trying to make at least the slight visually a little bit more organized, making the tables to the same sizes and making everything perhaps to the same color similar to the next lecture where again I was talking about consistently and cohesiveness. If you do remember, this was the lecture where I was trying to position everything properly and get rid off unnecessary information. Okay, moving along forward. Later on, we were working with tables. Now this was a very cool topic. But remember when you present tables in heavy data and large data presentations, if they are created right there in power point, remember you can duplicate and plenty of times you can split information into separate slides and you can even highlight informations for example, by the leading existing data and focusing yourself just on the one data you want to highlight on this slight. Then on the next light, another data can be presented within the same table after the tables. I was telling you about pictures and for the pictures it will be the same story with pictures you can make screenshots. You can goto picture former crop. You can crop down tables to just the essentials hitting crop, and you can always give them some outline or do additional things like adding pointers. And this brought me to the last topic. This is more often additional topic where I laid out a slight like that multiple informations accumulated over one slide but separated into several orders. This way, I hear utilized the zoom feature to create this kind of nice, slight thank you for your attention and let's each other in other lectures like that.
 Andrew Pach ⭐, PowerPoint, Animation & Video Expert