Transcripts
1. Introduction: Welcome to Microsoft Copilot and learn the Excel AI basics. So what I'll teach you is the introduction to Microsoft
copilot and how to get it, the prompting basics on
the foundations of being able to write prompts correctly
and get the best results. And most of all, copilot
in Excel in action. I'll show you step by step on
how to create it with hands on examples that you can
also do at your own pace. So see you inside the course.
2. Free vs Paid Copilot: Hi, this is Brian Hong and welcome to the co pilot course. So to start things off, I want to discuss about the different versions of co pilot, because if you do a search, it's confusing because there's a lot of versions
that are out there, and sometimes you
can't even tell what are the differences
between each other. So I want to go through quickly, there's three
versions of co pilot, and it's very important to
know the right one to use, especially if you have
confidential data that you need to have analyzed. So the first version
that we have is copilot.miicrosoft.com. Take note of the URL over here. This is called copilot personal, which is free for
everyone to use. So it's very similar to hat GPT, if you notice the
interface, right? It's very similar. Even on
the left side over here, the sidebar, that's
pretty much hat GPT. So if you type in
here, let's say, I'll just type in a random
statement over here. This is free for
everyone to use. It's also grounded on the web. So what we mean by that is that what you put
in here as well, is used for training data. So if you have
confidential information, then definitely do
not put it here. And this is only good
for generic quiz. So if you have
something on your mind, you want to ask about anything that you would do
for Google search, then this is what you can
use inside co pilot personal because there's pretty much no data security
in this version. So the second version is the Microsoft 365 co pilot
chat, as we see over here. If you notice the URL, it's 365 Cloud
Microsoft slash CHAT. And the main differences as compared to the co
pilot personnel that we saw on the first
one is that this has enterprise data protection. So which means that if you have confidential stuff that you
want to send over here, then you are good to go. It's safe over here. And
another thing is that you would need an eligible Microsoft
365 subscription. So once you have that
eligible subscription, then you have free access as
well to the co pilot chat. So if you notice over here, if you just jump
to this article, you could see that if you use
Microsoft 365 copilot chat, then there is data protection, and one of the important
things here is that your responses
or your work content, right it's not being used
to train foundation models. So which means that it's also being encrypted inside
your chat session, and this will be safe to use. What we want to do with
this course is I want us to be focused
inside copilot chat because this is the better
version to use when it comes to data safety
and data privacy. And one last thing is
that with this version, if you use this, it's
also grounded on the web, which means that
it's going to use information from the web for its model when it comes to creating its
responses back to you. So the last version
and the third one is what we call as
the co pilot chat. So you can see that it's
the same URL over here. But the difference is this is paid with a separate license using your work or
school account over here to be able to access
more features. The main difference with
this one as compared to the copilot chat that
we saw a while ago, is that there are two tabs now. There's Work tab, and there is the web tab because
with the work tab, that means that whatever
you're asking co pilot on it can be grounded on your
work data and the web data. Anything that's inside, for
example, your outlook emails, then it can also
search that data and get information from
it. So, for example, right? You can see over here based on my prior interactions
with a specific person, then give me whatever's
needed for my next meeting. So it's able to
access your work data as compared to the
previous versions that you're only able to search for web information or
whatever into Internet. It's pretty much the
same thing as well with the co pilot chat
that we saw a while ago. It also has enterprise
data protection, especially you could see over here on the upper
right corner with this green icon that you have enterprise data connection
applied to this chat. And you can see on
the lower left here, there's Microsoft 365 copilot, and there's the premium
because this is a paid license for this one. So the bare minimum
that we need for this course is you need
to have co pilot chat because it's really best to have that capability
for data protection, and we would be able
to use that when it comes to inside
Microsoft 365.
3. How to get Microsoft Copilot: Let's talk about how to get
Microsoft co pilot chat. So when we say co pilot chat, we're pertaining to
this version over here, where we want to have the
enterprise data protection. So the first route
that I want to share is about the
individual plans, and the second one is
about the business plans. So for the individual plans, this is pretty much
that you could have Microsoft 365 subscription. So you could see for
personal over here, then you have co pilot
chat as well included. And then do take note for the family subscription, though. It's only the main
account holder that has the co pilot
subscription or aces. Okay? So take note of that. And when it comes
to the premium, then this premium has the capability of
using co pilot agents. So we'll discuss co pilot agents in detail later,
but in a nutshell, it's able to interact directly with your
Microsoft documents, whether it be Excel spreadses, whether it be Word documents, it can make changes to your document or
spreadsheet directly. Through the use of AI agents. So that's pretty much the main difference when it comes to the premium subscription as compared to the
personal subscription. If we jump over to
the business plans, so take note whether you're an existing customer
or a new customer. So if you have a
work account and you already have 365
access over here, then you could add
in the co pilot chat license version through the add on of this co pilot business. So you can see over here, right, it's another one that's on top of your current
365 subscription. But if you're a new customer, if we jump over
here for business, then you could pretty
much get the 365 aces and also the co pilot
license version as a bundle together
over here, okay? So if in case that, okay, you don't need the co
pilot chat license, then you don't need the
business plans over here. But if you need access
to your work data, if you Microsoft
copilot to be able to access all of your work
information to make it seamless, then you need a
business plan for this and a work
account as well. Okay? So take note of the differences between the individual plans and versus the
business plans when it comes to using co pilot chat.
4. Data Security: Quick word about data security. So I want you to consult with your IT department
for your AI policy before using copilot chat because I want you to be
sure that you are protected, right, because pretty much
different ID departments have different policies when
it comes to the usage of AI, and especially the
green checkmark is very, very important. I want to stress that again with enterprise
data protection. And you can also share them
this web page over here about the data protection disclaimer is that this session
is informational, and this reflects
our personal views. This doesn't reflect any professional or IT or
security legal advice. So you're responsible for
how you use the AI tools in compliance with
your company policies and validating all
of its outputs.
5. What are LLMs: So when it comes to
the world of using AI, I'm pretty sure you've heard of large language models or LLMs. So I want to do a
quick explanation on what's under the hood when it comes to discussing about LLMs. So when it comes to co pilot, it pretty much uses LLMs to be able to give a
response back to you. So think of an L&M
like a super complete. So, for example,
if you use Google, right, let's say, I
type in the word hello, so it's able to predict
on what would be the next one based on the patterns
that it has recognized. So the L&M, in a way, you could think of it
as similar in that way. So, for example, we
have an example, the future of blah,
blah, blah, right? And then it tries
to think of, Okay, based on what I
know, then this is most probably the next text
that's going to come out. Okay? So it makes a prediction. So it doesn't really think like a human being
would like you and me, because that's how I thought
as well before that, Oh, is it really intelligent? But copilot is doing
is through the LLM, it predicts the next word
and generates responses based on the large language
model that it is using. So you need to think of that.
It doesn't really think. It doesn't really have that
capability to think like us, but it just based
it on patterns of the training data that's in
these large language models. This is why it can be
really helpful when it comes to using these AI
tools, but at the same time, you can also understand
that it can also be wrong because if
the training data is garbage or wrong
to begin with, then pretty much
garbage in garbage out. Okay. So in corporate settings, armed with this knowledge
right now or understanding, the most important skill
that you need to learn is being able to ask
precise questions, okay, so that the AI or copilot would know
what you really need, which I'll teach you
in a short while. And at the same
time, you should be able to validate
outputs as well, which is not blindly trusting on what the AI is
giving back to you. Trends over here, you can see
it's able to write content. It's really good at
writing content. It's able to answer
your question. And when it comes to
helping with tasks as well, we'll see it, especially
with co pilot agents. I'll demo that to you as well. But for the limits, it could
be confidently inaccurate. So that's one of the main
issues when it comes to AII, because based on the
incorrect information, right, they're pretty confident in giving you a response back. So which means it's our responsibility to be able to validate and make sure that, Okay, is this response
correct or not? It doesn't really understand. As I explained, it's based on the large language model and
then predicts the next word. When it comes to lacking
of real time information, you can ask it to get
information from the web, so that it can update itself and then give you the
proper response.
6. Personalize Copilot with Custom Instructions: You know that you
can personalize co pile chat with
custom instructions. So I'll show that to you quickly so that you can
have better results. So I'll just go right here
to the upper right corner. Click on the Tree dots and
the settings over here. And if we go to personalization, you could see custom
instructions over here and I'll click
on Adit Instructions. So here, you can give co pilot an idea
about your context or your background so that
it knows more about you and can fashion its
responses based on that. Or you can also add
custom instructions. There's a lot of
examples over here like give honest feedback,
prioritize my manager. You can use clear
and simple language. So maybe one example
that I can have is, what if I'll put in here? Always explain like
I'm a fifth grader. Okay? So I'll save here. And this will apply to every conversation that
I have with Chat GPT. So I'll go to the web
right now because I want to get it from
web information. So let's say I just want to type in what is rocket science. Okay, so if we see the answer, you can see that the custom instructions that
we placed in here, let me explain it like
you're in fifth grade. So it immediately applied
to my conversation. So, for example, let's
say you wanted to be using formal language always, the responses, then you
can put it as well. Anything that you want to
be done because you don't want to explain to copilot
over and over again. So this is what
you could use for the custom instructions
to make it easier for you when it comes to getting the
responses from copilot.
7. Prompt Basics - Prompt Structure: Let's talk about prompting. So particularly the
prompt structure, how do you structure
your prompts so that you can get the best
possible result. So over here is we have
the Microsoft website of the guidelines when it comes
to writing your prompts. It's the acronym GCES and
it's fairly straightforward. So first thing is the goal. What do you need? So you
need to state to copilot. And then we have the contexts, pretty much the background that copilot would need to
know to perform your request. Next is the expectation. So how do you want co
pilot to behave or what's the output to best
fulfill your request? And lastly, is the source. Does it need to have reference to a document, to a website, or any other information
that copilot can use, Okay, to get the best
possible result. So in my case, what
I usually do is I think of talking to
a normal person. Okay? So instead of copilot, I'm thinking, Okay, I'm
having this conversation. I want this person to do a specific task
for me and it will naturally include in my request all of these four components. So what we'll do right
now is let's jump in to co pilot and then
we'll try a couple of bad and good
examples so that we can see the difference
of GES in action. Okay, so we're
inside copilot chat, and in our scenario right now, we'll just use the web version
over here because we just need it to help us create
an X lookup formula. So we have this
example over here. We have this data table. Then we want to search the
product ID, which is p003, and it will just look up and
do a price result over here. So we just want to look
for the price based on this table with
an X lookup formula. So let's start off
with a bad example. Let's say we just
type in co pilot, give me an X lookup formula. So since it's very generic, so you're not following
the GCS structure, so what you will get
as well is pretty much another generic result as
well or answer from copilot. So it just gives you a
sample formula here, but it's not specific to your use case or your
problem over here. So if we recall again, we want to use goal, contexts, expectations,
and source. So we'll just do a
quick sample over here to see how should it
be done properly. So let me just put this in, and we have here, help me write an Excel
X lookout formula. So that's a goal, okay? So we're being clear
to copil over here. Next is the contexts. So I have a sales worksheet, which is pretty much
this one on the right. And in cell F two, I will type in the product ID. Yep, that's F two over here. And then my product list is in the columns of A two, D. Okay? So we're good. Column A is product ID,
etcetera, etcetera. So we're just specifying what
each column is over here. Pretty much copilot
would be able to know, Okay, which one do I need
to get information from. Next is the expectation. So we have this part over here. I want the formula to
return the pride from column D. So we're
very specific. Give me the exact formula, explain it step by step, and include an option
for what should appear if the product
ID is not found. Now, this is pretty much
the worksheet structure, so we're just being
specific over here. Okay, let's just give it a try and see what's going to happen. So it's pretty straightforward. We have the exact
formula now over here, so we can just copy as well, and then let's just
give it a try on our spreadsheet and
see if it looks good. Now, if you press Enter, right, we have p003, and it has
returned the amount of $45.50. So let's just give
it a quick test and then p005 and it's
able to look it up, and it works perfectly fine. Now, the good thing is, even with our additional requests, it's also the optional
formula here. So which means that
if it shows nothing if the product ID is not found because over here
with this formula, let's say I just type in 11, which doesn't exist, right? It just specifies
product ID not found, and then you can also
change it to return blank instead of a message of
product ID not found. So because of our
specific requests, it's able to generate
this correctly for us. So pretty much garbage
in, garbage out. If you give it like a
really bad like prompt, you're not following
the structure, then pretty much
you're going to be frustrated as well with
the responses of copilot. So what we'll do right
now is another way is we can also
type it over here. And this is actually an
easier way because what we'll do is we'll just attach
the workbook, okay? So instead of specifying the
column names from A to D, for example, it's a lot of work. It's like you're describing
the workbook step by step, and it's pretty inefficient. So one of the cool things
is you can actually attach the workbook and you can
have a shorter prompt, still following
the GCS structure. So you can see here,
right? This is the goal. And then this is our context. Look inside the workbook, okay? And then this is
our expectation, and we're still
specifying that, okay, if product ID is not found, create the appropriate
X leap formula, and pretty much the source is
use the attached workbook. So I'll just attach it
quickly and see what happens. So now we've attached
the workbook over here, pretty much this
one, and let's see if copilot is able to read this. Okay, so let's
have a quick look. It was able to read from inside, and it's also able to tell that, Okay, F one is the
search product ID, and G one is the price result. So it's able to open the
workbook with no problems. Now, let's have a
look at this formula, and let's give it a quick test. So I'll just paste
it in over here. Okay. So okay, it's looking
for the product ID. We have the product
IDs over here for column A and column
D for the price result. So it looks great, and it's a lot faster for us to write this shortened
prom. So okay. And then you have the explanation
as well at the bottom. It's also able to give us the blank result if it's
unable to find the product ID.
8. Prompt Basics - Tips and Tricks: Let me go over some quick tips, five tips on how you can
maximize Microsoft copilot. So tip number one is always pick the thinking model because over here on the
upper right corner, you can click on this dropdown, and you can see that, Okay, quick response or Auto. Or Think deeper. So Think deeper is
the thinking model, and I really prefer
this because I want copilot to spend enough
time to make sure that, okay, you're giving me
the best possible answer. Tip number two is
picking the correct tab. So we have here on top, right? If you have the license
version for copilot chat, then there's pretty
much two versions. You have work or web. So if you need Copilo to
access your work data, then make sure to
select Work tab. If not, then just stay on
the web so that it won't mix the data from your work to
the results from your prompt. So it really depends
on your needs, so make sure to select
the correct tab. Tip number three is avoid using abbreviations or shortcuts because you want
to be as clear as possible when it comes to
prompting with copilot, because if it's unclear, it's going to make assumptions. And if it makes assumptions, then you won't get the
right result as well. And it won't tell you
because otherwise, for example, over
here, let's try. Let's say, help me with GCES. Let's see if copilot is able to. Okay. So now, it doesn't
even know, right? Okay, is it math? Is it English? Is it science? What do you need? So it even made the assumption. We're pertaining right to the prompting structure of
GCES if we go back here, GCES over here, but
it's actually now GCSE. So if you're unclear, then it's going to cause
confusion to copilot, and you're going to be
frustrated with the results. Tip number four, is if you
are moving to a new topic, then it's best to create
a new conversation. So, for example, let's say we're talking about this
topic over here, and now you want to talk
about food recipes. So it's best to
just go over here and start a new
conversation altogether, because if it's still
inside over here, then co pilot will use this as context for your
current conversation, and it could be confusing
Tip number five is if you do not like the results of the current conversation
with copilot, or if the conversation
gets way too long, then it's best to start a new
conversation from scratch. So it's actually easier doing that rather than going
through that back and forth and you're getting that unnecessary
result from co pilot that is just best
to go over here and start a new
conversation altogether.
9. Prompt Basics - Verify Results: Let us talk about
verifying results. So one thing that's
very important is all of the outputs that
copilot will give you. You need to be able to verify the correctness
of the output. Because one of the
most useful skills nowadays is being able to use AI tools correctly
and effectively rather than just blindly
accepting whatever it gives you. So for example, let's say
we have this over here. It's the same example
that I had in a previous lesson wherein I have this table and I want it to give me an Lou formula
that will search the product ID to give me the
price based on this table. So it's a fairly
straightforward example. So what I did was I was
doing some testing, okay? So I just put in the prompt, give me the exenc formula, and then I explain it over here and the attach the workbook. And this is what
copilot gave me. Okay? So it's able
to say that, Okay, these are the headers,
column A to D, right? Looks good. This is the
red flag over here. So we have E one as
the search product ID. So somehow it wasn't able to
read the workbook correctly. So if I blindly accepted this, I just copy this, right? And if I taste the formula here, you can see that it's
starting to look at E two, which is the cell
instead of the F two. If we put it in now,
it's going to say, Okay, product ID not found, even though we have p003, like clearly over here. So you can see that, okay, it's able to create
that formula, but that formula is incorrect. So which is the reason why copilot is very
helpful when it comes to making our job easier because it's able to
craft a formula for you, but you still need
that knowledge to understand the
output of copilot. So you still need to understand the lookup functionality to be able to verify the
correctness of this. And you could make changes
or tell copilot that, Hey, E two is not correct, double check this and
read the file again and then give me the
correct formula.
10. Prompt Basics - Analyzing Spreadsheets in the website: For our first example, let's have some fun with
Microsoft Co pilot with analyzing Excel spreadsheets
for us through the website. So we have our dataset
over here on the right. So we have the orders, and then we have the sales reps, and then how many
units have they sold? What is the product category
and the price in the sales. So pretty much just a sales
table of data over here. Now, our request to
co pilot is make sure we make sure
first that we are following the GCES structure. So we have our goal. Okay?
This is our sales data. I want performance trends. And then the contact is
2026 iruter sales records, and we're just specifying the column headers or
the data over here. And next is the expectation. What is the total
revenue by region, the top performing sales rep, and the best selling
product category, whatever trends or
insights that you have. The source is pretty
much the use the data in columns A to H and
then rows one to 19. So we are very
specific over here, and I've already
attached a spreadsheet, and let's see this in action. So I've also used the
thinking model over here to make sure that we get the best possible result from copilot. So now copilot has
finished reasoning, and you can also check on the
thought process of copilot. It just shows to you step by step on what
it's trying to do. And you can also see
a lot of Python code because we're doing analysis
at calculations over here. So let's just jump
straight to the results. So you can see, based
on our request, it's able to show us the
total revenue by region. And it's saying that, Hey, your data is from
January to April, and you're asking
for quarter one. So which means, okay,
I filter this out, and I just give you
the results for January to March with the
totals by the region. And it's really cool
because I gave it more data than what
I needed over here, but it also gave me the
total for January to April. So let's just do a quick
verification because always, always verify when it comes to co pilot output because you
want to make sure that, Okay, is it doing it right or did it understand my
request to begin with. So let's say we have our
data table over here. Let's just go to
insert a Pivot table, and I'll create a new
works and let's just jump over to the region because
that's what we need. And with the sales over here, and we can see that,
okay, East has 14,550. Yep. And then we
have North, 18,210, and then we have
south as 15,020, and we have West as 11,225. So you can see over here, it even gave me the percentages, and it's able to
calculate this correctly. Now, let's jump over
to the next one, top performing sales rep. Okay, so Bob Smith
is at the top. This is for January to March. But if you want April, so let's just do a
quick verification. Let's say we want the sales
rep. Let's just change this over here so that we can
see the sum of sales. And from the eye test over here, you can see that 14,575 he
is number one for Bob Smith. Okay, so let's jump over best
selling product category, and you have your results
as well over here. We can do the same exercise
to verify the results. And these are the insights.
This is the strong suit as well that we can get
additional information from or angles that we haven't
thought of when it comes to data analysis
with copilot. So he's saying that, okay,
there's trend number one, there's strong growth, and
March has the biggest jump. March spike is driven by
higher ticket categories. So let's just jump back
to our data, okay? So it's saying that, okay, it's being brought up by the
more expensive categories, such as furniture
and electronics. And this is a good insight. Trend number three
is office supplies, is high volume, but low revenue. Based on this insights, then it's up to you to
make a business decision, and it's really useful
when it comes to analyzing data because now based on the trends, it's
now saying that, hey, maybe you want
to double down on your strong revenue engines or the more expensive ones like
furniture and electronics. And then this one
is office supplies. Yes, you're getting
a lot of units sold, but it's not driving up sale. You want to double check, right? Use this just as an add on, or you could have minimum
order thresholds to make the most of the low revenue these are really good insights, and just make sure to follow the GCA structure when making
your request to copilot.
11. Prompt Basics - Analyzing Spreadsheets inside Excel: Second example is analyzing spreadsheets right inside Excel. So with the previous example, we have the website, right, for copilot chat, and we gave it a prompt
and we had to attach the workbook to use it
as the source of data. Now, if you have copilot
right inside Excel, it's a lot easier to
do this because if you click on the lower right
icon over here for copilot. So let's just maximize this. And if I click on this,
you can immediately ask copilot to do the analysis for you right inside
your workbook. So I'll just paste in over here the same prom that we had
from the previous example, and there is no need
for us to attach the workbook anymore because it's able to access
it directly here. But one best practice
that I want to tell you is to make sure to
use tables for your data. So let's say for
this one, right? I'll just press Control T, and we will convert
this to a table. And inside the table, we
want to make sure that we have given it under the
table design over here, and under table name, let's give it a more descriptive name. Let's say sales table. We want to be very specific
when it comes to our prom. Let's say this spreadsheet
contains sales table. Okay, so I'll just
type in the name to ensure that co pilot
won't make any mistakes when it comes to searching for the right data table because now we have
very specific name, sales table, and it would
match with this one over here. Now, another thing to
note of is since I have the paid license
version of copilot chat, we have something that
we call agent mode. So when we say agent mode, which means copilot is able
to edit my workbook directly. So you can see on
the top portion over here, let's edit your work. As I run this, it's going
to put the results right inside the workbook as well
because of asient mode. But if you do not have
the licensed version, then that's perfectly fine because the results
will simply be shown for the analysis under this pain or
copilot pain over here, similar to the website
that we saw a while ago. Agent mode now we have our analysis and
results over here. So always verify the
results and the numbers. And if you do not have
the licensed version, that's perfectly fine
because you would have your results inside
this pane over here. So it's very similar as
what you see over here. Okay? So we have our top sales
representative, et cetera. So everything that you've
asked for for the spreadsheet, it's able to access
the data directly, so you don't need to
attach it anymore. So it has everything up to the actionable insights that
I have asked for as well.
12. Prompt Basics - Analyzing Multiple PDFs: For this example, let's
talk about analyzing multiple PDFs or multiple data sources
with Microsoft copilot. So we have this example
for remote work. Let's say we have two
reports for remote work. One report for this one, it's saying that, okay, for this remote work
arrangement or study, the average productivity
declined by 7% to 12%. So he's saying that,
hey, with remote work, this is not good. Up this study. We have an advantage
for remote work, which is saying that, okay, employee retention improved by 18 to 25% in flexible
first organizations. So what we want to do is
let's see how copilot would work with multiple
sources of data. And even though the data points themselves are contradictory
to one another, so let's create a prompt. I've already attached
the two PDFs over here, and let's say the goal is help me make a leadership
decision about remote work. And we are pertaining to
the source as our two PDFs, A and B over here, and we want to tell you that, hey, make sure to use the
only information from PDFs, treat both reports as
valid, and then be neutral. Okay. So we're providing the specific expectations and instructions now that I want a one paragraph
executive summary and then a comparison table of
what's happening over here. Okay, and then how both reports can be true at the same time. So this is really helpful
because if you have a lot of data points and
then you're confused, Okay, what becomes overwhelming, then copilot can help you
sift through that data. Now, I also made sure to make
use of the thinking model, and I use the web
one because this doesn't require work
information at the moment. And you now have your
executive summary, okay? And then we have our
comparison table over here. So we have PDF A and then PDF B, and then you have the
different dimensions, on what is being used
to determine that, hey, is remote work a good
thing or a bad thing? And it could also say that, hey, it's not
measuring or excluded. So it's also able to think
through that because study A doesn't care about employee satisfaction or
doesn't take it into account, but study B doesn't include the test level
execution quality. So you could see that it's able to compare the two
studies together. So it's able to tell us that, hey, both reports are true, but both reports are using a different perspective in terms of measuring productivity. And if you go down again and then what's missing
or uncertain, so it's able to give
you the next step as well when it comes to the
analysis of your PDF. So if you have
multiple data sources, even though the
formats are different, it's not even in the
PDF format, right? You can still use
it and then attach it over here or even copy paste a portion of the text and then have copilot analyze this for.
13. Copilot in Excel - Free vs Paid Copilot: When it comes to
co pilot in Excel, I want to show you
first the two types that you could use
when inside Excel. The one is the
free copilot chat, which is pretty much
the one that comes with your 365 subscription versus the paid
license copilot chat because there's a difference, and it's going to
show as well in the succeeding tutorials
that we're going to do. So when it comes to
the free version, pretty much you have here the co pilot icon. So
let me just close this. Once you click on this, then you can ask copilot to
do things for you, and it's going to
look like this pretty much just like a chat over here. It's able to access
your work but it won't be able to
make changes directly. As compared to the
license version, if we jump over here because
I have the license version, I can edit the workbook directly from co
pilot chat over here. So it's saying that let's
edit your workbook, they pretty much call
this the agent mode. So whatever we ask to do here, it's going to make
changes directly. But there's also a cool mode
right now where it makes a plan first and
tells you what it plans to do before executing it. But if you're comfortable
with being done right away, then you can just
go allow editing. So just to have a
quick comparison, let's say we have
the free version. And our goal right now
is to make this table or make this workbook look more professional in
terms of formatting. So let's just run this and
then see what happens. Okay, so if you have the free version, this is
what you're going to see. It's able to see your table, so you can see over
here A one to H one, so it has that information, but it only gives you
all the steps that you need to do over here
and the recommendations. Okay? So that's pretty
much for the head row, data range, and then columns
formatting, et cetera. Now, let's try it out in agent mode and then see
what's going to happen. So let's start a
new chat over here. Let's go allow editing. So this is our agent mode, I'll paste in the same
prompt from a while ago, and then let's see
what's going to happen. Okay, so now that we're done,
if we have a look, right? I changed the formatting
directly over here, and it also tells you what are the changes like header
row, data styling, the alternating row colors, the borders, column for
and the cool thing is, if you're not happy
with this one, you can just simply click Undo and it will just remove
all the changes. But if let's say
you're happy with this one and you just
want some minor tweaks, then just tell what
it needs to be done, and it will make the changes
again for you over here. So that's pretty much the
main difference when you have agent mode or the paid license versus
the free version.
14. Copilot in Excel - AI Excel Formulas: Let's talk about
using copilot to create complex L formulas. So this is the part that blows
my mind because I love on how much work or time copilot can save you when it comes to
these types of tasks. So let's say we have
this table over here, we have a list of
representatives, Okay, the deal that was done, what is the product, the
date, and the amount. There's the status of
return and new customer, and we have a complex
commission policy. So this is pretty much
similar to what we have in the real world
because, for example, let's say if return equals true, then zero commission because
we want to calculate the commission for the
transactions over here. If it's less than or equal to
10,000, then it's only 3%. If it's up to 25,000, that's 5%. And then for 25,000
above, then it's 7%. Okay? So we have
a different tier of commission
percentages over here. We have the region
bonus, additional 0.5%. If it's East region, and then if it's a new customer, then you get an
additional 250 bucks, and there's a maximum
commission of 5,000 per deal. And you need to round
the final commission to the nearest whole dollar. It's a really long formula if I'm going to be making
this from scratch. But let's see, using co pilot on what we
can do over here. So let's say we ask
copilot to write an Excel formula for
the sales table column, and we want the commission
column to be created by copilot over here and make sure to use the commission policy
in creating the formula. So we want to be clear that there's a commission
policy in here, but I just added
a question here. Can you see the
commission policy in the spreadsheet or should
I paste it for you here? Okay, so I just want to
make sure first that okay, can you see the commission
policy over here or do I still need to
include it in my prompt? Now, it's saying that we're in Agent mode right now because I'm using the licensed version, but if you have
the free version, then it can still create
the formula for you, but it's going to be in
this chatbox over here, and you'll just have to copy and paste the formula
to a new column. On this table here. But since we have
agent mode right now, which is the paid license
version of copilot chat, then it's going to do
everything for us here. So let me just execute this and then let's see
what's going to happen. Okay, so now we have our first draft of the Excel formula, and it created this column. Now, let me just expand this. And we have our formula
right now over here. It's saying that it's able to read the rules that we have. And it's explaining the step
by step of our formula. Let's say that, Okay,
with this formula, I find it a bit hard to read. So let me just add a quick
comment to copilot that, Hey, I want you to use the let formula to make
this more readable. Let's see what's
going to happen. Okay, so now we have
this updated formula. So let me just ho to one of
these at the moment, right? And you could see
the new formula. Let me just expand this. And now this is a lot more readable because we
have a lot of, like, logic or logical
rules over here, so I want you to make it
as readable as possible. Thing is we need to verify the results of copilot
always to make sure that, okay, we're not doing
anything wrong. And if you see over here, right, this is the perfect
example that even though co pilot can do a
lot of things for you, but you still need
that knowledge. Let's say you want to test
about Excel formulas, even though copilot is doing the majority
of the work for you, since I know that there is
a better way to do this. So if you see the first
version of the formula, it will most
probably be correct. But it's very hard to read when it comes to
understanding from my side. But since I have
knowledge that, okay, if I use a let formula for
something as long as this, then it's going to be
a lot more readable. Then I can use that knowledge because I know Excel
formulas as well. And I can just give
that suggestion to co pilot and it's able to
update this for me. So you still need
that knowledge, you still need the know how. With copilot, you can do tests a lot lot faster
as compared to before. First thing is we
need to verify. This is very, very important. So let's just do this manually. So let's look at this
example, 8,500, right? Let's just put this in here, and then times, it's going to be 3% because it's
less than 10,000. But since our region is E's, there's an additional
bonus of 0.5%. So let me just add this. So that's going to be 3.5%. Okay? And since we have that
bonus 250 for new customer, then let me just add in 250. And we have 548 because we're going to be rounded to the nearest whole dollar.
And it got it right. Now, we can also check
the formula just to see if it has all
the rules in here. You can quickly see
that there's the 3%, there's the 5%, and
there's the 7%. You can see it over
here. You have the check for the East, right? You have the new
customer check for $250, and then you have the capping of the total commission
at 5,000, right? And then you have the final commission that
if it's returned, then you just give
zero, but if not, then give the CAP
commission amount. It looks great, right. And you have the rounding to the nearest whole
daughter as well. With this type of
formula, right, sometimes it can get
also complicated. So one thing that I also do is explain this formula
in plain English. You could just ask it to explain it to you so that you can
understand it better. You're also able to
double check quickly if it makes sense on
what it's doing or not. We've gotten the formula
explanation over here, and you can see that there's the variables and there's
the base commission, and there's the bonus and
the cap and the rounding. Okay? So there's
that explanation and make sure to double check
the values as well. And then once
you're comfortable, then you can just keep on using this formula or tell it
to make changes for.
15. Copilot in Excel - COPILOT function: Let's talk about the
copilot function in Excel. So the copilot function behaves like a normal
Excel formula, so we could just type in copilot over here, and afterwards, we can start typing a prom
for copilot to execute. One of the mistakes that
I usually see people do is they use copilot to try to behave like what a normal or traditional
EL formula could do. So for example,
let's say we have copilot over here and let's say trim all the texts and
remove their spaces. Can be done quickly with
a trim formula in Excel. What I want you to do because
if you do it this way, using the copilot formula, yes, it gets the job done, but it's an inefficient
way of executing this, and your workbook could
be very slow over time if you do this copilot
usage over and over again. So if it's solvable by a
traditional Excel formula, do it that way, or you can even just go here on the
copilot pane, right? And then now you can
just ask that, Hey, create an Excel formula
for me that would trim all of the texts for
this table over here. Then it's going to
create that traditional Excel formula for you. So what I really
want to point out is that where the
copilot function would shine the most is
doing tasks wherein the traditional Excel
formula is unable to do. So let's come up with
an example over here. So let's say we have this
feedback list over here. And apart from this, let me
just close this for a sec. We have this list of
categories over here, and based on this feedback, you want to categorize it
based on this category list. So, for example, let's
say we was charged twice for the same order,
please fix ASAP. So which category would
you put this over here? This is something
that you cannot do with an excel formula
because in my case, I would be going here and just
do this manually because, for example, okay,
I'm looking for the keyword, charge twice. If it's charged twice, then most probably this is
going to be billing. And then afterwards, I'll
jump to the next one. Delivery estimates at two days, I arrive in nine, not okay. So this could be under fulfillment, and I'll
just type it again. And it's a time
consuming process. So now let's just jump here and then put the copilot
function over here. And if we have a look, it's going to look like this. Classify each feedback item into exactly one of
these categories. Now, we're going to specify
the list of our categories, which is from age two
to age six over here. Okay and then place
another comma. I'll continue the return a single column list of categories in the same
order as the feedback. Only output the category
name, nothing else. Okay. And the feedback, I'm also specifying the
source which is 2-21. Let's just enter this and
then see it in action. Okay, so in just a
couple of seconds, it was able to categorize
everything for me. So if you notice over here, we have charged twice,
so that's billing. Delivery estimate has
failed, so it's fulfillment. The headphones
crucle and cut out, so it's product quality. So it's able to find it. It's even smart enough that, okay, this new
update is confusing. Where did my save statics go, and it's unable
to categorize it, so it just used the
other category. So this is where copilot shines. If you have a scenario where in a traditional formula
won't cut it or you don't know how to
like it's impossible. There's no such functionality. Copilot shines in this scenario. So let's say, for example, let's just change like
fulfillment to shipping. Right? If you do that,
copilot is smart enough and will update accordingly based
on the list of categories. So if you notice on the
left side right now, fulfillment now has
changed to shipping, and it's smart enough to update
the entire list as well. So you can just keep on
adding categories too, and it will update
this accordingly. So very flexible for
co pilot function, but be sure not to abuse this that you use this only when traditional
formulas will not work.
16. Copilot in Excel - Creating Dashboards from Excel Data: Let us talk about creating
dashboards from Excel data. So in this example, we have two data tables for the
year 2026 and 2027. So we have sales data. So you can see the
revenue, the sales rep, the region, the dates, and the number of units as well. And if you jump over to 2027, it's pretty much the same
columns and data that we have. So let's say your boss comes
to you and tells you, Hey, build me an executive
dashboard comparing 2026 and 2027 performance. I want you to highlight growth, top regions, and trends. Okay, so now we want
to use copilot to do its magic and then see
what it will come up with. But before we start, what I want to stress here
is make sure for the tables, you have a table name that's descriptive
so that it's easier to refer and make sure that
it's converted to a table. To be able to do that, just go to Insert over here, right, and then insert table to make sure that
your data is a table. So if I jump here as well, if I go to table design, you will see that the
table name also has the name sales underscore 2027. Oh, let's put in
our prompt right now and then see
how it looks like. So this is what we
want co pilot to do. Create a dashboard comparing sales underscore
2026 because we have our table names setup and
sales under score 2027. Okay, so very explicit. So what we want to
include to satisfy the requirements of our boss is the total revenue by year, year over year
growth percentage, the revenue by region, and then monthly revenue trend, and who are the top
performing sales reps. And then we tell co pilot to use charts where appropriate
and format it like an executive dashboard
with clear titles. So before I had to use formulas, use Pv tables, use slicers,
to create a dashboard. But this one, we're
going to have copilot do the heavy lifting. Okay, so now we have the dashboard that
copilot has created. So this is the beauty when
you have agent mode or the paid license is when it comes to creating
dashboards like this, then copilot will just
do everything for you. And this is where
the fun part lies. So you can see here, right? It explains to you,
Okay, what did I do? And here are the KPI cards. Here's the revenue by region, here's the top sales reps, and these are the
charts that it made. Now, all values are formula driven using Sue and
sum product functions, and they'll update automatically
if source data changes. And that's the really cool thing with this dashboard over here, because if I inspect this
right now and have a look, you could see that it
has the sum, right, a formula over here, and it refers the table
and the column of revenue. So which means that if you
update this table over here, if you update the
numbers over here, then this will change as well. So for example, let's say
we have 200,000 here. So let's say, let
me just change this to 20,000 for one of the values. And then you would
see this change as well on the left of
the total revenue, and it increased to 208,000, pretty much since everything
is formuls over here, so you could see that the
graph is also updated. The table values have
also updated, too. So this is the great
part over here because you need to verify
whatever co pilot has done, and the best
transparency you can get is having
formulas over here, and you can check that even, for example, the calculation
of the year on year growth. Okay? So you can see, right? I just subtracted,
got the difference, and then divided by
the base amount, which is from the year 2026. So that's perfect. And if I jump over here,
you can see, as well, we have the Sumi
formula where it checks for the region column. And then the central value, and then it sums all of
the revenue amounts. And you could also see
the growth percentage on how it calculated by getting
the difference over here. So one of the important things is that even though co pilot
can do everything for you, you still need to have that
know how or understanding of how these formulas
work because otherwise you won't
be able to verify, and it's risky to trust co pilot blind we jump
over here to our charts, you could see as well on
where it got the data from. So it's a way for
you to see that. Okay, based on
this chart, right, it's referencing the values
of this one over here. And if I go to the
monthly trend, now it's referencing
the values as well for our monthly revenue trend. So you could understand as well on how these
charts are made. Then if you see something
that you are not happy with, then simply tell co
pilot to make changes. So let's say, for example,
let's say I'm not happy with the growth
percentage over here, not being sorted in the
proper order because for me, what's important, right, is one of the requirements that I had was top performing sales reps. And I
want to show that, okay, the one with the best
growth is the person on top. So let's just add
a quick prompt. Sort the top sales reps by growth percentage from
highest to lowest. Let's see if co pilot is able
to make this change for us. Okay, so that's perfect, right? So you could see the
top percentage now with 17% at the top
and 0% at the bottom. So creating a dashboard with co pilot is very
straightforward as long as you can verify it and be clear with whatever requirement
that you need from copilot.
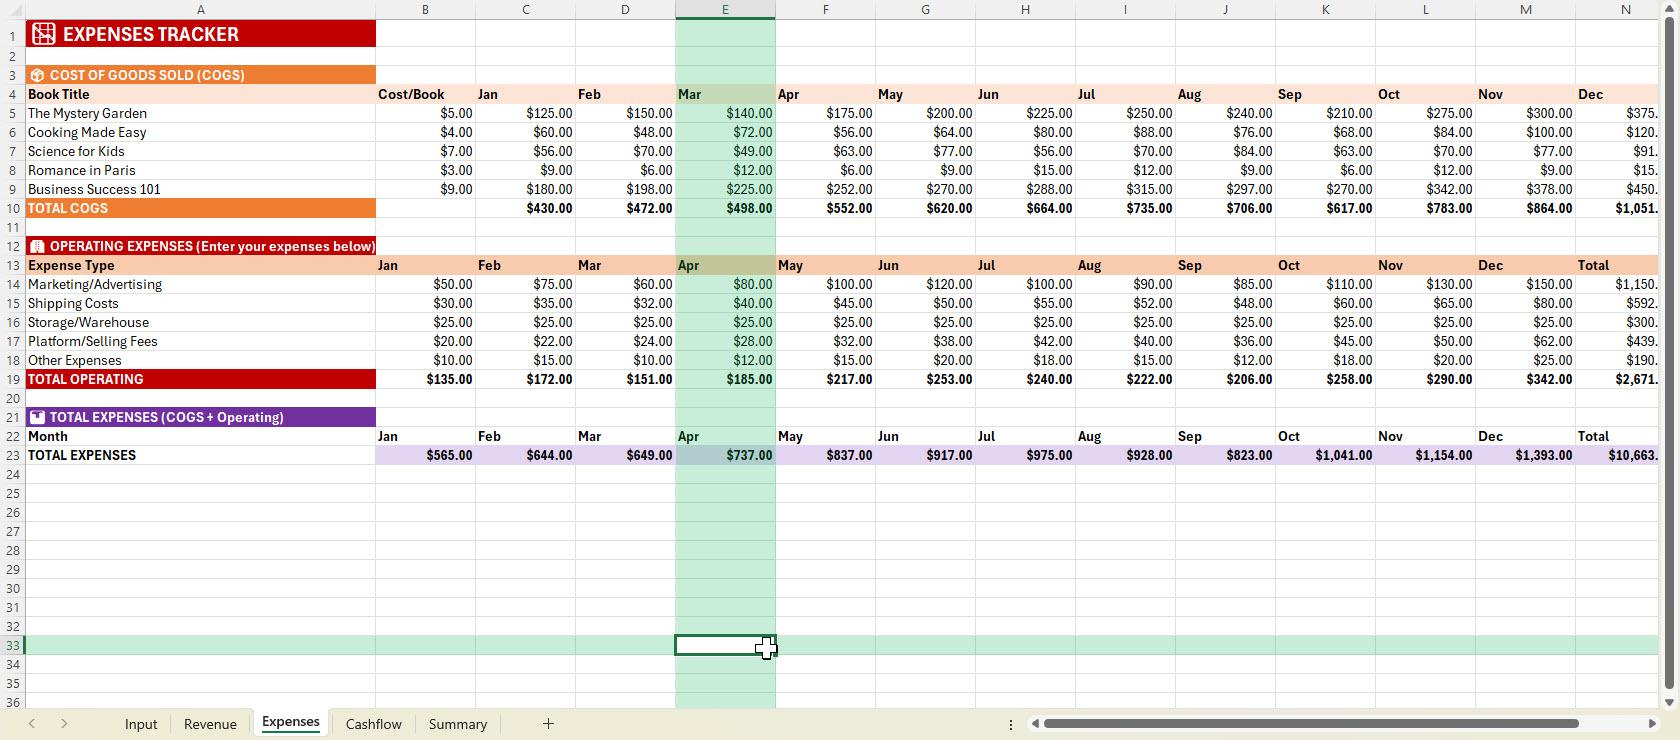
17. Copilot in Excel - Creating a Financial Statement from Scratch: Okay, so I want to
talk about creating financial statements
because in this example, I want to show you
that co pilot is capable of helping you
with something that, let's say you have no
idea on how to start. It's not just limited to
financial statements, but pretty much any template that you want to create
in Excel, for example, that you have a struggle or you have no idea
where to start, then co pilot is perfect. So let's assume that
I have no idea on how to create a financial
statement from scratch, but I do have a general idea on what I want to track
inside the statement. Let's say I want to
track revenue, expenses, cash flow, and pretty
much a dynamic summary of all the numbers. So in this case, I
have a general idea, but I just don't
know how to create a detailed list of fields or formulas to make this to be effective when it comes to tracking numbers
in my business. And Copile is great for this because what I
need to do now is, Okay, this is my idea. Okay? This is the
high level idea. I want to give it
as much context as possible on my business. So here's what I'm
saying right now. I run a book selling business, and I want to track to see that, okay, if I'm making money
or losing money each month. And the summary of the best
selling books, please, and the ones that I should
not spend more time on. So it's pretty much
the low selling books. I'm not familiar with how a
financial statement works, but I have stated
my goals above. So I also need an input
sheet to note the number of books sold per month for each title and the
price of each book. Right now, just start
wherein I can input the information of five
books that I sell. So very specific over here, but I'm not telling you
the nitty gritty of how to create a financial
statement, but I have my goals. So let's see if co pilot is
able to create this for us. The cool thing over here is, even though let's say
the first draft that copilot makes is not
the best for you, let's say you have
a different vision and it's not working out, you can do it in increments. Because at least now co pilot will give you a good
starting point. But in our scenario, we just give it
more feedback that, Hey, I just thought of this. I'm also spending in
ads to sell my books. So now I want to track it
as well in the template. You don't need to be perfect
from the very beginning, but you have that general idea. Give it to copilot and it
will create it for you. And then as you see the output, then you can further refine your goal or what is the
design that you have in mind, and then use copilot to
further refine that. Okay, so we have our
first drap over here. You can see the reasoning
on what it tried to do. And it mentioned that, Okay, I have all of the
sheets over here, but if I jump to
the revenue sheet, somehow they're all empty. So copilot is not perfect. Typed in, Hey, most of
the sheets are empty. Can you do this? So let's just try this out and then see
what's going to happen. So now it has fixed our financial statement
and it mentions that, okay, all of these fields are now set up. So let's
have a quick look. So in our input
page, we have, okay, five books and monthly
units sold, right, from January all the way to December. Okay,
that looks good. So let me just move this a bit. I'll go to revenue, and we have our book prices
for the revenue tracker, and the really nice thing
is even for the prices, it refers back to the input
page. So that's good design. So that when we update
the source from here, then it will get automatically
updated as well over here, and we have our calculations
as well to be updated. So that's good design.
If we jump over here, we can just have a
quick look as well. I'd say input B 13
versus B 13 over here, okay, and input B
five. Okay, cool. So it's referring back to the
numbers in our input page. So this is the revenue tracker
all the way to December. Now let's go to expenses. So we have cost per book, so it plays some prices
as well over here. So it's getting it from the
input too, so that's good. Okay. So it's multiplying by
the number of units that we sold versus the
cost of each book. So input C five, for example, if we jump here, right, that's the cost of that book. You need to verify
and test it, as well. So I'll show you a quick
next step afterwards. Operating expenses, you
can enter expenses below. So it immediately thought of the useful expense
types. That's good. And if you have more. So let's say you thought of
another expense category, then you can just ask copilot to update this for you or add a new line together and have the formulas to auto
update based on that. So you can have
the total expenses all the way from
January to December, and let's go to cash flow. Now, cash flow is
getting the revenue. It's getting the total
outflows or expenses. And then that's
the net cash flow and the cumulative cash flow. So let's see if it looks great. So, okay, so it's getting
from here, right? And cumulative cash
flow. Right, nice. That's good. So it's getting it from here
so that you know, Okay, are you making money or are you losing at
the end of the year? Let's jump over to summary. So summary is key
financial metrics. So even this ones,
you can ask Copilo to fix this for you
because it didn't like, merge the cells over here. So, for example,
if you merge this, then you can see
the entire thing. But let me just do
that, and you can just ask Co Pilot to
change that for you. Now, it has a summary. So total revenue per year. So if we jump over here,
right, looks good, and total cog profit, et cetera, and there's
even a profit margin. So it's just saying that, okay, based on the net profit or
loss versus the revenue, how much profit are we making
in terms of percentage? Okay, so it even has
a recommendation, like just a simple if statement, where if it's zero,
then no sales. If it's greater than
zero, then profitable. Then if it's less than zero, then you're losing money. Okay? So you have the
top selling book. So it's also checking
for the max on which book is the best selling one and then the lowest
selling book as well. It's really cool
because it was able to keep my goals or
high level goals, and it pretty much put it
in here in the summary. Now, monthly profit
and loss as well, so it just got the value from the cash flow so that I can
see it quickly over here. And now this is the fun part. I want co pilot now to
input the numbers for me. So what you can do
is you can save this first so that
you have a backup. And then now as it to input
some hypothetical numbers, and then I can see the financial statement
in action so that it's easier for me
to visualize because right now all I'm seeing
are a lot of zeros. And the only way for me to
understand this is by going to each cell and then see each
formula on how it is made. And it's a time
consuming process, but to do our due diligence, it would be easier if we have some sample numbers
input over here, and then you can
get a field on how the tracker now works. Okay, so now it has
finished the sample data, and you can see that it added five sample books for
me, even the names, it even thought of some
names over here, the price, the cost, and the yearly
sales or monthly sales, too. So you can see the
breakdown over here. Now, we have the
summary dashboard. So let's just jump over here. So if we see the revenue, you can now see that, okay, we have our total revenue, and it's a lot
easier to visualize it now to see if
it works or not. It's like Co Pilot is
doing the testing for us. And you can now verify, Okay, we have the mystery garden, 125. If we jump back over here, that's 25 times
five for the costs. So that would give
us 125. That's good. So if I jump here, business
success one on one, $9 for the cost. Is it $9? Yes, it
is nine, right? And then times the number
of books sold, that's 20. So that would give us $180. Okay, so we have all of the
expenses, just double check, as well, the
formulas, and it's a lot easier to understand
it right now. Now, it also inputted
some operating expenses, and you have the total
expense from here. So if we have a look,
right, if it's February, okay, that's February and February over here,
it looks good. If we jump here, you can
also see March and March. So let's say, for
example, this one, it looks a bit more confusing. You can ask co pilot
to move a bit so that we have all of the
Januars in one column, all of the Februaries
in one column, and copilot will just update
all of the formulas for you. So now the cash flow, we have revenue
from sales, cool. The total expenses and the deducts both of
them looks good, and then you have your
accumulated cash flow, so it's adding it from the
month and the previous month, and then it's just
going to add it. And then until the very end, you will see that,
Okay, we made money. We have $13,000 over here. If you jump to our summary, so you can see total revenue, you have gross profit, and then you have
the profit margin. So it was able to
calculate it based on the net profit divided
by the total revenue. So you have this
percentage over here. Now you can see, as well if
the books are profitable, so you can see everything's
profitable at the moment. You can also ask copilot
to update the example and then have a couple of
unprofitable books, and it's able to
do that, as well, and then you have
your best seller and the lowest selling book and
the monthly profit and loss. So this is just an example. You can apply this
concept or practice to any tracker or template that
you need to be created. When it comes to working on your business or working on a task, then copilot is very
helpful on this.
18. Copilot in Excel - Data Analysis with Python in Excel: Another superpower
that copilot has is it's able to
use Pyon in Excel. If you don't know Pyon, Pyon is pretty much a programming
language that's very, very good when it
comes to performing analysis or mathematical
calculations or let's say, exploring trends for you
or even forecasting. Because if you tell me to
do a forecast in Excel, to be honest, there's
formulas in it, but it's not as
sophisticated when it comes to using Pyon to
create this say, we have this data table
over here for 2026. So let's say, analyze
this table and forecast the next three
months of revenue. So what I want copilot to create is a forecast of monthly revenue for
the next three months, a chart showing
historical revenue and the forecast and then a short
explanation of the trend, and then use Pytn in Excel. This is going to be fun
because afterwards, once it creates the graph
and forecasting for us, then I'll also ask
copilot to show us the Pytn code because if you are able to program in
Pytn you know code, then you can also see
on what it used to do. Okay, so for our request, we asked it to analyze
the 2026 table. So if we jump here now
to the revenue forecast, it was able to create this graph over here and a
three month forecast as well, heading to 2027, based on the
numbers of the 2026 table. You can see the trend line
as well on where it's going. And we asked for the chart, and we asked for the forecast of the monthly revenue for
the next three months. So you can see the
forecast over here. And if you notice, these aren't all numbers because
it calculated it inside using Pyrone and it didn't use Excel
formulas over here. Now you can see, as
well the same values being shown one oh five, one oh seven, one oh nine. So you could see the forecast as well for the table over here, and then a short
explanation of the trend, which is the trend analysis. If this is unclear, then you can simply ask copilot
to explain this for you, but also verify
spot check numbers, just make sure
that nothing seems out of place because
when it comes to AI, it can be confidently wrong, but it's also very useful. So it's a double edgit
sword that you know not to blindly trust
everything that it gives you. Now
here's the fun part. Let's say I want
to understand how does co pilot use that pattern
code and I want to see it. And while it's working on that, I just want to note as well, there's a trend
explanation, too. There's a modest upward trend and the R squared value of 0.12. So it also explains, Hey, what is the meaning of the
trend analysis over here. So the data shows peaks
in July, October, and December, suggesting
potential seasonal patterns. Let's just jump over here, and you could also see now the Pyon code being
explained here. So if you know Pyon
then it's going to be fun seeing and
learning from the code that copilot has written
and then see if you would also do the same
thing or if it's something that
could be improved. And it's also something that I enjoy doing because when
it comes to coding, I can also see on how copilot or any other AI tool has made it so that I can learn from it or
reverse engineer from it, it really depends
on what you enjoy.
 Bash (BizTech Matters), Online Teaching Excel Expert