Transcripts
1. Course Introduction: Hello, welcome, I'm Serge Ba, a software developer
with a masters in computer science and years of experience in financial
market trading. I've successfully combined
my programming skills with my passion for trading to create
a powerful tools using trading views Pin script. In this class,
Master trading view Pin script advanced programming, you learn how to harness
the power of Pin Script, to create custom indicators
and trading strategies. We'll cover everything
from the basics to advanced concepts in
31 engaging lessons. This course is perfect for
beginners in Pine Script. Traders looking to create
custom strategies and even experienced
programmers wanting to expand their skills. You don't need prior
programming experience, but familiarity with trading
concepts will be helpful. You'll need the
free trading view account to follow along. By the end of this class, you'll be able to understand Pine Scripts unique execution
model and time serias. Create advanced indicators
like moving average ADX DMI, develop, B test and optimize
trading strategies. Set up alerts for your custom
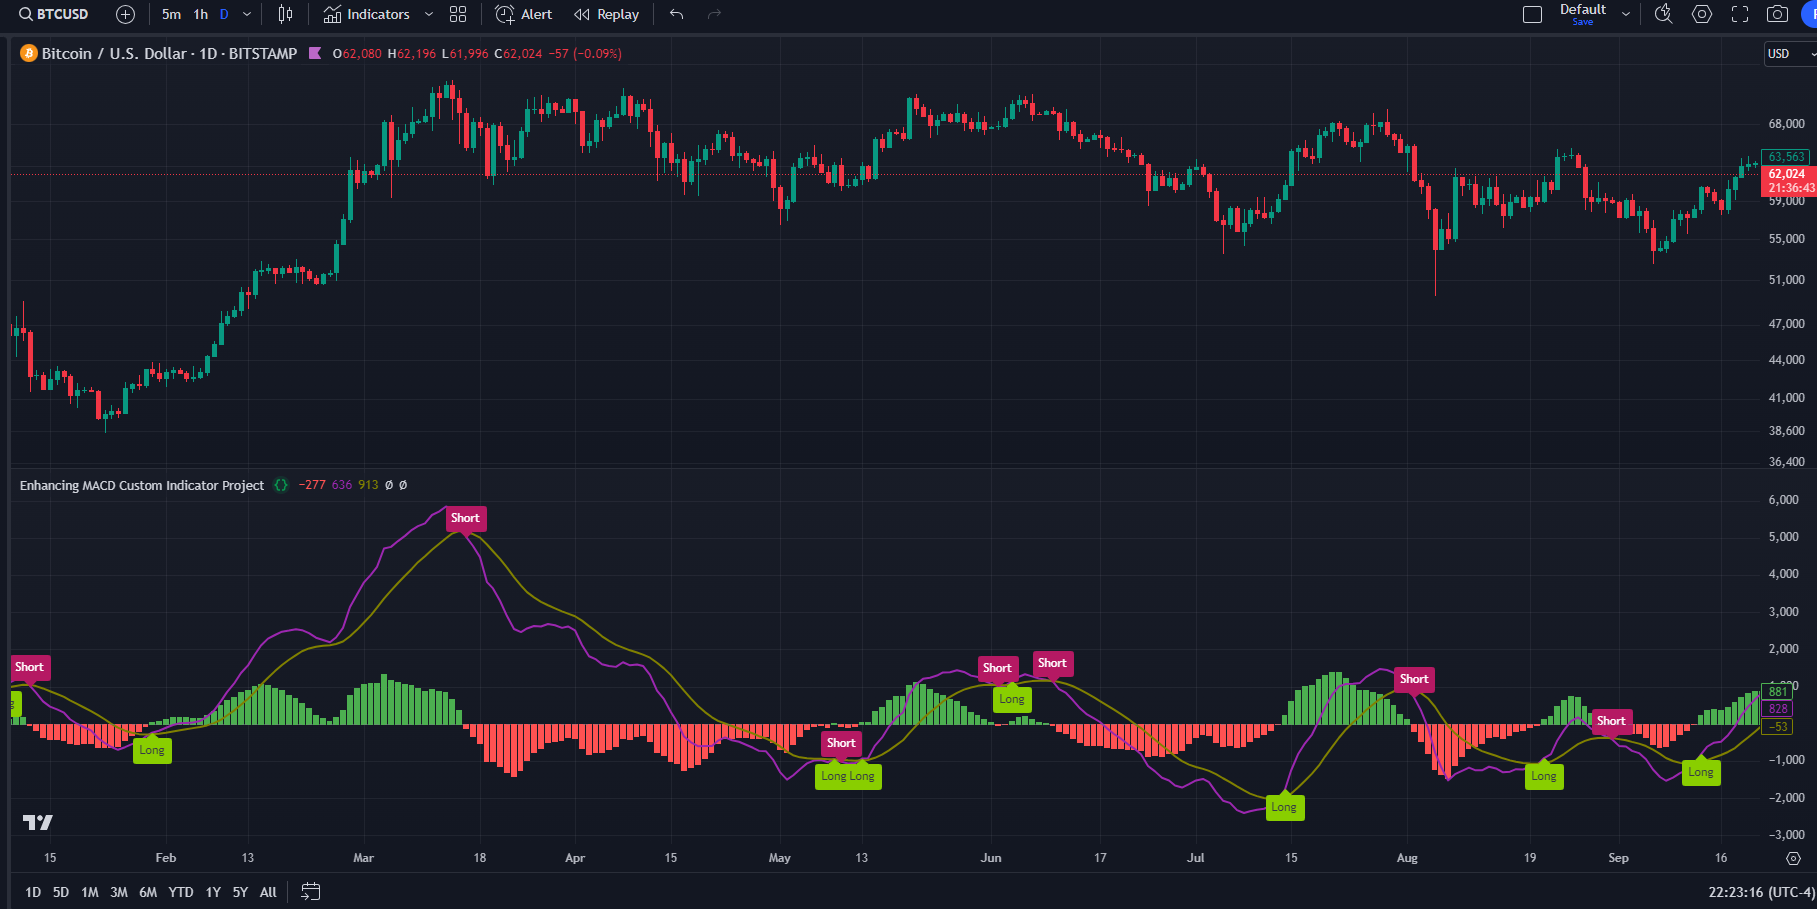
indicators and strategies. Your class project will be enhancing custom indicator
using Pin Script. You'll apply the
concepts learned throughout the course
to be able to develop and customize indicators and strategies tailored to
your trading needs. Remember, while we'll be
working on trading concepts, this course focuses on programming skills and not
providing financial advice. I'm excited to guide you through the world of P
script programming. Let's get started
on your journey to creating powerful
trading tools. See you in the first lesson.
2. Introduction to The Pine Script Editor: Hell, welcome to this lesson, Introduction to the
Pin script editor. This lesson consist
of following section. First, I'll introduce you
the Pin script editor. Then I will demonstrate how to open the Pin script editor. I will cover some advantages of using the Pancript editor, and I will cover also some of the important features
of the editor, such as syntax highlighting, syntax reminders, Pinscript, quick reference
how to access it, how to use out a
complete features, and some other features like versioning of the
Pine script editor. In this lesson, we'll study the essential tool for every trading view
script developer, the Pine script editor. As you start a journey to
master script writing, and algorithmic
trading, understanding the power of this tool
is very important. The Pin script editor is your dedicated workspace for
creating trading scripts. While you could use any
other text editor and then paste the created text inside
of the Pinscript editor. The dedicated
Pinscript editor is a tool that offers several
advantages that can significantly boost
your productivity and streamline your
development process. To access Pincript editor, go to the trading.com. And create a free account
if you don't have one. After you log in, click on Products Super
Charts menu option. Then when you get to the
Super Charts screen, click on the Pine editor button at the bottom of this screen. As you see the Pine script
editor window opened up. This window, you can enlarge
it or reduce it if you need to by dragging the
top line of this editor. Also, you can use this
button to maximize this trading view
Pine script panel, or hide it completely. Then you can use this button
again to show it back. Now, I will cover some of the main features of
the Pin script editor. On the top of the editor, you can see titled Script. This is the name of our script. When you save the Pin
script and give it a name, the name will be here. Next button is the
search button. When you click here,
you can search for the inside of the Pion
script editor for the text. Also, when you click on
this button, Togle replace, you can find and replace
text within your script. Next button is open button. In this button this menu
option has several sub menus, such as new indicator, new strategy, new library, where you can
create new scripts, new indicators, new
strategies, and new libraries. Also we can use this
button, for example, to check the built in
scripts if you need to. Save button to save the
currently edited script. Add to chart. After you finalize
your script and want to test it and apply
it on the chart. You click on this button. The script is applied to the trading chart at
the top of this screen. If you want to
publish your script to be available for public, you can pres press on this button and the last
button over here, three dots. You can use this
button to access, for example, user
manual of Pin script. You click on this and
here you can browse or search within the Pin Script
version five User Manual. Also, there is a reference
manual available. When you click on it,
you can try to find any function or operator
of the Pin script version. For example, if we click R S, it will try to find within the database of Pin script
operators and functions, the corresponding text,
it found t function, you click on it, and
it will open and provide you with
information related to that Function or operator. Now, pinscript editor
has several advantages. Let's explore where Pin
Script editor stands out. First of all, how to
create the script, how this script was
initially created. This is a default
strategy script. To create a default script to start developing
any type of script, you click on Open script, then you can create
new indicator, for example, and it inserts the default indicator
into the Pi script editor. After that, you can
edit it and you can add your code inside of this window and change
this code if you need to. L et's create, for
example, a new strategy, and then let's explore
some features of the Pin script editor on this
strategy script example. First advantage of
Pine script editor is syntax highlighting. As you see, this script is multi has a multicolor text which improves
readability of the code. It intelligently highlights
your code falling pin script, syntax, making errors more noticeable and coding
more efficient. For example, if you start
typing something and create some error and you
try to save it. It highlights with
the red underscore that this part of the
script has error. Then you should go and fix the error before
saving the script. Next, syntax reminders. Hovering over built in library function prompts
helpful syntax reminders, reducing the chance of
errors in your code. Let's hover on any function. For example, on strategy. You can see the window popped up with the quick reference
information about currently be about the
function that we covered on. Let's cover on another
function, t crossover. We can see a window with related information
popped up with the quick reference of this function where you can
get necessary information. This is like a tooltip for the related function
or operator. Once you mouse over the certain operator or function in your
Pine script code. Next, quick reference,
easily access Pine script reference
manual by simply clicking Ctrl and click
on Pi script keywords. Ensuring you always have the documentation at
your fingerprints. For example, let's try to
find information related to strategy dot entry
function and to open the quick reference
related to that function. Click on the control button
on your keyboard and click on the with the left
mouse on this function. We see the quick reference
window opened with the information related to
strategy dot entry function. Auto complete. The
editor features an outer complete function triggered by control plus space, which accelerates the coding by suggesting completion
as you type. For example, you
start typing TA dot, and it's already suggests you to ato complete this
function that you type. You can select any of this proposed version of
the next part of the code, you can select any
of them or you can keep typing as well. So for example, if you selected, Alma, you can just simply click and after
that, keep typing. It completing whatever you type. Efficient workflow
and other adventures of Pi script editor. The editor saves compiles
and runs a script quickly, minimizing delays and
writes compile Run cycle. For example, let's say we
completed our changes. We want to save it. We
can save our script. It's asking us for the name. We can change the name. Custom strategy, and
then we click safe, our script saved,
our strategy saved, the name of the
strategies over here. Then we can keep typing
and if we need to and then click on the safe and when we click safe,
the scripts compile. At the bottom of the pin editor, we can see another mean
another small window, that is a console window. That window provides
us information about the O code status and about
some errors if we have any. Once we save it, it provides us information that
the code is saved. If you get any compiling issues, the errors will be displayed
in this console window. Console window can
be expanded by dragging up and down this line. Also, Pine editor has the key functionalities such as though not as pine editor, not as feature rich like
some other top editors, but it offers vital
functions like search and replace that I demonstrated and versioning for
script management. Let's take a look
at the versioning. The versioning is displayed
in this combo box control, which you can see all the
previously saved versions. Let's say, for
example, we change this value for the
margin short to 80, and we save it You see
version three is created. Version three has value
for this parameter 80, but let's select the previous
version of this script. Previous version has 100
value for this parameter. As you can see, you can select any previously saved
version if you need. 12. In the end of this lesson, I want to say that
in the world of algorithmic trading,
every second counts. The Pine script editor is
your trusty companion, ensuring your scripts are not only accurate but also
developed efficiently. This is the end of this lesson, and I will see you
in the next one.
3. Creating Your First Pine Script: C on, welcome to this lesson, creating your first Pine script. This lesson consists
of following section. I'm going to explain
what MacD indicator is. Because in this lesson, we're going to
create an indicator based on Mac D indicator. After that, we're
going to develop Mac D indicator in
Pine script editor, and particularly, we're going to set up indicator parameters. After that, we're going to
be using t MD function. For MacD indicator calculations. After that, we're
going to be plotting MacD indicator on the chart. Also I will show how to detect and fix Pine script errors. Let's begin. In this lesson, we are going to develop our first pine script. We'll create a simple strategy based on the Mag De indicator. The Mag De is the moving average convergence
divergence indicator, which is a popular and widely
used momentum indicator in technical analysis. It is used to identify potential trend reversals,
and momentum strength. To start developing
our indicator, let's access Pine editor
by clicking on Pin editor. Button after that, let's click on the Open Menu option and click on the new
indicator menu option. Let's remove the lines
that we don't need, and Let's the name
our indicator. Let's get a name McD custom. Our indicator is going to have three parameters because Mac De itself has three parameters. Fast length, slow length,
and signal length. Let's set up these parameters. Every input parameter is supposed to be assigned
to a certain variable. In this case, fast length is a variable and we assign
value to that variable, the return from the
input parameter. To set input parameter, we use input function. First parameter for
the input function is default value for
that input function. Default value for fast
length for Mac D is 12. Next is the title
of the parameter. It's a fast length. Fast length. Now we have
two more parameters. Second parameter is
the slow length. Let's change the parameter name and default default value
for the slow length is 26. The last parameter is the
signal length. Signal length. Let's update the name
of that parameter, and default value for signal
length of Mac D is nine. Now, we have set up three. Input parameters next, let's
start calculating the MacD. To calculate MacD we use
the TA McD function. TA McD and Macd function
uses four parameters. First, we specify the source. We use close price for each
bar to calculate McDe. We type close. After that, fast length parameter for the fast length parameter
of the Mcddicator. Fast length, second parameter is the slow length and the third
parameter and after that, the fourth parameter, we used our third parameter
for this indicator, which is signal signal length. Now, this ct McDe
function returns tuple. Tuple is the sequence of
parameters that used as a group. Therefore, to set
tale, we use the Brackets. We use brackets
and first parameter in this pap for the McDe function
that returns this values, is the McD line. Let's call it McD line. Second parameter
is a signal line, and third parameter
is the histogram. Let's call it histogram line. Histogram line and the Mr. G. Now, what we did over here is that this function
returns a tuple. Tuple is the sequence of
basically a sequence of values. T dot McDe returns sequence of values of sequence
of three values. Basically a
collection of values, not one parameter, many
parameters. In this case three. Each of these parameters, we assigned to a parameter
of our indicator. We have set up McDe line, signal line, and histogram. We can change the name
of the parameters. But what's important is that we have three parameters
that we are going to get assigned from the return
of TA dot McDe function. Now, we calculated the MacD
values. Now let's plot it. MacD indicator is a indicator that acylates around zero value. Therefore, I want to draw the horizontal line at zero to see when values
are positive and negative. Now, to draw the line, we use H line function. And first, prime tar in that function is the
actual price or the value, then the title, let's call
it zero line zero line. After that, the color of
this horizontal line color. I want to create the color
and use the transparency. For that, I use
color new function. The color itself, I
want it to be gray, and I want 50% transparency. The reason I want
to use transparency because I want gray line to be 50% transparent,
not very visible. After that, let's draw all these four lines that we received from calculating
of D McD function. Now, let's start from histogram
line. Start plotting it. First parameter for plot is the actual series of values
that we are plotting. Second parameter is the title. In our case, it's a histogram. Next parameter is the color. For the histogram,
it's not a line. It's it's a columns. It's a sequence of columns. Therefore, I want those columns to be green when
they are positive and red when they're negative. Because of that, the color
will be conditional. And condition will be
based on his line values. When his line is positive, then I will use
this, this apertor, which is using que mark
question mark apator I will explain
later how it works. Let's type it first. Whenever histogram is positive, I want color to be green. Otherwise, color, I
want color to be red. This is how this works. This whole expression, this whole expression
is going to be green, is going to be green colored, whenever his line value is
bigger than zero or zero, otherwise it's going to be red. This is specific
conditional operator, that's how it works. The last parameter is the style. Style is not the actual not the son next parameter
in this sequence. Therefore, we need to
specify its value. As you see in this
tooltip, length, it's expecting line width, but we don't want to specify it. We want the style because
it's not the next one, we need to specify the parameter name
actually Style equal, and I want to use
the columns plot. To do that, We use plot style columns. That's it. We plot the histogram. Next, I want to plot
the McDe McDine. We are plotting it. We are setting up the title for that plot and the
color for Magdne, I want it to be blue. Color blue. The last plot in this indicator, we're going to plot
the signal line. Plotting signal line, and
let's call it appropriately. Signal line and the color
for the signal line. For example, let's
use orange color. That's we plotted. Now we can save our indicator. It's asking name. Let's confirm this name. The name of the
indicator is over here. As you see in the
console window. Once we save, it compiles. If there is no error,
it's going to be saved. If there was an error here, then we would get a arrow
line in this console in red. Let's for example, we made some error here and we tried
to save the indicator. As you see, we
could it saved it, but however, we have an
error in our script. There is some information
of that error. The error is happening
on the line 14 on the first column of that
line, f column one. Let's go there and fix it. And then let's save it again. This is how you see the
error and how you see where that actual error
happened in your code, the location of that error. After we saved our indicator
and there is no errors, we can add our
indicator to the chart. Let's hide the Pine
script editor. We can see that This is our
Mag D custom indicator. The columns over here green
whenever the value of histogram is positive
and red whenever the veil of histogram
is negative. Then it states basically around the zero value. Now As you see, the indicator has the two lines. Blue line is the Mc Dee, orange line is the signal line. Now, when we click on the gear
button for this indicator, we can see that it has three
parameters that we have set in the pine script. We can change this
parameter if we need to. Click, and these parameters will be applied
to the indicator, and it's going to change a bit. It's going to
change the visuals. It's going to change how
it reacts to the price. Let's, for example, three, and let's for example. You see, it changes how indicator reacts to
the price it's applied to. One more thing is that
this indicator has been plotted on the pane
below the main chart. There is a parameter in
the indicator function that is responsible if you want to overlay our
indicator on the chart or not. The the parameter
name is overlay. By default, it's false. Therefore, we did
not specify it. But if this parameter
is set to true, for example, for some
other indicators, the par indicator will be
plotted overlaid on the chart. But for Mac D, we don't want
to be overlaid on the chart. We want to be plotted
at the bottom of the chart on the separate pane because it is an oscillator. It os around zero value. To summarize this lesson, we built our first
simple pine script, the Mac Dee indicator. I demonstrated how to code
the script, how to detect, and fix script errors, and how to add
script to the chart. This is the end of the lesson, and I will see you
in the next one.
4. Introduction to Indicators and Strategies: Call one, welcome
to this lesson. Introduction to indicators
and strategies. In this lesson, we
are going to review main concepts of indicators and strategies in Pine script. Also, we'll explain
basics of execution model of the Pine script and basics of time series. Let's begin. We'll explore in this
lesson the key concepts and the practical tips to enhance your proficiency
in Pine scripts. L et's review indicators versus strategies in Pine Script. Pan script strategies and Pine script indicators
serve distinct purposes. Strategies primarily used for back testing on historical data and forward testing
on live markets. They include strategy calls to execute trade orders via Pan
scripts broker emulator. Back test results are
displayed in strategy testers. L et's take a look at
the strategy test. This strategy tester is actually the very next button to
the Pine script button. Here, I apply the Mac D
strategy to the chart. Here in the back here
big testing results displayed in the
strategy tester. You can I review, click
on the IV review tab. You can see the graphics
related to the equity curve, and you can add some other
curves on this graphics. Also, performance summary is available for your
B test session and the list of traits and the properties
of the strategy. Now, indicators in its turn. Focus on calculations without
back testing capabilities. Indicators run faster, utilizing fewer resources and are
unable to execute traits. Indicators are ideal for
overlaying on the chart. As you see the main difference between these two scripts
on the left side, we can see example of
indicator on the right side, on the screen, we can
see example of strategy. Indicators use
indicator function to define the indicator script. Strategy use
strategy function to define the strategy script. Understanding the
nuances between these indicators and
strategies is crucial, as each serves a specific role in your script
development journey. Now let's review the execution
model of the Pine script. Pine scripts operate differently from
traditional programs. In Pine script run time, a script functions in
an invisible loop, executing 1/bar from left
to right on the chart. Historical bars and real time
bars play distinct roles, and the execution model dictates script behavior during
various market conditions. Strategies unlike
indicators typically execute one on real time bars. With configurations for each price volume
update if necessary. The way historical and
real time bars work together influences how Pine
script runs dynamically. Let's quickly review the
strategy, for example. When you load your Pine script, either indicator or strategy, it immediately your
script immediately executes for each
bar on the chart. After that, on the strategy, it usually executes at the
end of any real time bar. Once the strategy is loaded. Typically on the indicator, it executes on each changes
of the real time bar. If for a real time bar, any changes related to
volume or new trades arrive, indicator executes
on such changes. What it means that
Pine script of indicator executes
on a real time bar, usually on each changes
in the real time bar, such as new traits or
volume changes on the bar. Now, let's take a look
at the time seras and let's try to understand how time series work
in the pine script. The backbone of Pine
script is the time seras, a data structure containing
values for each executed bar. Discontinuous expansion of time seras with each bar execution enables referencing past values through the history
referencing operator, which is the square bra operator as you see on the screen. While might seem like a race, time series differs
significantly. The minding and enhanced understanding for effective
script developing. Combine this indexing mechanism
with built in functions, tailored for efficient
time series handling, mastery of time seras and
the time execution model unlocks the potential to achieve remarkable outcomes
with minimal code. Let's review this example
of using time ser. These two lines return the
same return the same value, but this is achieved by using a history referencing operator applied to the
different part of code. What we do here is we check if close price if current
close price is bigger than highest price of close
for the last 10 bars, but we check not the
current highest, we check the previous
highest price. It means that we applied history history
history time reference to this time series
of the highest. But we access the previous bar of this highest time series.
That's what we want to do. On the second line, we access the current
highest time serious. However, we use the
previous close bar that this highest time
sometimes serious uses. We achieve the same
result different ways. The main idea to remember here, we can with the history with the history
referencing piator, we can access the previous
values of the time series. This is the main thing to understand how time series used. In conclusion, in this lesson, we have reviewed the
main differences between indicators
and strategies. I explained the basics of the Pine script execution
mode and time series. This is the end of this lesson and I will see you in the next.
5. Pine Script Execution Model: Colon, welcome to this lesson, Pine Script Execution model. In this lesson, we're going
to cover several topics. I'm going to explain
fundamentals of the execution
model of Pine Script. I'm going to explain
the difference between historical and real
time bars and how Pine script is executed on
both of these type of bars. Then I'm going to explain the events triggering
script execution. After that, I'll cover some
additional considerations in script execution, and also I will unreveal
repainting phenomenon. Let's begin. Let's review in details the execution model of the Pine script.
Let's picture this. The Pine script
code inactive after compilation comes to life when Pine scripts
runtime executes it, and that is triggering
by Potal events. Now, let's take a look at the historical bars
calculations and how the script is executed
on historical bars. When scripts loads on the chart, it is applied on
historical bars. First, utilizing O HCV
values on each bar. OH LCV is abbreviation of open, high low close volume. This all the data of a bar. Navigating through
time in chart, we can scroll bars, loading historical data until the data sets beginning
of the chart, or you hit the
accounts bars limit. A Script starts executing on the first historical
bar index zero, initializing variables
for subsequent lines. As it sequentially executes in a loop on close price
of each historical bar. The script calculates based on OH LCV values on each bar
and plots its outputs. The performance continues bar by bar until reaching the
latest in the data set. Now let's switch to
the real time bars. They work differently. In this dynamic show, scripts undergo
constant recalculations responding to every tick
in the real time bar. Before each update,
variables roll back, ensuring scripts starts afresh. This rollback danse resets plot elements,
plot elements two. Real time bars showcase
script iterations, triggered by updates,
allowing for variable changes and creating
a responsive script. On this stage, scripts
perform at the bars open and each and
with each update, capturing the ever
changing market. Before every update, roll back resets the variables to
the prior bars state. A clean state ensures
accurate calculations. The last script execution at the bars close
solidifies variables, concluding the real
time performance. Now, now let's take a
look at this chart. It's important to
realize on what kind of chart you try to analyze the bars execution,
the scripts execution. Is it a real time chart? Is it an active chart
or inactive chart? Active chart meaning that
chart is being live. It means that new coming
and updating the chart. This chart, you see on the
screen is a theorem chart, and this chart is
always active 247. Well, that means that the very right the very right bar on this chart is
always being updated. All other bars on the
left are historical bars, and the right bar on this
chart is real time bar. Because it's constantly
being updated. New trades coming up, and new volume
updates coming up, updating this chart, at this specific bar,
the real time bar. The very right bar
is an active chart, is always a real time bar. All other bars on the
left, are historical bars. Now, let's discuss the events triggering the script execution. Let's say we have a
script over here. We have a script and let's review how
it's being updated. Now let's talk about triggers. Various events set scripts into motion on the complete bar set. So the script is being executed. During following events, a new symbol or time frame
is loaded to the chart. For example, I
change the symbol. From etherum to Bitcoin. After that, the script that we have applied to
this chart, in this case, the Mac De simple
strategy script, when we trigger the
script execution by changing the symbol, for example, for this chart. That script is started to be executed from the very
first bar on this chart, and on each bar on this chart, up until the very right
bar on this chart, which is the real time bar. On the real time bar, it's going to get executed
on each change of that bar. That bar is being
changed on every tick or on every volume
change on that bar. The second case whenever script is being executed
is whenever you change, for example, time
frame on the chart. After that, other triggers, a script is saved or
added to the chart. When we, for example, go to the script, do some changes, save it, then scripts is being
executed again. Or whenever we have a new
script and added to the chart, then scripts is being
executed again. After that, if the
value is modified, value of a certain
settings are modified. Of the script. We get the properties of
the strategy and we change some properties, then the script is
being executed again. Or when browser refresh
event is detected, this happens when you
refresh your browser. When tradings active,
scripts execute on real time bars due to
events or updates, reacting to a dynamic
markets changes. Untouched charts
during active markets, leave a trail of
elapsed real time bars, confirmed, but yet to perform
on historical scripts. For deeper insights about
Pine script execution, we can explore
important function, bar state function,
and that function, your guide to script
execution types. These variables
distinguish elapsed real time and historical bars. Now let's take a look
at at some possible Variations of this function. This function is bar
state and after that, it has different
different function? For example, bar state is first? You can check this
built in function. If you need to detect if the current bar is very
first bar on the chart? You can use this
function in order to detect in your script to detect if certain bar that is being executed
by your script. Is that a first
bar on the chart? Bars state is last to detect
the last bar on the chart. Bar state is history to
detect historical bar. Bars state is real time. Obviously, to detect
real time bar. Bar state is new to detect very first tick
on the real time bar, or it's always true on
each historical bar. Bar state is confirmed when the last tick on the
real time bar happen. And it's always true
on historical bars. And his last confirmed history, it means that the
historical bar is confirmed after after the
real bar time closed. Now, let's reveal
repainting phenomenon. This is something that
we should consider when we build Pine script. This phenomenon
unveals itself when script calculations on
historical bars might differ from post real
time transition. Slight difference on
OH LCV values during transitions contribute to
script behavior shifts. And you need to consider that. Consider repainting when you
develop your Pine script. In conclusion, in this lesson, we studied Pine script
execution model fundamentals. Differences of script executing on real and historical bars, events that trigger script execution and
repainting phenomenon. Powered by this knowledge. We can develop Pine scripts, and that is definitely
will contribute to our mastering of the Pine
scripts development. This is the end of the lesson, and I will see you
in the next one.
6. Pine Script Time Series Essentials: Hello, welcome to this lesson, Pine script time
Series essentials. In this lesson, I'm going
to cover following topics. First of all, I'm going to cover importance of time
series in Pine Script. After that, I'm
going to talk about time ser and Pine
script execution model. After that, I'll demonstrate
some practical applications, and we're going to use open
price variable for that. After that, I'm
going to touch on distinction between
time series and ras. I'm going to demonstrate
efficient computation of cumulative totals. Then we're going to leverage function calls and time
series in Pine script. Then I'm going to explain the syntax and execution model
for complex calculations. In the end, I'm going to
talk about difference between time series
and serious qualifier. Let's begin. Pine Script, a powerful
scripting language designed for trading indicators
and strategies on trading view platform, derives much of
its strength from its efficient handling
of time serios data. Time series in the
context of Pine script, form the foundational
structure for storing successive values
of a variable over time with each value linked
to a specific point of time. Understanding time
series is crucial for unlocking the full
potential of Pine script. The concept of time
Seres is closely tied to Pine Scripts execution
model and type system. Time seres efficiently represent values that change over time, making them well suited for working with charts
composed of bars, each representing
distinct point of time. The simple illustration
and demonstration of time seres is the looking into the chart and noticing that this chart shows
us time serious value, we can call it serious values
of a certain parameters. For example, for each bar
we see on this screen, each bar is characterizz
with the open, high and low and closed values. All the open close
low and high values, those are serious variables, and they use the
concept of time series. For each bar, we can see the values of this open
close low and high. We can see these
values on the chart. We can see that for each specific bar that represents
certain specific time, we have certain value values
of these serious variables. To illustrate it further, let's review this
example of plotting open price and previous bar of open price on this chart. If we run this script
on this 12 month chart, the open time series
contains the opened price of consecutive 12 12 month bars. Referring to the past
value in a time series is accomplished by using the
history a referencing pertor, like in this example
over here, open. And one in the square bracket, where open and one
in a square bracket denotes the open price
of the previous bar. Now let's take a look
at example of 1 bar. In the line, blue line is indicator that
plots the open price. The green line, as you see
in our code, plots the Previous plots the value of
the open of the previous bar. Let's let's consider,
for example, this bar. The blue line is the
current open price. You see the blue line on this bar on this
particular time equals the open price of this bar and the green line equals
the previous open price. Blue green line
green line equals to the open price of
the previous bar. That's what we expect. At the same applies
for each bar. While time seras might
resemble arrays, they are fundamentally
different. Pi script uses an
array structure, but the concept of time
seres is different. I script allows for efficient computation of cumulative totals
without explicit loops. For example, t.com and close, like we use in this example
is executed on each bar, accumulating the close values as it progresses
through the chart. And we plot this
t.com of a close, we plot this indicator
with orange color, and it calculates
cumulative summary of each close price
for all the bars. Function calls on
successive bars, lift traces in time seras, accessible using the history
referencing operator. For instance, checking
if the close of the current bar breaches the highest high in
the last 10 bars, excluding the current bar, can be expressed as we
coded in this line. We check here, if
close bar is bigger than highest value
of a close for the last ten bar and accept the current
excluding the current bar. That's why we use one in the with a history
referencing apator. We could have used here Another number like
two, for example. In that case, we would have
excluded the two last bars. How this works is this t
highest clause of 10 bars. It returns the serious
type of variable. F from that series variable, we take the 2 bars back. Value from this seres, not the current
value of the cerus, not the previous
value of the cerus, but the 2 bars back values
of this highest seres. Understanding the Pine script
syntax and execution model enables the definition of complex calculations
with minimal code. The looping logic evident
in function calls like plot open
repeats on each bar, plotting the open value
for each bar on the chart, like we did in this example. It's important to
differentiate between time series and the
serious qualifier. Time series explain how consecutive variable
values are stored while the serious
qualifier denotes variables with the values
that can change bar to bar. For instance, time
frame dot period is a variable with the simple
qualifier and string type. Indicating its value remains constant throughout the scripts
execution and each bar. It means that the value that this function returns is a string value and
it's going to be equal of the and the value will
be always the same for each bar where this
script is executing. In conclusion, a
comprehensive understanding of time series coupled with Pine Scripts syntax
and execution model empowers traders and script developers to perform complex calculations with
concise and efficient code. This is the end of the lesson and I will see you
in the next one.
7. Basic Structure of Pine Script: Hall one, welcome
to this lesson, basic structure of Pine script. This lesson consists
of following sections. First, I'll explain the basic script structure
of Pine script, then we'll cover version, how to set version
of a Pine script. Then I will explain
declaration statements, the main part of the
code of the Pine script. Then I will explain how to
use and the specify comments, how to do line rapping. And then will cover
compiler annotations. After that, I will demonstrate
some code examples with all of these code
elements. Let's begin. Pine script is a
programming language designed for creating
custom indicators, strategies, and libraries
on trading view platform. To harness its
power is crucial to grasp the fundamental
structure, versioning, declaration statements,
code implementation, comments, line, wrapping,
and compiler annotations. Let's review the basic script
structure of Pine script. At its core, every Pine script adheres to a structural format. Version, declaration
statement, and statements, and after that, main
Pine script code. Version, let's review it. The script begins with
the version declaration, indicating the version of
Pine script being used. For example, Two, you place two forward slashes
at version equal five, meaning this Pine script
code is set to version five. Versions can range 1-5 with the latest version five strongly recommended by
trade in view platform. Placing this notation
at the top of the script enhances
readability of the code. Next, let's review the declaration
statement. What is it? All Pine script must include
a declaration statement. Defining the scripts
type and key properties. Types include indicator
strategy or library, each with specific requirements
and functionalities. To set type of script, you specify either indicator
or strategy or library. Next, let's review the main
pine script code section. The heart of the script
lies in its code. Various types of statements
shape the scripts algorithm, such as variable declarations, assignments, function calls,
and control flow structures. For example, in this line, we set to the variable A, the result of summary, open, high, low, and closed. Statements can be organized
in different ways with some expressed in one line or
wrapped across multiple lines. Now let's review the comments
element of Pine script. Comments provide insights. And explanations
within the code. They start with the double
forward slashes and can be placed anywhere on
a line or follow the code. In this code example, we can see that
this comment line is placed starting from
beginning of the line. We put two forward slashes
and we put our comment here. In the next example,
in this line, the comment is following
the piece of a code. These two cases are valid. A convenient shortcut
in the Pine editor is Ctrl and forward slash for commenting and
uncommenting lines. Now let's review
the line wrapping. To enhance code readability, long lines can be
split or wrapped. Lines must be indented properly, ensuring clarity in
script organization. In this example, we wrapped one long line in wrapped lines to improve
code readability. And finally, re review
the code compiler dots. Compiler anation
are comments that provide special instructions
for the script. They include specifying
the pan script version, setting custom descriptions, creating collapsible regions
and some other notations. These examples, we see
that compiler version that we're familiar with a
compiler ation description, and compiler, for example, region, the beginning of the region and the
end of the region. Now let's review some of these
code elements on practice. This example, we can see that we have a simple
indicator that calculates the average
of open high law and close and plots this
indicator on the chart. This script begins with the setting the
version of the script, version equals two version five. Next, we set the
type of the script. In this case, it's indicator, but it could be
strategy or library. After that, we
specify the beginning of the region,
compiler notation. At the end of the
Pi script code, we set the end of the
region, compiler notation. Because we specified beginning
and end of the region, we can collapse this whole
section by pressing on this arrow down button. This improves readability
of the code if we need to collapse certain region
and put them in one scope. After that, we see an example of the coment that starts from
the beginning of the line. Let's say we want additional coment example of the comment. Now we can to mark this
line as a comment. We can press control and keep holding control and press forward slash
on the keyboard. This is short key for
commenting the line. When we do press
this buttons, again, cotter forward slash,
line is uncommented. After that, we have a wrapped line of code that
is wrapped into four lines, and it's important to remember that every wrapped line should start not from the exact number of taps from the
beginning of the line. For example, if we
set it like that, We see an error here. Because you should not
set the rapped line right at this
vertical lines that mark the exact tab location. Tab has a special meaning
in the pie script. It means the co, the function, internal scope. Therefore, to set the
rapped line properly, you specify a number of tabs
and then press a space. Now, there is no error. There is no error over
there. In summary, by understanding the
fundamental elements of syntax in Pi script. You can confidently create custom indicators
and strategies and libraries in trading
view platform, enhancing your technical
analysis and trading strategies. This is the end of the lesson, and I will see you
in the next one.
8. Identifiers and Operators in Pine Script: Colon, welcome to this lesson, identifiers and operators
in Pine script. In this lesson, we're going
to cover following sections. First, I'm going to explain
what identifiers are, and then we're going to study all type of
operators in Pine script, such as arithmetic
comparison, logical, ternary, history referencing, assignment and
reassignment operators. Also, we'll review the operator
precedence. Let's begin. First, let's study
identifiers in Pine Script. In the world of trading
view, Pine Script, we use special names
called identifiers for variables and functions
we create in Pine Script. Now, identifiers
have some rules. They start with a big
letter A from A to z, a small letter from A
to z, or an underscore. In other words,
it's Alpha umeric, but it can start only from
a letter. Second rule. After the first character, you can use letter
underscores or numbers. Third rule, identifiers
care about capitalization. They know the difference
between big and small letters. Let's review
identifiers examples. All these MR and
under score my R, et cetera are valid identifiers, except last one, and this is not allowed because it
starts from a number. All identifiers start
from from a letter. Capital letter or small letter. And it can contain only numbers letters or
underscore character. Next, we have examples
from a real life code. We have an example
of identifiers. We have green underscore
color equals this color and we have max underscore
logb equals this number, we assign this number
to this variable, we assign this number to
this variable Here we have a variable integer
fast length and we assign value seven
to this variable. All these variables are valid identifiers because they follow the rules
we just specified. Now, there is a guide like
a set of rules to make your code look good for
things that don't change. We call them constants. It suggests using
the big snake case. For example. In this example,
we use the constant. What constant means is that this variable is
going to have always this value in the pine script because we assign
this value to it and it's going to have
during entire script, it's going to have
only this value. It's a constant. There is
a suggested rule to have a sa snake case,
identifier name rule. You use all capital and when you combine two words into one, you connect them
using underscore. This is so called snake case, this rule is suggested
for constants. Now, the same for this constant, we use the same rule called snake case
for this identifier. In another case, this is the variable because
we specified integer, fast length, and in this case, we use another rule. It's called camel case. Camel case, it means
that you combine the several words
into one big word, and you connect them by setting the first letter of each word to fast,
starting from small. Next logical word length, and we started with capital L. The same rule applies
for the function. We use camel case naming
convention for the function. This is just
suggested rule, zero, and then another
word one and one, we start from capital. We to basic build
this identifier, we use two words zero and one. Second and following
other words, we're going to start
with the capital letter. That's pretty much. Remember these
rules help make you code easy to read
and nice to look at. It basically improves
readability of the code. Pick good names
when you do it for your identifiers and
stick to those rules. Now In trading view pine
script operators are tools we use to build expressions and perform operations
that yield results. These there are different
type of operators, each serving specific purpose. Operators can be broadly
classified into two categories. Those used to build
expressions and those used for assigning
values and variables. Let's review
arithmetic operators. Arithmetic operators are used for mathematical calculations. In Pine script, there are
five arithmetic operators. Addition and string and
catenation operator, we use plus symbol,
substraction, we use minus symbol, multiplication, we
use star symbol, division, we use forward
symbol, and modular. It's a remainder after
division percent. We use symbol percent for
this arithmetic operator. These operators can work with
both numbers and strings, providing flexibility in
calculations and concatenations. Let's review the real
life code example. In this example, we assign
value five to variable eight, we assign value three
to Vari B variable B. After that, we calculate summary of variable
A and variable B, and we assign the result of the summary to another
variable result. This is an example how we use one of the
arithmetic peration, in this case,
addition eperation. Now, let's review the
comparison operators. Comparison operators
help us compare values and make decisions
based on the results. Pin Script has six
comparison operators. First, less than second, less than or equal to, third, not equal fourth equal fifth, greater than and six
greater than or equal two. Now, let's review the example
of comparison operator, how it can be used. In this example, we assign to the variable
close above open, the result of logical per
of the comparison operator. Greater than between
variable close and open. If close is bigger than open, then value of true will be assigned to this
close above open variable. Otherwise, value of
files will be assigned to close above open variable. This is an example how
comparison aerator is used. Next, let's review the
logical operators. Logical operators help in
building logical conditions. There are three logical
operators in Pine script. First, negation, second
logical conjunction, and third logical disjunction. Let's review an
example how it's used. In this example, we have condition one variable
and we assign it result of the operator comparison
operator close and open. If close bigger than open, then true value will be
assigned to condition one. Second condition,
another comparison operator bigger than used. T the variable condition two, we assign the result if
higher, bigger than low. Then in the next line
to the variable result, we assign the value of
the logical operation, if condition one
and condition two, I condition one and
condition two is true, then value of true will be assigned to to variable result. Otherwise, if this logical
operator is false, then value of files will be assigned to the variable result. What negation is negation
is operator when you negate the logical value
of the following operator. Or it's obviously that when
you use logical operator or the result will be if either left argument
or right argument, around this operator, if either of these
arguments are true, then the result will be true. Next, let's review
the ternary operator. The ternary operator
represented as two symbols. Question mark and column is a concise way to write
conditional expressions. It returns one of the two values based on specified
condition, how it works. You specify condition,
then you set the question mark symbol, then you specify the value
when condition is true, then you put a column, and then v one
condition is false. Let's review an example. In this example, we have a
variable color condition and we assigned to that variable value
of this expression. If close, greater than open, then and this entire expression will be equal to
color dot green, and this color dot green will be assigned to the color
condition variable. If close not bigger than open, then color dot red
will be assigned to color condition variable. That how ternary parator works. Now let's review the history
referencing operator. The history referencing operator represented as square brackets. It allows us to refer to the
past value of time series. It is crucial for analyzing historical data and making decisions based on
past information. Let's review how history
referencing operator works. In this example, we have
variable post close, and we assigned the value close and one in square brackets to the
variable post clause. We use history
referencing operator and we specified the value of one inside of this separator. It means that we take
previous bar value of close, and we assign it to the
past close condition. We could use another number
inside of the brackets. Let's say we use number of five. In that case, we
assign close value of 5 bars back to the
past close variable. This is how history,
referencing parator works. Next, let's review the how
operator precedence work. This is basically a rule how precedence is working when you have different operators
in one expression. Operators have different
level of precedence, determining the order
of calculations. Understanding operator
precedence helps in writing expressions that
produce the expected result. Now, this is the
operator precedence. The operator with higher
precedence are executed first. For example, if you
have in one expression, pertor history
referencing parator, and basically arithmetic
operator plus. First, we'll be executed history referencing
operator because it has higher precedence. Then we'll be executed
arithmetic plus operator because it has lower precedence. Now let's review
this in an example. In this example, we defining variable result and we assigning the value two plus three
multiplied by four. How this value is calculated. This value is calculated using the precedence operator rules
that we have in this table. First will be executed
multiplication operator. Why? Because multiplication
operator has precedent seven, but the arithmetical addition
operator has precedent six. First will be executed
multiplication, three multiplied by
four will be 12. And then 12 will
be added to 214, and only then number 14 will be assigned to
the variable result. This is how operator
precedence work. Now let's review the
assignment operator, which uses symbol equal. The assignment operator
assigns a value to a variable when it is initialized or
declared for the first time. It signifies the beginning of a new variable and
its initial value. This is an example how you use assigning
assignment operator. When you declare and
initialize the variable. In this example,
length equal to f, this variable is declared and initialized
with the value of. Next, variable factor is declared as integer and
initialized with value of two. Next, the variable
adjusted length is initialized and declared as a result of this
expression length multiplied by
multiplied by factor. The result of this expression is assigned to the
variable adjusted length. This is how assignment
operator works. Next, let's review the
reassignment operator. The reassignment
operator is used to reassign a value to
an existing variable. It allows variables to be mutable and change
their values over time. Now, let's review how
sum operator works. First, what we do is we
basically initialize the value with a type of float and the name of the
variable is moving average, and we assign it to value
NA, meaning not available. This is special
pine script value, meaning not available value. Basically no value yet. Then we reassign new value to the same variable
moving average, the result of ta
dot SMA function. Because we assign a new
value to the same variable, which we declared above, we use re assignment operator. This is how reassignment
operator is used. Now let's practice creating more complex expression that combines different
type of operators. In this crept, we have all
the code examples that we reviewed and discussed
in this lesson. Now, let's say we have a task of checking if current close
bigger than previous bar close by 5% and current high price is bigger
than previous current low, bigger than previous low. Let's define variable bridge and calculate percentage
of a current close price. Clause minus previous clause. We use the history
referencing operator and divide by previous close. In all this expression, we need to multiply by 100 to
calculate the percentage of a change of a
current close price compared to previous
bar close price. And we want to check current high bigger
than previous high. Or current law bigger
than previous law. We want to check
if percentage that we calculated previously
bigger than 5%. We want to if current price change comparing to previous bar bigger than 5%, and current high is bigger
than previous high, or current law is bigger
than previous law. This is an example of how
to use different type of apparators in one expression. We use a history
referencing, pator, we used logical and
we used comparison. Now, summarizing this lesson, I want to say that understanding
these operators and their functionalities is crucial for effective trading view
pine script development. They form the building
blocks for creating sophisticated and
dynamic scripts to analyze financial markets. This is the end of the lesson and I will see you
in the next one.
9. Variable Declarations in Pine Script: Hello, welcome to this lesson, Variable Declarations
in Pine Script. This lesson consists
of following sections. Variable declaration
section where I will explain what those
variable declarations are, how to declare variables
in Pine script. After that, initialization
with NA value, NA meaning not available value. After that, I'm going to explain how variable reassignment
work in Pine script. In the end, I'm going to explain what declaration modes are
in Pine script. Let's begin. In Pine script, variables play a crucial role in storing
and managing values. Before using variable, it
must be declared in the code. This lesson explores the syntax
of variable declarations, various types of variables, and the significance
of declaration modes. The syntax of variable
declaration is as follows. Declaration mode,
type, identifier, equal sign expression
or structure, or it could be
tuple declarations, equal sign function
call structure, where declaration mode is an optional and can be
vari P or nothing. Type is an optional and represents the
variable data type, such as in or flot for example. Identifier is a variable name. Expression can be literal variable expression
or function call. Structure can be I four
while or switch structure. Tuple declaration is
a separated list of variable names and closed
in square brackets. Now, let's review an example
of variable declarations. Variable declaration could be declared with implicit
type or explicit type. When you declare with
explicit type declaration, you specify the type. When you do not
specify the type, variable gets the type from the value that is
assigned to the variable. Also, let's take a look at the
Tale variable declaration. T dot MD function returns
a tuple type of variable. Therefore, we use
tuple variable, which is a sequence
of variable names, and this tuple variable gets assigned value from
T M D function. Also, in the following example, we assigned to variable
return of if operator, depending on the
condition of if operator, plot color variable will get either color dot green
or color dot red value. Note that equal sign operator is used in variable
declarations, distinguishing them
from the reassignment that use reassign operator, which is colon dot equal. We'll review it
later in details. Next, let's review how to initialize variable
with NA value. NA is a special value
in Pine script, which means not available value, or you can view it
as no value yet. We assign NA value to
the variable like this. We specify the type of the variable variable
name equal and NA. Or we could skip specifying
the variable type. We could just specify the
variable name equal and float and NA embraces this expression
returns type of float, but value is NA. In the first line, there is
a invalid way to initialize variable because we did
not specify the type of the variable and we tried
to assign the NA value. Therefore, this type of
this wave of assigning NA value is invalid
because we did not specify the type
of the variable. In the next example, we see the tuple
declaration example. When we assign value returning from T dot BB
function to the Taple, why? Because we know if
we look up the TAB, what type of value it
returns, it returns. Therefore, we declare
the value of tuple, which consist of three values of three variables in this case, and for this Taple variable, we assign the value
that is returning from tat B function. Function calls or structures may return multiple values
like TA dot function. When we use tuple declarations
to store this values, like in this example. Next, let's review the
variable reassignment. Variable reassignment is done using the reassignment operator. Reassignment operator consists
of column and equal sins. It is performed after variable is declared and given
an initial value. Rassignment is a crucial for updating variable values
during script execution. Here, how it works. We use reassignment operator only when we previously already declared the variable
and will have already reassigned
value to that variable. After that, in case we need to reassign new value
to this variable. We use reassignment operator. Next, let's review declaration
modes in Pine script. Understanding declaration
modes, and how to use R and AP keywords is vital for managing variables
behavior across bars. Let's review the on each bar. R type of declaration. When R is used, the variable is initialized
once on the first bar in the global scope of the or the first time
in the local block. It retains its value on the successive bars
until reassignment. Here how it works.
When in script, you have declaration
of ar variable. On the very first
bar in the chart, it gets assigned the value. In this case, zero value. On the next subsequent bars, that value is kept in memory. I if you reassign a new
value to that variable. It's going to remember that
newly reassigned value. This case, this is how
it's going to work. You is going to get zero value assigned on
the very first bar, and then when this is
green variable is true, the count variable will
be incremented by one. Let's review how it works now
on each real time update. Declaration mode, where
we use VIP keyword. It works this way, like in this example. When bar state is new is true, meaning on very first stick
in the real time bar, this arrib update and gets
assigned value of one. On every following tick, we are incrementing
this ib by one. And because we declare
this variable as IP, meaning on each real time
update declaration mode, it preserves its value
between the ticks. This is how on each real
time declaration mode works. In conclusion, understanding
variable declarations is fundamental to effective
script writing in trading view pine script. This lesson has covered the syntax of variable
declarations, including declaration
modes, such as R and R AP. This is the end of this lesson, and I will see you
in the next one.
10. Conditional Structures in Pine Script: Colon, welcome to this lesson, Cditional structures
in Pine script. In this lesson, we
are going to study if and switch
operator structures. Also, I will explain matching local block type requirements when using those structures. Also I will provide you
with best practices and tips of using e and switch
operators. Let's begin. The I parator in
Pine script and in many programming languages is a conditional statement
that allows you to execute different blocks
and code based on whether a specified condition
evaluates to true or false. It plays a crucial role in controlling the flow
of your script. Let's break down how
the perator works. We have here if condition and then if this
condition is true, the code, this section
of code is executed. Then we could have one or
man else if conditions, and then if any of this
condition is true, then corresponding
section is executed and then could be one else, operator, and if neither of
these condition is true, then statement from's
operator will be executed. Condition after I perator is an expression that evaluates
to either true or false. The code within
the first block is executed this code is executed
if this condition is true. You can have multiple blocks to check additional conditions. This if, you can have multiple
of them, one or multiple. The S block, this
one, I present, is executed when none of the conditions in the
if blocks are true. Now, What is important is that to understand the execution
flow of the if statement. Before we're going to
review this example, let's review the flow
execution of this operator. The condition evaluation,
the condition is evaluated and if it is true, the code within the
corresponding block is executed. If this is true, this
code is executed. If the condition is false, the script moves
to the next block, if any, and repeats the process. If this condition is false, the flow goes to
check next condition. In this case, for
example, condition two. Then if this condition
two is false, then it goes to the next, and checks is true. If neither LD is true, then the statement under
statement is executed. Sequential execution, the
code within the block associated with the first
true condition is executed. If a true condition is found, subsequent blocks and
block, if any, skip, it means that if for example, this condition after
I operator is true, then this statement is executed, all other statements
are skipped. Optional block. The block and
the s block are optional. It means that L or
multiple L Z can be presence of
those is optional. And presence of is
optional as well. This is important to remember. Now let's review
real life example. In this example, we
have if operator used, and after I operator, we have a condition
close, bigger than open. If this condition is true, meaning close bigger than open, then the ground color, BG color, variable will
be assigned green color. If close is not
bigger than open, then second condition will
be checked in statement. Then if close is less than open, then the ground color variable will be assigned red color. And if neither of these two condition
first condition after and second
condition after Ls, if neither of these two
con conditions are true, then this statement will be
executed under's statement. In that case, the ground color will be assigned yellow color. This is how if perator
works in this case. So key points from this,
mutual exclusivity. In the series of if and else, if statements, only
the code associated with the first true
condition will be executed. Once a condition is true, subsequent conditions
are ignored. For example, in this
case, if for example, first condition is false, but second condition is true, this statement will be executed. Color will be assigned, the ground color will
be assigned as red. Subsequent, subsequent
statement will be skipped. Default action. The s block provides a default action if none of the specified
condition is true. It means that if
neither conditions is true and after all of
operator conditions, if neither of those is true, then the default statement
will be executed. The ground color will
be assigned to yellow. Indentation rule. The code within each block if L is typically indented
for readability. Although Piscrit is
forgiving with indentation. As you see here,
what we have here. This statement after
each of the operator, if L, the statement is
indented from the start. This improves readability of the code and is
suggested to use. Understanding the e operator is fundamental for
creating scripts that can make decisions and respond dynamically to changing conditions in financial markets. It allows you to build logic that adapts to
different scenarios, making your script more
robust and versatile. Now, let's review the
e operator syntax when it returns a value. In this scenario, the
syntax is as follows. Declaration mode type identifier equals I operators local block, L Z expression, local block, and L and L expression,
another local block. In this case, declaration mode is the variables declaration
mode. Type is optional. Identifier is the variable
name in this case, and expression can be literal variable expression
of function calls. The difference between
using operator that returns value comparing
to using e operator, that does not return
value is that we assign return of the e operator
to a certain variable. In this case, it's
script as identifier. And we need our I operator to return a certain value depending
on certain conditions, and when we need that value to be assigned to
certain variable, we use this syntax. Now let's review an example of using e operator
with return value. In this case, we can see that we declared string
variable bar state, and we assign to that bar state variable the
return from e operator. If operator checks, if this function bar state
is confirmed history, if this condition is true, then The the if operator will return this string is last confirmed history, and this string will be
assigned to bar state variable. If this condition is false, then next condition will be
checked after L if statement. And if bar state is new and
this condition is true, then is new string will be returned and assigned
to bar state. If this condition is false, then next s condition
will be checked. If bar state israel
time condition is true, then israel time string will be returned and assigned to
the bar state variable. If neither of these
three condition is true. This one, this one is this one, if neither of them is true, then other string will be
returned after se statement, and this other string will be assigned to bar state variable. This is how if operator works when we use
it to return value. Now, I want to say
that Understanding, the evaperator is very important
and it's very important to know when you need
to use evaperator z, returning value or not. Now let's review how switch
structure operator works. In Pine script, the
switch structure is used for
conditional branching. Similar to if structure. It allows you to
select and execute specific code blocks based on
the value of an expression. There are two forms of
the switch structure. One with an expression as a key and other
without an expression. Let's review switch
with expression. In this switch, we can see that after switch operator,
we use expression, therefore, this is
the case that we are considering switch
with expression. Now, let's review
how this works. In this syntax, declaration
mode is optional. It specifies the variables
declaration mode, could be ar v P
or nothing. Type. Optional, specifies
the variable type. For example, in flow string. Next, identifier the
variables name, Next, we have a switch apperator
itself, an expression, the key expression whose value determines the case to execute. Value one, value two, and we could have more
values in this operator, specific values that
expression can take. If the recheck this expression, if expression equals
to value one, local block one is returned and assigned to this identifier. If Value two is t. If
expression equals to value two, then local block two is returned and assigned to this identifier. Local block one,
local block two, code blocks associated
with each value. Default block that code executed when no
other case matches. That means that if expression, if evaluated expression does not match any of these values, then de local block is executed and re and assigned
to this identifier. Now, let's review the switch operator example
without expression. In this case, expression
one and expression two conditions evaluated to determine which case to execute. Local block one,
local block two, code blocks associated
with each condition. Default local block,
code block executed when no other case matches. Now let's review some examples
of using switch Epert. In this example, the switch
structure is used to determine whether to enter a long position or
short position, or close existing
position based on crossover and cross
under conditions. So this is how it works. This is using switch operator
without any expressions. So first, when execution of this switch
operator is entered, first condition is
checked, TA cross over. If this condition is true, then this code will be executed. Strategy entries long. So the script will
enter long position. If this condition is false, then this condition
will be evaluated. If cross under condition
is true or not. If it's true, then
short position will be entered by executing strategy dot entry,
short position. If neither of these
conditions are true, then the default statement will be executed,
strategy dot close. The strategy position
will be closed. This is an example,
how switch appetor is used that does not
have any expression. Now, let's review
an example of using switch operator with expression. In this case, we can see
that we use switch operator, and after that, we
have a condition close, bigger than open, and the return of this switch operator
execution will be assigned to the ground color variable. Let's take a look how it works. If this close bigger than
open condition is true, then the switch operator
will try to find the true value within its scope within
its list of values. It's going to find the
t value this line. Then corresponding statement
will be executed and the green color will
be returned and assigned to bground
color variable. I close bigger than open
condition is false, that it will find
the false value and corresponding corresponding
color will be returned, which is red color
in this case and assigned to the ground
color variable. This is how switch operator
works with expression. Now, L et's review the matching local block
type requirements, which is important to
understand when using the structures such
as if and switch. When using multiple local
blocks in structures, such as ef and switch operators, the return value type if structure assigns a value to
a variable in a declaration. What it means that
you use structure, such a switch in this case, and you use you use it in a way, so the return of this structure will be assigned
to a certain variable. In this case, each return value of this structure must
be the same type, like in this case, it's a color. For example, if one of those On of those returning
value does not match the expected color type, you will get compiler error. There are some important
rules also to remember. Only one branch of the switch
structure is executed, and there is no fol th like in some other
programming languages. This symbol arrow symbol is used to associate a value with
corresponding code block, this error write symbol. The structure is
terminated when this with a default local block
to handle cases when none of the specified
conditions is met. Like for example,
in this syntax. When neither of this
condition is true, expression one is false, expression two is false, et cetera, default
block is executed. Brake statements are not
necessary in switch structure. The switch structure is a
powerful tool for creating clear and efficient conditional
logic in Pine script, especially when dealing with multiple conditions and cases. In conclusion, this lesson on conditional structures in trading pine script has equipped you with essential
knowledge to implement robust and flexible decision making logic in your scripts. We explored two fundamental
condition structures. The structure and the
switch structure. Remember to follow best
practices such as avoiding unnecessary nesting and ensure consistent return types within
conditional structures. With a solid understanding
of conditional logic, you are well
positioned to elevate your trading view pine
script skills and craft more sophisticated and responsive technical
analysis tools. This is the end of this lesson and I will see you
in the next one.
11. Loops in Pine Script: Hello. Welcome to this lesson, Loops in Pin script. This lesson consists
of following sections. In the first
section, we'll study a role of loops in
trading Pine script. After that, we'll
study when to use loops in Pine script and
when they are not needed. In the last two sections, we'll study f and le
loops in Pine script. The syntax and
we're going to run through some code
examples. Let's begin. In the area of trading
view Pine script, the necessity of
loops depends on the efficiency and
functionality of your code. In this lesson we'll dig into scenarios where loops
are not needed in the instances where they are absolutely necessary for
effective scripting. When loops are not needed. The Pine script run time
and the built in functions render loops unnecessary
in various situations. Let's explore examples
where loops can be avoided for more streamlined
and efficient code. Let's review this example. Some beginner programmers
might attempt to calculate the average of the last ten
close values using loop, like in this example. However, this is inefficient, Let's review this code. In this code, we
see that we have a loop that starts from zero and runs until MA length
minus one until nine. Loops runs for ten times, and it calculates summary of close price for
the last 10 bars. And then it calculates
average of this close price. There is a more efficient
approach to avoid this loop and calculate the same average of the last close price
for the last 10 bars. This approach is presented
in the next code example. Here, we use TA SMA function to calculate simple moving average of the close price
for the last 10 bars. This way, we avoid loop. We avoid using loop and executing and calculating
the same value. Average price of a close
for the last 10 bars. Now, counting the
number of up bars in the last 10 bars is another task when deemed suitable
for loops by beginners. However, a loop is not needed. Let's review the following code. In this code, we have a
loop that iterates for ten times and inside the loop, we check if close is
bigger than open. In other words, if
it's an up bar, then we add one, we add number of up bars by one. We calculate number of up bars. From the last 10 bars. However, this code
can be calculated, can be developed
more efficiently, and this iteration
can be avoided. This loop can be avoided by
using different approach. In this more efficient version, what we do is we use
ternary aparator to create an expression yielding one on bars and zero on other bars. The function. Maintains
a running sum of that value for
the last 10 bars. This way, we avoided the
loop and we do the same exactly the same
calculation of calculating the number of up bars
for the last 10 bars. Now, let's review when
loops are necessary. While loops can be
often bypassed, there are still some
scenarios where they are crucial for
effective by sing. First case, when
manipulation of collections. You can use collections
and you want to sum. You could want to
manipulate them, do certain calculations
within those connections. Loops become essential
when dealing with collections like
arrays, matrices, and maps. Second case, looking
back in history, when analyzing bars
using a reference value, only known on the current bar, such as finding past highs higher than the
current bars high. Other scenario when
you need to do complex calculations
on past bars. Certain calculations
on history bars may demand loops when built
in functions fall short. In conclusion, knowing
when to use loops and when to ski them is important for creating efficient
pine script code. When you're working
on your script, think about the task
you're trying to accomplish to choose
the best method. Now let's study four
loop and its syntax. The four structure in
Pine script allows a repetitive execution of
statements using a counter. In other words, the loop
is a control structure that allows you to
execute a set of statements repeatedly
based on a counter. The syntax of the full
loop is as follows, declaration type identifier
equal sign four, identifier equal expression two expression by
another expression, and local block loop where declaration mode is a
variable declaration mode, and it is optional. Type is a variable type. It's an optional also. Identifier is a variable name that serves as a loop counter. And the expression is initial final and step
values or the loop? The full loop iterates
through a range of values specified by initial
final and step expression. Iterates starting from initial
until final by the step. The loop executes the statements within the local block loop. This statement is being executed during four
loop iterations. Let's now review
a simple example of the four loop that
prints number 1-5. What we have here is four, and we have I as an identifier that starts
from one until five, and on each of this execution, we plot this i identifier. We have here, as you
see, five iterations, and for each iteration, we plot this value
of identifier. This is how the loop
works in this example. You can also use i keyword to specify a
step other than one. For instance, four i
equal one to ten by two. In this case, you would
add another keyword i, and you would specify
the step for the loop. It's important to note
that Pine scripts fo loop is often used when
dealing with historical data, or performing
repetitive calculations that involve iterating
through a range of bars. Here more practical example
where loop is used to calculate the sum of closing
prices over last 10 bars. Here, we have a loop that starts iterating from zero until nine and it calculates the sum of the last ten clauses. It keep adding the close to the variable sum of clauses
for the last n bars, and after that, it
plots that summary. Understanding the fo
loop is important for efficiently iterating tasks that require repetitive execution. Now, let's study while loop. The while structure in
Pine script allows for the repetitive
execution of statements until specific condition
becomes false. While we'll study
the syntax use cases and examples of while
loop in Pine script. The syntax of while loop is follows declaration mode
type identifier equal sign, while expression
and local block. Where declaration mode
variable declaration mode. Type optional variable type, identifier variable name equal. After that, expression,
it's a condition evaluated at each iteration, and local block loop, statements executed
within the loop. Some key points needed
to be mentioned here. Evaluation of the condition happens before each iteration. It means that before each
iteration and before executing the local block loop,
expression is checked. And I expression is false, even before first execution
of the local block loop, the local block loop is
never going to be executed. I initial check of
expression is false. Changes to the condition inside the loop impact
the next iteration. Inside of this while loop where local block
loop is executed, some changes normally happen in certain variables
that affects the expression that is calculated
before next iteration. The loop stops when the
condition becomes false. The condition is within
this expression. Now, let's review an example of counting bars
with while loop. Here we counting bars if for the certain bars
back in this case, we set default number
of bars to 50, and we calculate the number of bars which are higher
than current high. For the last 50 bars, if we use default values. We count higher bars
and then we count if those high are lower
than current high. In other words, we calculate
number of higher bars and number of lower bars
comparing to current high. We basically rate here for 50 times because default
value for back input is 50, but could be more if we
change this parameter. So basically, this is an example how while
loop can be used. In conclusion for while loop, it is important to know when to use while loops for
effective pine script. These loops are valuable for repetitive tasks until a
specific condition is met, providing flexibility and
efficiency in script execution. S. In a nutshell.
Understanding loops is a big deal when you're
scripting in Pi script. Sometimes you don't need
loops because Piscript has shortcuts like built in functions that get
the job done faster. For example,
calculating averages or counting things can be way more efficient
without using loops. You can rely on
built in functions, such as t or math S for
smoother and quicker scripts. But loops still have their
bright moments in Pine script. They come in handy when you're
dealing with collections, digging into past
data or tackling complex calculations that need
a more hands on approach. Knowing when to loop and when to use shortcuts
like built in functions, let you create pin script that are both efficient
and effective, matching the needs
of your project. This is the end of this lesson and I will
see you in the next one,
12. Introduction to the Type System of Pine Script: Hello and welcome to
this lesson introduction to the type system
of Pine Script. In this lesson, I
will introduce you to the type system
of Pine Script. This lesson consists
of following sections. I will explain why types matter, and as additionally, I will discuss with you where
types come into play. I'll explain
importance of the big three in Pinscri types, execution model,
and time series. In the end, we are going
to study practical code as an example of Pin script
types. Let's begin. S. Imagine the Pie
script type system as a script match maker, deciding which values can team up with different
functions and actions. While you can write
basic scripts without diving into
details of types. Knowing a bit about it can level up your
Pine script game. Why types matter? In Piscript, types are
like labels for values. Whether it's a number or
text or something else, each value has its own tag. Pine script adds a
twist with qualifiers deciding if a value stays put or changes
during the script. Where types come into play. These types and qualifiers
properties apply to every pine script value like
a number text you name. To be a Pine script p, you need to understand
three things types, in other words labels. Pine's way to do things. In other words, execution model, and the idea of time series. Together, they unlock
Pinecript superpowers. Now let's check out
some Pine script code to see how types work. In this example, we
see various types declared and initialized and let's review them one by one. In first section,
we see that we have integer type is declared
and initialized. This initialization is
implicit initialization because type is detected from the value which is
assigned to the variable. In this case, integer, the same for the float. Type is detected when
you assign value to the variable if you
did not specify the type before the variable. In second case, it's
a flawed variable. Next, in the next two examples, we explicitly declare
the variables and assign the values
to those variables. Integer variable and we assign integer value
to this variable. We explicitly specify
the variables flow type and assign float value
to that variable. In the next example, we declare flowed variable and assign flowed value
to that variable. Aki word meaning that this value is persisted
between bars, the same for the string
var string variable. We specify Aki word string, we specify the name
of the variable, and we assign value to
this string variable. The next example, we
use key word var IP, meaning that this variable is inter bar persistent
intra bar resistant, meaning for real time bar, the value between
ti is persistent. We declare IP integer variable and we assign corresponding integer value to this variable. Similar to IP flowed variable, we assign float value to
vari P flowed variable. Next, we have a
function over here, that function has one parameter. Inside of that function, we calculate the value
and return this value. This function calculates square from the parameter that we
pass into the function. So what's interesting in
this function that we return the value that
is implicitly typed. It means that if we
pass integer value, it's going to return
integer type. For example, because we multiply two integers and return
them from this function. This function will
return integer value if we pass in as a
parameter, integer value. Therefore, we implicitly type
return from this function. This is how we use that
function practically. Here we set square site equal
to integer value of five, and inside of this
plot function, we call that plot
square function, we pass in integer value. It calculates that square
from that integer value and that value is plotted
by plot function. This is how function is is used when the value that it
returns is implicitly type. In this example, we
have variables with different types and function doing its thing
with typed stuff. Knowing these types helps
you write better scripts. As we uncover more about
pine script types, you'll become Pine faster. This is all for this lesson and I will see you
in the next one.
13. Decoding Pine Script Qualifiers: Hell on, welcome to this lesson, decoding Pin script qualifiers. This lesson consists
of following sections. First, I will introduce you
to the Pin script qualifiers. Then I will explain the
qualifier hierarchy. After that, we'll
study definition and usages of qualifiers
of P script, such as constant input, simple and serious qualifiers, and after that, we'll study
Pi script types examples. Let's begin. In Pine
script qualifiers are like labels on ingradients, telling us when values
join the scripts party. There are four types, constant, input,
simple, and serious. Each type plays a role and understanding them is the
key to scripting success. In Pine script, there is
a hearchy, in qualifiers. First const after
that input after that simple and after that sers. Think of it as a
ranking system where functions or operations
prefer a certain type, but are cool with
those lower in hearch. Now, let's review each
type of the qualifiers and we'll try to understand the definition
of it and how to use it. First, constant const qualifier. Values for this
qualifier are set in stone before the
scripts first move. Example for this qualifier
is whole numbers, decimals, bole numbers,
colors, or strings. These values of this qualifier are perfect for
unchanging elements, like titles and constant. Second, let's study
input qualifier. Values of this qualifier that are set during
script setup, but can change later. Those values are handy for
user friendly settings. Next qualifier is the
simple qualifier. Ds qu values that are set from the first bar
and stay the same. The values of this
qualifier are great for constant adapting based
on initial conditions, and the final series qualifier, the values for this qualifier, they can change on
any script bar. Those values are perfect
for dynamic values, especially calculations
over different bars. So Let's recap what we've
learned about these qualifiers. C qualifier. Constants
that stand firm. They are perfect for changing
element. Input ifer. Settings are set at
the script start, but can change later. Simple qualifier. Values
of this qualifier that settle in from the first script bar
and remain consistent. And the serius
qualifier values for this qualifier that can
change on any script bar. Now, let's study an example
with those qualifiers. First, we'll review
the cost qualifier to define this qualifier, we specify the
qualifier keyword, then we specify the
variable type and then variable name after that equal and the value
of this variable. We tag this variable
definition as a constant, meaning that this variable
will remain constant always. And it's set at script
compilation time. The same for the second line, constant flowed P equal 3.14, we defined the variable flowed
with constant qualifier. Next, let's review
the input qualifier. For the input qui qualifier, we use input function. That input function, we set certain parameters
like default value, the input, name, minimum value, maximum value, and this
value are configurable. When you want to
change this value, you change them by
pressing on gear button on your script in the
pin script editor, and you can change
those settings before you start before you
start your script. Next is a simple qualifier. The simple qualifier,
in this case, we assign to the variable, that the value that is detected and is set right at the
first bar of the chart. In this case, we we assign the property we assign the value to this variable
property of the chart. Chart dot is standard. This setting is set and is known right at the
first bar of the chart. Therefore, this
is the example of simple qualifier that is
assigned to this variable. Finally, let's study
the cerus qualifier. Sers qualifier is
used, for example, when you use TA dot highest
function or TA dot, lowest function, or many other
function in TA namespace. Because those function re
term, the serious variable. So this is an example how
you use the series variable. You get this variable,
for example, as a return from certain functions in
time in Pine script. In conclusion, understanding
these qualifiers is your secret source for
crafting Pine script magic. Whether you're creating
dynamic indicators, plotting charts, or adding a touch
of interactivity, these qualifiers guide you through the script development. This is the end of the lesson and I will see you
in the next one.
14. Understanding Pine Script Types: Hold on. Welcome to this lesson, Understanding Pine script types. In this lesson, we are going
to study pine script types. This lesson consists
of following sections. In the first section, I will introduce you Pine script types. After that, we'll study
fundamental types, essentials of all
fundamental types of Pine script such as in flow, bull, color, and string. After that, we'll study
special types, collections, and user defined
types. Let's begin. Pin script types
classify values and determine the functions and operations they're
compatible with. Let's explore these types
with this code example. In the first section, we
have fundamental types, variable of fundamental types
declared and initialized. First of all, we declared and initialized in type
variable of type. Integer type of variable
can store whole numbers. For example, one minus
one, 650, et cetera. These type of variables are
good to be used for bar, indices, time, and other
integer related values. Second fundamental
type is flawed. In this case, we declare and initialize
flawed type of variable. Flowed type of variable can store decimal decimal numbers. This number represents
numbers with decimals. They used for prices, volumes, and other
numeric values. Next, fundamental
type is boolean type. Variable of boolean type
can store true or false. Those variables are handy for conditional statements
and comparisons. Next fundamental types is color. So this type defines colors
in hexadesimal format. Variable of these types used for making your charts colorful. Next fundamental type is string. Variable of this
type represents text and closed in single
or double quotes. These variable are
useful for labels, tickers, or any
text information. Next, let's review the
special types in Pine script, and specifically chart plotters. Chart plotters is a type that is used and can be created by using plot
and H line functions. Plot re plot object, H line function returns
H line project. These two functions
return special type. First one returns, plot object, second one returns,
H line object. Next, let's review another
special type, custom graphics. For custom graphics, we use
line dot new function box dot new label dot new and tablet new function
to return line, correspondingly line, box
label and table objects. Next special type
is chart points. To get a chart point object, you use Chart point
and some variation of this function such
as chart point dot from index or chart
point dot now. This function return
chart point object. Next is a collection
type in Pi script. This collection type represents and used by arrays
matrices and maps, containing references
to various types. For example, to get the
object with array type, we use array function. Ray that new function re
object with array type. Next, let's study
user defined types. In Pine script, you can create your own user defined type. To do that, you
specify keyword type. After that, you specify the name of your
user defined type, and after that, you
specify the properties. Of your user defined type and each property
for each property, you specify property
type and property name. You can have any
number of properties. After that, once you declared
your user defined type, you can initialize an
object of this type by specifying the user defined
type name and after the dot, after that you can specify
zero or up to the number of properties that you have
in your user defined dy. In this example, we specified two properties and two
initialized object of this user defined ty. In conclusion, whether you're dealing with numbers, colors, or custom data structures, this type provide
the building blocks for crafting powerful scripts. This is the end of the lesson, and I will see you
in the next one.
15. Exploring the Significance of "na" Value in Pine Script: Hello, and welcome
to this lesson, exploring the significance
of NA value in Pine script. This lesson consists
of following section. First, I will explain what is
NA value in Pine script is. After that, I will explain
automatic casting of NA value. Then I will demonstrate how to explicitly rate the NA NA value. After that, we're
going to review some function to
test for NA value. Also after that, I will explain how to
handle NA value and calculations and how to
protect against NA instances. So let's begin. In Pine Script, the term NA stands
for not available. It's like a placeholder for undefined values
in your script. Let's dive into the world
of NA and understand how it plays a crucial role in trading Pine Script.
What is an NA? NA is a special value used to represent undefined or
not available data. It is similar to N in
Java or non in Phyton. Pine script can
automatically convert an A value to almost any type. Sometimes the
compiler struggles to infer the type leading
to compiler errors. Let's study explicit
declaration of NA value. To resolve errors, explicitly declare the type associated
with the variable. Yes, you can assign an
A value to a variable, but you need to explicitly define the type of this variable and then assign a value to it. Another example is that you use the float function and pass in to that function A parameter. It's going to return float value and that float value will be a flow type value and that
value will be equal to A. How to test for NA? To test for an A, you
should use NA function. To check if value is NA, you use an NA function. This function is going
to return true whenever parameter of this
function has a value. In this example, what's
going to happen is you pass the variable into
an NA function, and it's going to return
true if My war is NA value. In this case, if my war is NA, all this expression is going to return zero, otherwise close. You should avoid
double equal operator if you want to try to compare to compare
variable with an NA value, do not use double equal
operator to compare the value. Instead, use NA function. Let's review how to handle
NA in calculations. It's a good practice
to handle NA values to prevent undefined
results in calculations. Like in this example,
N Z function. S. In this case,
takes two parameters, and I first parameter is A, then it will return
second parameter. If close one in square brackets, is A, this entire function, z will return the
second parameter, will return open price. If close one in square
bracket is not A, it's going to return close and one within
square brackets. Now, how to protect your
script and for NA instances. You protect it
with N Z function. N Z function can be used
with one parameter. If you use like in this example
N Z with one parameter, and peter in this case, all time high variable. If it is NA, then it's
going to re zero value. In this case, you are protected. You're not going to
use undefined value in this within this math
dot max function. In conclusion,
understanding the end handling A values is crucial for robust pin
script development. Whether you're
declaring variables, testing conditions, or
performing calculations, being mindful of an A ensures your script behaves
predictably and accurately. This is the end of the lesson, and I will see you in the next.
16. Mastering Tuples in Pine Script: Hello, welcome to this lesson, Mastering tuples in Pine script. This lesson consists
of following section. In the first section, I will
introduce you to Taple. After that, we'll study
how to create tupple. Then will I review Taple
with multiple types? Then I will
demonstrate how to use tuples in request
security function. Finally, we'll study
conditional taples in this lesson. Let's begin. In Pine script, tuples are hind the way to handle
multiple values, neatly organized within
square brackets. Let's explore the
world of tuples. Learn how to use them and see some practical examples in
Pine script. What is a tuple? A tuple is a set of expressions separated by comma and
enclosed in brackets. Tuples are used when
a function method or local block returns
more than one value. Let's explore how
to create a tuple. Let's look at an example
of user defined function, returning a tuple with the sum and product
of two flowed values. This function calc sum and
product has two parameters, and this function does
calculations with these two parameters of a sum and calculation of a
product, and after that, it returns a tuple
with two values, which is sum and product. This is how tuple is used. Remember that the value that is returned from a function is the last value
within the function. This function returns the tuple consisting from
two values in it. When calling this function, we can use tuple declaration to assign multiple variables. In the following example, and we see how to
declare a tuple. We declare tuple
with two variables. Y two i variables, because we want to assign
to this declared tuple, return of a function
sum and product, that is returning
tuple of two values. Function returning
tuple of two values. Therefore, we declaring
a tuple with two values. When this when Spine
script executes this line, the first value from
returned tuple, sum will be assigned to the first value of declared
in declared HL sum, and the first the
second value from the returned tuple product will get assigned to the second value of the declared tale HL product. This is how we declare tuple
and assign value to it. Now, let's study Taple
with multiple types. Taples can contain values
of different types. Here is an example
of using the chart inf function that returns tale with values of
different types. We see this function on this
code example, chart inf. That function prepares
values of variables, does some calculations and does some assignments to
various variables. After that, it returns
those variables in a tuple that consist
of five values. Each of these values
have different types. For example, first
visible time is integer. First visible clause is
flowed type of variable. Is standard is a bleion. FG color is a type of a color and symbol
is a type of Str. This is an example of a tuple that has values
of different type. Now, let's study how to use tuples in request dot
security function. Tuples are useful for requesting multiple values in one request dot
security function call. Here is an example
how to use tuple and rounded O H LC function. Here, we can see defined
function round that OLC that returns a
tuple of four values. Open rounded, high rounded, low and rounded close value. We will use this
function call inside of the request security call as a parameter for an expression, and because of that,
request security will return a topple of this round, open, high low and close values. Therefore, we declare the tuple consisting of four variables, and we assigned to this tuple return of the
function request do security. Therefore, we get assigned
O P variable in this tuple. It's going to get
assigned rounded open. H variable will get
assigned rounded high, L arable will get
assigned rounded low, C C L variable will get
assigned rounded close value. This is how you use tuple with request dot
security function. Now let's study how to
use conditional tuples. Local blocks in conditional
structures can return tuples. Here we have an
example how to use conditional tuple
within if operator. We have if operator here, that depending on the
condition return, tale consisting of
high and close value, or if this condition is false, we return taple of
close and low value, and return of operator
will get assigned to the tales consisting of
variable V one and V two. If this condition is true, if close bigger than open, then Tuple consisting
of V one and V two will get assigned values
from Tuple high and close. In other words, V V one will
get assigned value of high, V two will get assigned
value of close. If this condition is false, then V one will get
assigned value of close, and V two will get
assigned value of flow. This is how you use
conditional tuple. With operator. Now let's review conditional
tuple with switch operator. You assign return of the
switch operator to the tuple, in this case, consisting
of V one and V two value. Now, in this switch operator, if this condition close
bigger than open, if this condition is true, then the switch will return tuple consisting
of high and close value. In this case, high will be
assigned to V one variable, close will be assigned
to V two variable. If this condition close
bigger than open is false, then default expression of
the switch will be returned. Default expression consist of tuple with two variables,
close and low. In that case, if this condition
closes bigger than open, if it's not true, then expression with the tuple consisting of close
and low will be ret. In that case, close
will be assigned to V one variable and low will
be assigned to V to variable. This is how switch
operator works with tuple. In conclusion, Tuples offer a powerful way to handle and organize multiple
values in Pine script. Whether you're returning
values from functions, dealing with different types or making requests for
various data points. Taples provide a clean
and efficient solution. This is the end of this lesson, and I will see you
in the next one.
17. User-Defined Functions in Pine Script: Hello, welcome to this lesson. User defined functions
in Pine script. This lesson consist of
following sections. First, I'll introduce you
user defined functions. After that, we'll study single line functions and
multi line functions. After that, I will
explain how scopes work in Pine script of
user defined functions. After that, we'll
study functions, that returning multiple results, and I will explain
some limitations of user defined functions. Let's begin. User defined
functions in Pine script, empower script
developers to create custom functions tailored
to their specific needs. Unlike built in functions, user defined functions
offer flexibility and can be essential for repetitive
or isolated calculations. This lesson explores
the fundamentals of user defined functions,
their types, scopes, and limitations, Now let's study single line function
definitions. Simple functions can be concise and expressed
in a single line. The structure of
this is as follows. Identify parameter list,
write error and return value. So Let's review an example
of single line function. In this case, you
see that we defined function with the name f that
has two parameters x and y, and the content of that
function is x plus y. This function returns x plus y x and y parameters
of this function. Col of this function
will look like this. For example, a equal F and in the braces first parameter open, second
parameter close. In that case, it will
return summation, summary of open and close. In the second case, b equal F and we pass two
parameters, two and two. In that case, it will return the summary of these
two integer values. In the third case, we assigned to variable c, the function call f with
parameter open and two. In that case, it will it will summarize the two
parameters open and two and will return the value, and that value will
be assigned to the variable C. Here A. In this example, A will be initialized as a cerus variable because we passed in
serious serious parameters. B is an integer and
C is the serious. This is due to the nature
of the passing arguments. Now let's study multi
line functions. Pine script also supports multi line functions
structured as follows. Identifier, parameter list,
right arrow, and local block. The body of the function contains several
statements, each indented. The last statement result
is the functions output. For example, this is an example
when we define function, Gome underscore average
with two parameters, x and y, the function
has three lines. A each line is indented. From the left and the last line in the function is always
function's output. This function calculates the geometric average
of two values. This is an example how to
define multi line function. Now, it's important to note scopes in Pi script
related to functions. Variables outside functions
belong to the global scope. Each function has
its local scope. For example, this function, this is three lines is the
functions local scope, and within this function, we declare and initialize two
local variables, A and B. These two variables are
local to this function. Global variables
and functions can be accessed within a function. Nested functions
and intersecting local scopes are not
allowed in Pine script. Now let's study functions
returning multiple results. Functions can return multiple
results, resembling tuples. For instance, in this example, we define function with
two parameters x and y, and this function returns tuple consisting of two
variables, A and B. Below is an example how to call function that returns
multiple types. We simply declare tuple
with two values and call the function that is
returning tuple of two values. Each of the returning
value will be assigned to corresponding variable
in this apple. It's important to note limitations of user
defined functions. While user defined functions
offer versatility, some built in functions
cannot be used within them, including bar color, fiel
H line and all other built in functions that
are not allowed to be used within
defined functions. All the functions you
see on this list are not allowed to be used within
user defined functions. In conclusion, mastering
user defined functions enhances script organization
and functionality, providing a powerful toolset
for Pine script developers. This is the end of this lesson and I will see you
in the next one.
18. Creating Moving Average ADX DMI Indicator in Pine Script: Hello, welcome to this lesson, creating moving average ADX DMI indicator in Prime script. This lesson consists
of following sections. First, introduction to moving
average ADX DMI indicator. In the next section,
we are going to review moving average ADX
DMI indicator components, such as moving average,
ADX, DI indicators. After that, we'll
develop from scratch, moving average,
ADX DMI indicator, and in the last section
of this lesson. I will point out benefits of this developed
indicator. Let's begin. The ideas of this
indicator is this. This indicator is
going to consist from actually three indicators, moving average, ADX and DMI. This indicator is going
to detect strong trends, and we will allow us to identify strong bullish
and strong bearish trend, as well as cases when there
is no trend in the market. This will help us to trade the selected market if we
want to use this indicator. So the moving average indicator will identify for
us the main trend, and we are going to check if moving average
trends up or down, if it is rising or falling. This will be one basically
condition of our detection, whether trend is
bullish or bearish. A couple of other conditions, we're going to use ADX indicator that detects strong trends. It's going to allow us to detect whether trend the trend is strong or there
is no trend at all, regardless bullish
trend or bearish trend. D MI indicator will provide us two ser DI plus and d minus. Using those two series, we are going to detect whether trend is bullish or bearish. Let's begin developing from
scratch this indicator. To create indicator,
we'll access Pin editor by clicker
on Pin editor button. After that, we're going to
click on Open menu option, and after that new indicator. After that, let's set up
a name of our indicator. Our indicator will
be called moving average ADX DMI indicator. And the overlay parameter
of the indicator, we're going to set to
true because moving average indicator will be
overlaid on the main chart. This indicator we'll
need parameters that going to be needed by our internal indicators
that we're going to use. Moving average and
DMI indicator. The MI indicator is
going to return as ADX series and DI plus and DI minus series that we are
going to use to detect whether trend is
bullish or bearish, or there is no trend at all. First of all, for
our moving average, let's create the period
parameter input parameter. This is input,
integer parameter, and the default value
for our A period is 20, the name for this parameter
is MA average period. Now, for the DMI indicator, we're going to need
period as well. Therefore, parameter
will be DMI period, and the name of
the parameter will be DMI period and
the default value, let's keep it 20. Next, the DMI DMI indicator, we'll need another parameter, which is ADX smoothing. Let's set it that. AD smoothing which is
AD smoothing real. Fx smoothing its integer
parameter, default value, let's use 14 and let's update the name of it ADX smoothing. Okay. So we have entered
the three parameters. Now we're going to need
another parameter that will identify the level
of ADX indicator, it's a threshold level to detect when basically the trend
is strong for ADX or not. For ADX, usually the value
of value of ADX of 20 or 25, meaning that when the
ADX is over 20 or 25, then the trend is
considered bullish. But we need parameter for this threshold in order to change it whenever
we need to change it. Let's call it AD X trend level, and it is input parameter and default value,
let's have it 20, and the name is ADX. Trend level. Now, now let's start calculating the series of our
internal indicators that we use in this indicator. We're going to use
the TA DMI function to return as three series, ADX, DI plus and di minus. T DMI function returns ale. Tople is a series of parameters, Tuple of three variables,
DMI function returns. Let's enter this tuple. First is the GI plus
value in this staple. Second value is di minus, and the third value in
this staple is a dx. We're going to assign
this staple to the return of a function t DMI, which is di indicator. T di. For this indicator, we need to pass di length, meaning di period We have a parameter for
that already the period, and the second parameter
is ADX smoothing. We calculate three series, ADX, di plus, and di minus. We're going to use
this series in our calculation of trend below. Next, let's calculate
the moving average. Moving average series
is going to be equal to tat and let's use
weighted moving average. We could use another
moving average like a simple moving average or
exponential moving average, but let's for this indicator, use weighted moving average. Let's use the close
price for the series and the MA parameter that
we have already set. Now, let's calculate the trend up and trend down variables, new variables that
we are going to use when we plot our
indicator below. Let's calculate and detect in this indicator when trend is up. Trend is up, trend is considered
up in this indicator. First of all, whenever
trend is strong. Trend the strength
of the trend is detected by ADX indicator, and we calculated
ready ADX series. Whenever ADX is bigger than th, that we set parameter
AD trend level. Then the trend is
considered strong. Otherwise, trend is
considered weak. Therefore, if for the
strong bullish trend, ADX should be bigger than the ADX trend level that we
have set to 20 as a default. Now, second condition is that we're going
to use the DI plus DI minus series
from DMI indicator that detecting whenever
trend is bullish or bearish, and whenever DI plus is
bigger than DI minus, then the trend is considered
bullish by DMI indicator. DI plus bigger than DI minus. The third condition for
the bullish trend is that whenever the moving average
that we calculated is rising, it is rising when MA is bigger
than MA in previous bar. This is it for the trend up. Now trend is considered down. In our indicator, whenever ADX is still bigger
than ADX trend level. For the bearish trend, we want trend to
be strong as well. The strength of the trend is
detected by ADX indicator. Whenever ADX is bigger than 20, default prime default
value of AD strand level. We consider the strand, regardless bullish or
bearish is strong. Second condition DI plus is supposed to be less than the I minus for the trend to be bearish according
to DMI indicator, and the moving average is
supposed to be trending down for d trend to be considered bearish by the moving average
indicator that we use as internal indicator in our moving average
ADX DMI indicator. We have set the values for this variable strength
up and trend down and now we can start
plotting our indicator. Our indicator will
be moving average. But with certain colors,
identifying the trend. Because we're going to
use different colors, so let's set the moving
average color variable. Whenever trend is up. Let's use the line color. To color our moving average
that we are going to plot. Otherwise, whenever
trend is down, let's use the red color
of the moving average. Otherwise, when
there is no trend, L et's use yellow color. And the last line
in our indicator, we're going to aplot moving average that we have
already calculated with the color that we
calculated as well. Second parameter is title. Let's use A as a title. After that, let's use the MA color that color variable that we
have already calculated, and the line width of our moving average,
let's use three. Now let's save this indicator. And let's add it to the chart. As we see, our indicator
has three colors. Whenever color of
the moving average that we are plotting is green. It means that the
trend is bullish. Whenever color is red
like in this section, the trend is bearish. Whenever color is yellow, meaning there is no trend. And how this indicator
can be used for trading. For example, whenever
color is green, bullish position, long
position can be established. Whenever color is yellow, position can be closed or held, and whenever color is red, position can be established
as a short position. Our indicator has parameters that can be adjusted
to selected market, you can change the
moving average period. You can change the DMI period, you can change smoothing
period for ADX, and you can change ADX
trend level if you need to. And the indicator will be adjusted according to
the changed parameters. Summarizing this lesson, we
have developed from scratch, an advanced indicator
based on moving average, ADX and DMI indicator. The develop indicator is a multicolred
moving average with different colors
representing whether the market is bullish, bearish of f. The indicator has a variety of adjustable parameters to
adapt to selected market. This indicator works best
on trending markets, as it is meant to
detect strong trends. This is the end of this lesson, and I will see you
in the next one.
19. Creating Open/Close Crossover MA Strategy in Pine Script: Hello and welcome
to this lesson, creating open close crossover moving average strategy
in Pine Script. This lesson consists
of following sections. In the first section, I
will introduce you to the Open close crossover
moving average strategy. In the next section, I will explain the trading signals that we are going to generate
in this trading strategy. The next section, I will explain and we're going to
build from scratch, trading strategy that consist of following components,
input parameters, custom functions,
indicators calculations, and strategy trading logic. In the last section
of this lesson, I'm going to explain
strategy parameters, and we're going to review parameters of this
trading strategy. Let's begin. This strategy uses three moving
average indicators. First one identifies long
term trend of the market, and two others are built on the open and close
seras of the market. The strategy
generate long signal when long term trend is up, and the moving average of close seras crosses above
the moving average of the open series that indicates that Mmentm
of the market is up, and it generates
the short signal when opposite event happens. When moving average of close seras crosses below
the moving average of the opener of the market that indicates the momentum
of the market is down. Now, let's start developing from scratch the strategy
section by section, and I will explain purpose
and logic of each section. Let's begin. We're going to Pine
script editor, then we are going to
create the new strategy, and then we are going to write the strategy section by section. First of all, let's create
the name of the str. Strategy is called Open
Clos crossover Strategy. Open close crossover
MA strategy. Next, let's set the
parameters of this strategy. Overlay will be set to true because the plotted
indicators are moving averages that we're going
to plot on the main chart. Next parameters of the
trading strategy is default quantity type
default quantity type will be percent of equity. Percent of equity, and the default quantity
value will be a 100, meaning that in each trade, we are going to use 100% of
our virtual strategy balance. Default quantity
value equal 100%. Next, let's account
commissions in our strategy. Let's make sure on each trade, we are going to deduct
certain commission, which is going to
be 0.1% because we want back testing
of our strategy to generate realistic
realistic value, realistic characteristics. To do that, commission
type commission type will be equal to
commission percent. Strategy Commission Commission percent, and the Commission
value Commission value. Let's set it to 0.1%. Now, in the next section is input parameter
section we're going to set up all the parameters
for this strategy. First parameter is trade type. Trade type is the parameter that is configuring the
strategy trading types, which type of trade the
strategy is going to trade, long and short,
only long only sh. This this parameter is the
parameter type of string, and it's going to
have three options, long, long and s. First, let's set the title title
is going to be trade type. The default the
default is going to be long We're going to apply this strategy
to the Bitcoin chart, which is mostly trending up therefore default
parameter for this trade type
parameter will be long. Next, let's set the options for this trade type parameters. Options will be long and short. Long and short, long and short. We have set this
trade type parameter. Next, because we're going to have the moving averages
in this strategy, let's set parameters for
this moving average. For the moving average that is going to be calculated
based on open and close of the bars
of the current market, we're going to have
the parameters. First parameter is going
to be moving average type. Which is going to hold
the moving average type, and those types could be several types of moving
averages that we can select. Let's have a linear regression, MA and SMA type of moving
averages that we're going to support for
this MA type parameter. It's going to be the
input st parameter and what we could do
is we could just copy this and quickly change the values that we
need to change. The title of this MA
type will be MA type. And the default value will be let's have it A
and the options for A type will be AA for simple moving average and
linear regression line for linear region
moving average. Now next is set a parameter
for moving average period. MA period is going to be
integer input parameter. For that integer
input parameter, title will be period period and default value
for the MA period. Let's have it 50 and and the step will be equal to one. We have set moving
average type and moving average period for the for
the moving average that is going to be
built on the series of open and closed prices
for the selected market. Now, because we're going to have long term moving
average in our str, let's set the parameters related to that
additional indicator. Those parameters are
going to be very similar to the ones that
we have already set. Therefore, let's copy them and change them.
Correspondingly. It's going to be trend type, trend type, which is
going to hold the type of moving average of the
log of the long term trend. Let's correct the title. Trend and trend period and it's going to be trend type and default, let's have it as a linear
regression moving average. For the trend type, and trend
period the trend period. Let's correct the title. Trend period and
the default value because it's a long term. Moving average,
let's have it 140, and the step whenever
we need to change the parameter from the parameter configuration
of the strategy, let's have it step as a ten. Now, we completed the
section of input parameters. Next section will be
custom functions. Custom functions,
where we are going to develop all the functions that we are going to use
in this strategy. In this strategy,
we're going to use only one custom functions that is going to be get MA source to return certain moving
average depending on the selection or depending on the selected type
of moving average. Get MA S. The function is going to
have three parameters. First parameter is Source. Second parameter is type, and the third parameter
is period that MA is going to use. S A type and period. Next, we specify the arrow because it's going to
be the custom function. In that custom function, we're going to have a
switch and the switch is going to have the
expression as a may type, that is the source parameter, that is the parameter of
this custom function, depending on the MA type, depending on the MA type. We are going to return calculated
series of that MA type. For example, for the MA, For the EMA, MA type, you're going to return the
calculated EMA series. We're going to use a
t dot EMA function, and we're going to pass
the source parameter. We're going to pass the
Vio parameter into that. Function, for the SMA type, we're going to use the tA dot SMA function
with the same parameters. For the default case, because in our trading str, we are using only three options
for moving average type. EMA, SMA, and linear regression. Therefore, for the default
value, we're going to use the Linear regression. If neither selected TMA or SMA, linear regression option
will be returned from this switch to calculate
linear regression, we use t dot lin reg function that is going to use
source parameter. Period parameter. NF set, let's have it zero. This is how we set up our
custom functions and we completed the developing
GA sour custom function. In the next section, we are going to develop
indicator calculations. Indicator calculate
calculations section. Here, first of all, let's calculate close SS and open seres that we're going
to use in our trading logic. Close s is going to be calculated our G so
custom function. And we are going
to pass close of the selected market and MA type and MA period
strategy parameters. MA type MA. This is how we calculated close series from the
strategy parameters. Similarly, we are going
to calculate opens. But instead of close, we're going to pass open price of the currently
selected market. Next, we're going to calculate
the trend moving average. Trend will be equal and it's going to use the same
custom function, and for the trend, we are going to
pass close series. But for the other parameters, we are going to pass
corresponding parameters related to the trend. Moving average. It's going to be trend type and trend period. Period. Next, let's calculate
the certain variables that we are going to use
in our trending logic. First of all, we
need to know when trend is up, what trend is do. Let's initialize such variables. Trend trend up is going to be true. Whenever trend is bigger than trend series from
the previous bar. Trend is down. Whenever
trend value of the current bar is less than the trend
from the previous bar. Now we can plot because we calculate all the
series that we need. Now we can plot all
of them on our chart. To do that, we use plot
function and in plot function. Let's plot series, and the title will be closes And the color will
be let's say blue. Color blue line with, let's say 22, and let's say the style style, is
going to be a line. Because it's moving. It's like moving average. Plot and we're going we're going to use
the line style line. We plotted the close line, close series on the chat. Now let's plot the opens. Opens. For opens let
have different color, let's use the maroon color. Everything else, all
other parameters for the plot function are
the same for series. Next, let's the
grand moving age. Trend. Let's give it
corresponding title. Trend and the color of
this moving average. Let's set it depending on
where the trend is up or down. To do that, we're
going to do that, we're going to use
the the parameters that we have already set, we're going to use
the variables that we have already assigned trend up. When trend is up, We're going to use color, we're going to use green color. Otherwise red color. We're going to have
different colors depending when they trend up or down to visually identify the trend of the current market. In the next section,
we are going to develop the trading
logic of this strategy. The trading logic is going to use the following variables. First of all, we
need to evaluate the conditions for the long
exit and exit short cases. L et's set this variables. First variable is
a long condition. Long condition in this str, whenever crosses over or
crosses above the open series. We're going to use TA cross function, and first primey
regan use closes, second primety regan use opens, this function is going to return whenever close ser
crosses above, opens seres. Also, we need to
evaluate the trend. For the long condition, we need to make sure
whenever trend is up and crosses above opener
only in this case, long condition, we want to be opposite logic for
the short condition. Short condition except that
it's going to be cross under when closes crosses under the opens series
and trend is down. Now let's calculate
the exit conditions. We're going to need the exit long condition and
exit long condition when closes ser crosses below the open cerus. And exit short exit
short variable will be set to true whenever closes crosses
above, opens ss. This way, we have set the technical conditions of the trading logic
in our strategy. Now we know when strategy
is going to open long, short position, or exit
long or exit sh positions. Now, let's set the four
variables that we are going to signal to our entries or or
close position functions. The are going to use
the condition arables that we have already just sad. Is long and let's initialize
it to files Next is short and two other is exit long and is exit short. We're going to use
these variables in the trading logic below. Next, let's set these parameters depending on the
technical conditions and depending on the current
position of the str. To do that, we're going
to use switch function. Switch function in
the switch function, depending on the current
position of the strategy and depending on the technical
condition of the strategy, we are going to set all
of these variables. As long as short, is exit
long and is exit short. First, let let set
is long variables, variable, and it's
going to be set whenever current
position is not long. This is going to be
a first condition. Strategy and we need to
evaluate the strategy position. Position size less or equal, zero, meaning current
position is not long. Be on position sizes, zero, meaning no position, position is flat, On
position size is negative, meaning that short position. Therefore, when strategy do position size is or equal zero, meaning strategy
position is not long. Only when it's not long, we can set is long variable to true indicating to our
strategy that we are going to establish long position. When the position is not
long, long condition. In this case, is long
variable will be set to true. We are going to reassign
value to is long. Variable, therefore, we need to use column and equal sine, meaning, this is
reassign operator. Similar but opposite
logic related to whenever we need to
set is short variable. It's going to be whenever
position is not short, meaning position size
is more or equal zero and and short condition value that variable is true, then is short variable
will be set to true. Next, let's calculate the one is exit will be set to true. I exit long will be set to true? Obviously, whenever we
have a long position, meaning that whenever position
size is bigger than zero, and is exit long
condition is true? In that case, we can set is
exit long variable to true. Final variable, let's set
for the is exit variable. Exit short variable will
be set to whenever we have obviously short position. Short position. Short
position, so short position, we are going to have
whenever position size is less than zero and is
exit short condition. Is true. Now we have
created a logic to set all the variables related to actual trading signal in our trading strategy
that we're going to use in our trading logic below to actual entries and
our trading str. Next, let's create the logic
for exiting the positions. To exit the position, we need to first if strategy position is strategy position size
is bigger than zero, meaning if position
is currently long. W position is currently long, and and we have es exit long variable set. Or we could have another signal, we could have short
variable set. Is short variable set and
short traits are not allowed. Short traits are Short trades are not allowed whenever
we have trade type long. So this logic is as follows whenever we
have a long position. And whether we
have is exit long. All we have is short signal. But whenever we have is short signal and shorts
are not allowed. Basically when shorts are not allowed and we
have short signal, we are going to exit
long position as well. Now let's continue. We covered the long exits. Now we need to cover the short exits.
They're going to have Similar logic, but opposite. O strategy position
size is less than zero, it is short, and we have is exit sh variable set. Is exit short variable set
or whenever we have is long. But logs are not allowed. Lungs are not
allowed whenever we have when we have te type short. These are all exits
from the cases when we have long position
or short position. In that case, we're going to close all positions
that we have. We're going to call strategy
and simply close all. Next, let's set up our entries. Let's set up the
long entry first. So If we have is long variable is long
variable set to true and we need to account the
current trade type as well. Because for example, if long
positions are not allowed, then we cannot establish
long position. It's going to depend on the trade trade type that we have. Whenever we have
long variable set to true and trade type, trade type, not short, meaning longs are allowed. In that case, we can
enter the long position. Str strategy that enter
function and signal, the D of this position will be long and the direction. Will be long. This way we have
set the long entry. Now let's set the short entry. Short entry whenever is short variable is true and
short traits are allowed. Short traits are allowed
when trade type is not long. In that case, we can establish short position. We completed developing
the open close crossover. Trading strategy from
scratch. Now let's save it. So Open close
crossover MA strategy. Let's save it, so let's add it. Let's add it to the chart. As you see with default
parameters on Bitcoin chart, we have 40,869% profit, and now review the parameters of this str and let's verify
how it trades on the chart. This strategy has this
strategy parameters has basically three sections. First section is trade type, whenever we can select type of the traits that are
allowed in our strategy. Default default value for
this parameter is loan, but we can change
it if we need to. X next two parameters
related to the closes and open series of the
selected market. For those for those series, we create moving average, moving averages, based on MA type and based on
MA period parameters. But we can change MA type to another type of moving
average, for example, SMA. And we can change the period of the moving average
that is used to calculate moving average
on close and open seras. In the next section,
we have parameters related to long term trend
of the selected market. We have trend moving
average type. Currently selected value
is linear regression, but we can change
it if we need to. The next parameter is
the trend period of the long term trend
moving average, and we can change this
parameter as well. All these parameters,
we can adjust to the currently
selected market to optimize performance of
our trading strategy. Now let's take a look how the str performs depending on the plotted moving averages. The long term moving
average has red color, whenever trend is
down and green color, whenever trend is up, we are allowed to
establish long positions, whenever trend is up, and whenever trend is done, we are allowed to take
only short trends. Another condition is
that whenever we have the closes moving
average crosses above open moving average. Close moving average is blue. Open moving average
has maroon color. At this location in the chart, we can see that blue line
crosses above the maroon line. Whenever it crossed and we have green trend moving average, meaning that trend is up and blue line crosses
above the maroon line, then we establish long position. We close the long position
when opposite event happens. Whenever the blue line
crosses below the red line. Here is another case. The trend line is green, we can establish longs and the blue line crosses above the maroon line,
we established long. But here as you see
the blue line crosses below the maroon line. Therefore, we exit
long position, as you see, close
position order. Event happens here. So Now, summarizing this lesson. We built from scratch
trading strategy based on three moving
average indicators. One moving average is
identifying long term trend, and two others built on open and close areas
of the market. I explained the logic
of each section of the strategy and the
parameters of the strategy. The strategy provides ability to adjust its
indicator parameters, set different type of
moving averages that allows to adapt the strategy
to different markets. This is the end of this lesson, and I will see you
in the next one.
20. Pine Script Strategy Tester Overview: Hello, welcome to this lesson, Pin Script Strategy
tester overview. This lesson consists
of following sections, Introduction to Pin
Script strategy tester, I review of strategy
tester sections, This section consists of
four other subsections, Overview, performance summary, list of trades, and properties. All these are sections of
the strategy test or taps. Overview tab consist of
two other subsections, equity graph statistics, and
main performance statistics. In the last section
of this lesson, we are going to summarize
strategy tester usage. So let's begin. The strategy tester
module is accessible for all scripts declared
using strategy function. Users can conveniently
access this mode from the strategy tester
tap beneath the charts. Here, they can visualize their strategies and analyze hypothetical
performance results. So first you load the strategy. To the chart. After that, you can click on the
strategy tester to get loaded strategy
statistics or metrics. This strategy tester has
four taps, or four sections. First section over view,
second performance, summary, third list of trades
and fourth properties. All these sections have
different type of metrics, and we are going to overview all these metrics one by one. Now, let's study a review
tap of the strategy tester. The review tap within the
strategy tester offers fundamental performance
metrics along with the equity and
draw down curves, spanning a simulated
series of traits. This allows us to quickly assess strategy performance without
delving into details. The chart in this
section illustrates the strategy's equity curve and the by and hold equity
curve as a line plots, and the draw down curve
as a histogram plot. A DC equity curve is toggled in, and equity curve
has a green color. We can toggle in
also by and hold. Equity curve, which
has a blue line, and also we can toggle
in the drawdown, which is a instagram. Users have the flexibility to toggle these plots
and scale them as either absolute values or percentages using the provided
options beneath the chart. We can toggle between absolute
and percentage values. When you toggle the label on the vertical axis change
from absolute to percentage. So Let's review the strategy main back test
performance statistics displayed at the top of the tap. All these the main
performance statistics. Let's review each one of them, and I will explain what this specific performance
statistics mean. First, we have a net profit. It is overall net profit or loss achieved
by the strategy. The higher this value, the better strategy reforms. Net profit, as we see, we have in the current currency, dollars, and as a
percentage as well. Next, metric is
total closed trades. It's a number of closed trades. Usually, the greater
number of trades makes the performance
statistics more valid. Next metric is
percent profitable. The percentage of winning
trades or the current strategy. The higher this
value, the better. Next metric is profit factor. This is the strategy,
gross profits, divided by the
strategy gross losses. The greater the
value, the better. I recommend the value at least more than two to consider the strategy is
acceptable to trade. Next metric is Max drawdown. This is the greatest
strategy loss compared to its highest profit. The less this
metric, the better. Next metric is average trade. This is the str net profit divided by the number
of closed trades. The final main try metric is average number
of bars in trades. This is the average
number of bars elapsed during trades
for all closed trades. This strategy performance
main statistics is very valuable during
str, be testing, and optimizing, as it allows by a quick glance at the metrics to evaluate
the strategy performance. Let's review the next
strategy test section, which is performance summary. The performance summary
tap within the module offers an extensive overview of a strategy
performance matrix. It showcases three columns. One for all trades, second, for long trades, and third
for short trades, only. This setup provides traders with more nuanced insights into the simulated trading
performance of the strategy covering both long short
and overall trade. Some of the important
performance metrics in this list are net profit. Second, buy and hold return
because you're always going to be
interested to compare your net profit with
buy and hold return. Is it bigger or is it less? Usually, whenever it's less, the strategy could be less attractive, less
likely acceptable. When the net profit of
the Bacest strategy is higher or or even essentially higher
than buy and hold. Then the strategy basically makes sense to trade this
strategy because you make more profit
compared to if you just bought and held this
selected market. Another important
parameter is sharp ratio. Sharp ratio is a value. It is a return per unit risk. Basically, it's
comparing the return of the strategy compared
to the risk taken. The high sharper ratio, the smother the equity curve, having a smooth equity curve is an important objective
for many traders. Next is average. Winning and losing trades. Average winning trade and
average losing trade, both in dollars and in percent. Also we have largest
winning trade and largest losing
trade metrics here. All this and other metrics of the strategy performance at this step can provide valuable, detailed performance
characteristics of the strategy that can be utilized when evaluating
the strategy. Now, let's review the next tab, which is called list of traits
of the strategy tester. The traits list tap offers a detailed examination of the trades simulated
by the strategy, presenting crucial
details such as date and time of execution. The order type Of a trade, entry or exit, the quantity of contracts
could be a quantity, could be a number
of shares, lots, or units traded, and the
price used in a trade. Aother important trade
performance metrics, such as cumulative profit
run and trade drawdown. In this trade list, we can navigate to the time of a specific trades on their charts by clicking
on them in the list. How we do that. For example, we are interested to
find on the chart this specific trade
this specific exit. We just click on
this circle symbol. And here we navigated
to this specific exit. Now let's for example,
click on another trade. Let's say we want to
check this long entry. We click on this circle
button scroll to bar. It is point on the chart, corresponding point on
the chart is selected. Also, by click on the
trade number here. Field above the list. We can organize the trades
in ascending order, starting from the first, or descending or
starting from the last. We can resort by the
by the trade number, all these trades in
this list of trade. Let's review finally, the last section of
strategy tester, which is properties test. The property step
furnishes in depth details regarding a strategies setup and the dataset it operates on. It contains the strategies
date range, this section. Second, the symbol information. D, the str input. And finally, the
strategy properties. Let's review in details each
of these property groups. First, date range. Date range includes the
range of dates with simulated trades and the total available
ba testing range. Trading range and
ba testing range. Second, group of metrics,
group of parameters. Symbol info. Contains
symbol properties, such as symbol name, the charts, time frame, and
type, the tick size, and the point value for the
chart and the base carenc. The next group of parameters
is strategy inputs. It outlines the
parameters used in the strategy script available in the input tap of the
scripts setting. We can access in in the
strategy configuration, and we can see that
all these parameters are available to view here in the str input of the parameters in
the properties tap. And the last group of parameters
is strategy properties. It provides an overview of the configuration of
the trading strategy. It includes essential
details such as initial capital
base currency, or the size margin, pyramiding, commission,
and slippage. Additionally, this
section highlights the modification made to the strategy
calculation behavior. Overall, this property list contains all important
strategy and back test related
settings that can be viewed and checked
during str testing. Summarizing this lesson. We have reviewed this trading
view strategy tester by analyzing content of the all
strategy tester section. Powered by this variable
strategy metrics, we can evaluate the strategy and analyze in depth
its performance. That will help us to test and optimize the Pine
script strategy. This is the end of the lesson, and I will see you
in the next one. A.
21. How to Backtest and Forward Test Trading Strategy: Hello, welcome to this lesson, how to B test and forward
test trading strategy. This lesson consists
of following sections, trading strategy back
testing essentials, where I review trading strategy
back testing in general. In the next section,
I will review Pine script B testing with
a strategy tester tool. After that, we are going
to study Pin script forward testing with
the market replay tool. Finally, in the last section, I will review the strategy b
testing and forward testing. So let's begin. Back testing in general is a
quantitative method used by traders to evaluate the
historical performance of a trading strategy. It involves applying indicator
or strategy logic to historical market data to simulate how they would
have performed in the past. Back testing helps traders assess the viability,
performance, and effectiveness
of their strategies before implementing
them in life. Markets. Here are the key steps involved in trading
strategy back testing. First step is selection
of a trading strategy. We choose a specific
trading strategy that we want to test. The strategy could be based
on technical analysis, fundamental analysis,
or combination of both. We selected a strategy. In the next step, we need
to collect the data. We need together and prepare historical market data for the period that we want to test, including price movements,
trading volumes, and any other
relevant information. The quality and accuracy
of the historical data are crucial for the reliability
of back testing results. In the third step, we set up strategy parameters
or indicator parameters. We define the parameters of a trading strategy
or indicator, including entry
and exit criteria, stop loss level,
stake profit levels, and any other relevant rules. These parameters
should be based on the rules we would
follow in life trading. In the fourth step, is a process of simulation. We apply the chosen strategy and parameters to
the historical data, simulating the
execution of trades over the selected time period. Each trade is executed based on the rules
of the strategy, considering factors such as slippage and transaction costs. And fifth step is
performance analysis. In this step, we evaluate the
performance of the strategy by analyzing key metrics
such as profitability, risk adjusted returns,
maximum drawdown, and other performance
indicators. This analysis helps traders understand how the strategy would have performed
in the past. Now, let's study trading
strategy, b testing benefits. Trading strategy back testing
has following benefits. First, historical
performance assessment. What it means is traders can assess how well their strategies would have performed in different market conditions
over a specified time period. Second benefit.
Parameter optimization. Back testing allows
traders to fine tune the parameters of their strategies
for better performance. This process is sometimes
referred to as optimization. The third step is a
strategy refinement. It's based on results
of back testing. Traders can refine and improve their strategy to enhance
overall performance. I must say, however, it is important to note that back testing has limitations. Past performance does not
guarantee future results, and there are challenges in accurately simulating
real market conditions. Traders should be aware
of potential BSS and exercise caution when applying back tested results
to live trading. Additionally, over optimization, or so called curve
fitting is a risk, and strategies should
be robust enough. They should have a cushion to adapt to changing
market conditions. Now let's go back to
Trading view platform. Back testing on trading
view platform is the process of executing
Pine script code, such as Piscrit strategy, Indicator library
on historical data. Let's now review and
practice the process of back testing on
trading view platform with the str tester. Here we have super charts
open on a certain market. Now, let's go to P editor by clicking
on Pin Editor button. We have here opened
certain strategy. Now in order to back
test the strategy, we need to add this
strategy to the chart. We click Add on chart. Once we have added the strategy in this
case to the chart, the strategy has
been executed on each bar of the loaded chart, and it was back tested that way. Currently, the strategy
is fully back tested on all available
data on this market, and we can see in
the strategy tester, the results of back
testing this strategy. Now, what we can
do is that we can evaluate and assess
this strategy by analyzing the strategy
performance metrics, such as net profit,
total close traits, percent profitable profit
factor Max draw down, and all other strategy
metrics that we have. We have also additional
metrics available in performance summary tp
of the strategy tester, where we have more parameters to assess back tested strategy. So by b testing our strategy, we can assess the strategy. We can check how that
strategy is viable and how it is acceptable
for us to trade. As a next step, we can start changing certain
parameters of this strategy. We can we can change, for example, moving average, parameter of this strategy, and we can change type
of moving average. And when we change the
parameters of the strategy, strategy performance, changes, the metrics of the
strategy performance changes, and we can assess the strategy with different
parameter in order to see how strategy
would have performed on historical data with
different parameters. By doing so, we can better
assess the strategy and try to see how the strategy can
work on different parameters, and that way we can analyze
strategy better and assess the strategy for
the selected market. Now, let's review the
strategy forward testing now. What is the forward testing? We have just studied the
strategy back testing. Now let's study the strategy
of forward testing. Forward testing is also known as a paper trading or
simulator trading, and it's a method used by traders to test
trading strategy in real time market conditions
without risking actual money. It involves executing
trades based on historical data as if they
are happening in real time. This allows traders to
assess the effectiveness of their strategies and evaluate how well they would have
performed in the past. What is the difference between back testing
and forward testing? The difference is first, the amount of the market data fed to the trading strategy
and how detailed the data is. The second, the trading strategy is not optimized on
forward tested data. It just tested on this data. In BAC testing strategy, is given usually one or four
data points for each bar. Close price or close open
high low bar values. In this case, the strategy has no information about
intra bar price behavior, and this distances away the back testing process from
the real market conditions. However, in forward testing, the strategy is provided
by intra bar data, such as trades ticks with
price and volumes data. And that brings the
forward testing closer to the real time
market conditions. The process of forward testing typically involves
the following steps. First, selection of
trading strategy, where we choose specific
trading strategies that we want to test. Next, data collection,
we gather and prepare historical market data relevant to the time period
that we want to test. This data should include
price movements, trading volumes, and any
other relevant indicators. Third, simulated trading,
we use the historical data to execute trades according to the rules of your
chosen strategy. Trading in this simulation as if we had traded
with real money, including setting stop loss
and take profit levels. The fourth step analysis, after the forward testing
period is complete, we analyze the results to assess the strategy performance. Forward testing provides
several advantages. First, risk free environment. Since no real money is at stake, traders can experiment with different strategies without
the fear of financial loss. Second, realistic
market conditions. They are more realistic
compared to back testing. Forward testing allows
traders to experience how their strategies would have performed in real
market conditions, considering slippage transaction
costs and other factors. And third advantage. Learning and improvement. Traders can learn from the outcomes of their
forward testing and make necessary
adjustments to their strategies to
enhance performance. We need to keep in
mind that while forward testing can
provide valuable insights, past performance is not
indicative of future results. Therefore, even after
successful forward testing, it is crucial to be cautious
when transitioning to life trading and to use proper
risk management practices. On trading view platform, we have Replay market feature that allows us to
forward test strategies. Let's review how it works. To access the replay
market feature, we click on Replay button on the top of this
Superchart screen. After we click on that, we can click on this button, Jump two. After that, so we can select the start date when we want to start replaying market data. Let's for example,
select this date. We click after that the chart is reloaded and Chart is going to start replay market from the date that
we have selected. After that, we can click on play and the market replay
has started replaying The market. We can
change the speed of replay by selecting this button, then we can make it slower or we can make it faster
if we need to. During this process, the
trading strategy is fed with the bar with intra bar data such as stick straights and volume. Therefore, this process of testing is called
forward testing, and it is process of
testing is much closer to real time trading because the data that is fed
to the strategy is close to real time
trading environment. It has intra bar
data and each bar has trades or ticks and volume. It is called forward testing and because we are not supposed to optimize our trading strategy
during forward testing. We optimize if we
need to optimize and change parameter for the trading strategy
during back test, and then after we've
done back testing, we fit the strategy with the new market data from market replay
during forward testing, and that way, we analyze
how our strategy would have performed with the new
unknown data to our strategy. Now, let's see how we
can properly evaluate and back test and see the performance metrics
during the forward testing. Let's say, for example, we want to test the current law the trading str starting from
from the beginning of May. In order to do that,
we can see that currently we have in
our strategy test, the performance of b testing
of this strategy is loaded. And therefore, it
interferes with the forward testing that we
want to get the metrics from. In order to have metrics in our strategy test only related to forward testing, we need to set the start date
of our trading strategy. Our trading strategy has start date parameters
and end date parameters. Let's quickly review how this strategy has
programmed this parameters. We can use this tactic in order to apply to any other
strategies that we need. This start date and end date parameters help
us to back test and forward test our strategies only on a selected o tough time. We can see that we have integer parameter set
for the start date, such as start date, start month, start year, and three parameters
set for the end date. It's end day, end
month and end year. After that, when
these parameters are set within the strategy, we calculate using
time stem function, the numeric value of the
time start end time end, and we're going to
use this value in our time comparing logic in our custom function
in order to identify when this strategy is
allowed to trade or not. Now let's take a look at the custom function that
is called e time enabled. This function es time enabled
is going to return B value indicating whether
current time current on the current bar is the bar where strategy is
allowed to trade or not. In this function, it is
just simply comparing the current bar time to
the time start and time. If current bar time within allowed range between start date and end date of the strategy, then our strategy is
allowed to trade. Now let's see how is time enabled function is
used in our trading logic. Here in this switch function, we set our trade signal bull
variable bull and variable, is long, is short, is exit long and is exit short, and we can see
that we have added additional condition
into this trading logic whenever we set either of
these trading signals. In order any of these
trading signals to be set is time enabled function
must return true value, meaning strategy, we'll
be able to set any of those signals and
we'll be able to trade only in allowed range to trade. We reviewed how we can
set start date and end date parameters in our
strategy in order to restrict the period when we
want to trade our strategy. Now let's return to
the strategy tester. Let's say we want
to forward test our strategy starting from
somewhere from May 1. Therefore, we want to have
in our strategy tester, only the metrics
collected from May 1. In order to do that,
we go and click on the strategy parameters
gear button and we set here the year and the
month May from May 1. Now we can see that strategy has started trading from May 1. We can double check that by
going on list of trades, and we can see that the strategy starts trading later than May 1. From June 20 22nd, there was a very first trade. Now we go here. Now, let's
start replaying market data. In market replay tool, we jump to the to the same date as we
set in our strategy, which is May 1, because we want to
start collecting performance metrics from May 1. Now, as you see,
we have currently no traits in our strategy test. Now when we start
replaying market, we're going to see
the performance in the performance of at in the strategy tester
that is going to reflect on the performance that is collected only
during forward testing. I completed forward testing from May 1 to to the
end of the chart, and we now can analyze the
performance metrics that was collected only
during forward testing. Using this method, when you set the str trading period that is beginning
from a certain date, and you set in the
market replay tool, the start trading date
from the same date, you can collect
performance metrics in the strategy tester only during forward
tested period. Now, summarizing this lesson, we have studied how to be test Pine script
trading strategy, with the strategy tester tool. Also, we have studied how to forward test Pine script
trading strategy, with the market replay tool. Additionally, we became aware of certain limitations of both
back and forward testing. Back testing and
forward testing are crucial steps in the development and evaluation of a
trading strategy. They serve complementary roles in assessing the viability, robustness, and real
world effectiveness of a trading approach. This is the end of the lesson, and I will see you
in the next one
22. How to Optimize Trading Strategy: Colon, welcome to this lesson, how to optimize
trading strategy. This lesson consists
of following sections. In the first section, we'll review trading
strategy optimization. In the next section,
we'll study how to optimize trading strategy
with strategy testa. In the next section, I'm
going to point out how important is it to avoid a refitting in strategy
optimization. In the last section, we'll discuss the summary
of strategy optimization. So let's begin. Trading strategy optimization is the process of fine
tuning and adjusting the parameters of a
trading strategy to maximize its performance
based on historical data. The goal is to identify
the most effective set of parameters that would have yielded the best
results in the past. While optimization can enhance a strategy's historical
performance. It's important to strike a
balance and avoid overfitting. Optimization
overfitting is creating a strategy that is
too tailored to historical data and
may not perform well in the future, unseen
market condition. The key steps in trading
strategy optimization include. First, define parameters, identify the parameters of your trading strategy
that can be adjusted. These parameters could include
entry and exit criteria, stop loss, and take
profit levels, moving average periods,
moving average types, or any other variables that
influence trading decisions. Next step is set ranges. Establish range of values for each parameter
that you want to test. For example, if you're optimizing a moving
average strategy, You might test different moving average periods
within a specified range. Third, perform back testing, conduct back testing
for each combination of parameter values within
the defined ranges. This involves applying the
strategy to historical data to simulate traits and
evaluate performer. Next step is evaluate
performance. Analyze the results of
the back testing to determine which set of parameters produced
the best performance. Performance metrics may include profitability, risk
adjusted returns, drawdowns, and other
relevant parameters, and strategy performance. Next step, avoid overfitting. Be cautious of overfitting, which occurs when a strategy
is excessively tailored to historical data and may not perform well in new
market conditions. It's essential to strike
a balance between optimizing for historical data and maintaining a
strategy's robustness. To avoid overfitting, keep number of optimized
parameters low. I recommend up to 34 parameters. The greater number of
strategy parameters, you optimize the higher risk of curve fitting the strategy
to historical data. That can lead to poor strategy
performance on new market, all life market data. Next step is out of sample
testing. Very important step. After identifying a potentially optimized
set of parameters, conduct out of
sample testing using different time periods or data set not used in
initial optimization. This helps assess
the strategy ability to generalize to new
market condition. What it means that,
let's say you have ten years of available
market data. You optimize the strategy on the first nine years of
that data, and after that, you test this optimized
parameter values on the last year of the
market data that you have, on the tenth year
of the market data. Then that way you will check
if the strategy is still performs well on the
out of sample data. Then the next step
is validation. Validate the optimize
strategy with additional testing and
validation steps to ensure its robustness
and reliability. It's important for traders to exercise caution when
optimizing trading strategies. Over optimization can lead to a strategy that is
too specific to historical data and may not
perform well in life markets. Strategies should
be robust enough to handle variations in
market conditions, and traders should avoid curve
fitting the strategy too closely to past data without considering future
market dynamics. Now, let's practice optimizing Pine script trading strategy
with the strategy tester. Here, we have open close crossover MA strategy
loaded on the chart. We can see that back test
after the back test, we can see the performance
metrics of this strategy. The strategy currently with
the default parameters generate around 40% net profit, and it has a 2.9 profit factor and it has
for 5% drawdown. Let's say we want to
optimize this parameters to improve strategy
performance metrics. Currently, we have
40,000% net profit. However, if we compare
this performance, this net profit to buy and hold, we can see that buy and hold, which is a blue line generates essentially higher
number of profit. Therefore, we will try to optimize the
strategy parameters, the performance of the strategy and particularly net profit becomes closer to the buy
and hold or even higher. Otherwise, if the performance
specifically net profit is essentially less
than buy and hold equity performance
for this market. If it's too low,
then buy and hold, then it does not make
sense to even trade. We better just buy
and hold this market. Let's see if we can optimize
the strategy parameters. In order to do that, we click on the parameters button
of the strategy. Now we can see that strategy
has many parameters. Specifically, for our interest is to optimize, we
have trade type, and MA type, trade type, and MA type, we have a period, trendA type trend period. We're going to keep
the trade type to the long because Bitcoin, the currently selected market
is usually trending up, therefore, we'll keep
trade type too long. We're not going
to optimize that. MA type. We can change
that MA period, trend MMA type,
and trend period. We have these four parameters that we will try to optimize, we're going to change,
and we're going to see if the strategy performs better. First of all, let's keep
the MA type as EMA, and let's change the MA period. Currently, we have
net profit 40,000. We're going to by
changing the parameters, we're going to try
to make net profit as high as possible. Profit factor as
high as possible to MC draw down as as possible, and that's pretty much all. We're going to focus
on this parameter. We're going to try to find
such parameters that have all the selected all
these parameters that I just mentioned
to optimal value. Net profit as high as possible, profit factor as
high as possible, and Mx draw down as
small as possible. Let's try to change
these parameters. We see that we try to
change the MA period. Now, we have 72,000
net profit 78. Let's keep changing 25, it's even less than
we had before. Let's have it 100, 110, 120. The highest we had
sent around 70,000 61 78. We have 78. This looks like an optimal
value for A period. Now let's try to change
the trend period. AA type and trendA
type are essential. They have a very high impact
on the strategy performance. Therefore, and we have only
few vals there to change. We have on SMA and
linear regression. For the trendA type, we have only the, the same options, MA, SMA, and linear regression. Therefore, we'll
keep them for now, we'll try to change the period. Then after we find ideal period, we'll try to change
the MA types as well. Let's change the period. So it's becoming less and less, let's try to move in
different direction for the trend period. Now, actually, we did not get the better value
for net profit. The value of 140, it looks like optimal for now. Now, we have 78, let's see if we can improve this net profit by
changing trade type. Let's change trade type
to not trade type. Let's change the MA type to linear regression,
for example. Then after we change that
let's change the MA period. So 40 19. Let's keep changing and see
if we can get more than 70. We get 496. We have essentially
more net profit now. 400 we have e 3% profit.
It's becoming less. It looks like 135 MA period with a type of lane regression, giving us optimal net profit. The Max dans is 37, which is a little high, but considering Bitcoin
market is very volatile. It's not too high in my opinion. Now, let's try to change trend period now and see
if we can even improve it. Now it's reducing 546,000. Let's change it to different
direction, 500 and 400%. It looks like 140 is optimal. Now, let's try to change
the trend A time. When we start changing
the parameters, we keep in mind the
highest net profit value that we have, 793 than. Let's change it to, let's say. Now we get even more even
higher net profit, 937. Then let's change the
trend period now. 937. Now we have 972. Max draw down is 36, little better, and profit
factor is five, very good. Profit factor, I recommend to have at least two or higher. We have 100 period. Now let's try to improve it. Now, it did not improve
when you move it lower. It looks like these
parameters for now, generating 972% are
optimal for now. Now, let's try to
improve it more. Let's try to change,
for example, SMA. Is it better? No, it's
not better. It's worse. It's not better. It's not better
now. Then MA type does not give us the better
performance comparing to MA. Now, let's let's try to
change the MA type to SM SMA. No, the performance
deteriorated, but let's still try
to change the period. Is it getting better and
to another direction? No, it's much less than
comparing what we had before. It means that we found
optimal parameters. For this strategy on
this selected market, and those optimal parameters are those linear
regression as MA type, 135 MA period, MA
for trend A type, and 100 and for trend period. Now, let's see and compare this performance with buy and hold equity performance. We can see that the green line is higher than the blue line. It means that we generated with optimized parameters
for this strategy, the net profit higher
than buy and Hall. This makes the strategy
attractive to trade. I demonstrated how
to optimize trading, strategy by changing
strategy parameters and back testing and analyzing
back testing results. Summarizing this lesson. Optimization is a valuable
tool when used wisely. But it should be a part of broader strategy
development process. That includes thorough testing, validation, and risk management. This is end of this lesson, and I'll see you
in the next one.
23. Creating ADXVMA Strategy in Pine Script: Hall, welcome to this lesson, creating ADX VMA
strategy in Pine Script. This lesson consists
of following sections. In introduction section,
I will introduce you to ADX VMA strategy. Then I will explain ADX VMA
indicator trading signals. After that, we're going to start building the strategy
in Pine script. The strategy consists
of following sections, input
parameters, section, custom functions,
indicators calculations, and strategy trading logic. In the end, I will explain
strategy parameters, and we're going to overview those parameters. Let's begin. The strategy uses
two indicators, ADX VMA, and moving average. The main indicator in
this strategy is ADX VMA. It is adaptive moving
average indicator that responds to
price fluctuations. It will follow the price
closely during trending markets and become less sensitive
during sideways action. On your screen, you see ADX VMA indicator applied
to Bitcoin chart. As I just said, this indicator is looking like a moving average indicator, but it is very specific
moving average because it reacts to the volatility of the price and
changes its behavior. When market like in this
section is strongly trending, the ADX VMA indicator is
following price closely. But when markets is flat, the indicator is simply flat. And so the stronger the
market, the closer, the moving ADX MA
indicator will be following the price movements. This indicator also is multicolred to easily identify trading signals from
this indicator. When color of the
moving average line of this indicator is green, it means that indicator is
giving us bullish signal. When it's yellow,
indicator is giving us flood signal or
no trend signal, and when it's red, it means
indicator is bearish. It's giving us bearish signal. Then using the signals
provided by this indicator, we can make a decision in our
t in our trading strategy. The ADX VMA indicator itself consists of
two other indicators, as its name suggests, VMA, also known as VDR that stands for variable index
dynamic average indicator. That is adaptive moving average, that is more sensitive
when trending market and less sensitive
in a sideways market. Second indicator in
ADX VMA indicator is ADX average directional
index indicator, that measures
strength of a trend. ADX value ranges 0-100, it is usually considered
when Adx is bigger than 25, Market is trending, when
Adx is less than 20, it is sideways market. This ADX A indicator combines two indicators in sit
ADX to identify a trend, and VMA indicator It is a
moving average indicator, that is variable moving average. When the market is
strongly trending, the VMA indicator is following
closer to the price, when market is flat, here, here, here, then VMA indicator
that is part of ADX VMA indicator is flat and is not
following price closely. It's just going usually flat or less closely following
the price movements. Now, let's start developing the strategies
section by section, and I'll explain purpose
and logic of each section. Before we go to
build the strategy, I want to point out
that the strategies that we're going to build
consist of two indicators, ADX VMA and moving
average indicator. Therefore, I will
explain how combination of these two indicators
is going to give us trading signal that
we are going to use to trade to start any trade
in our trading strategy. Moving average indicator in this trading strategy is going to be used to identify
the main trend, and we can if we need to
follow the strength and only in the direction of the
trend of the moving average, we are going to open
corresponding position. What does it mean? For example, when moving average
is trending up, meaning that that the current
moving average value, this blue line is bigger than previous moving
average value. That is one of the interpretation
when moving average, that indicates that moving
average is bullish, it's trending up, and opposite, when the Moving average
is trending down, meaning that current
moving average position is less than previous
moving average position. This could be indication
that trend is down, and we are going to
open the positions in the direction of this strength
based on ADX VMA signal. We're going to be basing our trading decision on the two indicators in
this trading strategy. Moving average,
which is in blue, and ADX VMA indicator, that is yellow, green, and red. I'll give you an example. Let's consider this
area, for example. As you see, we have the simple
moving average stranding up and the ADX indicator
is green over here. This means that Moving
average indicator is bullish because
it's trending up, and the AD X indicator is bullish because
it's green here. Therefore, at this part, we can open bullish position. Now, There is another
interpretation, by the way, of the
moving average. Moving average can
be trending up. This is one of the interpretation
of the moving average. Another interpretation when
moving average could be bullish when the price is
above the moving average. For example, this bar
close of this bar is he and it is above the blue line above
the moving average, meaning that based on another indication
when the price is above moving average, we can open the
position as well. We have two interpretation
of the moving average. When price is above or
below moving average. Another interpretation
of moving average is when the moving average
is trending up and down. We are going to use this
both interpretation of the trend in our trading str. Now let's start building our
ADX VMA trading strategy. We're going to go
to Pine Editor. We're going to click
on Pine Editor button. Then we simply going
to click on Open and click on the new strategy. We are starting to develop
the new trading strategy. Next, we are going
to insert section by section into the
pine script editor, and I'm going to explain line by line what each section does and what it is what it is used for in our
trading strategy. Let's start inserting
section by section. First of all, we use a
strategy function to identify that this is the
strategy pine script, and it has several
strategy parameters that we have set
in our strategy. First of all, a relay is
true meaning that any Lots are going to be overlaid
on top of the main chart. After that, we have a
default quantity type, which is a percent of equity, and then quantity value is 100, meaning that we're
going to use on each trade entire
virtual account balance of our strategy, and also we have a commission
type which is a percent, and and also we have
a commission value, 0.1%, meaning that
we're going to deduct from each
trade for commission. The value of that commission
is 0.1% from the trade size. In the next section, we have all the parameters needed for the strategy define. First of all, trade type. In this strategy can trade only long position when
value of long is set, and it can trade
only short position and can trade both long
and short position. This parameter we need
if we only want to trade long or short or
long and short trades. Next, we are setting up the three parameters related
to the trend moving average. Trend moving average, enabled
parameters to identify when we enable the trend when we consider the trend in our trading signals of this
trading strategy or not. Trend moving average can
be enabled or disabled. Then trend moving average type, O trend could be a moving
average of different types. It could be simple
moving average, depending on our selection. It could be weighted
moving average, or it could be exponential
moving average. Default is weighted
moving average. Next, trend moving
average period, which is certain value of the period of
our moving average. Default is 150. Next, entry on above or
below trend moving average. This means that when this
parameter is enabled, it means that we are going to enter we are going to enter
the position in our strategy. Only when the price is above or below the
trend moving average. This this parameter is optional, can be enabled or disabled. Next three parameters
are related to exit. We can have different type
of exits in this strategy. It could exit when
trend is reversed. It means that trends bullish when we
entered the position, and when trend is becoming
bearish, we exit. This parameters is also
optional meaning it can be switched on or of Next type of exit when price is breaking the low or
high of the previos. Price bar. This position, this primate is
optional as well, we can enable or disable it. And also the exit type of the strategy can have
different values. It could be on flat, meaning when ADX VMA becomes
flat or yellow color, as I show it previously, then we can exit the
current position. Or when the ADX VMA is reversed, meaning that let's say we
entered the long position, and then AD X VMA
becomes bearish, becomes red color, then we exit. In this case, this is basically logic is applied when we
have exit type on reverse. Next three parameters related
to ADX VMA indicator. First, we specify the
period for ADX VMA, then we specify volatility
related parameters. Volatility ADR period and
volatility multiplier. This is what we have
in input parameter, Section of our ADX VMA str. Next section is related to the functions that we use
in our ADX VMA strategy. Use here one function, which is get MA source. This function is
responsible for returning us proper moving average type. We have in our strategy three moving average types
that we use MA, SMA, and WMA, and we're going to
use this function to pass in moving average type and
source and period parameters. In return, we're going to
get proper and expected corresponding moving
average MA, SMA, W MA. Now, let's insert
the next section of our trading strategy, which is section related
to calculation of ADX VMA. This is complex section where we calculate ADX VMA indicator. This section is using ATR
indicators using MAX is using MAX function is calculating ups and downs Delta of
the price movements. In the end, eventually, it calculates ADX VMA
moving average itself, that we are going to plot
on this line on our chart. And also it calculates ADX MA
trend that is providing us a signal from ADX mA indicator whether signal is bullish
or flat or bearish. When ADX mA trend is zero, meaning the signal
is flat or no trend. When it's one, it's bullish, when it's minus
one, it is bearish. In the next subsection, we calculate trend
moving average. We calculate trend moving
average series itself, using yet a source function. After that, we calculate
certain variables that we are going to use in our
trend trading logic, trend up and trend down. Variables, and then we
calculate price above trend moving average or price
below trend moving average. After that, we plot
trend moving average. Whenever trend moving average is enabled, then we plotted. Also we calculate breakout Barre breakout or bull breakout, we need this variable
in order to calculate our exit logic when certain
exit parameters are enabled. And the next and
final section of this trading strategy is
trading logic section. In this section, we do all
necessary trading logic, and we do all necessary
calculations. First of all, what we do, we calculate long
condition based on technical indicators
and based on the parameters of this strategy. We are considering we evaluating ADX A trend, whenever
it's bullish, and also whenever
trend MA is enabled, and then we are evaluating
where the trend is up. This logic is calculating
when if trend is up or not, and this section is only
going to be considered, only one trend is enabled. O trend is disabled, this section is simply
simply ignored, and this section
will be always true. And the same applies
for this section, when entry on above
below trend is true, then Price above trend
may will be considered, will be evaluated in this
entire entire expression. Let's say, for example,
trendem enabled is false and the entry on above and below trendem
AA is false to, then this entire
sections will be true, and then long
condition logic will depend only on ADX VMA trend. Variable. This is
a long condition, how we calculate long condition
of our trading strategy. Short condition is opposite of long condition,
mostly opposite. For example, it's going to short condition will be true
when a x strand equals two minus one and depending on whether trend down or price
below trend MA is true, depending and these
parameters will be evaluated depending
whether entry and above below trend
ma is enabled and whether trend MA
enabled is enabled. A exit condition depending on the parameters of the trending
strategy, For example, if exit on low, high break is true, then we're going to evaluate
if bear breakout is true. Next, depending whether
if exit type is on flat, then we are going to evaluate
if ADX tn is equals zero M, meaning ADX A is flat. Depending on the parameters, we're going to evaluate corresponding signal
from the trend from the technical indicators. For example, when exit
type is on reverse, then we're going to
evaluate whether Adx MA trend is down
Depending on that, we are going to set exit
long condition to true, and the same applies to the last parameter
and variable that is used in this condition when exit on trend reverse is true. Then we're going to
evaluate based on this logic whether
trend is down or not, and the opposite logic, mostly opposite logic is used
on exit short condition. Next, we we calculated
the technical conditions. In our strategy based on
the indicators we used. Next, we are going
to set the signals. Long short exit
long or exit short that we're going to use in order to allow to trade for
our trading strategy. This is going to be
bullish variables, and we by default
set them to files. In this switch, we
are going to set either of these variables depending on the
certain condition. First, it's going to depend the setting of let's
say is long variable, is going to depend
on long condition. And whether current strategy is basically if it's
less or equal zero, meaning that if current
strategy is not long and the long
condition is true, then is long will be set to true and opposite
for the short. If current position size
is big or equal zero, meaning current current strategy
is not currently short. And short condition is true, then is short variable
will be set to true. For the exit long condition, when current position is long and it is long when current strategy position is
bigger than zero, meaning current
position is true. A exit long condition is true. Then exit long
variable will be set, and opposite logic
is for exit short. Now we have set our
trading signal variables. Now we are going to execute trades depending on
these parameters that we have just sat. First of all, we're going
to make sure that we exit the current position if we have corresponding
parameters set. Whenever position size
is bigger than zero, meaning, it is long and
we have exit long signal. Or we have exit. We have we have a short signal, and and the short
traits are not allowed. Trade type equals
to long condition. When this condition is true, meaning the short
positions are not allowed, meaning only long and long and short positions
are not allowed. When position is long, and exit long is true, or We have a short signal and the short signal
are not allowed. Then we close all positions. Or if current position is short, and and is exit short is true, or we have a long signal and
long signal are not allowed. This is what this
condition does. Long signals are not allowed, when current trade
type is short, in these two case, in
these two major cases, we close all positions. In the next section, we enter the long position when
we have is long signal, and when long
positions are allowed, long positions are allowed, when trade type is not short. And the next section, we enter short position. Whenever we have we enter short position in this
line strategy dot entry. But we enter it only when short variable is true
and shorts are allowed. Shorts are allowed when
trade type is not long. So we have completed
development of ADX VMA trading strategy. Now let's save this script.'s a custom
suffix. Click Save. Now let's add the
script to the chart. Now as you can see that with the default parameters
of the strategy, it performs very
well for Bitcoin on Bitcoin chart and it
generates 20,005,675%. Now let's review how this
str works on the chart and review the str parameters.
Let's take a look. What parameters this
strategy have one by one. First parameter that the
strategy is using trade type, we can select if you want to
trade only long positions, long and short and
only short positions. Certainly when we
change the trade type, the number of trades
is going to change. For example, when we
select long and short, we can see that we have
41 trades right now, but let's keep it long. We have 21 trades only for
long and F markets that, for example, are trending
up mostly like Bitcoin. Usually, it's better performance when you select
only long trades. Next parameter is
the trend enabled. When this parameter is checked, the trading logic is
going to consider the trend moving average
for this strategy. We can disable it if you don't
need to if we don't need that trend moving average to be evaluated for this
trading logic, or we can keep it enabled. Next moving average type, we can change moving average type for our trend
moving average indicator. Currently, selected
is weighted MA, but we can change it to exponential or simple moving
average if we need to. Next trend period is period of trend moving average
in our strategy. Next parameter is entry
on a below trend. When this parameter is enabled, only the traits
that are above or below related to trend moving
average will be taken. For example, when trait is long, only when price is above
or below moving average, trend moving average
will be taken. So when followings, when price above trend moving
average will be taken. And when the trade is short, only when price is
below trend MA. Only then it will allow
us to enter short trades. Exit on trend reverse. This means that when this
parameter is enabled, so the strategy additionally
is going to exit when trend moving average is reversed from long to short
and another way. The next parameter is exit on
previous low high breakout, meaning that when price breaks
the previous low and high, then the strategy will exit. Exit type parameter
is responsible for type strategy will exit
based on ADX MA indicator. When ADX VMA indicator reverses. For example, when we
have long position and when the indicator
becomes bearish, then strategy will exit. When we have on flat type, it means that we have
a long position, but when ADX VMA becomes
flat or yellow color, then strategy will exit. Next three parameters
responsible for setting parameters for
ADX VMA period indicator. We have a period
for that indicator, and we have a
volatility AR period and volatility multi player. These three parameters
are parameters used by ADX VMA indicator in
our trading strategy. Now let's review how actually
it works on trading chart. Let's for for example,
review this section. Because we have trend enabled, it means that it means that
when trend is going up, this green line, which is
trend MA in our trading str, and when it's trending
up, it's green, and when it's green,
long traits are allowed. Because it is green,
so we can take our strategy is allowed
to take long trades. In this section, the
strategy is yellow, the ADX MA is yellow, meaning flat, no trades. But whenever ADX MA
becomes green on this bar, and trend MA is
green here as well. Then on the next bar, we establish long position. And we keep long position
up until this section, whenever ADX VMA reverses. When it reverses, the color
of the ADX VMA becomes red. When it becomes
red, it reverses, and therefore, we
close the position. This way, we verify if our ADX VMA trading str
works as we expect. Summarizing this
lesson, we build trading strategy based
on two indicators, ADX VMA and moving average. I explained the logic
of each section of the strategy and the
parameters of the strategy. The strategy provides ability to adjust its
indicator parameters, set different type of entries, and exit that allows to adapt the strategy to
different markets. This is the end of this lesson, and I will see you
in the next one.
24. Creating Multiple MA Pyramid Strategy in Pine Script: Hall on, welcome to this lesson, creating multiple
moving averages pyramid strategy in Pine Script. This lesson consists
of following sections. Introduction to multiple moving averages
pyramid strategy. After that, I will explain how moving averages indicators
trading signals work. And after that, we're going
to study how to create multiple moving averages
pyramid strategy by inserting components
of that strategy, such as input parameters,
custom functions, indicators, calculations,
and strategy trading logic. In the end, we'll review strategy parameters.
Let's begin. The strategies that
we are going to build it is using the five
moving average indicators. And in order to understand how trading signals are generated by multiple moving averages, let's take a look
at this example. On this screen on this chart, we have two simple
moving averages. The blue line is 99
period moving average, and the red one is 20
period moving average. So How behavior of moving average can be
interpreted as a trading signal. Certain behavior can be
interpreted as a trading signal. Let's review some of them. For example, when the price crosses from below to
above the moving average. Let's consider blue one first. When it crosses above
this moving average, this can be interpreted
as a long signal. Next characteristic. When the slope of the moving average
turns from down to up, then this behavior can be interpreted as a
bullish trading signal, and the opposite trading signals work for the bearish
trading signal. So when the price crosses below, the moving average be moving
average in this case, then this could be interpreted
as a bearish signal. When the slope of the moving average turns from up to down, like in this section, then this behavior can be interpreted as a barrage signal. Now, when we have two moving average
indicators on the chart, their behavior can be can be viewed as source of certain
trading signals as well. For example, when the fast
moving blue line crosses above the red moving average, the red one, like in
this, for example, bar. Then this behavior, this event can be interpreted
as a bullish event, and in opposite when
opposite event happens, when the blue line crosses
below the red one, when the fast moving
average crosses below the slow moving
average, then this event, like on this bar, can be considered can be interpreted
as a bears signal. These events we are going to use in our strategy that
we are going to build, based on this event events, we are going to basically
build the strategy, and we are going to build the trading
logic of the strategy. When it's going to
create long trades, when it's going to
exit the positions. This is all going
to be basically interpreted around the behavior
of the moving averages. Let's start building
the trading strategy. Let's go to Pine editor, and let's create
the new strategy and let's start building it. First, trading strategy,
we are going to build that is going to consist
from several components. First, let's insert
the component related to input parameters. Now, first line in the trading strategy is
usually a strategy function. After that, we specify
the title overlay this strategy has
moving averages. We're going to plot this
moving averages on the chart, therefore, overlay is true. Then after that, this
str is going to is going to basically quantity type of this trading strategy will be cash and default quantity
I selected here $380. Because we are going to
start from certain position, and after that, we
are going to pyramid. We're going to increase
the position as long as the trading strategy keeps
giving us the long signal. Therefore, the fault
quantity value is 380, I just pick that number, and initial capital
is the same number and pyramiding is $1,000. Now, first, we have
the six parameters of the strategy that are related to the allowed trading
period for the strategy. Has two dates, start
date, and end date. Each date consist of three parameters, three
integer parameters, day and month and year, and for the end date, we have the same day and month
and year for the end date. We need this parameters
if we want to trade on and bactest strategy for a certain
period of time. Now, after that, we calculate over here
the time start and time end using the parameters that we have for the
start date and end date. Basically we calculated
to a certain values, time start and the time
end and we're going to use this time statep values in our trading logic to allow the strategy to trade for
a certain period of time. Next, calculate on end bar. This is needed when we
trade the strategy life. When you turn this
parameter to true, it's going to trade
only on end bar. It's not going to trade
on every tick of the bar. Again, this is related to the trading on the
real time bars when you get ticks for every trade in
those real time bars. If you want to trade on the end of the bar
when bar closes, you have this
parameter set to true. Then two parameters
related to pyramiding. Pyramiding, we can
disable and trade only without pyramiding
on the first long signal, it's going to enter the
position and when the exit, it's going to exit the position. But when we have
pyramiding enabled, it's going to keep adding to
the existing long position, whenever the strategy still
giving us the long signals. And pyramiding order amount, this parameter is
basically storing providing us the value for which we are increasing our
position, value in dollars. Now, next parameter
is trading type. Our strategy can
trade long position, short position, or both,
this is configurable. Next, we have configuration
for our moving averages. First of all, moving
average type. We can change the type of our moving averages in
strategy by default, it's linear regression, but we can change
it to EMA and SMA. If we need to, Next, we have Pi five moving averages. In this strategy, MI one
and so on until MI five. Now, you can enable or disable
those moving averages, if you want to certain
moving averages to be to participate or not to
participate in trading logic. If you want to include
them in trading logic, If you want signals from certain moving average to
be checked or not checked, so you disable or enable
this moving average. For example, right now, we have MA one and
MA two enable. Other three moving
averages are disabled. Also for each moving average, we have configured the period
of all moving averages. For MA one, for
example, we have seven, for MA two, we have 13. Next parameter, entry on close above below
moving average. This is the optional parameter. You have it enabled if you want strategy to
enter long position only when close of the
price is above or below. If it's above, Moving average, it's going to be allowed
to enter long position. If this parameter is enabled. Next, we have the
exit parameters. Exit on a MA one cross. For example, exit
on MA one cross, meaning that when a MA one cross when a MA one crosses
below MA two, then this is considered
as the exit signal. If this parameter is enabled, same logic for for exit
on a MA two cross. When this parameter is enabled, and when MA two crosses
below MA three, then this is going to be
interpreted as an exit signal. Right now, we have
only MA one exit, meaning when MA one
crosses below MA two, this is exit signal. Also we have two reverse exit
signals, MI one reverse, meaning that when M one MI
one meaning moving average one slope reverses Then this is considered
as an exit signal. When this parameter is disabled, it means that when
they May 1 slope, becomes down, then this
is an exit signal. When this parameter is enabled, currently, these
two are disabled. Next, parameter is exit
MA one price cross. This is parameter when it's this parameter is
enabled, when MA one, when MA one price when
price closes below MA one, this is considered
as an exit signal, when this parameter is enabled. Next is the parameter related
to graphics on the chart. So we can color the bars to the certain colors whenever strategy has certain position. Currently, this parameter
is toggled off, and this is pretty much
all for the parameters. Now, now let's insert the
second block of our strategy. Let's go line by line, and I will explain what each
line of this block does. These are custom functions
that we use in our strategy. Why using custom functions? Because when we want to reuse a certain block of the
code over and over again, it makes sense to
put this block into a function and just call this function
whenever we need to. First function is true on n bar. This function is used
whenever we want to make sure that that basically it returns true when this
condition is true and when we have end
of bar conferred. This is useful when you
want on a real time bar, the strategy to execute only when real time
bar is completed. Not on everything, when
real time bar is completed. Next, whenever Sers one
crosses above seres two, this function will return true, crossed up, and one Sers
one crosses up seres two, cross down, one Sers one
crosses down Seres two. This this function does. When this happens, this
function will return true. Time enabled, this
function checks time started time at that which
we already calculated above, and this function
will return true, whenever strategy allows to take positions when the trading on the strategy is allowed. When strategy when time is within the allow a trading
period of the strategy. Get the sur. This function calculates for us
moving average. While we pass the sours, we pass moving average
type and period, and it's going to return certain series of
certain moving average. We have three moving average
types in our strategy MA, SMA, and linear regression. This moving averages we
use in this strategy, and we're going to
use this function to calculate those moving average. Now let's insert the next
block in our strategy. Next block, will be
indicator calculations. We have parameters related to our moving
average indicators. Now we need to calculate those indicators using
these parameters. So First, we calculate all five moving averages by using a get MA source function. We pass close, we pass MA type, and we pass corresponding
position corresponding period of moving average. For example, to
calculate MA one, we pass MA one period, and trap to calculate
MA five moving average, we pass MA five period. In this block, we calculated
our moving averages. In the next block, we
start calculating signals, which we're going to use
in our trading logic. MA one up meaning moving average is providing us up trading signal, bullish
trading signal. In this strategy, we consider we have a rule that
moving average, first moving average is behaving as a bush
moving average. Moving average one
is bigger than moving average the previous
bar of moving average two, not the current bar
moving average two, but the previous
bar previous bar moving average two, why? Because they want the
signal to be already 1 bar established and opposite
signal for MA down. MA one is below two
from the previous bar. Similar logic A two
up is considered up when MA two is bigger than
MA three of a previous bar, and opposite logic
for MA two down. However, but for MA
three for MA three, we use already only MA
three moving average, MA three considered up, meaning MA three is
giving us bullish signal. When current MA three price for that calculated MA three is bigger than
previous M three, than previous bar of MA three. MA three is moving
average three, and opposite signal
for MA three down. M four is the same as MA
three, is considered up, so it's giving bullish
signal when MA four of the current bar is bigger than M four from the previous bar. Opposite signal for M for down. Next, Next variable
is close above A. We use this variable as well
in our trading logic below. When close is above
moving average one, then this variable will be true. Also, when price is below
moving average moving average, this is happen when
close is below A one. Next couple of variable calculated following
following way. When MA one is stranding up, it is straightening up when the current MA one value
for the current bar is bigger than obviously MA
one from the previous bar. And the opposite logic for
the MA one trend down, and the same exactly
the same logic. MA two trending up when current, MA two for the
current bar is bigger than MA two of the previous bar, and MA two trending down
has opposite logic. After that, we plot all the moving averages that we calculated
from MA one to A five. This is how calculations for
these moving averages work, and also we calculated signals that these
moving averages give us, so we can use the signals, these variables to build
our trading logic. Next, let's insert
the trading logic of our trading strategy. In our trading logic, first of all, we
calculate the position, why we calculate
position because we want to see to check if our strategy giving us the long position or long or short position or exit long position
or exit short position, or just giving us
the flat signal. The reason we do not calculate
the signals right away, but we calculate the position because position can become, for example, long and can
stay long for some time. But for the signal,
We we want to see when position just becomes available and then
execute the trade. But when position
keeps being long, we are not going to basically
enter new position. If we do not pyramid, but when we pyramid,
it's a different story. I will explain it a
little bit later. Let's see how this block works. First, we basically
initialize these variables. Basically, we're not
going to change, and we use as a constants here. Flood position equals
to zero, long to one, short minus one, et c, and we initialize
position to flood. Then we have a switch here, depending on the logic, this switch is going to return long position,
short position, exit long position, exit short
position, or previous bar. Now let's review long. So this all logic is
passed through on end bar. It means that this is
going to even if you passing the entire
expression if it's true and only on end bar, this function is
going to return true because we want to make
sure on a real time bar, this expression is going to
be true only on end bar, 1 bar is confirmed. Now, we need to check if time
is enabled, and after that, we need to check if the
previous position is not long, because we want to see if this long position if
it was not long before, but now it becomes long. To check if current
position becomes long, we now start checking if our moving average
is enable to know. MA one enabled and MA one MA one up, we
calculated earlier. Then this block basically
is going to be true. Then we check if MA two enabled, then if AA two enabled, then it's going to be then we're going to check if MA two is up. What this means is that
MA one or MA two, et c, these variables are going to be checked in this expression only when corresponding
togal is enabled. Otherwise, this is
going to be this is the variables are
going to be ignored. For example, if we have
only MI one enabled, then all the MA two, MI three a, et c going to get ignored, they're not going to get going to be used in this expression, because this is because
how we build this logic. Our case, for example, we have MI one enabled and
MA two enabled as well. It's going to be this expression
is going to return true whenever MI one
up and MA two up. And also entry on
close above or below. We have this parameter
enabled, let's has. We have it over here. We have this parameter enabled. It means that this
expression will check if close is above
A one moving average. And on in that case, entire this expression
is going to return true and the position
will be long. We're going to take only long
position in this strategy, therefore, therefore,
basically we interested in the long
and the exit long. But the logic of the
short is similar to long, but just in certain cases, it's an opposite logic because we are considering MA down, MA two down, et cetera. So when this position
is going to get exited. When it's going to
return exit long, it's going to return exit long, when the previous
position is long and depending depending
on the parameters, if we, for example, have exit on aA
one cross enabled, then when MA one down
is returning true, then it's going
to exit position. When we have exit on MA
two cross, is enabled. Then the position is
going to be exited when A two down is true. Let's take a look
which parameters for exit we have enabled. We have enabled only
exit on MA one cross, meaning that when MA one
crosses MA two below, then we're going to
exit the position. Now, and similar logic, but opposite, but reversed
for exiting short position. When neither of this
expression is true, then this switch will
return the position, the value from the position variable from
the previous bar. It's going to keep
it. Now let's insert the next block in our
trading strategy. And this is going
to be final block. In this block, we're
doing further calc, calculations in
our trading logic. We now we calculating
the signals. Long signals calculated
following way. O current position that we
calculated here is long, but either previous position is not long or
pyramiding is enabled. Pyramiding is enabled,
meaning that we want to keep adding to the current position
as long as position, which we calculated
above is long. We're going to keep adding
increasing long position whenever the calculated
position is long. When it's not long, it's
not going to be pyramiding. And the similar but
reversed logic for shorts. When it's going to exit
long signal is going to be true whenever
position is exit long, but previous position
is not exit long. When only exit long position, only when it becomes
an exit long position, then this variable will be true. In the next line, we calculate an expression to determine when we
close all positions. We close all positions when
position is Basically, when we have a long position, meaning position
size is positive, and when we have
exit long signal, or when we have short signal, whenever shorts are not allowed. This expression is true. When we have short position and short position
is not allowed, short positions are
not allowed when you have te type long, right? Or whenever you have
position size negative, meaning that you have
actually short position, and exit short signal or
basically long and not allowed, but you have a long
signal established. What this means is
that strategy can still generate the short signal, but you cannot trade short
signal, basically, No, it's giving you basically
exit short signal, short signals are allowed, but one strategy is giving
you the long signal, but long signals
are not allowed, so you simply just
exit the position. Now, in the next line, we calculate quantity quantity
of the position entry. Quantity is calculated
following way. If pyramiding is enabled, and pyramid order
amount is positive. It means that we are pyramiding,
pyramiding is enabled. All parameters are set. Then if current
position is non zero, meaning we do have a position, then then the quantity will be calculated by dividing
pyramiding amount. By close price. That way we calculate quantity
for pyramiding, but when pyramiding is disabled, we're simply going to divide all strategy equity
that we have by close price. That way, we calculate the quantity of the position to enter the new long position. Quantity is bigger than zero, then if we have a switch
depending on this signal, we're going to enter
long or short position. We're going to enter long
long whenever we have a long signal and longs
are allowed by trade type. Longs are allowed when
trade type is not short, and the similar ba reversed
logic for the short signal. In the final line and
this trading strategy, we whenever color bar when
bar position is enabled, we're going to color the bars green whenever position
is long and red, whenever position is short and yellow whenever
position is flat. I explained how this
str line by line, the logic of this strategy.
Now let's save it. So let's call it Multiple
aA pyramid strategy custom. Let's save the strategy. It's saved now let's
add to the chart. To the chart. Let's remove the simple moving average that
we don't need anymore now. Now we see that our
strategy is producing a profit and we have
over 200 traits. We have 660 6% profitable. We have very good profit
factor which is above five. We have relatively 23% drawdown. Let's review how our
str actually works. Let's take a look
at the parameters. We have pyramiding enabled, meaning that whenever strategy
is giving us long signal, we're going to keep,
we're going to keep adding to the positions
like over here. Strategy giving us long signals
and we keep pyramiding. We keep adding to the
existing position. Now, What we have over here, we have MA one enabled and
NMA two NMA two enabled. We also have entry on above
below moving average. Meaning whenever close is above is above the MA one
moving average. Let's for a second
disable pyramiding. Now we can see that we have
blue line, which is M one, we have the maroon line, which is MA two, and
we have MA three, which is a navy line. Here, we have a long signal. Why we have a long
signal over here? Because first of all, because the price is
above the MA one, we have this we have
this rule here, entry on above below MA. Second condition second
condition that we have is that MI one enabled meaning
MI one should be up. It should be bigger
than previous MA two. MA two previous position. We had a signal over here and
MA two previous is below. This condition is satisfied and so we have MA two
enabled as well. It means that MA
two moving average is bigger than MA
three previous bar, MA three previous bar. So we had a signal over
here and entered here. Over here, we see that MA previous bar is
actually below than here. So This is how we checked the logic over here
with these parameters. Now, whenever we
enable pyramiding, we can see that the
strategy keeps giving us long signals and we keep adding the amount that
is set over here, $380, and over here as well. So here we don't
have any signals, and there is no
pyramiding over here. As long as all
trading rules provide give us the long signal,
strategy starts pyramiding. In conclusion, we developed in this lesson
trading strategy with five moving average
indicators and several trading rules that
can be turned on or off. The strategy has configurable
pyramiding mode that allows to efficiently increase
position in trading mat. This is the end of the lesson and I will see you
in the next one.
25. Creating MACD Ultimate Strategy in Pine Script: Hello, and welcome
to this lesson, creating MacD ultimate
strategy in Pine Script. This lesson consists
of following section, Introduction of MacD
ultimate strategy. After that, I will
explain interpretation of trading signals for MacD
and ADX and DI indicators. After that, We are going to study MGD ultimate
strategy components, such as input parameters, custom functions, indicator calculations,
strategy trading logic, how to set up stop loss, and profit take trades, and also how to plot
trading signals. In the end, we are going to
review strategy parameters. So let's begin. So this trading strategy is using free
trading indicators. It's using Mac D
Trading Indicator, ADX NDI trading indicator, and moving average
trading indicator. Before we start applying these indicators into our
MD ultimate strategy. I will explain interpretation of trading signals of
these indicators and how we're going to apply those trading
signals in our strategy. This is, as you see
here, McD indicator. The McDe indicator is called the moving average convergence
divergence indicator. It is a popular and versatile
technical indicator used in financial markets. MacD is a trend following
momentum indicator that shows the relationship between
two moving average of the assets price. What is the interpretation? How it is used in trading,
the Made indicator. Mag indicator has a Magd line, which is a blue in our case, orange line, which is a
signal line, and histogram. Usual interpretation of this
indicator is as follows. Trading signals could be
read from this indicator. For example, when the Mg D
line crosses the signal line. Blue line crosses
above the signal line, which is orange line. Then it's considered a
bulsh signal, and opposite, whenever blue line Magd line crosses below the orange
line, the signal line. This is considered
as a bearish signal. Also the histogram, whenever
histogram becomes positive, above zero, it's a positive. When it becomes positive, when it becomes
green in our case, then it's considered
as a bullish signal. An opposite is true and
it becomes negative, red in our case, then this is considered
as a bearish signal. This is how trading signals
of MGD is used. For trading. Now, let's review the
ADX indicator that is also used in this Mac
D ultimate strategy. ADX is the average
directional index indicator. Is a technical indicator used in technical analysis to determine the strength of
prevailing trend. As you see, this indicator
has three lines of here. The red line is ADX line. It is indicating the
strength of the trend. It is indicating the strength of either bullish trend
or bearish trend. When it is rising, it means that the trend is
increasing is increasing. The strength of the
trend is increasing, regardless bullish
or bearish trend. Normally, it's there is some threshold that tread
is set for himself. When the AD X line is
above 20 or 25 or 30, it's considered the
trend is strong. And when it's less certain
threshold sale 20, the trend is considered weak. Also, there are two other
lines in this indicator, blue line is a di plus line, the di positive line, and the orange line is
di d negative line. When the I plus line is
above di minus line, the trend is considered
bush and opposite is true. When di minus line
above the I plus line, then the trend is
considered bearish. This is how We can use
this trading signal. And if you combine
this three lines, how to use them simultaneously. When ADX is above, let's say 20, and the DI plus is
above di minus, then this is considered as
a strong bullish trend. For example, in our case, if it's above 20 and
blue is above orange, it's somewhere over here. This is the beginning of the
bullish trend in our case. This is how we can use trading signals of the
ADX and Mac D indicators. In our trading strategy, we are going to combine
these two indicators trading signals and apply
them simultaneously, or selectively
depending on how we configure our parameters
of our strategy. Now Now what we're going to do, we're going to start creating the Magda ultimate strategy. I'm going to insert blocks
components of this strategy. I'm going to explain
how the strategy works. Let's insert the
first block of this. Made ultimate strategy. We inserted first block where strategy has set
input parameters. Let's study line by line, what this block does. First, we specify str function and parameters for the
str str title, lay files, meaning that str will be plotted on the paint
below the main chart. After that strategy
percent of equity, meaning that we are going to allocate certain percent of
equity of our strategy on each trade and next parameter is default quantity value
meaning 100% of equity. We are going to dedicate
on each trade precision, meaning that number of
digits after the point. With this precision,
we are going to display prices in labels, initial capital $1,000 and commission type and
commission value 0.1% on each trade will be
dedicated to commission, so we want our b testing of
the strategy to generate as realistic results,
including commissions. Our next input parameters. The strategy will have start date and end
date parameters. Each of those date
dates has day, mouth and year integer
values parameters. By setting up these parameters, we can allow our strategy to trade on certain
period of time. Next is a trade type. Trade type allows the
strategy to toggle between different transaction types
to be allowed to trade. It could be the strategy
could trade on long trades, only short trades or
both long and short. Next, we have three indicators in our strategy
that are going to generate signals for us and
we are going to combine these signals to generate
trades in our strategy. And to use these
three indicators, we need to specify certain parameters
for these indicators. For Mac D, we're going to need
MacD moving average type, signal moving average type, signal smoothing
moving average type and signal line type. First of all, each
moving average that is used by MacD is going to use optional is going to use one of the options that we set for
this moving average type. The type of the moving
averages that we use for our MGD is MA or linear
regression or weighted. So by default, Mac Dee is using MA for internal
moving average type. But we set optional for
this moving average type. It could use linear regression if we want to or
weighted moving average. The same applies
for Mac DMA type, signal MA type, and
signal smoothing MA type. And this last parameter and this block signal line
type signal line type, meaning that which signal is going to be used
in our trades. The Mag D can generate a several signal types that we're going to
use for the trades. It could be signal turn signal above or below signal smooth
cross Magd or histogram. For example, histogram, when
histogram signal is used, when histogram becomes
positive, it's a bullish. Negative is a bearish. But, we are going to review this options below in
our pine skept code. Next is the periods of our MGD. Fast slow signal length
and signal smoothing. All these periods are configurable via
strategy parameters, and we're going to use
these parameters to set up to configure
our MGD indicator. Next block of two parameters is for our trend moving
average parameter. We have Mac D, we have trend moving average, and we have AD X. To configure our
trend moving average, we have two parameters, moving average type, which be L, and regression a weighted A
and moving average period. Next, we next block, we specify parameters for
our ADX NDI indicator. That indicator takes
following parameters. ADX period, threshold,
trend enable or disabled, smoothing MA type, and
ADX smooth MA period. All these are used to configure
the ADX DA indicator. Next, we have two entry
rules parameters. Entry on trend, so we can toggle on and
off if you want to enter the trade in our strategy whenever trend is either
bullish or bearish. Or we can just toggle off this this indicator
and not use it in our combined trading
signal in our strategy. Next primer is entry on Mac
De above or below signal. This is another togal
that we can turn on or off if we
want our entry to be whenever McD is above or below signal line of
our Magd indicator. Next is exit rule parameters, is we can toggle this on or off. This is when we want
to exit the strategy, when signal line is crossing. When McDe is crossing
the signal line. In this case, when we're
going to exit our strategy, we're going to generate
and exit trade. Or we can toggle on or off
this strategy parameter. Next, We're going to set
up the take profit and stop loss for our strategy, and to do that, we have
these two parameters that specify stop loss percent
and take profit percent. Next, one trade per direction, we can set our strategy
only to take one trade per direction because
what could happen is that the strategy can
generate trading signal. For example, bullish
trading signal, and after that, another
and another and another. If you want to take only
one trade pure direction. We can set this
parameter to true. Next set of parameters is
the parameters related to plotting the certain
indicators on our chart. We can toggle them on or off depending what we
want to see on our chart. If we want to show Mac Deal line or show a signal
line or do not show them, we can toggle this
parameters on or off. Also also we can toggle
this parameter to color bar per position. For example, if we
have a long position, so then bars will be
colored by certain colors, and we can turn off this
parameter if we don't need it. Now let's insert
this second block in our str custom functions. Custom functions are
functions that we are going to use many times
in our strategy. Therefore, those
functions are very useful because it's going to shorten our Pine script code and
make it more efficient. Cross function is function
What it does is it it checks if SS one is
crossing above SSB, and opposite check
is done in cross. Down function, SS one
is crossing below SSB. Sus those are two variables that are used in this function. The type of those
variables is serious. Is time enabled function. We use this function in order to check if strategy
is allowed to trade, it checks the time start time that that we
calculating over here, we're using input parameters
that set for strategy, start date and end date. This function is using
those parameters in order to signal the strategy if
it is allowed to trade. True on end bar. So this function is
important to trade when you trade on the
real time bar because you want to make sure that
the bar is completed, bar state is conferred, meaning the bar is done. Last tick on the
bar is executed. To be able to trade only one
time on the real time bars. Draw label is drawing
labels and get MA source. This function is used
many times when we want to return certain type
of moving average. It could be A, weighted
MA, or linear regression. Now let's insert next block, which will be block of
indicators calculations. In this block, we are going to calculate our indicators using
the strategy parameters. First indicator is ADX and DI. This indicator, we calculate
using certain functions, and we calc range, we calculate Di plus di minus
for this indicator. After that, we calculate
smooth di plus, smooth di minus, and finally, we calculate di plus
di minus itself for a dx and dx and Adx itself. We calculate all this value. Why? We calculated them because we finally we're
going to calculate if this indicator is providing bullish or
bearish signal for us. We do it over here. After we calculated
the dx smooth, we calculate here
A dx bull trend, and we calculate Adx bull trend if di plus is bigger
than di minus, and Adx smooth is bigger than a dx smooth on
previous bars, so it's rising. A ADX smooth is above threshold, meaning strong bullish trend. In that case, a Dx bu
trend variable will be true and the
opposite opposite way, we calculate a Dx bear
trend using opposite logic. After that we calculating weakening trend and flood trend. Next, we calculate the
McDe So to calculate McDe we need to calculate
fast moving average for McDe and slow moving
average for McDe. We're using t MA source function for that and we're passing in moving average type and
fast length and slow length. Next, we calculate
the McDe McDe line, signal line histogram,
and signal smoothing. After that, we
calculate if histogram is abo and going up or
below zero and going down. We're going to need
that to change colors of McDe ultimate. Indicator. After that, we
calculate certain variables to indicate if McDe is actually rising or falling and signal, if rising or falling,
we're going to use that, we're going to use this to check if MacD indicator
is bullish or bearish. After that, we
calculate colors of McD of MacD and signal
lines, and after that, we plot all all the graphs
of our MacD indicator, such as Magd line, signal line, smoothing line and
histogram histogram, and also zero line. Also, we calculate
trend moving average, because this is the
third indicator that we use in our strategy, and after that, we
calculated two variables, if trend moving
average is up or down. This way, we just
covered the block of calculation over three
indicators in our strategy, ADX, Mc D and trend
moving average. Now let's insert the next block of our Magda ultimate strategy, which is going to be a
block with trading logic. Let's study this block. This is where we use and apply all the trading signals of
these trading indicators, ADX, MGD and trend
moving average, and we using all the signals, we combine them and generate the trading signals
for our strategy. In this switch, we check the
signal line type parameter, and depending on that, we can we can use
different trading logic. We generate and calculate long entry and short entry in
which scope of this switch, but depending on the
signal line type, we calculate it differently. In our current setup, we use the signal
above below setting. For this setting, we
calculate long entry whenever Signal line is trending up, current signal is bigger
than previous signal, and optionally, when Magd is above Magdne
is above signal line, whenever this flag entry
on Magd above below signal is enabled and
opposite for short entry. But for example,
for other cases, when we use this signal line
type with different option, For example, when it is
equal to signal turn. In that case, we calculate long, long entry will be true. Whenever signal is trending up, but previously it
was trending down. Basically signal is turning. This gives us variety of a trading signal depending
on the configuration. Next, In this block, we calculate the position
of our trading strategy. We set some defaults
of this position and default for the variables that are used for this
position calculation. Our position could be flat, long short or long
or exit short. So this position it could
be considered like position and position that is remembered and until
position is changed. Basically, let's review how
this position is calculated, position of our strategy. We are using switch over here. And the position will be long whenever
this block is true. But this block is true, when first of all, time is enabled meaning, time for the trades is
allowed for the strategy. And the previous position is not long and long entry is true, long entry we calculated
in this block. Long entry is true, and then we use we
check several flags, several togals of our strategy, and depending on that, depending on that, we apply
add additional logic. For example, if one
trade p direction, is set, then we need
to use this rule. Otherwise, this block
is not going to use it. Whenever it's set to true, then previous position should
not be exit long position. This is how we enforce
one t p direction. For example, another rule, if we want to use the rule
entry on moving average trend, then trend up should be true. But let's see where we
calculate trend MA up. W calculated over here. Meaning that trend
MA is trending up because trend the M
is bigger than trend them on previous bar. And the same logic for AD X. Whenever you want to add additional condition
from AD X indicator, then ADX bul trend
needs to be true. Only whenever this entire
expression is true, switch is going to
return long position. For short position,
opposite logic is used. Another two returns from this switch will be exit long position or
exit short position. There is a logic
used whenever we want our strategy to exit long. For example, when we
wanted to exit long, we want previous position of the strategy to be long. Only On the previous position
whenever it's long, then we can just
using certain logic, then it's possible for the next position of the
strategy to be exit long. We're going to exit
whenever strategy is generates the short entry signal that we calculated previously. And or when we have
this distgal is on, and we have a dicdition
cross cross down. This this signal is
going to be true whenever McDe is crossing
down the signal line. And this condition
is going to be checked only whenever exit on Mac D signal
line cross is true. And finally, finally, there is basically another
condition over here. I This condition is true. This condition meaning
that if p is long, if previous if position on
the previous bar is long, or short, then keep it, then assigned to the current
position previous position, meaning keep it, otherwise, position will be flawed. This is how this position of
the strategy is calculated. Now let's assert the main
trading logic block. In this block, we calculate trading signals
that are going to be executed by our strategy in order to calculate
final trading signals, we need to calculate the
intermediate trading signals because current position of the strategy that we
calculated over here. When, for example,
position becomes, it stays long in this variable. But for the signals, we need exact bar whenever that position becomes
long or short, or it generates exit long
or exit short signal. Therefore, what we do here is we calculate set of variables. For long, short, exit
long, and exit short, we calculate when
exactly that bar, when the position becomes long, short, or exit long,
or exit short. How we do that, we calculated
by whenever position is currently long and previous
position was not long, the same logic for
all other signals. This way, this variable
are going to be true, only on the bar, whenever the position
changes to long, short, exit long or exit short. Next. After that, What we do here is that we calculate
the actual signals. By using those signals, we are going to actually call and generate
the strategy trades. For long signal, for example, we going to set it to true
whenever long position is true and trading type is
set to allow long trades. Trade type could be long, short, or long and short. As long as trade type is not short and long position is true, long signal will be generated. What it means that trade
type is not short, meaning that trade type is
long or long and short, meaning long is allowed. Same logic applied, but
opposite to short signal, and for exit long signal, for example, we are
going to generate final exit long signal whenever position
size of the strategy. This is built in parameter
is actually positive, meaning the strategy
actually is long, its position is positive, and Exit long position is true, which we calculated over here. Or Short position signal is true and trade type is long. This condition, we
need to apply because whenever we have a short
position generated. However, shorts are not allowed because
trade type is long, then we're going to exit it, not entering short
position because shorts are not
allowed, but exiting. Long position and the
Simral similar logic in exit short signal. We got this signal
signals assigned. Then we have a switch
over here switch operator that depending on the signal is going to execute strategy, either closed long, close short, or strategy entry long
and short signals. Here how we actually enter trades in our strategy
using calculated signals. Now let's insert
the final block in this strategy block that is calculating the stop loss, prices, take profit, prices, and actually setting
up trades for this stop loss and
take profit. Trade. How is done.
Basically, in order to have in our str,
stop loss, rate. We need to calculate
the stop loss price. In order to calculate
stop loss price, we need to basically,
first of all, check if stop loss percent is actually set
because if it's zero, it means it's disabled. If it's set, if it's no zero, then we calculate if average price is actually
bigger than zero, meaning that we actually
have a position. Then we we calculate the
stop loss price below below, obviously the average
price for our position. This is average price
for our position, and we use the stop loss percent to calculate the price below the average price for this percent specified in
calculated stop loss percent. For take profit, we
use similar logic. We check if we have
actual position if average price is bigger
than zero, and after that, using the average
price price and take and take profit percent that we calculated over here, we cal take profit
price that is above the current average price for this take profit percent
that we calculated. We calculated these two prices, and we set up the exit trade using
strategy dot exit function, where we specified
stop loss price assigned to the stop
parameter and take profit price
assigned to limit to the limit parameter for
this strategy dot exit. Function. And we're going
to call this function whenever we have set this take profit price and stop loss price when
they are not available, then what's going to
happen is that we set these prices and whenever price of our market hits
the stop loss price, which is below the current below the average price of the
position that we have, then the stop loss
trade will be executed. Or whenever it hit the
take profit price level, then the basically sell limit
for that strategy will be executed and position
will be closed if this current position
is long. Final, Final blocks in our
strategy is where we plot actually the
arrows on the strategy, indicating whenever we enter the long trade or
exit the long trade, or enter the short trade, or exit the short trade. So basically, we use
different colors. For the long signal, we use the lime color and
for the exit long signal, we use the Fuj CA color. Now let's save our strategy
and apply it to the chart. We're saving our strategy. Then let's call it custom, and let's save it. Our strategy is saved. After that, let's
add it to the chart. Now, let's review the
parameters of our strategy and make sure that our strategy
works as expected. Let's take a look
at the parameters. First of all, we want
to make sure that signal line type that we
selected is signal above below. For this type of
signal type is that traits are taken when the signal line is rising and also depending on
this parameter entry on Magda above and below. If it's checked, an additional
condition is added, and when the Mag D is above the signal
line, let's take a look. In our chart. For such cases. You see our beautiful
Mg De is plotted on this spine as you see that
it's colored certain way, so we can see that whenever
the slope is changing. For example, this line
is the Mg De line, it's a faster line. This line is the signal line, it's a slower line. These bars are histograms. Whenever the slope is changing, the color is changing as
well for these two lines. Whenever slope is rising
for the Mg De is green, when it stops falling, it's red. For the signal line, when the signal line is rising, the color is steel. Whenever it starts falling, the color is orange and the same logic for
the histograms. When they are rising, the one
color when they're falling, we use different
colors and the same whenever the histograms
are below zero, they have color reddish
color, so called. Now, let's take a
look at the signals. As you see here, we plotted two types of
arrow arrows here. Lime colored arrow and the
Fucans Fuchs colored arrows. The lime color the
arrows indicate whenever our strategy gives
us the long entry signal. For the foots colored
arrow, when it's down, it means that the strategy is signaling for the
exit of the position. Now, also we need to make sure that to verify what other
signals are set right now. Currently, we have set
entry on MA trend. Currently for MA trend, we use linear
regression and 100. I added here one of my indicator super MA that has this
type of moving average, linear regression configured,
and so we can see the actual indicator on
the chart that we are using in our advanced
MG ultimate strategy. You see here linear
regression 100. So whenever slope of this
linear regression is up, the color is green, whenever
it's down, the color is red. Because we have
that trend that may enabled for our MGD strategy. Therefore, the traits is going to be taken
whenever slope is up. For example, let's take
a look at this example. What we see over here. The The signal line with the teal color started
rising over here, and the magdee is
above the signal. You see this green magdee
is above the teal signal. Then we have a signal over here, and as well as because the
trend theme is rising. Let's another example. Here we see the trend them
is falling. It's red. Therefore, even the signal line is rising and the Mg D is above. There is no trades taken. There is no traits taken in the Mag De strategy because
trend them is falling. Now let's take a look at
some other parameters in our Mag De strategy. We have here ADX trend
is so far disabled. Currently strategy have
ADX conditions disabled. But when we add ADX conditions, the strategy will
behave differently. The signals that it's going to be generated going
to be different because it it needs to check the
condition of ADX as well. As well, along with other conditions trend and conditions from
the Mg indicators. T's take alkyd behaves. We need to take a look at
the stre strategy tester. We can see right now
what we have here. No strategy tester. We have here 87 traits and
5 million hundred percent. Let's take a look what's
going to change if we add additional condition to our
strategy with AD signals. You see the strategy
performance changed. We have less traits. We have 87, now we
have less trades, and we have less profit. Also we have less drawdown, drawdown is basically
is calculated when it's greatest
lost comparing to your greatest possible profit. Now, the this drawdown
the better, as you see, whenever we disable ADX, draw drawdown is basically increasing, which
is not very good. Whenever we enable drawdown
is decreasing, which is good. However, the profit is
decreasing as well, but number of trades
is less as well. Profit factor is
increasing, which is good. Profit factor is calculated by dividing the total profit
from strategy by total loss. This is just illustration when about flexibility
of this strategy. You when using this
strategy can enable disabling certain nested
indicators within this strategy to optimize
the performance of your strategy on the
selected market. In conclusion, in this lesson, I demonstrated how to develop advanced trading strategy
with three indicators, Mac D, ADX, NDI,
and moving average. We've learned how to
combine signals from several indicators
and use them to generate trades in a strategy. The developed strategy can be applied to different
trading markets. Via adjusting variety of
strategy parameters and selective application of
the strategy indicators. This is the end of this lesson, and I will see you
in the next one
26. Overview of Alerts in Indicators and Strategies in Pine Script: Colon, welcome to this lesson. I review of alerts in indicators and strategies
in Pine Scree. This lesson consists
of following sections. In the first section,
I will introduce you to Allerts in trading view, Pine scri In the
next three sections. I will overview
different type of aerts, Alert using alert function, alert using alert
condition function, and alerts in strategies
on order event. Last section in this
lesson is dedicated to Allerte summary. Let's begin. Trading view alerts
operate 247 on servers, independent if user
is locked or not. Users can create and configure alerts through
the charts user interface, using create Alert dialog form. There are various
type of alerts, including generic drawing
and script alerts that are called from script
and configured like any alert in create
Alert dialog form. Script alerts triggered
by allert function or alert condition alert require specific pine script
code in the script. For better understanding
different allert types and how to configure
and use them. Let's look at the table
on this slide that describes three types of aerts in indicators
and strategies. You see in this table, there
are three types of allerts, and their properties
can be visible. First type of alert is
using aert function. It's called Allert
function from script. For this alert, for
this type of alert, we must use alert function
call from a script. This is an example
of of at function. Alert after that, we
specify the alert message, and the next parameter
is alert frequency. This example, we can see that we specified alert function call. We specified last bar is up, which is alert message, and the second parameter is ert dot frequency 1/bar close. This is alert frequency. It also can have settings like for all frequency could
be also all or 1/bar. This allert type using
allert function and also all other alert types. They require they require a configuration that can
be that can be entered, that can be configured using
create alert dialogue form. It's not sufficient only to have an alert function
call in the script. You also need to create alert configuration using
create alert dialog form. All of the three alerts require any configuration that
will be associated with the alert call
from the script, or like in case of a strategy
with the script itself. Also need to mention that alert the alert type that is using alert function call can be used in indicators and
in the strategies. Next type of alert
using alert condition. Here we have for
this type of allert, we must specify in the
script alert condition call. Alert condition function
has three parameters. First we specify condition after that condition when this
condition will be triggered. Then we specify allert title, and after that, alert message. Here is an example of
alert condition call. First, we specify the condition if close bigger than open. Only when this
condition is true, alert will be triggered. Second parameter
is in this case, alert on green bar. This is the alert title, and the last is
the alert message. Green bar eclamation mark
is an alert message. So you specify this
call in the script, and after that, you create Alert configuration using
create alert dialog form, and then you can use this
allert in the indicator. In the strategies, Alert condition is not and
is not supposed to be used. The final ert type in this table is a strategy
order event alert type. But this aller type, as you see in this table, can be used only in strategies. For this aller type
to get triggered, there is no function
needed to be used in the strategy script. And also this function
certainly requires the configuration using
rate alert dialog form, and the dialert will be
triggered by a strategy whenever position changes in
the strategy and order in the strategy is filled. We reviewed all
three allert types, alert alert function, alert using alert
condition function, and strategy order
fill event alert. There are important
considerations about using the alerts
that I need to mention. First, alert related
Pine script code doesn't directly create
and executes an alert. It just creates an alert event. The alert configuration
created alert dialogue form can be set up to use those alert events
from the script in order alert to be
executed and actually shown. Second point is Allerts
trigger in real time bars, limiting Pine script
code functionality to real time scenarios only. In other words, Allerts will be executed only on real time bars. They will not be executed
in historical bars. Finally, when creating an
create Au dialog form. This is the example of create
Allur dialog form that can be accessed when you click in the superchart screen
on this clock button, and then associate
any alerts that you configured in the script
or the strategy itself. Associate those strategy on or any other script that
is using alluts with this specific alert
configuration that is created using At
create dialogue form. When creating an alert, using create alert dialog form, trading view saves a snapshot of the inputs symbol and time
frame on its servers, subsequent changes in the chart, and in the related scripts, don't impact existing
running alerts. You must delete and create alerts for changes
to take effect. In other words, is that
once you create an alert, when once it's saved, you can change the script
associated with an allert, you can change the current
chart on a super chart screen. It does not affect the
alert that you created. Now, let's review an example of allert configuration
using alert function. In this example, you can
see that we have a script. Could be a strategy or
indicator because you can use alert function in a
strategy or an indicator. In this script, you have
two alert function calls, whenever close bigger than open, you last bar is up alert that is going to be
called once per bar close, whenever close is
less than open, we're going to
have another alert triggered with the message. Last bar is down and
frequency once per bar close. We created these
two alert calls. But in order alert
to be executed, we must create
alert configuration create alert dialog form. Then we associate
this configuration with the alerts in the script. One more thing I need to mention whenever you have a
script in order to associate with the
allert configuration, you should add this
script to the chart. Next, what you do is you set condition for the
allt you select the script by script name in
this condition. Combo box. After that, you select
basically the sub condition. In this case, you can select you should select for this
case alert function calls. Because in the strategy, you could have different
type of alerts. In our case, we have
we want to associate alert function to this
alert configuration. Therefore, we select
Aalert function call. Then we set up expiration date for our alert configuration, and we set up aert name. Once we click create,
alert configuration will be set and active. And then whenever
script and then whenever whenever
this script triggers, the allert, you will
get ert notification. Now let's review how to set up notifications for alert
using aert Function. As you see here, we have two tabs settings and
notifications in order to set up type of notification
that you want to get. You will click on
notification step, and you will get
this parameters. As you see in this step, you can set up different
type of notifications or any combination of
those notification. First is notific I by
notific notify in app, meaning that you can download trading view mobile
app on your mobile device, and whenever this
in app is enabled, you will get in your mobile
app notification message. Whenever this alert is executed. Second, show pop up, meaning that on trading
view platform website, whenever this Alert is executed, you will get a message with the notification
from the alert, third parameter send e mail. You will get an
email if you have this parameter send e mail enabled whenever
allert is executed. Webhook RL, it means that
whenever allert is executed, a certain URL will be called. And this is used usually
whenever you need to call a certain URL that will that is associated with
your brokerage account, whenever you have linked whenever you need
to link this alert to your brokerage
account to execute trade on your account
associated with this alert. Now next parameter
is the play sound. You can select type of sound when this alert
will be executed. Also you can configure the
to be notified by SMS, whenever send e mail to SMS. Parameter is enabled. This is how you set up
notifications for Allert. Now, let's review
another type of allt allert using allert
condition function. In this example,
in this indicator, we have set up two
alert condition codes. For example, the first
alert condition call, we have a condition whenever
closes bigger than open, then we have a title alert on green bar and the message
green bar escalation mark. Another alert condition
whenever close less than open, then we have a title of that
alert alert on red bar, and the message is red
bar escalation mark. We have two alert conditions
call from our indicator. As a next step, in order to execute this allert to
be ever executed with set tap alert configuration using create At dialogue form. In this form, we
select our indicator. Name alert condition example, then we we select the
specific alert condition. We have two alert conditions and we can select
only one of them. If you want to set configuration for
another alert condition, you will need to set up
another alert configuration. In other words, is that
for each alert condition, call in your script, you need to set up separate
Alert configuration using create alert dialog four. Next parameter is a trigger, you can specify on only once. Whenever you want this
allert to be triggered whenever the alert is triggered. Do you specify when you want alert to be actually executed? Only once 1/bar, 1/bar
close or once per minute. How it works, whenever alert
condition is triggered, and then this
condition is checked. The alert will be executed
only once, only 1/bar close, et c. Next parameter
as expiration, you specify when you want
this alert to be expired. After that, you set alert
name and alert message. On this slide, you can
see the alert example. As you see in this
alert message, this is what we
actually going to get. This is notification
that we get on the trading view
platform website on this type of alert is executed. So you get aert on on
the type of chart allt on D. That way you know which market this
allert is triggered on. Then we get green bar alert. This is our alert
name, and after that, we get the alert message, green bar, and we
get alert time. This is an example how you set up alert using alert
condition function. Finally, let's
review how to set up alert for order fill
event in the strategy. Here, we have the str a simple strategy that is
created and added to the chart. After that, we click on this clock with the
plus alert button in order to add the config ert configuration
to this strategy. When we do that, we get
this alert configuration. Form. Then we must
select the script. In that case, strategy script. Strategy strategy all
on order feel event, Yes, can be only created
for the strategies. Therefore, we select
the strategy in this condition. Combo box. After that, we set
the expiration date for our all we specify ert
name for the next parameter, and we specify alert message. This allert message can
use certain variables that are located inside of the
double curly brackets. You can use the strategy
parameters like order action, number of contracts,
position, size. Also you can you can specify the close price time and
some other parameters, and these parameters will
be converted into the text whenever this alert is
executed and shown. And the strategy alert
will be triggered. In the strategy, whenever
order fill event happens, order fill event happens, whenever strategy
position changes. For example, strategy buys, some contracts or stocks or sell some contracts or stops or close all the positions,
positions changes, strategy triggers an event, and whenever you have associated with the strategy
alert configuration, the allert will be executed
and you will get notified. Summarizing this lesson,
we have overviewed how to set up and use alerts with alert and alert
condition functions, and on order fiel event
in Pine script strategy. Also, we learned that alerts run on server regardless
user is logged or not, and regardless if user do any code or chart modifications after alert configured
and started. Finally, we have studied how to set up alert notifications. This is the end of this lesson, and I will see you
in the next one.
27. How to setup and use alerts with alert () function: Hello, welcome to this lesson, how to set up and use alerts
with Allert function. This lesson consists
of following sections. In the first section, I
will introduce you to Alerts using Allert function. Next two sections
a practice study, how to update Pine script and add Allert function calls
in that Pine script. In the next section, I'm
going to demonstrate how to configure alert with
create Alert dialogue. And associate that
Allert configuration with allerts from
the pine script. In the last section,
I will summarize how to use alert with
allert function. So let's begin. Let's use this simple indicator
to demonstrate how to use alerts with allert function. This indicator plots
different types of column, as you see on this chart, depending on the whether
bar is up, down or flat. Whenever markets bar is down, it plots red column, whenever markets bar is up, it plots green column, whenever market is flat, it plots column with gray color. As you see in this indicator, we have this switch function
that returns bar direction. Whenever barres up,
it returns one, whenever bares down
is returns minus one. Otherwise, when market is
slide it returns zero, and depending on
the bar direction, it plots a column
with different color. Let's say we want to
create aut for each bar, each bar with different
color in this indicator, and saying in that allert, whether bar is up, down or flat. So it's convenient to put this allert under
different conditions within this switch function. We know that whenever bar
is up, it returns one. Therefore, it's beneficial
for us to create allert call under this
condition. Let's do that. Let's let's Allert aut function, Let's set up a message here. Massage will be last bar is up. Massage last bar is up. After that, we need to
specify the frequency. As you see, we can frequency whenever this will be triggered. Frequency could be all would be 1/bar or could be 1/bar close. Let's use 1/bar close.
Let's copy this. And insert this
parameter setting here. Now this allert is
going to be triggered whenever close is
bigger than open. Let's trigger different
alert whenever bar is down. Here, whenever close
is zero than open, we want to be notified
with the message. L at bar is down. With the same frequency
once the bar calls. Final alert call
last bar is flat. Whenever bar is neither up
or down, then it's flat. We specified in the code several allert calls
using alert function. Let's save this script. Now we need to specify corresponding allt
configuration associated with this script and
with this all calls, in order those aerts to
be actually executed. In order to add
alert configuration, To this script and
to this alert calls. We need to add alert
configuration. We need to make sure
that first of all, this script is added to the
chart. It is added now. After that, to add alert, you can click on
this alert button. This is one way to do it. Another way is you can click
on this alerts button, and then click on
this plus button to add alert configuration
associated with this script. And with this alert call. Next, let's set up condition. We click on this combo
box and we need to select the name of our script. Lesson alerts bar up and down. This is the name of our script. We need to select it. After that, we need to select another item under
the next condition. We need to select any
allert function call, meaning that any alert
calls from our script will be associated with
this alert configuration. Next, we can set up whenever we want this alert to be expired. Next, after the final parameter here on this setting step, we can set up alert name. Let's call it alert
bar up and down. Let's click Create. After weekly create,
we expect alert to be added to this allts list. On this alerts tab. As you see, alert is active, meaning that it will generate alert whenever certain
conditions is met. Next, we can just configure. We can change the alert
if we need to change it, or we can change the way we want this alert to be notified. We're not going to change anything at the moment
because we don't need to, but we need to make sure that
notify app and for example, show pop up is on, this one show pop up is on, you will get notification. On the trading view platform, whenever alert is executed. This alert is currently active and we expect
this alert to be triggered whenever certain
condition here is met. We need to wait until
the bar gets and we expect corresponding message to be shown on this screen. So we currently see that
this is 1 minute bar and whenever bar gets closed, then this one of this alert
can be triggered because we specified 1/bar close
frequency on each allert. We can see that alert
just got triggered. On this alert message, we got alert and the
name of the pair, name of the market that
we have this allert. Associated with a
theorem USD market. We get here the name
of the alltert, d bar up and down. This is the name of the allert. The next line is
the alert message. Last bar is down. The time whenever this
alert was triggered. Last bar was read. Last bar was actually
down so Aert is correct. I demonstrated how to set up alert calls from the script
and how to configure allert. And associate that alert with the alert functions
call from the script. Summarizing this
lesson, we have studied how to create an alert
with alert function, and how to configure
this type of alert with create
alert dialogue form. I demonstrated how
this alert gets executed and user gets
pop up notification. Using alert function can
be very beneficial when certain trading or market events under certain conditions happen, and user want to be
notified about that, utilizing a variety of
notification types. This is the end of this lesson and I will see you
in the next one.
28. How to setup and use alerts with alertcondition() function: Hello and welcome
to this lesson, how to set up and use alerts with alert
condition function. This lesson consists
of following sections. In the first section, I
will introduce you to alerts using alert
condition function. In the next section, I will
demonstrate how to create alert condition function
calls in Pine script. In the next section,
we are going to study how to configure alert with create alert dialog for alert condition functions. In the last section,
we're going to summarize what we
have learned in this lesson about using alert with alert
condition function. Let's begin. Let's use this
simple bar rap down indicator to test how alert
condition function works and how we can create alerts using alert
condition functions. This simple indicator plots
different type of columns. For the green bar,
it plots green, for the red bar it plots red, and for the flat bar, it plots gray colored column. Let's say we want for each
type of this plotted column, our indicator to trigger alert with
corresponding message. One important thing
to remember is that alert condition function
cannot be used in local scope. It can be only used
in global scope. Meaning that, for example, if we want to put alert condition function in
the local scope over here, it will not work and
it will generate an error for us.
It won't compile. Therefore, we need
to use global scope. We'll create alert condition function calls in
the global scope. So alert condition after that, let's specify each parameter. First condition is
that we have already assigned corresponding values to the bar direction variable. Therefore, we don't
need to check each of this condition
within the switch again. It's sufficient for us
to check the value of this variable in order to
determine if bar is up down. If bar direction is one, meaning the bar is green. The title will be
alert on green bar. This is the title and the message message
will be green bar. This way, we have set up
a call from our script. With certain condition,
title, and the message. Now let's set up two other
alert condition calls for two other remaining conditions for the red bar and
for the flood bar. For the red bar, we have condition if bar direction
equals to minus one, So Let's correct the message, the message and the title of
this alert condition call. For the flood bar direction, is equal to zero. Therefore, alert on flood bar is the name or title of
our alert condition, and the message
will be flood bar. We have created
three alert calls, three alert condition calls
for each type of bar. This indicator is
plotting for the red, green, and flood
bars. Let's save it. Now, now we want to create associated alert configuration using create alert dialogue. We can press this
bottom to create associated configuration for
our alert condition calls. Next step will be to
select the script name. In our case, it's a lesson
alerts bar up or down. After that, we can
see that we have here three alert
condition titles. It means that for each alert condition
call from our script, we need to create separate
Alert configuration. Let's start creating from the
first alert on flood bar. Then let's fill up
the alert name. Flood alert and trigger
once your bar closed, but you can choose whatever
you need in your script. You can choose other
triggers if you need to. We create Now we expect this new configuration to be created and
need to be active. Now, we can stop it if we don't want it
to run temporarily, or we can click on
restart if you want the alert to be active
again to be restarted. Now, let's create two
other alert configurations for two other alert
condition calls. Another way to create associated alert
configuration is to press on this alert button. Now we select our script name, and now we select the second allert condition
alert on green bar. Let's set the name of this alert and set the
trigger once your bar. It's going to be
active, but we want to pose and test it later. Once we completed setting up all the allert conditions
from our script. Let's create the last
alert configuration for the red bar. Once per bar clo trigger and the red bar name will be red bar ert I. Now let's start all of them. We click on restart and
we click on restart. Now we expect whenever either
of these condition is true, then and bar gets closed, we expect to see
corresponding alert message. Bar is forming. Bar is not closed yet. We expect whenever
current bar gets closed, then either of these
conditions will be true and that will
trigger the alert. Because we have all these
three alert configurations are configured and
they correspond to each alert condition
call from our script. You can see that we have alert triggered here with the
following information. Alert on and trading
in our case, I D. Next, in the next line, you can see the green bar alert, which is the name of the alert. The name of the configured
Allert green bar is the alert message, and after that, we
can see the time when alert got triggered. This is the demonstration, how to set up alert condition
calls from the indicator, and demonstration how to
configure how to configure each alert condition call corresponding configuration
using, create alert dialogue. We can pause all the alerts now because we don't
need them at the moment. Summarizing this lesson, we have studied how to
create an alert with alert condition function and how to configure this
type of alert with create alert dialogue for It's important to remember that alert condition function
works only in indicator. It does not work in strategies. For each alert condition
call indicator, you must configure separate
allert configuration with create alert dialogue form. I demonstrated how
this alert gets executed and user gets
pop up notification. Using alert condition function
can be very beneficial when certain trading or market events and under
certain conditions happen, and Also user wants to configure separate alert configuration for each alert condition
function call. After such alert
setup is completed, user will get notified
when alert is triggered by a variety of configured
notifications of different types. This is the end of this lesson, and I will see you
in the next one.
29. How to setup and use alerts in strategies on order fill event: Hello, welcome to this lesson, how to set up and use allerts in strategies
on Order fill event. This lesson consists
of following sections. First, I will introduce you to strategy alerts on
Order fill event, then we'll study how to configure strategy allerts
on Order fill event. After that, I will
summarize the lesson of using strategy
alerts. Let's begin. L et's use this simple strategy to demonstrate how to
use strategy allert. This strategies bar up down
and it generates long signal on each green bar and generates cell short
signal on each red bar. Whenever bar color changes, then strategy closes
all the closes the position and establishes the position of one contract. As you see here, bar
direction equals one, meaning close bigger than open, meaning bar is green, then it generates long signal, and it generates short signal, whenever bar direction
is minus one, meaning close less than open. And in that case, it generates cell short signal. Whenever you create
strategy alerts, there is no need to do any specific f function call from a strategy
related to the alert. You use strategy as is, and the idea is that whenever
strategy position changes, order fi event happens, and created alert will
capture that event and we execute the strategy alert. Let's see how we do that. This strategy generates
trade on each bar. Therefore, it's easy to
demonstrate how to use strategy alert using
this bar down strategy. To create strategy alert related associated
to the strategy. Let's go to the Allert step and click on create
Alert button. After that, we set in condition. Parameter, we select
our strategy, less alert strategy bar up down. After that, let's
create the alert name, Let's call it strategy
bar down lot. After that, we can see
that strategy alert pre created already
a message for us. We can leave message
as this or we can update it if we need to. As you see, this message
is using parameters, certain variables that
are going to be converted to text whenever this message is generated for the str alert. Our strategy alert
message will contain such parameter
values values from parameters such as
order action number of contracts position
size, and ticker. This is how you set up
your ert for the strategy. Let's click on Create. Now we expect it to appear over he and strategy alert is active. Now whenever bar closes, we expect to get
corresponding strategy alert. So let's see how this is
going to work for us. What we expect to get here if this bar is going to
get closed green. Then we expect one
more contract to be added to this position. Previous position was sh and the new position
will be long. We need to wait until
this bar gets closed. Bar got closed,
what we have here, new strategy position is one as we expect.
How it happened. It happened by having by executing order
by two contracts. Y two contracts, because we had previous position was short, previous bar was read. Previous position was minus one, and in order to get
final position, one, we had to buy two contracts
minus one plus two, and we get final position one. Currently, our strategy
is long by one contract. Let's stop this alert Now, this way, I demonstrated how
to set up strategy alert. Summarizing this lesson, we
have studied how to create an alert in a strategy
on order fill event, and how to configure
this type of alert with create
alert dialogue form. I demonstrated how this
alert gets executed, and user gets pop up
message notification. Strategy alerts have simple
setup as they do not require any specific function
call from the script. After such alert setup is completed with create
Aer dialogue form. User will get notified when strategy position changes
on order fill event and will get notified
by a variety of configured notifications
of different types. This is the end of the lesson, and I will see you
in the next one.
30. Summary of Key Takeaways from this Course: Hello. Welcome to this lesson. Summary of key takeaways
from this course. Let's cover main topics
covered in this course. Main topics that we have
studied in this course. In the first chapter
of this course, I overviewed these course
objectives and the key topics. In the next chapter, we studied programming
essentials of trading ew Pine Script. Specifically, I
introduced you to the Pine script editor
and its features. After that, we studied step by step guide on creating
the first Pine script, then we covered
fundamental understanding of indicators and strategies, then we explore Pine script execution mode
and time series essentials. After that, we covered
basic Pinscript structures, including identifiers, operators,
and ribal declarations. Then we learned in depth exploration of
conditional structures, loops, and type system. After that, we cover a comprehensive understanding
of pine script types, qualifiers, and the
significance of the NA value. Then we master the
usage of tuples and the creation of user
defined functions. After that, we've
started to study how to develop indicators and specifically how to create advanced moving average
ADX DMI indicator. Then we started to study
how to create Back test, forward test, and optimize
trading strategy. And particularly development of trading strategy using
moving averages. Then we overviewed the Pine
script strategy tester tool, and after that, I
provided you with detailed guide on back testing and forward testing strategies. Then we studied techniques for optimizing
trading strategies. In the next chapter, we studied how to create advanced trading
strategies in Pine Script. We created three advanced
trading strategy. First, we covered and studied
step by step guide to develop trading strategy
based on ADX VMA indicator. Then we built trading strategy using multiple moving
average indicators. Finally, we learned
in depth tutorial on developing a
sophisticated strategy based on Mac D indicator. In the final main chapter, we studied alerts in
trading via Pine Screen. And particularly, we understood the role of aerts in Pie script. After that, we had a lesson of practical implementation of
aerts using alert function. Then we studied how utilize alert condition function
for setting up alerts. Finally, we learned how
to implement alerts in strategy based on
order fiel events. Overall, the Master trading view Pine Script advanced
programming course provided a comprehensive and in depth exploration of Pine
Script programming, dedicated to both beginners and more experienced users,
seeking advanced techniques. This course began with
insightful introduction, setting the stage for
a journey through a complexity of trading
views Pine script. It covered the essentials, starting with the
Pine script editor, guiding you through the creation of your initial scripts and introducing key concepts related to indicators and strategies. As the course progressed, you delved into the details of Pine script execution,
time serious analysis, and the foundational
structures of Pine script, including identifiers, apparators, and
variable declarations. Lessons on conditional
structures, loops, and the type system of Pine
script further and reached the understanding of
this scripting language. The course emphasized
hands on learning, enabling you to master the creation and the
user defined functions, laying the groundwork for more advanced
scripting endeavors. A significant portion of
the course was dedicated to creating advanced indicators and trading strategies
in Pine script. From building and moving average ADX DMI
indicator to crafting complex strategies like multiple MA Pyramid and
Mac Dltimate strategies. You acquired the skills
necessary to develop sophisticated tools for market analysis and
decision making. This course went beyond mere
theoretical understanding, incorporating practical
lessons on back testing, forward testing, and
optimizing trading strategies, providing a comprehensive view of strategy development
and implementation. Furthermore, the course covered the critical aspect of incorporating alerts into
Pine script strategies. You gained insights into the
type of alerts available. Their role in indicators
and strategies, and practical lessons
on setting up aerts using functions such as
alert and alert condition. The final lessons
addressed the use of allerts and strategies
based on order f events. Offering a comprehensive
guide to leveraging alerts for effective trading signals
and trading automation. In essence, this course equipped you with
the knowledge and skills needed to navigate Pi script programming
with confidence. Whether crafting
complex indicators, developing advanced
trading strategies, or integrating alert systems, you emerged with a
solid foundation in Pi script that
contributes significantly to your ability to
create and implement successful trading strategies of the trading view platform. This is the end of this lesson, and I will see you
in the next one.
31. Resources for Further Learning and Development in TradingView Pine Script: Hell on, welcome to this lesson, resources for further learning and development in
Trading view Pin Script. As you continue to
learn and develop your skills in Trading
view Pin script, there are a variety of
resources available to help you improve
and stay up to date. Here are a few
recommended resources for further learning and development in Trading view Pin Script. Number one, the
trading view website. The trading view website available at trading
view that comprovss a wealth of information
on Pine script, including documentation,
tutorials, and examples. It's a great place to start learning and developing
your skills. Second resource, the trading
view Pine Script Community. The trading view Pine
Script community available at tradingviw.com slash scripts is a forum
where you can ask questions, share your scripts, and learn
from other Pinscript users. Third resource,
Pincript Tutorials and examples on YouTube. There are a lot of
Pine Script tutorials and examples
available on YouTube. This is an easy way to learn and see the
script in action. Resource number four, practice. The most important thing is to practice, practice, practice. The more you practice
writing pine sscript, the better you
will become at it. And fifth resource to learn about technical
analysis, indicators, I recommend chart school section on stockcharts.com website, available at school
stochars.com slash do pP. There, you will find in depth information about
calculation, interpretation, and trading signals of wide range of
technical indicators, such as moving average, RSI, ADX, et cetera. By utilizing these resources
and continuing to practice, you will be able to
improve your skills and develop your own
custom indicators, studies, and strategies
for analyzing financial markets and
making trading decisions. This is the end of this course. Congratulations. I wish you all the best and happy
programming and trading.
 Sergey Buzz, Programmer, Trader, Author and Coach