Transcripts
1. What you'll learn in this course: Want to get more sales
on your webshop? You want to understand how
people are using your website. Then this is the right place. In this course, we'll talk
about Google Analytics four, which is a super powerful tool that helps going from guessing to actually understanding
what's going on while you are a
marketing professional, a business owner, or anyone who wants to learn what's
going on on their website. This is not for you if you only care about how
your site looks, but not how it performs
because in this course, we're going all the way from beginner to P in
Google Analytics four. So we're going to start with
the basics, and later on, we're going to go more
in depth and create your own custom reports because every website and
every business is different, and I want to make
sure that you're really tracking what
matters to you. Most importantly,
and this is probably my favorite subject
is we're going to be answering real world
business questions. So think about
which ad campaigns are generating the most revenue, which traffic sources
are converting the best, which pages are causing
people to leave our website, and where are we losing sales and what can
we do about it? Even if you've already used
Google Analytics before, I'm still going
to go through all of the settings because one of the biggest problems I
see when I work with new clients is that their
settings are not correct, which means that their
data is not clean and they make the wrong decisions.
My name is Auka. I've been working in
marketing for over ten years. I'm currently working
as a marketing manager, but I've also traveled
the world helping businesses grow using
my favorite tool, Gour. So I'm super excited to
tell you all about it. So grab your coffee, get comfortable, and
let's get started.
2. This is where it all starts: Welcome to your
very first lesson. I'm going to start
with the accounts because accounts are usually
very confusing for people. Sometimes they have
multiple accounts or multiple websites, and they don't know
which one is right. And it actually doesn't
have to be that hard. And I'm going to show you
that it's also easy for you. Now, it's important because
we want to set up our account correctly in the first place
because then later on, it's going to be easier for us. So if you're ready,
let's dive right in.
3. Account Structure: So before we dive in, it's really important
to understand what the account structure looks like because some of you
might be sharing accounts. You might have to give
people access to an account. You might already have one, and you want to know how
to create a new one. And I'll explain this right
now in the account structure. Above everything, you have your Google account.
That's on top of the pile. Within a Google account, you can create multiple
GA four accounts or Google Analytics accounts. Within that, each
GF four account can have multiple properties. You can see a property pretty much as your business, right? So if you are one business, you would have one GF
accounts and one property. A property is also a little bit like a bucket that
collects data. So if you want data to
go into your property, you want to add data streams. And a data stream could
either be your website, but it could also be an
IOS app or an Android app. Usually, what you'll see
is that you'll just have one website you want to
track under one business, which means you'll
have one account, one property, and
one data stream. So again, you can just create
multiple properties under the same account and have a few data streams in one and just one data
stream in the other. It doesn't really
matter that much. So here's an example if
you are a business owner, as I said, you would just
have one Google account. You would have one GA four
account and one property, including one data stream. Pretty simple. However, if
you're a marketing agency, I would still recommend to
have one Google account. But for each client you have, you might create a
new GA four account. And then some clients might have multiple websites, right? So you would have a bit
more properties there. And some of these websites also have a IOS or Android app, which means that
you might have a little bit more data
streams there as well. But for most of you, this really wouldn't
matter that much. And if you really get
to the point where you have 25 clients and
GA four accounts, more power to you
because that's really amazing and you're probably
doing really well. And in that case,
you're probably very experienced with this tool. And later in the course, I will also explain to you how to share access between
accounts properties and how to set up your
own data streams. But for now, this was it for
the overview of GA four. And the next lesson, we're
going to dive into the tool. I'll see you there.
4. Creating an Account: So now that we know how
the account is structured, let's go ahead and create
our first account. So you want to go to
analytics.google.com and hit Enter. Now you're either going to be locked into an existing account, or it's going to say, Hey, do you want to
create an account. So if you are on the second one, if you're
on the screen that says, create an account, just wait for a moment. We'll
just get back to you. If you actually jump into
analytics automatically, and on the top left here, you see some kind of account, that means you're
already locked in. So if you want to
create a new account, you want to go to Admin here. And then on the top left, you'll see create and create account. And now everyone should
be on the same page. So let's just fill this in. For the account name, you
usually pick a business. So for this one, let's just go to beautiful plates,
spelled correctly. Then here under the account
data sharing settings, don't worry about this,
leave everything as is. If you want, you can share a bit more data or share
less data with Google. That's up to you. It next. Now, let's create a property. And for property, I usually
go with the website. So for this one, it's going
to be beautiful plates. Dot shof.com. Make sure to pick
the right time zone. So for me, that's going
to be Netherlands and the currency will
be Euro. Hit next. For the business details, this doesn't really matter that much. Just pick any. So I will
be in home and garden, and the business size is small. So for the business objectives,
this also doesn't matter. It's just going to give you more or less reports, depending
on what you click on. So just click on O and then you'll get all
of the reports above. Now we just have to agree with everything that
Google gives us. So pick a country, hit Accept, and then make sure
to do that until you go to the next step. And
that's pretty much it. So as soon as it says
start collecting data, you'll see a few options, but you also see a button
that says Skip for now. Skip for now we'll take you just straight to the Gaour dashboard. So that's what we're going to do because I have a
little bit more to tell you before we actually jump into setting up
the data streams. So hit Skip for now and then
click Continue to Home. Alright. So now we're in our newly created Google
Analytics account. It says here, I can't
find any data streams. That's because we
haven't set any up yet, but we're going to do
that in a future lesson. For now, I just want you to pay attention to
the top right here because this is where
you'll find all of your Google accounts
that you can log into. And if you remember from
the previous lesson, any account in GF four is
linked to a Google account. So this Google account,
ahilbrn.courses@gmail.com currently has three different
analytics accounts. All right? So if you cannot
find your accounts, first thing you want
to check is if you're logged into the right Google
account on the top right. And here we can also
see the structure. So you'll see Anytux accounts. And if you click
on any of those, then you'll see the
related properties and apps within this account. So if I clo to Soclos, then I will see the
property named Soclos. If I go to beautiful plates, I see a property that
we just created. I actually have two because I've had to re record this video. But yeah, just know that these are your Analytics accounts, and on the right hand, are the properties that are
linked to that account. And that was it. So now you know how to create an account. Make sure to do this for your business that you
want to work on. If you don't have any business, just create a fictional one. Make sure to think
of a creative name, but it doesn't really matter. As long as you
know how to create an account, you
should be good to go.
5. What is Google Analytics 4?: So before we jump right
into the platform, it's always good to
take a step back and really think about what it is that we want
to learn, right? So what is Google
Analytics really? So, most of you already know
what Google Analytics is. That's probably why
you're doing this course. But with all of the tools and
options that are available, it can be really easy to forget what the essence is of what
you're really trying to do. So what is Google
Analytics in short? Google Analytics is an
analytics tool that helps you measure website traffic,
engagement, and conversions. And there's so much you
can do with this tool. So it's really easy
to get overwhelmed. That's why it's always
good to take a step back. Remember the essence
of what you're doing. We're trying to measure website
traffic and engagement, including conversions so
that you can optimize your website and ultimately
grow your business. So why is it important? We all know that it's very
powerful tool, but what can you really do? So first of all, A four
or Google Analytics, it allows you to collect
user data from your website. Then it automatically filters it so it becomes usable to you. Then using this data, you can measure the behavior
of users on your site or app with which you can
make data driven decisions, and ultimately, you can
grow your business. So that's really the core of GA four and what you're
trying to do with it. So how does it work? It's
actually very simple. You need to install a piece
of code onto your website, then this code will
automatically collect user data, and it will filter
it and send it to Google Analytics
four for you to use. Later in the course, I
will show you exactly how to install the Gaour
code onto your website, whether that's Wordpress, WIX, Squarespace, Shopify, or
even a custom coded website. Now, it's important
to understand why GA four is called GA four. Why isn't called GA
eight or GA two? Well, Google
Analytics four or GA four is basically the fourth
version of their software. Back in 2005, Google acquired the software
company Urchin. Some of you might know
UTM codes already, which is called Urchin
Tracking Module. Well, now you know
where it comes from. If you don't know this, you'll learn all about it
later in the course. Then two years later, they rebranded to Google
Analytics in 2007. Then in 2012, the previous
version was introduced, that was called
Universal Analytics. Some of you might still see
this every now and then. But then this version
got replaced, which is the version
we have today, and that's called
Google Analytics four. So some of you might have
created an account before 2020, which means you have an older version of Google Analytics. The support for
this older version has stopped a few months back, so it's important to migrate to the newer GA four version. But I'll show you how to do
this later in the course. However, any account
created today will automatically become
a GA four account, bringing all of its amazing
features to you for free.
6. Coming up: GA4 Dashboard: Right, so now that we
have our account set up, it's actually time
to go into Go, probably what you've
been waiting to do. I'm not going to
go in depth yet, but I'm going to show
you around a little bit. I'm going to show you
where the reports are, where the custom reports are, maybe even admin
settings because we're all going to go in
depth later on in the course. But it's really good to already know where you can
find this stuff. So if you're ready,
let's get going.
7. Where to find the Resources: So before we continue, I just want to let
you know that if I ever talk about resources
in this course, I unfortunately cannot attach
any resources to a lesson. So if I talk about a resource and you want
to be able to find it, you just have to go to
the At section here. Then click on Read More, and then I've pasted all
of the resources in here. So a lot of the time, a resource is about the
support documentation. So you can just go to the
support documentation link and just find the topic
that I'm talking about. And in other cases such
as the UTM tagging sheet, the link is right here. So you'll still be
able to find all of the resources
in the At section. So I just wanted
to mention this.
8. Set up GA4 Demo Account: So let's say you don't have a website or you don't
manage any website, and you still want
to mess around in the platform and be able
to follow this course. Well, we can all do that using
the GA four demo account. What the demo account is, it's just a fake Google
Analytics account created by Google themselves that's
filled with fake data. So we can just mess around in GA four with a little
bit of data to play with. Because currently, if you just create an account, but
you don't have a website, you will see zero users, zero event counts, pretty
much nothing to work with. And for the sake of learning, we do need some
data to work with. So there the demo
account comes in. So how to access this,
there's two ways. If you just create an account, you can just scroll down on the homepage here in Analytics, and it should say try the
Analytics demo account. So you can click on
Access the account. And then if you scroll
all the way down, you should be able to see
Google Analytics for property, the Google Merchandise store. There's also a demo account for an app and web data as well as an old Universal
Analytics property. But for us, we want to
use the GFurPperty. That's just simply a
merchandise webshop. So if you click on that, it should take you
back to analytics, and you should be in
the demo account now. So as you can see straightaway, there is data here. There's actually a lot of data. So the data you see in
here, it's all made up, but it will help us to work
our magic in the platform and for me to show a few examples when we get to the
reports later on. So if you are in your demo
account, on the top left, you should see all accounts, and say, either demo
account or blank. Note that if you go
into another property, you cannot click back in here to go back to
the demo account. So what I would recommend is to save the link that
you clicked on here. So you can just copy
link address and maybe just add it to your bookmarks. I don't have any bookmarks here, or just save it somewhere where you can
access it later on. Because we'll definitely
go back to the demo account a few more
times in this course. So if you don't
see the Analytics demo account option here, I'm just going to leave
the link to this property to this demo property in the
resources to this lesson. So you should be able to
find it there. All right. And that's how we set up the Google Analytics
demo account. So make sure to save that link, and we'll be using this in
the next lesson as well.
9. Switching between demo account and regular account: So one thing I forgot to
mention is that it's very handy throughout this
course to always have a demo account tab opened, as well as a personal account because some features in
the personal account, such as some admin settings are not available in
the demo account. However, the demo account will have some numbers
and some data to work with that we will not
have in our normal account. All right, so that's
what we're going to switch between the two
throughout this course. So I'm going to try to mention
it as much as possible whenever I switch
to the demo account or to the regular account. If you're unsure,
you can always see it by looking at
all accounts here. If this is empty, we're
in the demo accounts. If this is filled with a name, we're in a personal
Jour account, right? So that's a quick
tip on how we can see which account
we're currently in.
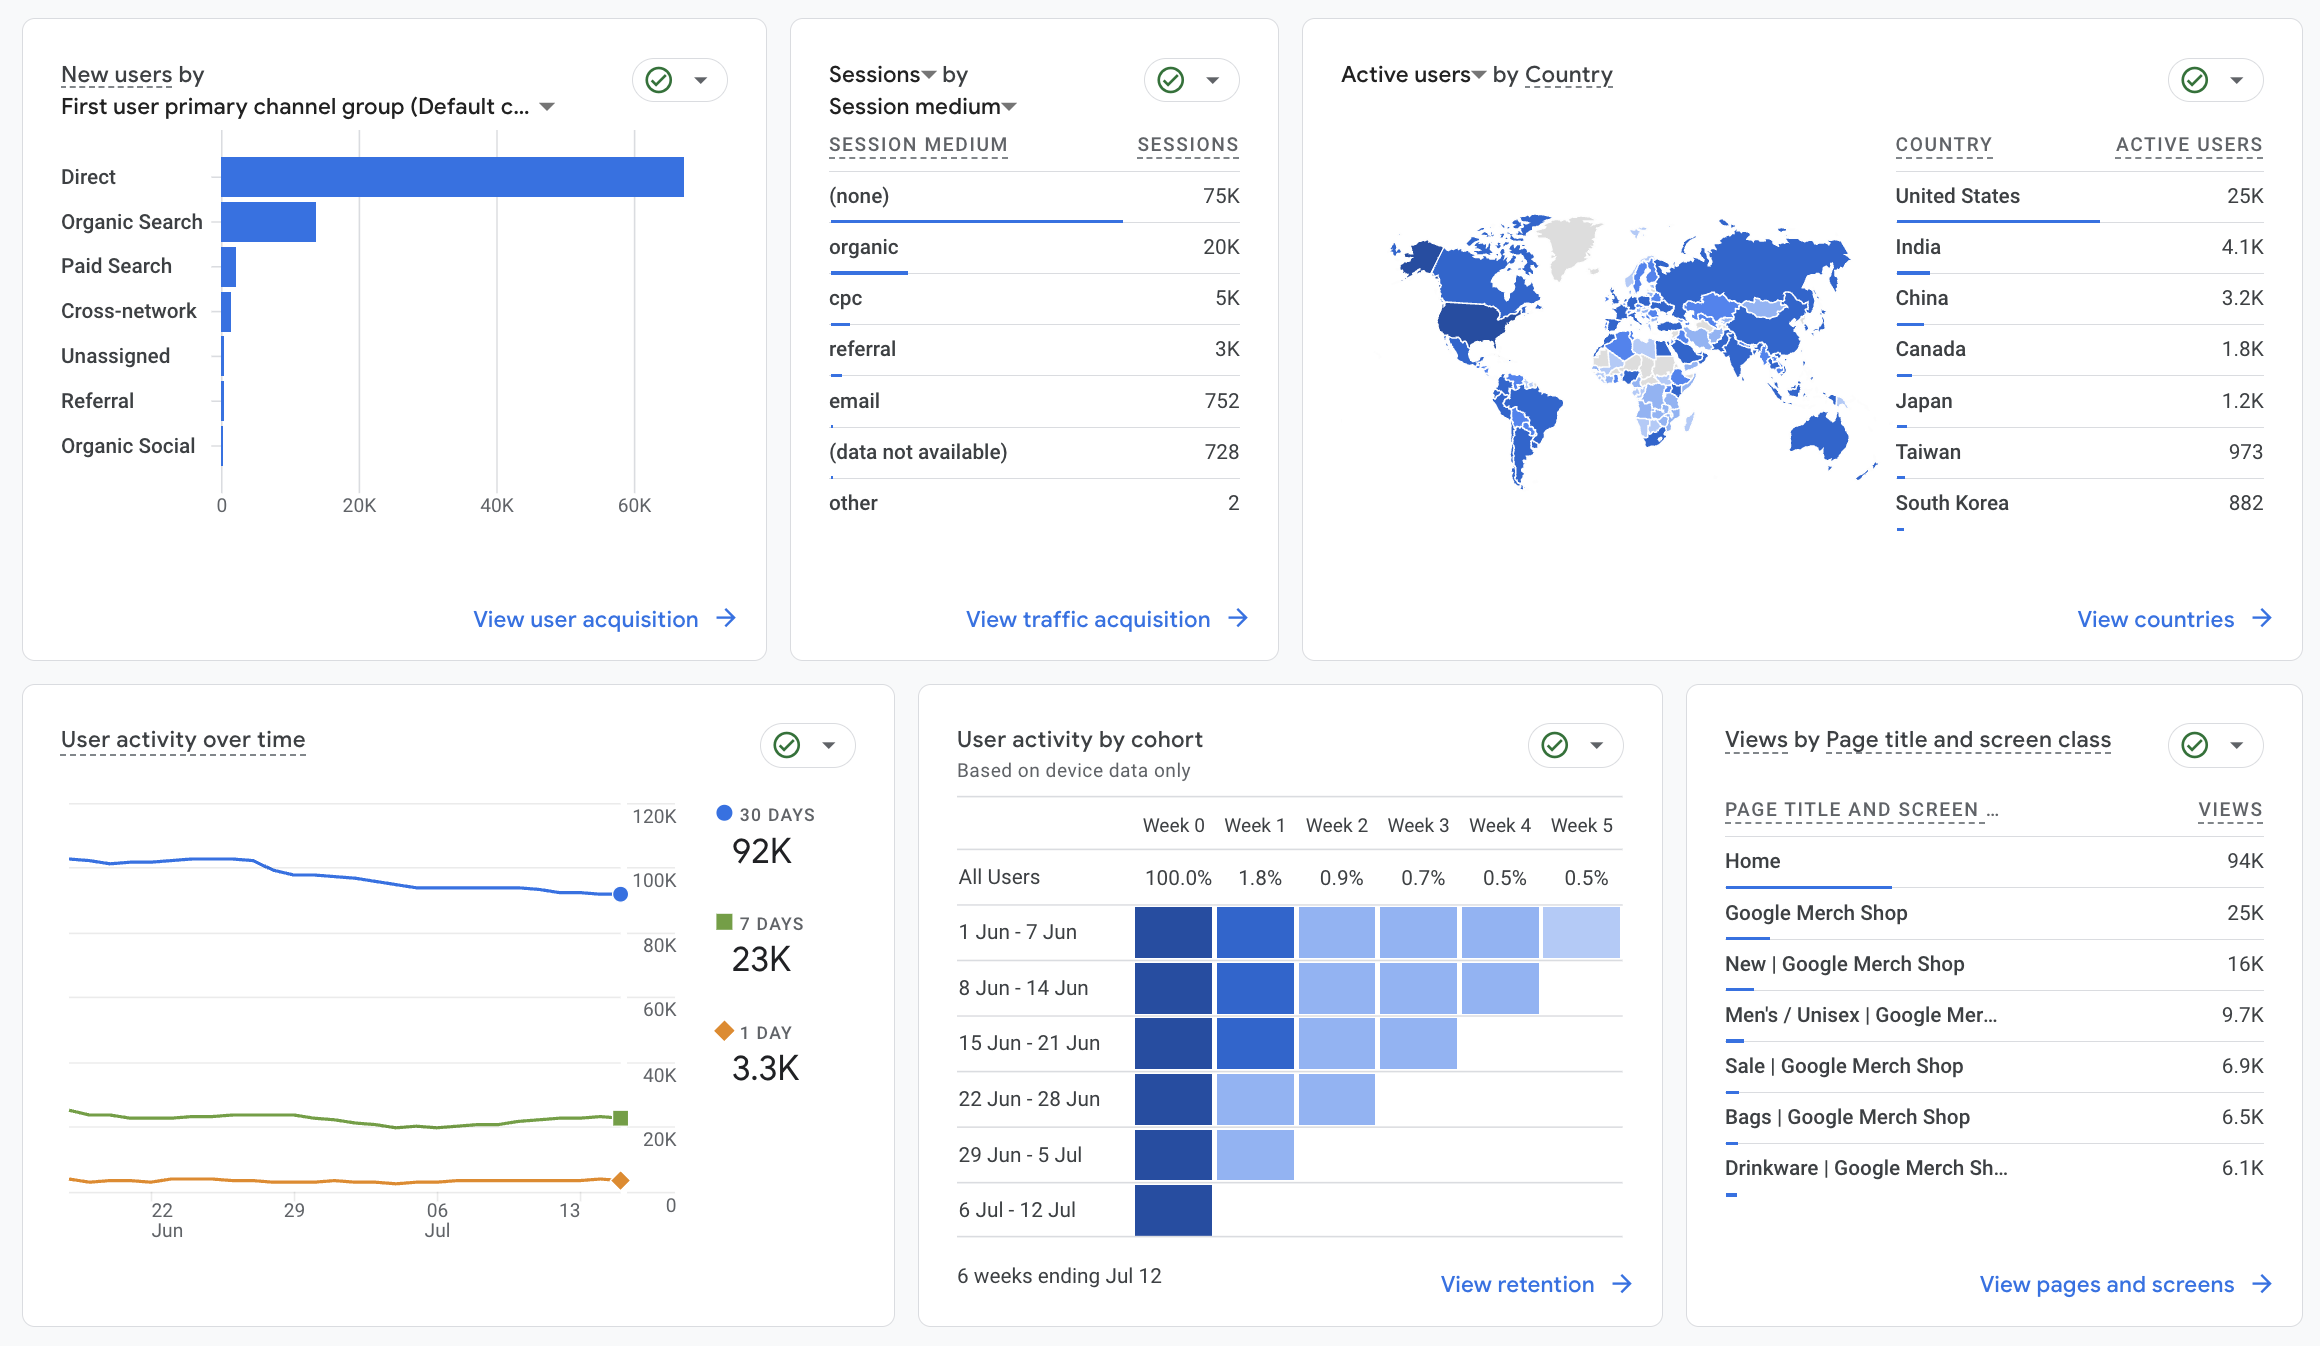
10. Home: This is the home section. It's the first page
that you go to if you go to analytics.google.com, and it's pretty
much an overview of some top level metrics in addition to some
standard reports. But everything you see here, we should be able to find in the reports and explore
section later on. So what this is is
just a collection of a few basic reports. You are able to change
around a few metrics here. So instead of users, we can select something
like key events. And we can also focus on
a few different ones. So everything you see in
here, all these reports, we are also able to find
this in the report section, which I'll go over
in the next lesson. So you can just think of this as an overview of some
standard reports. You cannot really
change this much. The only thing you can do is change a few of these metrics. For instance, if
instead of key events, we want to see users, and then you can change the
date range down below here. I'm usually not jumping
into this too much. It's nice to know the
amount of active users, sometimes for testing
or for other purposes. Sometimes it's nice to have the recently accessed reports here. If you click away and you do want to come back
to that same report, you should be able
to find this a bit more quickly in here. And then the next section
is suggested for you. If you'll notice that
some of these words would have a dash
line below this. If you hover over it
with your cursor, it's going to say what it is. And you'll see this
in the other sections as well, so that's good to know. This suggestion part
it's pretty much just what they think is
what you want to see. Again, you can find all of these reports in the
report section as well. So, in my opinion, why bother scrolling
around here? We can just go straight
to what you want to see. And then once you have your own website and you
have a bit of data, it will also give
you insights and recommendations
for your website. But again, these
are all AI based, and as of current, you're better off just
browsing through it yourself rather than listening to everything it says here. The whole point of this course
is so that you're capable enough to understand
what you want to measure and where you're
going to find this, so you will not be
needing this anymore. So that's a brief overview
of the home section. I wouldn't be spending
too much time in here. Usually, I just jump straight to the reports or the
Explore section. But for now, it's nice to have an overview of
everything in one place.
11. Reports: So the next section on the left here is
going to be reports. And this is usually
where you'll spend most of your time if
you're working in GA four. I'm just going to go over it pretty briefly because there's a whole separate section
on these reports where you'll learn
everything about the most important ones, the most important metrics, and even how to add custom
reports to this page as well. So as an overview,
the first thing you'll jump into is
the reports snapshot. This is pretty much a copy of the homepage and just gives you an overview
of some basic cards. You should be able to see
dis comparisons here, which we'll go over
in a later section. And yeah, this is pretty much just some
basic information. There's a lot to cover here, so I'm not going to jump
into this right now, but I'll cover this again in the report section
of this course. If we then click on real time, it's the same real time as
on the homepage, however, with a bit more
information, for instance, you can look at this cool map, which can be helpful. It's usually just to impress
your boss to say that, Oh, look at this, there's
some live people on our website at the moment. But it could be
helpful if you're running like time limited
promotional campaigns. For instance, if you're running a 24 hour sale and
you want to closely monitor if everything's
working and if people are actually
visiting your sales page. Could also be helpful
for events if you're running a two
hour live webinar, and in that webinar,
for instance, you post a link to your website, then you want to track kind of how many people are
clicking on that link, and sometimes you
can even feed back that information back to the host that if not
enough people clicked, that the host might be able to promote it again so
that you get more clicks. And it's also helpful for
picking up on issues, right? If you are in GFOur daily, and normally you have
about 30 users in the last few minutes and all
of a sudden there's zero, then you'll know that
something's wrong. So it can be helpful
for a few but, yeah, I wouldn't
use it too much. So if we continue,
we have life cycle. So life cycle is just the
category of these reports. And these are and
within life cycle, we have a few subcategories. We have acquisition, which is all about
acquiring new users. So it's going to tell you
where they came from, which sources they came from. So every section
has an overview, and then every section also has a deep dive
where you have a table where there's much more to customize here and much more
to find in terms of data. So again, I'm not going to
go over this right now, but this is what the
report will look like. You also have engagement, which should give you
information about events or lending pages, pages, and screens, reports that I use on a
daily basis as well. And then if you have a webshop and you have ecommerce
tracking setup, then you should be able to see your ecommerce purchases here, as well as how many items
were added to the card. What's the revenue
for each item, as well as some information about the journeys
that people will take. Then there's also retention, which is going to
tell you everything about the returning users, as well as how much failure
you get from each user. So it is really cool to see. Then if you have
search console linked, which I'll also explain
in a later lesson, you will be able to see
what people search for on Google before they
came to your website. So that's very cool information. And as well as which pages people visited that came from
the Google search traffic. And last but not least,
we have user attributes, which will tell you more about the demographics of people
using your website. And later on, we'll create
custom audiences as well, which you should be able
to see pop up right here. So in this demo account, there are already a
few audiences created, but we'll be creating
our own later on. And then under user,
you also have tech, which will give you information about the tech people are using. So if it's desktop,
if it's mobile, and then also which browser, which device category, as
I mentioned, so mobile, desktop, tablet, even
SmartTV, which is pretty new. You can also find
information about the operating system
and much more. So, yeah, that's pretty much an overview of the
reports section. One thing I want
to mention here is that we are currently
in the demo account, but if you go to
a normal account, you should be able to see
library on the bottom here. So I'm going to jump into my created account, which
is beautiful plates. Go back to reports.
And now in the bottom, you should be able
to see library. So we'll get into more
detail on what this does, but just know that this is
where you'll be able to find the custom reports that you
will be creating later on. And if you recall when
we created an account, there were some
selections you can make about which reports
you want to see, and they are uptop here. So if you unclicked everything, you don't have the
standard reports. So what you can do is go to library and just
activate them here. So you hit publish, and now we have business
objectives in our reports. And with that come a lot of different standard templates
for us to use, right? So very important to know that this library section is
here on a normal account, but it's not there on
the demo account. Cool. So that was overview of
the reports section. And again, there's
a whole section I've created in this course, specifically for the
reports where we'll go into detail about the metrics about which reports
are most important, as well as how to
create custom reports.
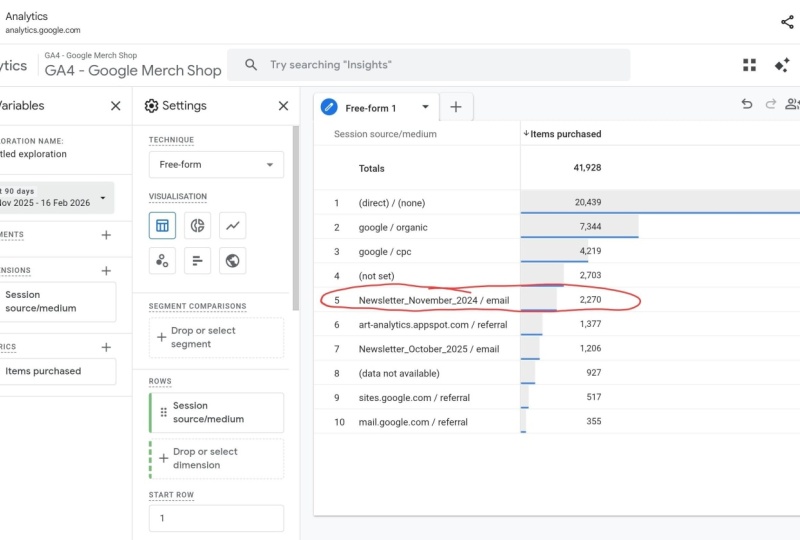
12. Explore: Let's jump into
the next section, which is going to be Explore. So Explore or Explorations pretty much is a different
word for custom reports. So in this section,
you are able to create your own created reports, modify them as you wish, and then you can even save them. And later on, I'll
show you how to also display them here
under the report section. So anything you create
in the explore section, you can then use and display it here in
the reports section. So explorers really just
to create custom reports. Now, if you are on the demo
account, like I am right now, there's a good chance that
your reports will not save, and every time you go back to the demo account,
they will be gone. So please keep this
in mind if you are planning to create a
few custom reports, which we will do in this course. If you're going to
create reports, please just go and use your
property that you created. And if you haven't go back to the section where
we create a property. And even though it
doesn't have any data, you would still be able to
create your custom reports and actually save them because
these will disappear. Cool. Yeah. So again, there's a whole section
that I'm going to go through to show you how
to create custom reports. But this is pretty much what
this section is all about. And here you get
a little preview of the different kind of
reports that we will create.
13. Advertising: And the final section
will be advertising. So this is helpful if
you're also running ads and you have your Analytics account
linked to these services, they should be able to pop
up in here and you get more information on what these ads have done
for your business. So in other words, how
have they performed? There's some
information we'll see about the channel
they came from, which could be direct, some organic search,
some shopping. We'll go over these sources
in a later lesson as well. There's also a little
bit more information on the attribution models. So here you can compare the last click model versus
the data driven model. Again, this will be covered
in a future lesson, but this is where you'll be
able to find that stuff. And you can do a more deep dive into specific ads themselves. Currently, this is not
working for the demo account. Maybe this one is.
Yeah. Here we go. So yeah, you can really see by ad campaign that you're running, what the events are, what
the cost per event will be, how many clicks it generated. So really just everything focused on the advertising
side of things. Personally, I do not use
this too much because I prefer to be inside of the
ad platform that I'm using. But this could still
be helpful for you if you want to jump in and
do everything from A four. But yeah, there's going to be a different section
on this as well. This is just a brief overview
of what it looks like.
14. Admin: And finally, after
these four sections, we also have the admin panel, which you can find
on the bottom left. And this is pretty much
where we'll change all of our settings related to
our GA four property, as well as the accounts. Here we can access
the management. So if you want to give someone else access
to your account, or if you're an agency
and you need to require access from
another company, then this is where
you'll do that stuff. This is very important if you want to have a successful
GA four setup, and there's a whole
separate section on the admin panel later
in this course, where we'll go over the
most important settings as well as how to change
your data stream, how to link your Google
Ads, for instance, how to exclude your IP
address so you keep your data clean and many
many more settings. This is pretty much
where you'll find all of the settings
related to A four. Just go to the admin panel. Again, if you are only
using the demo account, I highly recommend creating a separate account just for the sake of the
admin settings. So you are able to
keep the settings that you change so
that in the future, if you create any new accounts, you have an example
of what you want to implement here. Great. So now we have a brief overview of all of the
sections in GA four. We just create an account. We know the account structure. We know as well how to change our Google account or how
to change a property here, and we kind of know where
to find everything. So let's dive in to
the next section where we'll actually install
GA four on our website.
15. Coming up: Installing Google Tag: So now that we know how GF four looks and where
we can find things, it's time to install our tag. I see this going
wrong a lot of times because sometimes when
I go into my clients, back end, I see multiple tags. I see them installed the wrong
way, so this is not great. And in this section,
I'm going to show you exactly how to install one tag the right way so that your data
that comes in is clean. I also tailor some videos to your situation because you might have a webshop on Shop y, but maybe you have WooCommers or WordPress or even
Wix or Squarespace. I have custom videos
for each situation. Also, if you have a
custom coded website. So if you're ready,
let's get going.
16. Introduction to Tags: So before we go and install
G four on our website, we really need to
understand what tags are. So tags are just a
few lines of code, for instance, what you
see on the screen now. And these lines of code
create a connection between your website and the
tool that you're installing. If you look at the code itself, you will see that
right here on top, it says Google Tag. We use this one for GFOur
and for Google Ads. Just don't really worry
about what's here below. This is all written in
HTML and JavaScript, but you don't need to
understand the code itself. The only thing you have to
do is to copy and paste it and really understand where
you need to add this code. So for instance, tools
like Google Analytics, Meda or Google Ads, they're all installed through installing a tag
on your website.
17. Create a Data Stream: So before we go ahead and
install the tag on our website, we first need to
create a data stream. So as a quick recap, we already went over this
in a previous lesson. A data stream is
just a way to send data to your property, right? So remember, our property
is like 80 bucket of data, and we need the data
stream to actually send some data to that bucket. So that's what we're going
to set up right now. So if you are in your
GA four homepage, you can either click
to go to Stream setup. But it's also good
to know how to create a Datastream if
you already have one. So to do that, you have to go to Admin and
then on the right here, you should see data
collection modification, and you can click
here on Data Streams. So because this is a website, we're going to choose web and then type in the
URL of our website. So that's where fill
plates top my shopify.com. And you can call the
name. I actually always just copy and paste this, have it the same as the URL. Make sure that enhanced
measurement is turned on. And this is pretty
much why G four is so much more powerful
than the previous version. It's because it's automatically able to track all of
these interactions. So make sure that
this is turned on, then hit Create and continue. And that's pretty
much it. So now we've created our
first data stream. So it's automatically pushing us to install that tag as well. I'm just going to click
out of this because I have separate videos on
how to install the tag, which you'll be able to
see in the next lessons. So for now, this is all
we just need to do. We have created our data stream. So this is the measurement
idea that we're going to use when we're
installing our tags, and we can just
click out of this. So, again, if you want to
set up another datastream, you just go to Admin
Datastreams and then click on AdStream and pick the
one that's right for you. If you want to change any
settings for the datastreams, just go to the
same place and you click on the datastream
that you want. And here, there's a lot of
options that we can change, and we do want to change a few, but I'll go over this
in a future lesson. Let's first install
Gour onto our website.
18. Installing Tags on a website: So here's how it works
in the back end. So you've got your website. It doesn't really
matter if you're using a web Builder or if you're
coding it yourself. Pretty much all websites, they are created by code, right? And in this code, there are a few similarities. Any website will have a
head tag and a body tag. So here's very
basic HDML for you. So this is called
the opening tag, and below here, you'll
find the closing tag. The closing tag is always
recognized by the forge lash. So this means anything in
between the head on top and the closing tag here is the code that lives
inside of this head. And here you see below
the body will open up, and that means that somewhere
further on the page, there will be a body closing tag that you can recognize by
looking at the forward slash. So why is this important?
It's important because we need to install our code in between the head opening and
the head closing tags. Now, I'm sure some of you
might get very confused. Don't worry. I'm going to run
you through all the steps, and it's actually
very easy to do. The only thing you have to do is add a piece of code
on the website. So for this example, this is a successful installation
of Google Analytics tag. So it's also possible to install multiple tags on a
single website, right? We have above the
Google Tag and below, we have the Facebook
Pixel code or Meda Pixel. This means that if you paste this in the correct
place on your website, you now have successfully
installed GA four and Meda.
19. Three different ways to install Tags on your website: To install JA four
on your website, there are a few different
ways to do this. In the previous
lesson, we looked at how to install
the code manually, which means adding a piece of code to your head
tag on the website. However, this is just
one way to install it. Nowadays, most web builders have integrations that make it
super easy to install A four. For instance, on WordPress, you can just download a plugin, and all you need to do is follow the steps and you'll
have GAour working. On WIX and Squarespace, you have a built in
feature that allows you to connect with JA four and make sure that it's
working on the website. And also, there's no need
to install any code. And on Shopify, it's
as easy as just logging in using your Google
account, and that's it. So these are a few
examples of how to install Gaour for
your situation. If your example is not
listed here, for instance, if you're using a web Builder
like Insta page or HubSpot, and the example is
not listed here, there are tons of tutorials out there that you can just
find for your situation. Just type in Google or YouTube, the web builder
that you're using, and then how to install GAour. And then using the knowledge
that you have now by understanding how the code is
implemented on the website, you should be able to follow the steps and make it all work. So there's another way to
install tags on your website, and that's by using
Google Tag Manager. However, this is a
very experienced tool, and you'll definitely need a little bit more
coding experience or understanding of HTML. So I'm not going to go
into this for this course, and we'll just keep it simple. However, I do have
a separate course if you want to learn everything
about Google Tag Manager, which you should be able
to find on my account. However, for now, simply find the video that
is right for you. There will be a few
lessons following after this one about each
platform individually. So find which one
applies to you, whether that's
WordPress or Shop of fy and just follow the
instructions in that lesson. If your website Builder
is not listed here, just make sure to find
a video or tutorial on YouTube or Google that's related
to your website Builder. Using the knowledge
that you just learned, you should be able to install GFOur on your website
without any issues. I'm very confident that you'll be able to
make things work.
20. Chrome Plugins: So just briefly
before we jump into a platform specific guide
to install the tag, what we need to do first is
install a few extensions, which are definitely
going to make your life much, much easier. So at the moment, I just have
two extensions installed. I have the Omnibug and I
have Analytics debugger. I'll put a link to these two in the resources of this lesson, but make sure to
install these two. So what they do, Omnibug is actually a tool to check any event
that's happening. So, for instance,
if we're going to go to a random website here. Make sure that your ad
blocker is turned off. If you have installed Omnibug and you right click
anywhere on the page, click on Inspect, you should be able to
see the page code. But what also comes
up if you click on these two arrows is Omnibug as well as
Analytics debugger. So if you click on this and
then just refresh the page, you should be able to see which
tags are actually firing. So for this website, there's a page view tag that fires
for Google Analytics, and there's a Facebook
pixel that's also firing. So this will allow you
to double check if there's a tag correctly
installed on your page, which you're definitely
going to need if you're installing Gaour
on your website. Now, the second tool is
called Analytics Debugger, which also pops up in this view. So if you click on this one,
and you start debugging, it's going to refresh
the site for you, and it's going to tell you
exactly the events that fired. So don't worry about
this too much. This is more in the Google
Tag Manager course, but this will give you a
little bit more information on the tags that fired, as well as the information
that comes with that. So later on, when
we're installing our events, this is
very helpful too. But for now, Omnibug is just the easiest because
you'll straightaway, see what is firing correctly. So make sure to
install those two.
21. Install GA4 on Wordpress: So this is how you set up GA
four on a WordPress website. First of all, you want to go to your website,
WordPress Dashboard. So for me, this is just one
of the webshops that I've built in the WordPress
admin dashboard. Then you want to go to Plugins and then click on
Add New Plugin. On the top right, you
can just type in code. And what we need is any plugin that allows us to add
code to our website. So that could be
either code snippets. It could be Wordpress code. They all pretty much
do the same thing. Maybe for now, we'll
just install a new one, header Food or code manager. Cool. So once that installed, you want to click on Activate. All right, so now we're
in the plug in section. We want to find the
one we just installed. So header Food or code manager, click on Settings and we
want to add a new snippet. Let's call the
Snippets GA four tag. Just use an HTML snippet type. The display should be side wide because we want to display
it on every single page, and we want the location in
the header for this one. So now we need the Snippet code. For that, we need to go
back to Google Analytics, and we want to go on the
bottom left to Admin in Admin, on the right here, you
should see data streams, or it could be on
the data collection and modification dataStreams. Make sure that you've added
your datastream here. If you don't have
one, just check out my other lesson on how
to create a datastream. And if you've done so, just
click on the Datastream and click on View
tag Instructions. And this should give
us the code that we want to paste. All right. So I want to install
this manually, and it says here,
you want to copy and paste it immediately
after the head element. So I want to copy this code here or just select all
and just copy there. Then go back and paste
this right here. Make sure the location is
the header, not the footer. And once you're done with
this, just hit Save. So now our code is
live on the website, and Google Analytics
should work at the moment. So in order to check
this, what you want to do is go open your website up. So not the admin, but just the main website
and go back to your analytics Go back home and just check if there's any users in
the last 30 minutes. There should be one now because you are
currently on there. There might be a few
seconds delay here. You can also just refresh
Analytics itself, you should be able to see
one user at the moment. Another way to check this is
you want to go to your site, make sure you have the
omnibug plugin installed. Anywhere on your website, just right click and hit Inspect. Click on the arrows
and hit Omnibug then make sure
your ad blocker is turned off and refresh the site. And now you should be able to see some analytics tags
that are loading in. So currently, I have two because there was already one on here, but one of these is the new
one that we just created. So if on your side, you'll
see an analytics tag, you know for sure
that this is working. Cool. So I hope that was helpful and good luck with
your WordPress website.
22. Install GA4 on Wix: So this is how you set up Google Analytics on
your Wig website. So you want to go to
managed wigs.com. Just go to your own
website and Dashboard. Then on the left
side, you should see Marketing and then
hover over it, click on Marketing Home. And then on top here, you
should see Google Analytics. So you want to click Connect
to Google Analytics. So I currently don't have
a premium account on WIX and you do need a premium account to set
up Google Analytics. So what you want to
do if you do have a premium account is you want to create a Google Analytics
property and a data stream, and then you should get
a Google Analytics idea. If you don't know
where to find this, you can just go to
your Google Analytics, make sure you're in the right
property that you created. On the bottom left, go to Admin. Then on the left here, click on Data Collection
and Modification. Click on Data Streams. Make sure you have
a data stream here. If you don't, just watch my previous lesson on how
to create a Datastream. And in here, you want to click on the Datastream
that you want to use. And on the right here, you
should see the measurement ID. So this is what they mean
with the property ID, right? It's the same thing. So you can just copy
that measurement idea, go back to WIX and just
paste it right here. And that should set you
up on WIX with GA four. So make sure to double
check if everything works. You can go to home, make sure to refresh your
website, wait a few minutes, and check if the users
go to one if you're on the website that makes sure that you are doing it right.
23. Install GA4 on Squarespace: This is how you set up your Google Analytics on Squarespace. So what you want to do is go to your Squarespace website and
make sure you're logged in. Then on the left here, you want to go to settings. And then all the way down
under developer tools, you can click here on
external API keys. And here you'll see
Google Analytics. So the only thing
you have to do is enter your measurement ID. So where you find this is
in your Google Analytics, just go to your Admin settings. Then under data collection
and modification, click on Data Streams. And here you should be able to find your data stream
for your website. If you haven't created one yet, just make sure to follow
along my other video, so you create your data stream, but I already have one here. And then if you click on
that on the right here, you'll see measurement ID. So just click Copy, and
then on your website, you can just paste this
right there and hit Save. And that's it. Now your GF four is
installed on square space. If you want to double
check if that's working, you can either do this
by going to Analytics, going to home, and go
to your own website. Make sure to refresh both
analytics and your own site, and just check if the
users goes to one. If that's the case,
you'll know it's working. Another way to check
this if you use the Chrome extension
called Omnibug. So you want to go to
your live website. Then you want to go Inspect. Click on the arrows, click
on Omnibug make sure that your ad blockers turn off
and then refresh the page. And then you should
be able to see a Google Analytics tag
coming up right there. If you follow along these steps, I'm sure you'll get
there, and here we go. Yeah, so if you follow
along all the steps, you should be able to
get to the same points.
24. Install GA4 on Shopify: Let's look at how to install
Google Analytics in Shopify. So what you want to
do first is go to your Admin settings in Shopify. So you can just go to
admin.shopify.com. Find your store. Once you're inside of this, you want to click on Online Store, then click on preferences. And if you scroll
down, you should be able to see Google Analytics. So if you then click
on Setup Google and just install this app, it's called Google and YouTube. Now, once you're inside
this, you want to connect your Google
account at the top. So make sure that it's
the same Google account that you have your Google
Analytics account under. For me, that's this one. So now, if it says connect a
Google Analytics property, either you have selected
the wrong Google account, or you haven't created
a datastream yet. So for me, I haven't
created a datastream, so I'm just going to
go back to Analytics. If you already see a property
here, just wait for me. So in Analytics, first of all, you can check if you're connected to the Right Google
Account on the top right. For me, it is the right one. Then how to create a
data stream is you want to go to the
bottom left to admin. Then under data collection and modification,
click Data Streams. Click on web if
it's the website. And then you want to have the
URL of your website here. So for me, that is beautiful
place sopmshopfy.com. Make sure to remove
everything before that. And as a stream name, I always like to call it just the
same as the website, so I don't get confused. Make sure enhanced
measurement is turned on and then hit Create Cool. So now it's going to
ask you to set up a Google Tech or
give more options, but we can just
click out of here, and we want to click out again
and go back to our Admin. So if we now refresh this, we should be able to
see the new property. And there we go. So it can see the property
that we just created. So we want to hit
Connect, and there we go. You've successfully set
up Google Analytics four. So now if we want to test this, we can just open up our website, make sure to refresh this. Go back to our analytics
and click on Home. We should now be able to see users in the last 30 minutes. If you don't see anything yet, it might be good to
just close out of your website and just
go back altogether. And let's see if this works. It could be a few seconds
delay here. And here we go. So now, it says there's one
user in the last 30 minutes, which is me because I am
currently on this website. So now we know for sure
that this is working. So I hope that was helpful and good luck selling on Shopify.
25. Support documentation: So another tip if you're
stuck or if you want to learn a little bit more details about anything
related to GF four, it's always a great
idea to go to the GFOur support documentation
or the Help Center. So the way to do
that, if you want to go to support.google.com, fdlash AnalytIS and this will take you straight to
the support documentation. Make sure to save this link. I'll also add it in the
resources to this lesson because it gives
you information on pretty much everything
related to GA four, including the
metrics, dimensions, where to find some things, how the dashboard works, some common issues as well. So I usually refer to the
documentation as well, and I'll also use it
throughout this course. But I just thought
it would be great if you can find
your way yourself. If you're stuck in any lesson or you just want to
have more information, this is the first place
you want to look, right? Support.google.com
fglash Analytics. And here you can find anything
that you want to know. For instance, you want to
understand the bounds rate. And here you go. GF four
engagement rate and bounce rate. So this will give you an
explanation about the metric, as well as an example
of how to use this and an example on how to add the
metric to your report. So yeah, pretty much what you
can also do is you can skip this entire course and just read through the documentation
from start to finish. However, this will take
you quite a long time, and it's definitely less
fun of a way to learn. But just know that all of the information
that you want to know is usually to be found
in the support documentation.
26. Coming up: Reports: Okay, so now hopefully
you've installed your tag correctly and you should see some data coming in. Or if you're using the
demo account, much easier. You didn't have to
install anything, and you can just start with
this section right away. Now, this is also
really nice section because this is where we
actually go into the reports, and we're going to look at
what our data tells us. We're going to create
the stories from the data and look where we
can improve our website. Now, there are few
standard reports made by Google themselves, and we're going to go through them because they're
perfectly fine. I'm going to show you how
to set up filters as well, so we can really pinpoint
what you want to measure and just show you
around with the basic reports. That's all. Now, it's a lot of fun in this section, so
I hope you enjoy it.
27. Report Structure: Let's have a look at one report and see what
the structure is like. So on the left, we're
going to click on reports. For this example,
under acquisition, we're going to click on
traffic acquisition. And here we get a view of
what a report looks like. So on top here, we
have the option to add a comparison as well
as to add a filter. But there are separate
lessons on this, so I will tell you about
that in the next one. And on top right here, we have the date range,
which is very important. So standard is 28 days, but you can set this
to whatever you want. But below the date range, we have a button here
to edit comparisons. But again, I'll go over this
in the comparison lesson. There's a button to export
the report to Analysis, which is going to move
this one to Explore. But again, there's a
whole section on Explore, so I will get into that
in that section as well. There's a button to share
the report using a link, but just be aware, you can only view it if you have
access to the property. So you cannot just send
the link to anyone. They need access to
this GA four property. And then on the right here, we have Insights,
which is pretty new. And here is GA four suggesting some questions that you
might want answering. For instance, you know, on what days do I
get the most users, and then it's going
to use AI features to find this
information for you. I hardly ever use this, but it could be helpful. If you want to know something that's not in the
suggested questions, you can also just look for
it in the search bar here. But again, I usually find this stuff quicker by going
through the reports myself. Cool. So that's the top level
here of the report section. The most reports consist out of a line chart
on the left here, as well as a bar
chart on the right, and there's a table
beneath as well. For the line chart, you have an option to change this from day to week to month. For instance, if you are set to the last 12 months
on the date range, it's better to put this one on month because if you
put this on day, it will be very hard to
really see the trend. So you can either put
it on week or month depending on what you have
selected in the date range. Cool. Another option
here is you can click on these groups so that you only highlight
the one you selected. It's not going to
change any data here below or data on the right, but it could be helpful
if you just want to send a screenshot to someone and
just have one thing pop out. All right. So now
let's get to the table because the table is really where you're going to
spend most of your time, and it's going to give you the best information
that you want. So the table has a search
function on top here, and what this does is
you can search for anything that's displaying
here in the dimensions. So, for instance,
it's currently set the channel group to the
default channel group. And let's say I want to check out number 14
here, which is display. Instead of, finding it here, I can just search for display. Hit Enter, and then it
should come up here. So this is really
helpful if instead of the session primary group, you actually have the page or the page title because
most websites have hundreds of pages and
you don't want to be scrolling here through all
of the pages manually. You can just use the
search function. So besides the search bar, you have the rows per page. Currently, it's set to ten, but you can set it to
100, for instance. And instead of clicking
through the pages, you can scroll down
to visit everything. So let's put it back to ten. All right, so that's
the search function and the pages here. So on the left here,
you have the rows, which are indicated by a number. So the first row is unassigned, second row is
referral and so on. Then on top here, where
you see user sessions, engage sessions, and so on, those are called the columns. So usually you have
a dimension in one of the rows and a metric
in one of the columns. And in that way, you get some
values here in the middle. So, for instance,
for paid video, we want to see the
amount of sessions. So we can just go
through this row, which is paid video, go to the right until we
hit sessions here. And then we know for paid video, there were 214 sessions. So that's how you want
to read this table. So again, on the left
here are the rows, which are usually dimensions. On the top here, there are columns
which are metrics. Usually, you can
swap them around, and in the middle here,
you have the values. So another option here, if you have events on the table, as you can see here
with event count, there's an option
to drop down and actually filter by
specific event. So for instance, if I want
to see the add to cards, now I only see the
add to card event, which for direct
is about 106,000. For email, it's about
12,977 and so on. So that's how you
use this table here. And we're going to spend a
lot of time in this course, just finding some data,
switching things around. So it's really
important that you understand how all
of this works. As a final thing to mention, if we put this back
to all events, there is a way to change
the dimension here by clicking on this drop down. And what displays here is dependent on which
report you're in. So currently, we're in
the traffic acquisition, which shows these dimensions. But if we go to events,
and scroll down. It doesn't even give
an option, actually. So let's say we go to
pages and screens, and here the drop down gives
a little bit more options. So this is all the options for the page title, page
path, and so on. So do keep that in mind if you are going through
these reports. Cool. So for the traffic
acquisition reports, we can just click
on this dropdown and changes to
whatever you want. So currently it's on the
default channel group. But let's say we want to
check the session source. If we click that, it's
going to change here, and all of a sudden our rows
are a little bit different. So that's the way to find
the data that you want. Then this plus icon lets
you add a second dimension. So the session source will
be the first dimension, and the plus will be
the second dimension. So, we can have a little bit more in depth what
we want to find. So let's say we want
to have source, and addition we want
session medium. Now, you'll see that the source will have some duplicates, but that's because some sources have multiple mediums, right? So Google has Google
organic and CPC. So this allows us to instead of just looking at
Google as a source, we can just break this
down a little bit further and compare
organic versus osperCliq. So for instance, we'll see that organic traffic has a little bit more engagement
time compared to CoSperCliq, which makes sense, right,
because if you click on an ad, you're less inclined to stay. If you found this
website on Google, people tend to stay
longer on their website. So that's pretty
much all you need to know on this report structure. Using this information,
we can now look at which metrics of
all of these are really important to understand because I'm sure you're
not really sure what a difference between
user and a session is or a page view or the source. So in the next lesson,
I'm going to explain you the most important metrics and dimensions so that you know
your way about these tables.
28. Changing nature of Standard Reports: So one more thing on these
reports is you might notice that the reports that you see on the left here could be
different from what I see. Well, the main reason is because they change quite often, right? These are the standard reports that Google Analytics provides, and they usually make
a lot of updates on the so don't worry if you
see a few different reports. Usually, you can find
very similar ones. Now, if you do want to change
these on the left here, here's a quick reminder that on a personal Analytics account, you will see library here. So if you're on
the demo account, you won't see it because
you cannot change it. But if you're on
your own account, you should be able
to see library. And inside the library, you can find the reports
on the left here. So these are on
their life cycle. So let's find life cycle here. And now if you hit it,
you can change them. So if there's a report that
I can see that you don't, there's a good chance that it's still in one of these here. You can find the report,
maybe like traffic, and then you can just drag
and drop it in there, right? So I just wanted to mention this
29. Metrics to Understand: So let's look at the most
important metrics and dimensions that you're going
to be using most in GA four. So GA four has a great
feature where if you're inside any report and
you scroll down here, you see all these metrics, they have a dash line beneath. So if you hover over
this with your mouse, with your cursor,
then you'll see the explanation of this metric. So sessions would be the number of sessions that
began on your site or app. And then sometimes it has a link if you want to learn
more about it, there's also a great tip that if you want more
information on anything, there's the Analytics help form. Sorry, Help Center.
And here you can pretty much find everything
you need to know on Gour. It is very text heavy, so I wouldn't recommend
reading everything, but it's nice if you
want to just get a little bit more information on a specific topic or subject. But for now, we're
going to be happy with just the dash line and just the short explanation
that's right here. So let's have a look at the
most important metrics. So what I want to do is I'm just going to
create a new report, and I'm going to add the most important metrics so that we can go
over them one by one. So to do this, I'm just
going to go to library here. So, again, if you're
in the demo account, then you cannot see library. So for this, you need to
create your own property, which most of you
have done by now, and you just have to go to
reports and then to library. So we're going to
create a new report, which is going to be a detailed report and just a blank one. So what am I going to
do is I'm going to add the metrics that
are most important, and then we can just go
through them one by one. So for most important metrics, users is a massive one, as well as sessions views. Bounce rate, engagement rate, average engagement
time, fuse per session, event count, and key event. Here we go. So these are nine metrics that I think
are the most important ones. And you'll find when you work a little bit more with Gaour that these are the metrics that you will always
refer back to. So if you then hit Apply, they will be showing up
in this report here. So for the dimensions, the most important
ones to focus on are page title page path
plus the query string. Host name, Landing page, plus query string here. Source. So there's a
few different sources. You have first user source, and you have session source. So we want the session source. Session medium. Session
campaign and session content. Just content. Oh, sorry, it's going to be
called Session Manual at Content. There we go. Then events name and
Defice category. So I'm sure some of you will
hear a few and be like, Okay, I can imagine
what this means. But some of them, they are
probably brand new to you. So we'll go over them and I'll
explain them in a second. So if we then hit Apply, we'll now have our
dimensions available here, and we have our metrics always available
here in the columns. Ooh. So as you can see, the metrics now have a
dash line below them. So I'm going to explain
them right now to you. So users is the total
number of active users. An active user is
someone who goes to the website and stays
there for a few seconds. It's not including people
that land on your website, and within a few seconds, they click away, right? It's only if people visit at least two pages or they are on your site
for a number of seconds. Then sessions is the number of sessions that began
on your site or app. So how you can see a session is if someone goes to a
website, for instance, if I go to beautiful plates, which is not available anymore
because my trial ran out, but let's go to another website. This is Dutch, by the way,
but just ignore the side. This is just a live website
we use it as an example. So let's say I
land on this page, then this session
is started, right? So I'm starting my session. So if I go to Shop Now, it's the second page I visit, but it's still the same session. If I then click to a
product, still same session. So as long as I stay
on this website, I am still in one session. But at the moment, I'm one user because it's only me that
visited this website. It's one session because I
haven't left the website, but there are multiple
page views, right? So I start on the homepage. Then I went into the shop, which is another page, another T shirt, which
is another page. So there are multiple page
views in one session. Okay. So hopefully that's
clear. So you will always have more views
then you will have sessions. It's also good to
keep that in mind. So a view is a number
of page views on the website and screen views on an app in the
selected date range. So just as I said
in the example, a view is the same
as a page view. So if I visit this
page, that's one view. If I visit another page,
that's another view. Visit the homepage,
that's an extra view. So this will be three views
in one session by one user. So hopefully that makes
a little bit more sense. It's pretty easy
to wrap your head around it once you
start using this. Then we have the bounce rate. So that's the percentage of sessions that were
not engaged sessions. So an engaged session, you can click on the link to find more
information on this. Let's look at what an
engaged session means. Here we go. So an
engaged session is a session that lasts
longer than 10 seconds, has a key event or has at least two page
views or screen views. In that case, it's called an engaged session, which
makes sense, right? So if someone really
interacts with your website, we could see that as
someone being engaged. The engagement rate, sorry, with the bounce
rate, the percentage of sessions that were
not engaged sessions. So imagine there's five people going through
this website. The first two, they just completely click
away straightaway. That means that
they're not engaged. The other three, they might stay on the page
for a few seconds, so at least 10 seconds, or they visit a few
different pages, which means that they
are an engaged session. So now we have five sessions out of which three were engaged. So we have engagement
rate of 60%. Alright. And a bounce rate of 40% because two out
of the five left, so it means they bounce. All right, so the bounce
rate and engagement rate, it's going to give you
amazing information on how a web page
specifically is performing. So later on, when we add a few pages here or when
we look at the page title, we can see per page how
many people actually leave straightaway and how many people engage and continue
their session. So really good information. Next up, we have average
engagement time. So this is the average
engagement time per active user for the
time period selected. So that means that anyone who is an active user meaning
they stayed on the page for 10 seconds
or they visited multiple pages or there was
a key event that activated. They are active users. So out of those, we want to know what the average
engagement time is because this tells us about yeah how much time people
really spend on your website. And it excludes the people
that leave sight away. So it's going to give
you a great number of the people that actually
engage at your site, you know, how long
they spend there. Next is View per sessions, which is the number of
app screens or web pages, your users viewed per session. So if you recall,
from the example, if we go to this website,
our session starts. So this is one session.
We click on a few pages, so we have a few views now. So what this does, the
views per session, is just calculating
how many views on average people spend on
the website per session. So on average, if
people click on three different pages
and then they leave, that means that the
one session with three views is three views per session, if
that makes sense. Of course, this number is
never a whole number because some people have four views per session, another one
might have three. So the average views
per session will be 3.5, if that makes sense. And this really tells you a lot about the website in terms
of buttons and the menu, because if you have an average of maybe 1.2 views per session, that means that hardly
anyone is clicking anywhere else when they
visit the page, right? So imagine a page has
one view per session. That means that there's
probably no way for anyone to continue to
another page on the website. For instance, if we remove this header now and
remove this button, and that's the only thing
that's on this page, then there's no other way that there's one view procession because people literally can't go to another page
of the website. So views procession really
tells you a lot about the page content and
whether people are likely to click through
to another page or not. Then we have event count, which is the number of times
users triggered an event. So we haven't talked about
what events are yet, but I will handle this
in a future lesson. You can see an event
as, for instance, someone viewing the page that
sends a page view event. But you can set up
events however you want. You can set up an event for
people clicking a button, people clicking
anywhere in header, people starting a checkout or adding their
payment information. Those are all called events. So if you've set
them up correctly, you should be able to
see events that pop up. And then in GA four, you can specify events if you think they
are most important, and you can call
them key events. I will show you that in
the admin settings later, and key events
could be purchase, could be add to card, could be some pages that
are very important to you. So it's always good to know how many key events
fired on your page. I know it's a lot
to take in at once, especially if you've never heard of any of these
metrics before, but I assure you that once we
dive more into the reports, and I'll show a few examples, these metrics will all start
to make a lot of sense. All right, so those were
the most important metrics that I always refer to. Let's now have a look at the
most important dimensions.
30. Dimensions to Understand: Right, so let's
have a chat about the most important dimensions. As I mentioned in
the previous lesson, I added the most
important ones here, so they should now pop up
here under the drop down. However, this specific property doesn't have any
data to work with because I edit it to a website that I just created and no one's visiting there. So for us to understand
these metrics, I'm going to use the
demo account here. So again, you have to go
to your demo account. If you've saved this
in a previous lesson. Then under reports,
we're first going to go to engagement and
then pages and screens. Right, so let's go back to our report here and have a
look at the first dimension. So page title. Let's find
this page title here, page title and screen name. There we go. So
the page title is the SEO title that you
give to a page, right? So if we, for instance, go to a random product here, this page title
will be this one, which is ach Thirt something that you probably won't
understand because it's Dutch, but you can see this
as the page title. So in GA four, you will see this coming up
as the page title. The next one is Page
Path plus query string. So we can click
here and then say Page Path. It doesn't
show up here. It says Page Path in screen
clause, which is also fine. And here you can see it always starts with a forward slash. That's because this is the
page path from a website. So the way that a website is structured is you got the HTTPS. Then you've got the domain
name or the host name. And then as soon as the
first forward slash starts and the last one ends here, that means that this is
the page path. All right. So for the demo account, the page path here is
fordlash Checkout. And just be aware
that in GA four, it always removes the
final forward slash because it doesn't really
matter if it's there or not. I will just go to
the same website. Alright, so that's
the page path. So this is a good
way if you want to, let's say, search for a page
path that includes shop. We just typed it in, and now we have every single page path
that has shop in there. So it's really easy way
to find a few pages, yeah, just with one filter. Then the next one
is the host name, which doesn't show up here. But as I just mentioned,
the host name, it's pretty much the
same as the domain name. There's a little bit
of a difference, but it doesn't
matter for us now. The host name you can
just pretty much see as the website and then.com
or dot.net or whatever. So if you select host name here, it will say to you
in this example, suclos.com. I would
just say there. And host name is
really important if you have subdomains, right? So maybe there's like you
have shop.suclos.com or store or maybe discount or something because you
often use subdomains. If you're running like sales or maybe like
a Black Friday sale, you would have like
friday.solos.com. So, so that's a
really important one because you want to filter
that out in GA four. So that was host name,
the third one here. Next one is the Landing
Page plus query string. So for this one,
we're going to go to Engagement Landing Page. And the landing
page pretty much is the first page that people land on when they
start their session. Right? If I Google for this brand solos and
this one comes up first, then this is the landing page. But if I, for instance, click on an ad that has this T shirt, and this is the first
page that I go to, then this is the landing page. So it's important to understand
which pages people go to first on your website because then you can
optimize for it. Alright? So that's Landing page.
So for this example, the landing page is
always specified as the page path and
not the page title. So that's important
to understand. So a lot of people come in through the homepage
because that's just one foward slash means
that there's nothing behind. A lot of people come in through this product
page specifically. So maybe there's a ad
that's running for this. A lot of people come through
to the shop family day. So in this way, you can see what the first page is of a session. Next up, we have session Source. I explain the source
medium campaign and content the next four. I'll explain them in
detail in a future lesson, so I'm just going to
skip them for now, but I will show you
where to find them. You can find those
in acquisition and then traffic acquisition. And here you will see source session medium session campaign. So yeah, again, there will
be a future lesson on this because the
source, for instance, it allows you where people it allows you to see where
people come from, which is really,
really important. Therefore, I created a
separate lesson on this. You will see it at the end of this section. But
that's where to find. So after the session
manual ad content, we have event name. Events are, as I
mentioned before, just something that
happens on your website, and there are a few
standard events, but there are also custom
events that you can set up. So here we have event name. You can see the page view is the most occurring event
with the most event count because this one
fires at every single page. So this is a new page
view. This is a page view. Wherever you go, you
have a new page view. So that's always
the most occurring. Then there are a few
other events, but again, there's a separate
lesson on evens as well because it's really
important to understand this. But just know that
you can find this under engagement
and then events. And the last one is
device category, and we can find this under
tech and then tech details. And then click on
Browser here on the Drop Down and select Device
category because this is going to give
us information on the device that people are using when they
visit your website. So as you can see, mobile
is still the most popular, then Desktop coming at
a close second place. Still quite a few people
that go on their tablet. And then I think
Smart TV was recently added, which is, yeah, it's not important for
us now because it's only 13 out of almost 60,000,
so we can ignore that. But yeah, so I use
device category a lot because I want to know how many people are coming from mobile compared to desktop, because the mobile website is often very different
than a desktop website, and it's really important to understand which one you
should optimize for. Because if 80% of
users are coming from mobile and only
20% from desktop, that means that you have to keep mobile in mind when you
are designing your website. So it may look great on desktop, but if we look at
it on mobile here, then yeah, it might look
a bit different, right? Maybe this text is now over
this little church here. And yeah, so if 80% of people
are coming from Mobile, you want to design
with mobile first. I hope that makes
sense. Yeah, again, we're going to go through all of these with the
examples later on, but just know that this
is a very important one, and you should be able to
find this in GF. All right. So those were the most
important dimensions. Of course, there are
more dimensions that we can look at, for instance, the age or gender or maybe
operating system platform. There's just a lot
you can look at, but these are the most important
ones that I always use. So hopefully, that was helpful. And in the next few lessons, we're going to dive
into the reports, and we're going to
find all of these again and see how they
give us some good data.
31. Library & Saving Reports: So if you created
the same report that I just did with the
dimensions and the metrics, I'm just going to give
you a quick tip on how to save this and how to
find this in the reports. So as you can see here
on the top right, you can hit save, and you can either
save changes to the current report or
save as a brand new one. So what I'm going to do
is save as a new report, and then I'm going to call it common metrics and
dimensions. Just hit Save. And now it says here,
report saved in library. So if we then go back and
we click on the Library, you should see it on top here, which is common metrics
and dimensions here. So if we click on it, we open up this report again.
We can make changes. But what we want to do
is we want to add it to a collection because this here
on the left under reports, these are all
called collections. So as you can see,
life cycle here, it says Life cycle here
under Collections. And User is a collection
that's also displaying here. The business objectives,
they're not published. These are also standard reports, so we can either publish
that so it shows up here or we can actually create a new
collection ourselves. So what we're going
to do is create a new collection
and click Plank. Then here we can give it
a title on the top left. Let's call this common Reports. As a topic, let's just
say common reports again. Woo. So here we can search for reports
that we just created. So we can see here common
metrics and dimensions, and we can drag and drop it right here under common reports. Then we want to hit Save. So now it's saved to the collection. So if we go back now, we should see a new
collection right here, which is called Common Reports, and then we can click on the
three dots and hit Publish. Cool. So now we
see common reports and then another drop down, which shows common
metrics and dimensions. So now we can actually use this report that
we just created, and we're just a few clicks away in jumping into this one. So really, really helpful if you want to create
custom reports, and you want them to show
up on the left here. So that's a very
important thing to know. So again, because we are in a property that
doesn't have any data, this is not really going
to help us right now, but it's really important
to know that if you start getting data
to your property, then you, of course, want to be able to create your
own reports here. Alright, so now let's look at some standard reports
in the next lesson.
32. Reports I use the most: So out of the standard reports, this is what I'm using the most. So under life cycle
and acquisition, I use user acquisition a lot, as well as traffic acquisition. So the difference
between the two is the first one looks at users, and the second looks at traffic, which is usually
defined by sessions. Right? So as you can see
here, this dropdown, everything is about first user, and then for traffic, it's actually about the session. So sometimes it's
interesting to find out what the behavior
is of certain users. Let's actually dive into the
demo account here for this. So again, we're going to go to acquisition user acquisition. And let's have a look at
where people are coming from. So it's now set to the first
user primary channel group, which is automatically putting the source in some
different categories, for instance, organic search, which could be Google,
could be Bing, could also be YouTube,
organic shopping, which are Google
shopping campaigns or shopping organic paid search, which of course is Google
ads or Bing ads, Yahoo ads. And then we have paid other organic social A
lot of these things, they pretty much are
straightforward. So direct, it's
important to know. Direct is when
people actually type in the website in the
address bar, right? So they actually go to your website.com and then hit Enter. Because in this way, Google doesn't know where
people came from. They actually went
directly to your site. Another way to do this,
if you have them saved in the bookmarks and then
you click on your bookmark, it also means that it
is a direct source. So very important to understand. Referral is another one
that's really important. So referral means
that someone else linked to your website and
people clicked on that link. So let me just give
you one example. Let's say we Google for how
to increase website speed, and we just click on a random
blog, like from HubSpot. Then inside this blog, there are a few links, right? And some of these links, they might go to a
different website. So let's find one that goes to another website. Here we go. So this link here, we can copy the link is actually
going to kinsta.com. So it's referring, it's referring
from HobSpot to Kinsta. So if someone clicks
on this Link, then KinstA they will see a
page view in their GF four, and they will see that
the source is actually referral because they got
referred by another site. So hopefully that
gives a little bit of insight into these
channel groups. Something else that
we want to talk about is the source and medium, but I will talk about this in
a future video about UTMs. Let's go to traffic acquisition now, which is another one. So instead of looking at
where the user came from, it's actually looking at
where the session started. So this could be a
little bit different than the user report,
if you understand me. So this is where a user
initially came from, whether that's their
fifth session or their first session or
the eighth session, it just looks at the very
first time they went to your website and then it checks where was
that coming from? And traffic here, which has the session source or the
session primary channel group, it looks at that specific session where someone came from. So it's a little bit of a
difference between the two, but both of them will
kind of give you a good idea of where
people are coming from. Then under engagement,
we have events where we can see which event got
fired, how many times. So again, there will be
a separate lesson on explaining events
in this section, so keep an eye out for that one. Then under pages and
screens, this one, pretty much I use the most because this gives
you information per page and then gives you some metrics about
that page, right? So again, as I gave an
example about the shop, let's have a look at how every
shop page is performing. And then I might sort this by average engagement time and see which pages just really
are not performing well. So all of these have
just a few views. So let's just scroll until we get a few pages with
a bit more views. For instance, this one. So forges Canada, Forges Shop, and then under the
apparel section, the men's Unisex item, I had quite a few views, but the average engagement
time is only 6 seconds. Alright? So the first
thing I would do is check out this page and see what's going wrong here because 6 seconds it's not much, especially if you compare it to, you know, the best
performing pages. Which have about 41 seconds
or even higher 1 minute 27. So yeah, so this really
gives you an indication of which pages you
probably want to look at and see if there's
anything wrong with them. They might load very slowly. They might have been broken. Some links might be broken. So it's a great way to find some information
on pages specifically. Then another one that's
really interesting to look at is the
use per user here. So, the more views per user, the more people click through
to Next pages, right? So let's look at what
the most views have. So three will be the maximum, but we can pretty much ignore every page
that has a few views. I will talk about filters later in which we can filter
this stuff out. But let's say this
shop family day page has 2.25 views per user. That means that a lot of people that enter
through this page, they click onto ANExPage. But the average engagement time for that session is
actually pretty good. So my guess is that this
page actually links to another page where people can probably check out or put
an item into the card. Yeah, that's the views per
user kind of in action here. Another report that's
important is the Landing page, because we want to know
which pages people actually enter when they
come to our website. So a lot of people here, they enter through the homepage because they have
the most sessions. A lot of people enter through
a page that's not set, so it doesn't know
which page that is. My guess is that this
is an error because it also has zero new users,
but 28,000 users. So let's remind ourselves that
this is the demo account, and the demo account
is not 100% accurate. You probably won't see this too often in your actual
GA four account. Yeah, so this is
really telling us which pages are people entering. So it's important to understand. For example, there
might be one page that specifically is
performing really well and people are always
entering through that page. Then you want to have a
look at the source of that page and just see where
people are coming from. So we could actually do this if we just search for this one. Oh, yeah, this is another
thing with GA four. It doesn't allow you to copy
that stuff specifically. You have to actually right
click and select copy. Okay, so shop apparel. Let's actually have one
that's unique here. Cool. So this single page, we can add the plus icon and
then just look for source. And we want the
session scoped source. So again, in my example, imagine this page is getting a lot of people to the website. Then we want to know
where they come from, and this is pretty much
the way to do that. So now we know that most of
them come from direct source. There's quite a lot
from Google as well, and there's always
going to be a few that has the not set. So you can just ignore that one. So again, this is
just an example, but this is really
the way that if you work in marketing analytics, then that's going
to be how you're going to think about this stuff. Next up, we have monetization. So again, I'm not
going to go through the ecommerce section because that's more for AG
for advanced course. But just note that if you
have monetization setup, and for some platforms, it's pretty easy like Shop
of Fi or WooCommerce, then it will appear here, and you will spend
a lot of time in ecommerce purchases because you want to know how many
items were viewed, added to the card, how many
of them were purchased, then how much revenue
did they generate. So those are the pretty
much the basic reports that I always use on
their life cycle. And then Search Console
will be a separate lesson. User attributes. I wouldn't
spend too much time here. Tech is the only one that's definitely interesting because, again, I want to know which
device people are using. So for device category, it's really important to compare the engagement range as
well as the bounce rate. So I don't see bounce
rate listed here, and we cannot ddt this because
we're in the demo report. But imagine you are
in your own property, then there should be
a pencil icon here, and you should be able
to add bounce rate here, because that's a
very important one. But for now, we can
compare engagement rates, and we can see that
people on the desktop are way more engaged compared
to people on mobile. This is pretty normal because the attention span of people
visiting on mobile is much, much shorter in general, compared to people
coming from desktop. So that's one thing
to keep in mind. It doesn't always mean that your website is at issue here, so it's good to always compare this to kind of the
industry numbers. Cool. But this will give us
a great overview of yeah, the difference between
mobile and desktop, because I can see that
mobile has a bit more users. But in terms of
engaged sessions, it's much, much less, right? So it's only when you
really go in depth in the details that you will find this stuff because
most people would say, Oh, there's just more
users on mobile, so mobile is much better. But actually, if you look
at the engaged sessions and engagement rate or even
the average engagement time, we can clearly see that desktop is performing
much, much better. So very, very important
information to find here. Cool. So that was overview of some reports
that I mostly use, as well as how to really find some
information that could be useful now that you understand the dimensions and that you
understand the metrics, and you understand how these
reports are structured. So now let's actually look at some more features
that these reports have in the next lesson.
33. Comparisons, Filters, Customizing: So these reports have a little
bit more functionality if we just get out of
the demo account and go to our standard
account here. Straightaway, we can see that the demo account doesn't have a pencil icon on the top right, and our standard one does. This is because we cannot edit these reports in
the demo account, but you can edit them if
you have your own property. So let's edit this report here. And under metrics, we can see all of the metrics
that are displayed here. And under dimensions,
we can see all of the dimensions that are
available from this dropdown. So everything about the
first user in this case. Then we can also add
filters to the report. For instance, if we want
only a certain page, we can filter on page path, maybe that contains Shop, for instance, now our
report has this filter. Then for the charts,
this is the line chart, and this is the bar chart. You can turn them
off if you want to have the table or turn them on, and it just looks a
little bit cooler. So this report template here means that the report that you currently see is
actually linked to a template that's
created by GA four. What this means is
that if GA four dits this template,
for instance, if they add a new
metric like refunds, then it will automatically
be added to your own report. Right? So any updates they make, they will be changing
here as well. So if you don't want that and you want to have full control, then you can unlink
from that template. And now it's unlinked, and
you cannot link it again. And finally, we
have summary cards, and summary cards is
just a way to create a card or just a small section of the report and
to use that in, for instance, the overview or on the homepage or
wherever you want. So there are two created
here automatically, but we can just
create a new one, and you can add any dimension like the source and any metric, such as engaged sessions, and then click on
any visualization. So let's say Barchart and you can add a separate
filter here as well. So now this card
will be available to use in the overview reports. But yeah, I'm not
using this too often. Usually, I just jump into
the report themselves. So those are the
customization options. And again, as I
mentioned before, you can just hit safe changes to current report or
save as a new report. That's important
to understand on how to edit reports themselves. And then we have some
other options where we can dive down into some filtering
and some comparisons. So for that, I'm going to go
back to the demo account, as you can see the
comparison and filter are available for both of so let's go to
engagement and Pages and screens report and see
if we can add a filter. So if you recall from
a previous lesson, I wanted to focus only
on things which shop. So you can do that by
typing in Shop there. But it's much easier
to actually create a filter so that you can just turn it off
and on by a click. So for dimension, we need to select what we want to filter. So we want to filter
on page path if we're going to filter
on which page we want. And if we click on this and then the match type,
there's a few options here. Do not worry about
them too much. Just think about what
makes sense, right? So if we only want shop, we want to have exactly matches, and then type in Shop and
click the page that we want. Let's see if it comes up here. There might not be
a page for this, actually, because this is the demo account, so
I'm not very sure. So let's just go shop
and then click New. So if we then hit Apply, we've now created a filter
so that everything here, it filters down on Shop Nu. So we can just click
on this to edit or we can click the X
to get out of there. So it's very easy way
to select some filters, it's a little bit
more sophisticated than just typing it in here. So a great example for this on how to use this
filter correctly is, let's say we want to only
see the traffic for mobile. We can do so by adding this
filter, selecting dimension, selecting device
category, and then it should exactly match mobile. Hit Apply. So now all of this
has changed and we only see the views and users
and views per user and everything here just for people that are on mobile. So really, really interesting. But we can actually go further
by creating comparisons. So if we click away from here, we click on Add Comparison, and then we want to
create a new one. There are some standard
comparisons here. So, for instance, mobile
is already selected, but I want to show you how
to create it yourself. So create new, select the
dimension device category. The match type exactly matches
mobile and then hit appli. So now we created a new
comparison, and as you can see, it automatically
compares everything between all the users and the
one that you just created. So this is really interesting if we add multiple
comparisons, right? So we want to compare
the mobile ones, maybe to web traffic. So traffic on
desktops, hit Apply. And then we might want to get
rid of all the users here. And now we actually see
a detailed comparison between mobile and
website traffic, which is super interesting. We can straightaway see that the average engagement time on the homepage is much
higher than for mobile. And this is really going to be interesting if we look at
views per user as well, because we want to know
how many people actually click through compared
to mobile and website. So for instance, on
the checkout here, I can see that much more
people are clicking on different pages on
the web traffic, so on desktop, compared
to mobile here. So super interesting
to compare the two. And honestly, I
could sit here for days just giving you examples
of how this can be used, but half of the fun is actually finding stuff
out for yourself. And in a later section
in the course, I'm actually going to go
through real world examples, and there will be a few
assignments so that you can actually find this
information for yourself. But yeah, this is really where you're going to
learn the most stuff is by just messing around
and being in the platform, just clicking on a different comparisons, add some filters, adds a second dimension, mess around with it, and that's really the best
way to learn all of it. So hopefully this gave you a great example on how
these reports are used. We talked about which
reports are here, which reports are most used, which metrics and
dimensions are important, how to create comparisons, how to edit reports
for yourself, how to filter, and
just how to really use this table and find the data that you
want to work with. So hopefully that was helpful. In the next lesson, I'm going to explain a little bit
more about UTMs, and then we're actually
already onto the Explore page.
34. What are UTMs: Let's talk about UTMs. UTM stands for Urchin
Tracking Module. So remember when
Google Analytics first bought the company
Urchin in 2005? Well, that's pretty much
where it came from. And a UTM is a way to understand where users come
from that visit your website. So let's look at
an example here. Let's say you've
posted something on Facebook about a spring
seal that you're running. Maybe you're selling
a few new plates. Your post gets a few likes and maybe someone decides
to click on it. When they click, they will go to your website where you are
selling your beautiful plates. If you then look
in your GA four, you will see one visitor
to your website. However, there's no
information on where this person came from before they arrived on your website. You simply don't know
where the click came from. And it's pretty
good information if you actually know where
clicks are coming from. So this is where
UTMs come into play. In essence, a UCM is a bit of extra text at
the end of a URL. So in our example,
this is the base URL. It's beautiful
plates.com forges SHOP. If we then add a UTM link, it becomes the same one, so beautiful plates.com slash
SOP with a question mark, and then comes UTM. So in this case, it's UTM underscore, source
equals Facebook. This bolt pit right there, that's what we call
the UTM string. And again, it's
just a little piece of extra text at
the end of a URL. This link will send people to the exact same destination as the URL without
the UTM, right? So both of those will actually
go through to your shop. However, one of them will just have a bit
more information. So in GA four, if you're using UTMs, this is what you
will be able to see. You will be able to see from
the page forward slash SHOP, you will have eight views
from the source Facebook. And from the same page, you might have two views
from the Instagram source. So this is great information
if you want to really know and understand how your
campaigns are performing. And UTMs are pretty much essential to any Google
Analytics setup. So in addition to
just the source, there are other
bits of information that you can send
through to GAF. For instance, with Facebook, you can post something
on your timeline, but you can also run ads
through Ads Manager. And for both of these sources, they will say Facebook. However, of course, we want to know the difference
between the two, right? So, in addition to source, we also use UTM medium. So this usually is
either organic or paid. Now we can differentiate
where the source came from, and we can also understand
what the medium was, if it's organic or if it's paid. But what if we're running
multiple campaigns, and we really want
to know which one is getting the most clicks, and that's why we used the
third UTM called UTM campaign. Using the combination
of these three UTMs, you will know exactly where
the clicks came from. There is also another one called UTM term to understand the
keyword that was clicked on and UTM content to understand which content specifically
someone clicked on. So this could be maybe you
have a few campaigns running, and in these campaigns,
you have multiple ads. The content will allow
you to understand which specific ad was clicked. So these are usually
used as well, but for the sake of simplicity, we will just use
the three for now. Let's look at a few
examples of UTMs. So we could have UTM
source being Facebook. The medium could
be organic because it's just a post that we
posted on our timeline, and the campaign
could be Spring Seal. And keep in mind that all of
the UTMs always have to be lowercase and make sure that there's no spaces
in between, right? So spring seal would have to
be spring underscore SEL. Another example could be the
source would be Instagram. Our medium would be CPC, which stands for cust per click. In other words, this is
just a paid ad campaign, and the campaign could be
AdSetUnder score four. A. We might not know
exactly what it is, but we'll be able to find
this in our meta ad platform. It's pretty much very
open in what you add for source medium and campaign as long as it makes
sense to you. And the final example could be, maybe we have an email that
we send out using Milhim. So the source could be Milhimp. The medium could be email, and then the campaign would be the weekly underscore
newsletter. So in this way, we
know exactly how many clicks our weekly
newsletter generates. Cool. So let's get back
to our first example, which was the
Facebook post that's organic and from
our Spring Seal. If we add these UTMs
to the final URL, the URL becomes beautifulplace.com
forward slash SHOP. And then the UTM source would be Facebook put an sign if
you want to add multiple. So it's question
mark UTM source, then the sign UTM
medium equals organic, and the UTM campaign
equals spring seal. So as you can see, the URL
got quite a bit longer here. So just a reminder that
shortening the link using, for instance, Bitley or
Google, that's okay. UTMs will still be intact. Alright, so let's get back
to our very first example, our Spring seal
post on Facebook. If you look inside the post, you'll be able to see
that we just added our UTM tags to the final URL. So let's say someone
clicks on this link now, which still takes
us to our shop, we would be able to see where the click came from. And
it doesn't stop there. It's even when people
click on the link and then proceed to check out and buy something
from your website, you would actually be able to see where the sale came from. So this will allow you to
really pinpoint where you get the most sales and pretty much
if it's worth your money. So again, what we've
learned is that UTMs allow you to see
where a user came from. It allows you to measure
campaign effectiveness, measure cost per click, measure cost per sale, and measure the length of sorry, and decide if it's
worth your investment.
35. UTM builder tool & Sheet: So now we know what UTMs are and how we can find
them in GA four. Let's look at how we can
build a UTM ourselves. So in order to do that,
we're going to use the campaign URL Builder
by GA Def Tools, which is Google Analytics
demos and Tools. And it's very easy
here to create a UTM because all we need to do is fill
out the fields here, and then it's going to
generate a URL automatically. So let's say we are running a campaign specifically
for a sweater here. Let's pick one with an
easier name to pronounce. Have and sweater. Here we go. So let's say we are
running a campaign here. What you want to
do is you want to copy the page that you're
sending people to, which is the product
page in this case. Then we can paste this
here on website URL. And now we can add
campaign source, medium and campaign name. So for the source, let's say we are posting this on Facebook. So we'll give it
Facebook as a source. Let's say this is
an organic post. So the medium will be organic, and then the campaign
name would be Black Friday because maybe we are running a Black
Friday, so Cool. So now here below, you can see that this
is a generated URL, and we can simply copy this, and then we have our UTM
automatically created. So again, as you just learned, this is going to be the page that you are sending people to. And then when the question mark starts is when the
UTM start as well. So the source equals Facebook
because we just filled that in UTM medium would be organic, and the campaign
is Black Friday. So now if we go to this page, we know that everyone
who went here, they came from this
source exactly. So let's do another example. Maybe we want to send people
through the sale page, so we can just copy this, paste it here instead of
the website URL. And now we have the
exact same UTM, but this time, people
are going to seal. Maybe this is going to be a ad, so it will be paid,
for instance, or Cos per click. Let's do paid. And then is going to be the
Black Friday Sal as well. So now we have a
completely new ARL. This one's going
to the Sale page, and we know that anyone
who clicked came from Facebook from one of the ads, and this is for the Black
Friday campaign. Cool. So now I guess you get to drill on how to create UTMs here. Because some of you might generate a lot
of different UTMs, maybe you work for an
agency and you are running multiple campaigns
from several sources, it can be very confusing
which UTMs are already there. So I created a UTM
tagging sheet, which I also use
on a daily basis, and this is pretty much doing the exact same thing
as the URL builder, but it's all done
in Google Sets. So again, I'll add this in
the resources to this lesson. So the way this works,
it's pretty much the same. We just need to copy a
URL here and just paste. Then for the source, we
can select one of these. If there's a source
that's not in here, you can just click the pencil
icon and add another item. So let's say this will
be a Facebook ad. The campaign would
be Black Friday. And now it took the source
automatically here. The medium will
be Cost per click because we selected Facebook ad. If it's Facebook post, it will be organic,
as you can see. And then the campaign
will be Black Friday. So it's automatically
adding a dash, as well. So it's all UTM friendly. And here will be the final URL. So you can just
copy that, and it's the exact same thing as when we use it in the
campaign URL Builder. So as you can see,
very easy to use. And in this way, you
actually have um, you can actually see all
the URLs that you're using. So maybe this is
a Facebook post. Maybe you're also running
Instagram ad for Black Friday, maybe a Linked in ad
for Black Friday. So yeah, you get to drill. Now you have all these
UTMs in one place, and you can just copy and
paste them very easily. And one of the benefits as
well is if you're working in a team and you're not 100% sure what the UTM
campaign name was, for instance, you can just go to this sheet if
everyone has access, and then you can
already see if someone created one and what they
used for the campaign name. Cool. So very helpful sheet. You can find it in the
resources for free, and this is definitely going to help you with your
UTM management. So I hope that was helpful.
This is going to be the end of the section
on the reports. We've learned pretty
much everything you need to know about the reports, including the filters,
the comparisons, how to edit, but also
how to create UTMs, which is a very, very vital
part for any market here. In the next section,
we're going to talk about the Explorer section where we are creating our own custom reports.
So good luck with that.
36. Coming up: Explorations: Okay, so now that we've warmed up with our standard reports, it's time to get into the
nitty gritty custom reports. Now, it's a really
big difference because the standard reports, it kind of tells you what
it wants to show you. But with the custom reports, you are forced to think about what is it that
you want to measure? Which questions do you
manager or clients have? And how do you answer them? Well, you just build a
custom report for it. So if you're ready,
let's get going.
37. Explore vs Reports: So before we do a deep dive
into the explore section, it's always good to understand the difference between the two, because on the first glance, it looks like
explorations are reports, but then reports are
also just reports. So what's the difference? Well, the main difference
is within customization. So in the report section, all of these are
predefined reports, so they were created
by someone else. And they are pretty much
used as a template. So you can change a
few things around, such as the metrics or the dimensions or maybe
the date range here, but it really stops there
in terms of customization. It also makes it more user friendly and easy to
use because you can just with one click jump into a predefined report and kind of find what
you're looking for. Was explore, so we will
call them explorations. They are a little
bit more advanced, and you have a lot
more customization. So with this, it's
also a little bit more advanced because you have to set up everything
yourself manually. So you really need to know exactly what it is that
you want to measure. It's really helpful for answering specific
business questions, whereas reports are more helpful for getting an
overview of something. Alright? So now that we
understand the difference, let's look at how we can
create our first exploration.
38. Creating an Exploration: So it's really easy to
create an exploration. There are a few options here where we can choose a
template to start with, such as the user Lifetime, segment overlap, and all
of them that you see here. But normally would just start
with a blank exploration. So we can just click on
Blank to create a new one. There's also a template
gallery up here in which we can find some templates that are created by Google. And below here are all the reports or explorations that we
have created so far. So again, this is
the demo account. So if you create explorations, they might just disappear. If you want to create explorations
that you want to keep, you have to go into your
own GA four property. So the way we want to create it is usually we
start with blank. So let's just click
on that. And that takes us into the
Explore Builder. On the left here, we have
variables that we can add, such as segments,
dimensions and metrics. And then from these
that you select, you can drag them into
the settings here so that they display on the right where your table
eventually ends up. So let's try and set up a few dimensions and metrics so that you get the
drill of what it is. So four dimensions, we
click the plus icon, and this is going to give you
all the possible dimensions that we can use for our report. So let's go to page screen
and just pick the page path, click on Import, and now this dimension
will show up here. So for metrics, let's
pick one as well. Let's go to session
and then sessions. So now we have the
dimension page path and the metric session. But in order to build our table, we still need to drop it
into the rows and columns. So for the dimension,
let's put this. We want to have this
on the vertical here, so that will be on the rows. And then for the metrics, we want to have them displaying beside it as the values, right? So we can put that in values. And now our table
automatically gets created. So now we see a list
of our page paths, as well as how many sessions
for each page path. So that's the most basic
table I can probably imagine. There are a few more options, so I'm just going to go through
them in the next lesson.
39. Overview of Explorations section: So now that we know how to
create our first exploration, let's look at some other
options that are available. So besides the
standard options here, where we can change the title
to our first exploration. And of course, there's
the date range here. There's also segments, but we'll go over this in a next lesson. And then, as I
mentioned, we have their dimensions
and metrics here. But the most important
part here is the technique because there are a number of different reports
that we can create. If we click this drop down, you can see we have freeform, cohort, funnel, segment,
path, and user lifetime. So currently we are on freeform, and each technique comes with their own set of
visualization tools. So free form has a
table, a doughnut chart, a line chart, scatter plot, bar chart, and the
Geomap function. So this allows us to really pick what we would like
to see in our report. Then we have segment
comparisons, which we can use after we
selected a segment here, but there's a separate
lesson on that one. Again, there's the rows in
which we can put dimensions. There's some options
for the rows, how many rows we want to pick. Maybe we want to have
25 instead of ten. There's also an option to nest the rows if you want to
specify a little bit further. Then there's the
columns option if we want to add some
columns on top. Instead of just the rows, we can have some columns. So maybe we can do
that by checking. Let's just look for device. And go to device category. And let's put this into columns. So now we can see we have the
page path here on the rows. We have the device
category in the columns, and then eventually the
values are all sessions, we can see desktop sessions for this page or mobile
sessions for this page. So in that way, you can specify
it a little bit further. Again, you can
change the amount of columns and the
start column group. Then our values, we can also drop in multiple values here. So instead of
sessions, we can put engagement rate or in
addition to sessions, rather. And now we have the device
category in the column. We have the page
path in the row, and we have two different
values in the sorry, we have two different
metrics in the values here. So now we can see desktop
sessions for this page, but also desktop engagement
rate for this page. So you get to drill.
The more you add here, the more complicated and
detailed this report gets. So I would always
recommend try to keep it as easy to
understand as possible. But there will be
cases where you have to set up reports like this, and you just are a little bit overwhelmed with
all the data available. But if you know exactly
what you're looking for, it's really going to help you. Then for the cell type, we can change this
from bar charts to plain text or even heat map. So that's all about the
values displaying here. And right at the
end, we can also select some filters
for the report, but this will be handled in
a separate lesson as well. Cool. So now we know all
the options available. Let's look at some of the visualizations
for the free form.
40. Free Form: So let's look at what free form has to offer in terms
of visualizations. So first of all,
let me just remove a few things here because it's getting a little
bit cluttered. So I just want the page path, the device category,
and the sessions here. So let's have a look at
the doughnut chart now. So as you can see, if
you click on this, the table on the right
changes as well. Currently, it's set to
break down by page path, and then for the values
still at sessions. So instead of showing
it on a table view now, we're looking at it
as a donut chart. It's actually a bad example because it should
add up to 100%, but I'm sure that
with Page Path, there's a lot of duplicates, something might go wrong here. So instead of page Path, let's just get device category. And now we can see
clear overview of how many are from desktop, mobile, tablet, and then
Smart TV and other. So it should always
add up to 100%. So that's the doughnut chart. Let's now go to line chart. So sometimes, as you can see, the visualization changes the
options down here as well, because doughnut chart doesn't allow us to change the amount of rows or the start row because there
simply are no rows. So if we go to line chart, we can actually
see a new option, which is granularity,
which is kind of what we use in the report
section as well. It just filters it by day or hour or week, whatever
you want to look at. So currently we have our
date range to 28 days, so I would say that
the granularity of day is fine with me. But let's say we put
this to last 90 days, then all of a sudden,
if you have day by day, it can get a little bit weird. Although it's pretty cool that you can now see this spike. So it could be helpful. Again, just messing around will give you some information. We also have lines
per dimension. This is not really
relevant because we have only one dimension with four
different options here. But if you have more, such as page path then we could say we want 15
different pages to show up. But then, yeah, as you can see, it's going to get a little
bit crammed down here. So kind of use this
as you see fit. Let's go back to
device category. And then here, just as we saw, there's an anomaly detection,
which is pretty cool. This is still learning, so it's not really going
to be consistent, but it's pretty
cool to use, right? So as we just saw
the last 90 days, we saw this anomaly here. And so if we change
the sensitivity, potentially, it might
not pick it up anymore. Still does because this
is a pretty big one. In one day, there's all of
a sudden 342% more traffic. So yeah, it does pick this up. So on the next one, it's the
scatter plot in which again, we have a little bit
different options down here. So now we have to set up
an X axis and a Y axis, and then it's going to put a dot on where the device
category sits. So to explain it a
little bit more, every single dot is
a device category, in this case, because
the breakdown is set to device category. So because there's
only four devices, we have four dots on here. And it's looking at
how many sessions does this dot have
on the Y axis. So how many sessions
does the desktop have, which is 142,000. And then on the X axis, we have how many
events does this have? So currently it's 2.4 million
events. It's quite a lot. So this specific example might not give you
great information, but it could be
helpful if we set up, let's say, instead
of a vent count, we could set up
engagement rates. So now we get more information
on how many sessions, but also what's the
engagement rate? Because the further
towards the right, the higher engaged people are. But the further up here is the
higher amount of sessions. So it looks like the more
sessions there are on the page, the more engaged people are. So that's pretty much
what we can see here. But again, I highly
recommend mess around with this until you
find something usable. And as well, just as a
reminder, later in the course, I will have a lot of real world examples
such as this one, in which I can
really show you how these visualizations are put
to use in the real world. So that was a scatter plot. Let's now look at the bar
chart. It's pretty basic. Instead of the table here, where it gives the number, it's actually
translating the number to the length of the bar here. So a high number means a
long bar on the bar chart. It's pretty
straightforward, right? So again, if we change device
category to page path, we will now have a lot
of different bars. And then we can say bars per dimension to be maybe
even ten instead of five and there we go.
So now that changes. So it's Bar hart, and then
we have Geomap as well. And as you can see, when
I clicked on Geomap, the available dimensions
changed here because not every dimension says something about
geographic information. The page path doesn't include information about where that is. In order to see that, we would need region
or country or city. So currently, we have it
down broken down on country, but we can also use region. And in that way, it's
going to look at specifically which regions
had the most sessions. So California 50,000,
Texas, 11,000. You get to drill. Currently,
we only see four points, so let's just change the points per dimension maybe to 20. And now we can see that
this pops up as well. So this is a little bit
more of an overview. So for region specifically, it's not always information
that's available. It's mostly in the
states and in Canada, where you will see the
region difference. But, for instance, if
you live in Spain, you might not get
all the different regions that are available. Just keep that in mind.
And that was Geomap. So yeah, this is pretty
cool to give you an overview of where sessions are coming
from in this case. You can also look at maybe who has the highest
engagement rate. So now it all changes,
as you can see. So all of a sudden,
there's nothing in the United States anymore. There's way more regions
here across South America, across Africa,
Asia, Middle East. It's pretty cool
to see that even though United States
has the most sessions, the highest engagement
rates are somewhere else. But just keep this in mind, and you will definitely
learn this once you work with the platform
a little bit more. Is that we're only looking
at engagement rate. So we're not taking into account the amount
of sessions, right? So maybe this region here, let me find one which I can
actually pronounce numbra. So maybe the region numbra
only has one session, and maybe that session
is super engaged. So it doesn't really tell
us a lot about this. We would have to set up
a filter now to say, maybe we only want to see regions with a minimum
of 500 sessions, and then that's going to give us a little bit more information
on the engagement rate. I'm actually jumping ahead now because there's a separate
section on filters. So that was a good overview of the different visualizations
in the free form. Let's now have a look at the
other different techniques.
41. Cohort exploration: So our next technique is
called cohort exploration. So a cohort is like
a class, right? You have the
graduates from 2012. That's one cohort, or you have the graduates of 2013 or 2014. So you want to compare how
the graduates from 2012 are doing in life compared to the graduates from
2013, for instance. So you can do the kind
of the same in GA four. So the way to do that is to drop any metric
into the values. So let's just grab
sessions here. And it'll automatically
create this table. So you can see here September
22 until September 28, that means any user that had
a session between this time, so in this week in week zero. So that means that 21,443 people had a
session in this week. However, 938 had another
session the week after, and then out of which 514
and so on and so on, right? So that means that you can compare how people
are behaving on the website and
you put them into a cohort based on which week they had
their first session. So we can also change
this to month. So if you look under
cohort granularity, we can select monthly. So the reason why this starts on September 22 is because we have this one set
the last 90 days. So if we just set this to
this year and hit Apply, we will get a few
more months here. So the way to read this is anyone who had a
session in April, which means 56,000 users, 4,000 of them had another
session in a week after. But only 382 had a session
in a month eight after this. So yeah, that's December. Right, so just a very
small amount of people from these 56,000 had another
session eight months later. So what this will
tell you it will tell you the behavior of people returning to your
website, right? So for instance, in February, we see that 44,000
people had a session, but only nine people had a
session three months after, and even four months after zero out of those
had another session. All right? So that
means that all of these 44,000 people who had
a session in February, they just didn't
come back later on. So that's pretty much
what this tells us. Now, we can look at sessions, but also we can
also sort this by, for instance, when people
added something to the card. So the coord inclusion is
to kind of filter down on all of these people and just make sure that they had,
like, another event. So let's say anyone who
added something to the card, so now we can see in February, almost 5,000 people added
something to the card, out of which 407 then had another session the
month after. Alright. So we can also set the
return criteria to add to card so now it looks at when someone added something
to the card in January, for instance, and then
out of those same people, how many added
something to the card again in February, right? So one month after January. So yeah, you kind of
get to drill now. There's a lot of different ways to kind of
look at this data. So on paper, this kind of looks like an
interesting report. However, in reality, I
really don't use this often. I just don't see any use yet in my experience where I
can really use this report. Kind of understand if you might have a summer sale
that you're hosting or an event that you're hosting in a
certain time of year. You want to see how
many of those people, you know, what their behavior
is later in the year. But that's pretty much
all I can think of. Another note here
is that because cookies on websites are
slowly disappearing, it's going to be much
harder to keep tracking people and understanding
that it's the same user, because if you don't
allow cookies, then there's no way to know if it's the same user
that actually came back. For instance, out of
these people here, in month one, there's zero left, but it might just be that
over 90% just, you know, declined the cookies, meaning that we don't know that
it's the same user. So in my experience, I think this might just
disappear at some point. I won't use too much
time spending on cohort, but maybe you have a use case, yeah, and you find
this really useful. So if so, that would be great. But my advice is to not
use this too often.
42. Funnel exploration: So next upp is the funnel
exploration technique. So if you don't know what a
funnel is, in basic terms, it's just a series of pages on your website
that people visit. And it's almost always the
same sequence of pages. So, for example, let's just
go to our webshop. So close. Let's find an item here. So from this page, if you want to go
to the checkout, you usually just
add it to the card. Then you go through
to the checkout. And then if you fill
out your information here and click Place Order, usually you will go to a
confirmation page as well. So because this
sequence is always the same from product page to card page to the checkout and then finally
to a confirmation page, we can call this a funnel. It will be really
great if we can find out how many people
actually went to, let's say, the card page, but then didn't go through
to the checkout or how many people went to the checkout and then also went through to
the confirmation page. Because this allows us to get a conversion rate for
each of these pages, as well as the entire funnel. And the funnel exploration
allows us to do this easily. So how to set this up is if you go down here
and look at steps, we can add the different
steps of the funnel. So in this case, it would be let's just
start with a with the card. So it'd be fog CRD. So we can say this
is the card page. And then we want to
specify by page path because we are looking at
the page path at the moment. And then it should, let's
say, begins with card. So again, we are in
the demo account. So these steps that
I'm using here, they will not be relevant
to the demo account, but this is how you would set
it up on your own webshop. And the next step after the card will be
the checkout page. So we can just copy this here. We named the step checkout. Again, we will specify
this by page path, which begins with checkout. And then finally, will be a confirmation page or a thank you page, as
some would call it. And you can specify this. And I think for this example, it will be starting
with thank you. Cool. So now we have
set up our final steps. Step one is the card,
two is checkout, and the third one is
the thank you page. So if we now hit Apply, we will see a funnel
coming up here. So funnily enough, it does give us some information
in the demo account, even though these page paths are from a completely
different website, but let's just run with this. So at the moment, you
can see that step one card is at 100% because
it's the first step, so it's only going to
count it's only going to count people that landed on this one, which
will be all of them. Then the second
step only has 33%. That means that one
third of the people that went to the card went
through to the checkout, and out of those, there
was actually no one that went to the thank you
page. So it's in 0%. So this gives us an idea of the conversion rates
for each page, right? And below here, you
also have a table, and you will see
completion rate. You'll see the amount
of abandonments and then the abandonment rate. The abandonment
rate is pretty much the opposite of completion rate. Cool. So now we can see on the left here that our
steps are in this funnel. You can change them around as well if you think that people
start on the checkout. But there's no one going from checkout back to the
card, which makes sense. Then again, we have some
more breakdown dimensions. So if you want to
break this down by device category,
you can also do this. And of course, you have
filters here as well. So the way it's currently set
up is we only want to see people that first went to card
and then went to checkout. And we only want
to see people that first went to checkout and
then to the thank you page. But we can also select to make
this an open funnel here. So what this does, it
allows people that didn't first go to a previous step
to also enter the funnel. So as we can see, if
we turn this off, we have two people in the card, and only one of them
went to the checkout. But if we turn this on, we
have one person in the card, and 8.3 thousand people,
they went to the checkout. The reason is because
in a demo account, they're not using card and they're not using
this Thank you page, but they are using the checkout. So it's looking at how many people also went to the checkout that maybe
came from a previous step. So it says here,
new funnel entries, almost everyone, and then continuing funnel
entries is just one. So yeah, you can use this if you think that there are multiple
ways to go to a page. So for instance,
for the checkout, some people might
first go to the card, but there might be an option, a button here that says go
straight to the checkout. In that way, you want
to make this an open funnel so it's going to include people who
came from the card, but also people who
came from that button. So for the sake of learning, let's just look at another
example here because currently we have the step
set up as a page path, right? So we looked at the page paths, and then we just
filtered them here in Go but we can also
use something else. So let's use events
instead of page paths. For events here, as you can see, there are a lot of
events that are set up and these fire
with certain actions. So for instance,
the Add to Cart, it fires whenever someone
adds something to the card. And the purchase, it fires
whenever someone purchases. So instead of looking
at the page path, we're now actually
looking at the events. So let's look if there's
an event for add to card. There we go. And we'll call
this step app to card. A new step we'll look at
an event that might begin checkout and a third step
that might be purchase. So now we created
the same funnel. We have a card step, then the checkout step
and then a purchase step. But instead of using
the page path, we are using the events. So if you hit Apply, and now we can see it's a
pretty similar funnel here, but we have a lot more data
because we are actually using some events that are set up in the GA
four demo account. So as we can see now, we have 100% that added to CRT because everyone's
starting in step one. Then 53% of those also
started to checkout, and then 40% of the people that started to checkout actually
went on and purchased. So what this tells us is that whenever someone
starts to checkout, almost half of the people
actually go ahead and purchase, which is a pretty high number. And this is something that
if you work closely with financial managers or CEOs or some people higher
up in the business, then this is really
the number that they want you to
focus on. Right? Because if you can change this
from 50% to, for instance, 60%, that means that you have 10% more amount of
purchases in the end. And this could mean that
maybe you change a button, color, maybe you change
some text around, and all of a sudden you
see this go up, then yeah, that's just a small change, but it can mean a lot of
more revenue for a business. So hopefully you now
understand how powerful this really can be
for your business, especially when you look at
the ecommerce values here. So hopefully, that was helpful. Final Exploration definitely
one of my favorites. There are a lot of different
examples I can give you, but this is, I think, the most clear and what
you can do with this.
43. Segments Explained: So before we jump into
the next technique, which is segment overlap, we first need to understand what segments are and
how we can create them. So a segment in GA four, it simply allows you to compare different
groups with each other, and a group can be created
by setting criteria. So let me give you an example. If we click the plus icon here and we create
a custom segment, which is user segment here, we can include anyone
who meets this criteria, and we can also exclude people
who meet certain criteria. So for example, if we
search for device category, and then we want anything
that contains desktop. Maybe just exactly
matches desktop. So usually, if you click this, it's going to give you the
options that are available. So let's click Desktop. So now, this segment
only includes people that have the
device category desktop. And on the right here
we see a summary. So from the users
in this segment, which is from April
18 to July 16, there were 123,000 people
that fall into this one, which is 62% of all the users. And we also see sessions here. So in total, there were 196,000 sessions that have the device
category set to desktop, which is 66.2% of all the
sessions at that time. So in addition to
the device category, we can actually set
up multiple criteria. So let's click the A button
and set up another one. So for this one, we
could go to General, and let's look at
person scrolled. So now we want to
see how many people actually were on the desktop
and also scrolled to, let's say, 90% of the page. Now we have 55,000
people in this segment. And you can see that this number went down because it's not
only looking at the desktop, it's also looking
at how many people scroll to at least
90% of the page. And all of a sudden, we're almost down to a
quarter of all users. So you can go pretty
nuts when including and excluding criteria
to create segments. Later, I will show you some real world examples for this as well. But just know that
this is the way to create a custom segment. So besides the user one, you also so in addition to user, we can also look at
session or event segment. What this means is that one user can have
multiple sessions, and if one of these sessions
meets your criteria, that means that this user
falls into that segment. But if you look at
session segment, you only look at
the total number of sessions and just look at how many of those fall
into the criteria. So one user could have
five different sessions, out of which three of them meet the criteria and two don't. In that way, you have
three different sessions, but you still have one user. And then you also
have Events segment, which I won't go
into much detail here because we haven't
learned about events yet, but just know that this
one's here as well. Then, in addition to
the custom segments, we can also use references. References are just a template that helps you build
your own segment. For instance, in the
general section, we see recently active users. So if we click on this, it automatically adds
a criteria in here, which is user engagement. So user engagement is an event that triggers whenever
someone is engaged, right? So when they at least
visit two pages, when they spend at
least 10 seconds somewhere or when a
key event happens, anyone in here will
fall into this segment, which is currently
43% of all users. So that's just an example of the references that
they provide for you. There are also references
related to shopping, as well as templates here. And then there's a
predictive section. So as it says here,
Analytics builds predictive audiences based on behaviors such as
buying or churning. This means that GAFour
uses AI and uses their machine learning to identify who is likely to
purchase in this case, or who is likely to turn. So this will give
you information on potential buyers, right? And we can actually,
if you click on this, on the top right,
for every segment, you can build an audience. And then you can
select how many days. So anyone in the
last 30 days that have a high probability of purchasing or anyone
to a maximum. And the cool thing is,
we can actually use this audience to re
target in Google Ads. So more on this in
a later lesson, we'll explain the link between Google Analytics
and Google Ads. But just now that you can build an audience based on a segment. Just one thing for these
predictive audiences is currently, it's not meant for
small businesses. I will add a link to
the documentation in the resources to this lesson
because at the moment, there are a lot of
criteria before these are able because at the moment, there's a lot of criteria before you're able to use these. One of them being that
you need to have at least 1,000 people that purchase
something on your website. So again, this is not
for small businesses. Cool. So now we know
how to build a segment. Let's actually just build a basic one so we can show
it in the techniques. So I'm going to click
on New segment. Then for the condition
device category, and then equals or
exactly matches desktop. We can give it a title saying
desktop users and hit safe. And now we can see our segment
is available here to use. Just keep in mind that segments
that you create within the exploration are not
usable in other explorations. So you would have to
create them again. But for now, we can finally use this in the segment overlap. So I'll explain that
in the next lesson.
44. Segment overlap: So the next technique
we'll be looking at is the segment overlap. So you should have
your first segment now created from
the last lesson, and it automatically added it
to the segment comparisons. If it didn't can just drag and drop just like you do with the dimensions
and metrics here. But because we only
have one segment, currently, we can't really
compare it to something. So let's just
create another one. Maybe we'll go user segment
and look for country. And we want to contain anyone who is in
the United States. Just said Save and apply. Maybe let's give it a title
US traffic or US users. And now, as you can
see, it automatically addted it to the
segment comparisons. And now we have a beautiful view of the overlap between the two. So we can see in
the middle here, these are the users
that both came from desktop and also live in the US. And on the right here,
we have US users only. So these are people from the US, but they didn't come
from the desktop. And then on the left here, we have desktop users only. So these are people
that use their desktop, but don't live in the US. And then, of course, the middle
part will be the overlap. So this should give
you a good view of the different segments. And then, of course,
we can change the values from active
users to, let's say, sessions and now we can see how many sessions came
from US from Desktop and then combine the two,
which is pretty cool. So that's the segment overlap.
45. Path exploration: So next up in our techniques
is Path Exploration. So Path exploration is a way
to set a starting point, which could be a page
or even an event. And then you can
see where people went to or what actions
they took after this. So currently, it's
set to event name, but I want to use Page Path. So what I want to do is to
start over on the top right. So just click on. Now you can set a starting point or
you can set an ending point. An ending point could
be a confirmation page or a thank you page, right? So let's say someone
ordered something from your website and they
end in the same page, which would be a thank
you for your order page. Then you can set that
at the end point and it'll work its
way backwards. You can also set
a starting point and then see where
people go from there. So in this way, we can see the journey that people
take through the website. So let's select a
starting point. So if you click on
Starting Point, you have the options
of event name, page titles, and Path. Let's just select Page Path. Now it's going to give us all
the different page paths, and it's ordering them by amount of fuss or
amount of sessions. We just need to select
our first page. Let's just select the homepage here and see where
people go from there. So now we can see that 203,000 events happen on the homepage. But maybe I want to check
the amount of users. So let me just switch this
get total users in there. So we can see that about 137,000 users started at the homepage, and then you can see here a little bit of a visualization
of where they went after. So a lot of them went to
another page that's not set, which could be the demo account just being a little
bit at fault here. But we also see that
about 5,000 people went to the shop
apparel Mens page, but also a few people to
the shop lifestyle page. There's actually 15 more
which you can click on, and it will expand and give you a little bit more
information. There we go. So you can see how many
people actually go to different kinds of pages from the homepage, which is
pretty interesting. Then the cool thing
about this is we can click on any of these pages, and it will show where people
go from that page again. So let's see the shop
apparel Mens page. If we click on that. Now, from this page, you can see that about 1,000
went back to the homepage, actually, but some of
them actually go to shop clearance or
even a product page. And here we can do
the same thing. We can click on a new one, maybe shop clearance and then from all these people,
let's see where they went. So a lot of them went to
shop Appael Mens again. Some of them went
to the homepage. Some of them went
through the checkout. So maybe we can see
where they went now. And yeah, you can kind of
understand the point here. So we can really deep dive into a journey that someone
takes through the website. So this current example isn't
really telling us much. So let's have a look
at the end page. Maybe we can start over.
So for the ending point, let's pick page path again. And maybe we want to find
something like checkout. So now what we're looking at is anyone who landed
on a checkout, where did they come from before? So a lot of them came
from the homepage. Some of them came from
the account page, some of them from the shop
page, and there's a lot more. Of course, the checkout
is a page that you can visit through a lot
of different pages. Imagine you have about 1,000
products on your website. They might all go
through to the checkout. So therefore, there's
a big chunk of people who fall into
the other category. So let's click a homepage and yeah, you kind
of get to drill. So this really allows
you to find out where people came from that
landed on a certain page. So the Path exploration
really is helpful if you understand your
website a little bit better because
at the moment, we're in the demo shop. So I'm not 100% sure which
thank you page they're using. But if you have your own webshop and you know the URL of
your thank you page, or you might have set up
some purchase events, then it's going to be much more helpful to use this
Path exploration. And again, I will
tell you all about the real world examples in a later section
of this course.
46. User lifetime: And finally, the last
technique is user lifetime. So the user lifetime
techniques shows how your users behave during
their lifetime as a customer. If you're selling
products or if you have an app in which you
have in app purchases, there is revenue going to
be generated from users, and the user lifetime gives you insight in how much value
each user gives you. So if we scroll down, we'll see a few new metrics
that we can only use here. So let's drag in
lifetime value average. And for the rose, let's say first user source. So what this gives us is the very first source
that users came in from. So imagine I'm the first time I visited your website is
from Google results. Then my first user
source is going to be Google no matter how many times I go back
to your website, and no matter how many times
I use different sources. The very first source
that I used was Google. So out of all of these,
how much value do you get? What's the lifetime value? For Google, this would be $1.58. And there are a few other sources here
that I'm not sure about, but this just looks
at how many people came from Google the first time and how much revenue
is generated, and it's just going
to divide the two. And that's how it gets
the lifetime average. Again, really helpful
if you have a webshop. If you're not selling anything or you're not
generating revenue, then you will never use this. But it would be nice
to have an insight in which sources are generally
giving you the most revenue. I mean, that's something
that any CEO or CFO is just very keen
to understand because if you see that users from Bing have three times
the lifetime value average, then you know that you
can spend your money on Bing and make sure that you
get a good revenue from it. So that's just an
example here of how to use the user lifetime. And with that, we went
through all the techniques. Again, just if you
understand what they can all do and understand their biggest
strengths and weaknesses, then I'm sure you'll be able to find what works best for you. Usually, I work with freeform as because it allows me to
pick different visualizations, and there are just a lot
of different options here. So hopefully that was helpful. In the next video, I will
talk to you about filters.
47. Filters: All right, so let's
talk about filters. So it's pretty straightforward. If we go to exploration
and we scroll down on the second bar,
we will see filters. So what we can do is
we can either drop some metrics in or a dimension, or we can just click on
this one and then just select from the ones
on the left here. So if we just build
a simple table using device category
as well as sessions, then we'll see, yeah,
how many sessions per device category
on the right. But let's say I only want to see this for a certain region. So what we can do
is we can click on filters or we can drag
region two filters here. And then you want
to set a condition. So we want to have a region only showing if it exactly
matches New York, let's say. So if you see here, when you
click on this empty field, it's already going
to give you the options to filter, right? So these are the regions
that are available. You can also type this in. So New York, and then
you can click on here. So if something doesn't show up, so let's say we type
in some random thing. So that means that this is
not an option to filter, right, because it
just doesn't exist. So let's just go for New
York, and then we apply. So now as you can see, the numbers went
down because we are now only looking at sessions
per device category, where a region is
exactly New York, right? So let me just give
you another example. We can also filter by a metric. So if we drop on sessions here, and we want to say we
only want to see sessions where it's more than 200,000. So if we just look
at the table now, we see that the tablet has less than 200,000 as
well as smart TV. So if we apply, they
should disappear, right? Let's click Apply.
And there we go. So now we're filtering
where sessions have to be more than
200,000. All right? So this is super powerful, especially if you want to kind of clean up this data already. So let me just give you an
example of what I mean, right? So instead of device category, we're actually
going to go to page Path and then have
sessions per page both. Currently, it's only
showing ten rows, but let's click to 500. And now we have a huge list of all kinds of pages with a
certain amount of sessions. But what if I only want
to see, let's say, pages with sessions
1000-2 thousand? I'm going to just create
a filter for sessions, and then it should
be more than 1,000. Hit apply dragon
sessions again and say it should be less
than 2000. Hit the plane. So now we have the
exact same table, but we're looking at
sessions that are less or pages with sessions, less than 2000 or with
more than 1,000 sessions. So now all of a sudden, we have a little bit
more focus table. Another great example instead of filtering on sessions is, let's filter on bounce rate. So let's select it
here. Bounce rate. Because sometimes I want to see page with a high
bounce rate, right? So let's drag this into values so we can actually see
the bounce rate per page, and let's remove sessions. And now we want to sort on
bounce rate high to low. So now, as you can
see, we have a lot of pages that have
100% bounce rate. But of course, these pages only have
a few sessions, right? They're not really, it's not really useful for us to
look at all of these pages. So what we might
want to do is we want to filter on pages with a high bounce rate that also have a minimum of
1,000 sessions, right? So let's drag in sessions here. And we cannot drag it into
filter because we have to put into values first so that
it shows on the table. And now we're actually able
to filter on sessions, right? So just drag it in there.
And I want to say, we want to filter on
pages with more than 1,000 sessions. So we
want to hit Apply. And as you can see now, now all of a sudden we see pages with a high bounce rate that actually have quite
a lot of sessions. So what this means is
all of these pages, they get a lot of visits because they get more
than 1,000 sessions, but they still have
a high bounce rate. So these are pages
that we want to fix, and we want to see what's wrong with them because apparently, people are leaving quite fast when they get onto this page. So yeah, this is just an example of how you can use filters. And this exact example
is actually what I'm using quite a lot of the time when I'm looking at pages
where we can optimize. I just filter on a
minimum amount of sessions or a minimum amount
of users or even views, and then have the bounce
rate set from high to low. And now you have, you can give this top 20 pages to
maybe like a developer or a marketer or maybe yourself
if you do that and just see how you can optimize those pages and yeah,
reduce the bounce rate. Hope that was helpful. Filters, you'll
definitely be using them. So yeah, now you know.
48. Sharing and Exporting: So there was this
section on explorations. I hope you find
that really helpful and understand that
you can create your own explorations to get a deep dive into the specific data that
you want to look for. So they are a bit
different than reports. There's also no way to add these explorers to
the report section. So they really live here
on their own section. There is a way to share them. So if you go into Explore, there is a button here to
share with other people. So just keep in mind
that you can only share this with people that have
access to the same property. So, for instance,
for this Google Demo account, I cannot share, but for your own
created property, you can actually click this
button and then hit Share. So now this
exploration is shared with all the users
within this property. Another tip is that you
can click Export Data and you are able to download it into sheets or any other
file format here. Could be helpful in some ways. And the final tip is that there are multiple tabs
that you can add here, so you can have a free form
as well as some others. And you can just build out a single report with
multiple tabs. So hopefully that helps and good luck creating
your own explorations.
49. What are Events: So let's finally
talk about events. We've seen it quite a few times already
throughout this course, such as here in event
count or key events, and they're very
important to understand because GA four is event based, which means that it's gathering data based on something that
happens on the website. For instance, if someone
visits a page, so this one, then actually what happens
is that an event is firing and being sent to GA four for us to then
see in the report. All right. So this is just
an example of one event, which is called a page view. And in Gaour it will
come up as a view. So if we go to
reports, engagement, pages and screens, we'll
see views here. All right. So basically what happens
every time someone goes to, let's say, this page,
it's going to do plus one for the
views on this page. And the way it does that
is by using events. So let's look at
an example here. We are currently on our webshop. So if we just right
click and hit Inspect and click on the arrows
and click on On the Bug, we will now sue every event that's going to
fire on this page. So if I'm going to refresh, we can see that there's
a Facebook Pixel view content event, as well as now a Google Analytics page view
event as well. So what happens here?
It says pageview. That's the name of the event.
And on the right here, it's the software that's
firing that event. So currently, we have
one page view that fired for Google Analytics,
which makes sense, right? Because every time
someone visits a page, we want to see that page
view in our reporting. So that's just an example here. But of course, there
are many more events in addition to pageview. You can pretty much
specify anything that happens on the website and
turn it into an event. For instance, this add
to card button here. Now, this is already set up on this website, so it will work. If we click on Add to
Cart on the right here, we see that straightaway, there's an Add to
Cart event that fired. For Google Analytics. So in this way, we don't just track the amount
of page views, but we also track how many times people click on the At to
card button for that page. So super helpful information because just imagine that you have 100 different products. It will be great to know for every single page how
many times people click on the At to Card
button because that will tell you about the
most popular products. Now, an important
thing to know about the events is that they
don't just fire themselves. They need a trigger. So a trigger could be every time someone clicks on
this specific button, that means that you have to
send button event to Gao. Or every time someone scrolls
to the bottom of the page, I want you to send a
scroll event to Gao. Maybe every time someone
clicks on the Instagram icon, I want you to send a button
click for Instagram to Gao. Meaning that all of
these events will be collected and will be displayed here under
the events report. So hopefully that
makes a little bit of sense of how the events work. It's not too important to understand in the back end
how they work exactly, but you just need to know that
this is how GA four works. So something happens, then
an event is triggered, and it sends the
data to GA four. That's pretty much
all you need to know.
50. Event Categories: So another thing about
events that's really important is that some events
do fire automatically, and some events need
some manual setup. And it's really
important to understand the differences because if
you know what to track, you of course, need to know
if it's already tracked automatically or if you do
need to set it up yourself. So for this, we're
actually going to the GA four documentation. So I will put a link to
this in the resources, and this is going to
give you a list of all the events that are
possible in GA four. So if you want to learn
a little bit more, you can click on about events, and it's going to give you a little bit more information on what I just
explained pretty much. But let's look at some of the events that are
automatically collected. So if you click on
that and scroll down, here you see the event. So that's the event
name. Then here it says when it's triggered. And then there are
some parameters. Parameters are just
extra information on that event, right? So a parameter for
the page view event could be the URL
or the page path, or even the domain name. All right, so it's just
extra information. So with this, now you can read this table and we can see what events are
fired automatically. So let's scroll down and see something that's
important for us. So there's a lot of events that also just for apps,
not for websites. So here, let's say click. So this is triggered
automatically. Each time a user clicks a link that leads away
from the current domain. All right, so that means that every time you click something, so you click a link on the website that leads away
from the current domain, it means that a click
event is fired. So if we scroll down, we
will see form submit. So this triggers every time
a user submits a form. So this could be
a contact form or maybe a downloadable thing or subscribe to our newsletter, things that just has form fields and a Form
submission button. So as you can see, it
automatically recognizes forms, and it will send a
Form submit event. And then here you can
include a few parameters, such as the name of the form, maybe you submit text, form ID, and so on. Another important one
here is page view. So I just mentioned this already every time someone
lands on a page, then a page view event
is fired automatically. So it says here, each time a page loads or the
browser history state, it's changed by the active site. It can become a little
bit technical here, but the easiest to understand is just each
time the page loads. And as I mentioned, there's a few parameters
you can include, such as the page URL here, or the page referrer, which is the previous page URL. So I hope you get the drill
here that an event is fired with a trigger and includes information
for you to use. So those are
automatically collected events or at least one
of the few examples. Then there's also enhanced
measurement events. So enhanced measurement events, they also fire automatically. The only difference
is that you need to turn them on in GA four. Now, it is turned on by default. So if you create
a Gaour property, these are turned
on automatically. If you want to know how
to turn them off or on, you just need to go to
analytics, admin settings, go to datastreams, click on the dataStream and then here you have
enhanced measurement, and you just need
to turn them on. So let's look at a few
enhanced measurement events. For instance, we have
video engagement events such as video start
or video complete. So if you have a video hosted on your website and it's a
YouTube embedded video, then it now automatically
recognizes when the videos started and when
the video is completed, as well as what the progress is. So super helpful if you
want to know how many times people view a video in your
blog or on your website. So another cool one
is File Downloads, which is when a user clicks a link leading to a file
of the following types. Pretty much meaning anytime someone downloads something
off your website, it will now recognize this and you can see the data
on that in Gour. So pretty cool.
And this is really where GA four is
shining bright because it's automatically tracking
these events and giving you information on things that go
way beyond just page loads. It's actually tracking
scrolls or outbound clicks, how many people use your
search bar in your website, how many times people
watch a video, how many times they download. So it's really giving you
a lot more information on how people are
using your website. Next up, we have
recommended events. So recommended events
are events that you need to set up
manually by yourself. So they are not
tracked automatically, such as the automatic events and enhanced measurement events, meaning that you will have
to set them up yourself. So if we scroll down, we'll see a list for all properties. We have a list for online sales, which are e commerce events for lead generation
and for games. So let's look at
four online sales. In other words, e
commerce events. It says here, we recommend
these events when you want to measure sales
on your Sider app, meaning it's going to
give us more information, not just about the
website performance, but also how many sales, how many times people
added to cards, how many checkouts
were started, right? So it's going to give you
a lot more information. And these are actually pretty
hard to set up yourself. It can be quite easy if you use a webshop like Shope
fi or WooCommerce. But most of these cases, it's not going to
be 100% accurate. So again, this is not something I will show in this course, but just know that if you have these ecommerce events set up, you will get more information on the commercial side
of your website. So if you are a webshop, I highly recommend
to set these up. If you want to learn
how to do that, I would highly
recommend checking out my Google Tag Manager course in which I'll go through
the process of doing this. And then finally, we
have custom events. Custom events, it's basically just an event that you
create entirely by yourself. Give it whatever
name you want and include how many
parameters that you want. You can basically just
create an event with a name that you decide and also
include any parameter. But this is also a very advanced
setup and you need a lot of technical skill
to be able to do this. So I won't be going into
this in this course. So that's pretty much it
about all the events. Now, you kind of understand what they are and how they work, as well as the list
of enhanced events, recommended events and
automatically collected events. So I'm not expecting you
to set these up yourself, but you will encounter
them in the report. So it's very important
that you know all of. So in the next lesson,
I will show you where to find these
events in GA four.
51. Events in Reports: So let me show you where
to find events in GA four. So on the homepage, we can
already see an overview here, event count and key events, but this is just top level. We want to deep dive
in how many events were fired and what kind
of events were fired. So in order to do that,
let's go to reports. Engagement and then events. So here we have an overview
of the event name, as well as the
amount of times it fired and the amount of
users that it was fired by. So one user could fire
multiple events, right? If I am visiting ten
different pages, I'm firing ten different
page view events, but I'm still going
to be one user. So as you can see here, the most common
event name is almost always the Page View event because it fires on
every single page. However, we also have
user engagement, which is firing whenever someone's on the page
for at least 10 seconds. Then we have a few other
events such as scroll, which fires when people, you can guess it scroll
down on that page. But you can see that there are also a few ecommerce
events in here, such as view card, right? So 11 times people viewed the card in the date
range of 28 days. But of course, we want to know a little
bit more than that. So for the ecommerce events, let's go to monetization and
go to ecommerce purchases. So now we can see the item name, then the amount of times it
was viewed, in other words, this is just a page view event, how many times this product
was added to the card, and then how many times
that was purchased, right? In the last 28 days. Let's put it to
the last 90 days. Now we can see that
this T shirt got viewed 24 times out of which it was added to
the card three times, and then it was
purchased one time. And then this is
the revenue that was generated by that purchase. So with this, we
can actually see that out of the 24
people that viewed, only three of them
added to the card, which is one in eight. So we know that for
every eight page views, one person adds to the card.
So it's very interesting. So this gives you a
lot of information about which products you want
to focus on with your ads, because if there is a product that people
added to the card a lot, but it doesn't have many views, that means that it's probably
a very popular product. So anyone who does
land on that page, it does add it to the
card very easily. So that's pretty much how we can find the events here in GA four. It does show up
under the events, and it also shows up here
under ecommerce purchases. And then they are as well scattered throughout the
rest of the reports. So now, hopefully
you understand where to find these events
and how they work. Again, this is just the tip of the iceberg in terms of events setup and
ecommerce events. I can probably build
an entire course about ecommerce
events themselves, but it's important that you know the basics of it.
So now you know. And that was the end of this
section on the Explore page, as well as a little bonus
section on the events. Hopefully, that was
helpful. I really hope you can build out your
own reports now and you understand how you can
use events as well and how everything works in
the back end in GA four.
52. Dashboard - Pages overview: So now that you know
all that you need to know about
exploration and events, I'm going to show you my
favorite and most used reports, and I'm going to
build them one by one so that at the end, we'll have a complete dashboard, and we'll have kind of
my favorite reports, so you can also
use them as well. So let's start by creating a new exploration here.
You click on blank. And we're going to start
out with a traffic overview because this is usually the
most important because yeah, there's a lot of
pages on the website, and you do need to know which
ones are performing best. So let's just create a report
that allows us to see in one glance which pages are performing and which pages
might need some adjustments. So for this one, we're going
to go and select free form. So we're going to
get a table view. So as you can see here,
visual visualization table. Then on the left here, in dimensions, we're going
to select a few things. So we're going to
select page path and query string because this is going to tell us, which
page we're talking about. Another option is you can use page title if you
find that easier. But in my experience, sometimes the page titles are
not set up correctly, so you won't know, you won't know which page
you're talking about. So which page path,
which is a unique thing, you always know exactly which
page you're talking about. So page Path, Sessions. Oh, sorry, sessions would be
under metrics. So sessions. Here we go. Another
metric is users. So we're going to select
total users here. You could select active users. I just prefer total users
to get a complete picture. And then another great one
is average session duration. And as well as the bounce rate, which is super important. And if you forgot,
the bounce rate is, yeah, the percentage of
sessions that were not engaged, meaning anyone who came to the page and then
didn't do anything, they didn't click,
they didn't scroll. They didn't stay there for
longer than 10 seconds, which means that they
bounced in a way. So the bounce rate
is a great way, maybe the best way, yeah, to reassess if a page is
performing well or not. Oh, now that we have those, we just need to
chuck them in here. So on the rows, we're
going to pick page path. And then for the columns, sorry, the values, we
want to have sessions. So now, as you can see, the
table is starting to fill, and then we're going
to just going to drag in the other ones as well. So users average session
duration and bounce rate. Boom. Here we go. All right, so what are
we looking at now? We're looking at an overview of all the different page
paths on our website, in this case, on the
Gour demo website. We're looking at
how many sessions there were for each
of those pages. Then also how many total users, the average session duration. So anyone who landed on this page or visited
this page at some point, we want to know how long did they spent in
their total session. So this could be
across multiple pages. And we're also looking
at bounce rate here. So as I mentioned before, this is telling us what percentage of people that landed
on this page is actually engaged or yeah, how many people are
actually leaving the page. So we can sort this
however we want. Usually, I have it by
sessions because I want to know what the most
popular pages are. But very often, I
would also sort by clicking on bounce rate
if I'm looking at, which pages, which pages
are not performing well. Now with this one,
as you can see, pages with low amount
of sessions usually have a high bounce
rate because yeah, only one person
came to this page, and that same person also
left without doing anything. So the bounce rate for
this specific page is actually 100%. So what I would usually
do in this case, I would set up a filter and
have it click on sessions. Then I want to see all
the pages that I have more than let's
say 100 sessions. Cool. And that should filter out all those pages with
just one session. So now we have an
overview of which pages are yeah, not performing well. So actually, what I'll do
is I'll remove this one, and I'll keep this sorted
on sessions because yeah, I am showing you in this section what I would do and just my
way of doing these reports. And I would just keep
this one as it is, and I would just
say page overview. Or maybe even pages overview. Goop. And then I would
duplicate this one. And here I will do the
bounce rate thing. So I will sort on bounce rate. I would add a
filter on sessions. I would say any case
where the sessions are more than 100, I
want to show them here. Alright. Cool. So now we have two really, really
powerful reports. We have a report that shows
us the most popular pages, as well as, yeah,
some stats on them. And we're actually we
have a report that show us the least
least performing or last highest bounds.
Hi spots, right. There we go. And actually,
before we continue, we're going to give this
exploration a name, which is our full dashboard
or just dashboard. And this is what I would
use on a daily basis. I would just jump
in the dashboard, and I would just
check a few pages, probably even changing around the date range, if I want to. But yeah, these are just
great ones to start with. So in the next one, we're
going to look at sources.
53. Dashboard - Traffic source: So next up, we want to
have a report that I use also on a daily basis to see where people
are coming from. Because these first
two reports are only showing us, yeah, the stats for that page, but we don't know where
people are coming from, which is also very
important to know. So for this one, we're going to click
on the plus icon here. We're going to go
for free form again. Make sure this is on table. And for this one, instead of page path, we want to look at
session source. So in the dimensions,
click on plus and then look for session
sources medium. You could also just
select source, but I prefer medium because source is just
going to say Facebook, for instance, but we still don't know if it's like a post, if it's an ad, if it's just
yeah, just a referral. So we're going to go
source and medium. Let's first rename this
before we build it. So this will be traffic source. And we're pretty much
building the same thing. We just want to drag in
session source here for row. Instead of page path. And then I usually have
the same metrics here. So sessions, total users, average session duration
and bounce rates. Now, you might wonder why do
you pick those specifically? Like, why not any of the other millions
of metrics out here? Well, it's because sessions tell me which pages
are most popular, which is very helpful
because you want to focus on popular pages and you want to make sure
that they're performing. And it's also great
data to know, which pages are performing best, and then you can look at why are they
performing the best. Maybe they have great content. Maybe if you're running a blog, you want to know which
blogs are most popular, so you can create more of that content and
get more traffic. So that's why sessions
is important. Now, total users is important because you want to know how often people get
back to these pages. So if we look at, let's say, pick one example here, Um, I mean, not set, yeah, well, it's kind of hard
to pick this one. Let's just show a few more rows. Um, I'm trying to find one where the users are very similar
to the amount of sessions. Yeah, I mean, here,
this already. So art Analytics, referral
and Baidu referral. Both of them have very
similar sessions. So you can see that
yeah, 958, 910 here. But if you look at total users, the art analytics one has almost half the amount of users. So this tells me that there's
a few users coming from the source that are, yeah, visiting the page more often, rather than the people
from Baidu, which yeah, they visit the page, you know, less often. This just tells us how many times people go back to
the page, pretty much. Because if it's one on one,
like it's almost in here, if there's 100 people
visiting and 100 users, that means that every user
visited it once, exactly. But if there's 200
sessions and 100 users, then we know that the users visit it on average two times. Now, this is on average because some users might visit it, you know, five times and other people might just visit it once. But this just tells us how many people get back to that page. So there's sessions
and total users. Now, why do I want to know
average session duration? I want to know which
pages are leading people or causing people to spend
more time on our website. Now, for this one, we
are looking at source, but if we just go
back to the pages overview and just look at the
average session duration. Again, you should be setting up a filter here for sessions, but for the sake of learning, let's just go with this one. So why do I want to know this? Well, it's because
I want to know how which pages are causing people to stay longer
on our website? For instance, if you write
a great blog that has, you know, ten tips
for I don't know, cleaning your kitchen better, then if you see that
people who visit that blog also spend 20
minutes on your website, that means that
that blog is really causing people to
stay on your website. Whereas another
blog, which might have the same
amount of sessions, if the average session
duration would be a minute, then that means
that that blog is causing people to drop off more. They might stay on that
page for a minute. The bounce rate might be great. But if the average
session duration is low, that means that that blog
is still not kind of helping people to visit
other pages on our website. And especially if you have lead magnets or if
you're selling products, you want to have a long
average session duration. So that's why that one
is also very important, and that's why I also
included in a, my overview. So for traffic source here, that's why I'm using
average esten duration. And then bouts rate, I
already covered this. Yeah, it's just basically how many people are
leaving the page. So for source, it would
be interesting to know which sources are
causing people to drop off. But, yeah, you might
find some sources that have only 5% bounce rate, which is great or sources
that have like 56%, which is not great at all. So yeah, this just tells you which sources are performing
in terms of bounds rate. All right, so that's the
traffic source report, as well as a bit of explanation on why I'm choosing
these metrics. Next up, we're going to
create our first graph.
54. Dashboard - Traffic trend: So for this report, we want to see our trend of
traffic over time. So we're going to create
a new one, and this time, we're going to select
freeform, actually, again. But instead of table, we're
going to select a line chart. Cool. Let's just
rename this and call it our traffic trend. So for the breakdown, we want to look at
nothing, actually. We don't want to
break it down yet. We just want to see the
amount of sessions. So if we drag this
in, we're looking at yeah, a trend over time. Also, this white line is
just the average here, and I think the blue is just the outliers or the range where this
all falls in between. Now, we do have a
few options here. I do want to make sure that I
am on a longer time period. So instead of the last
28 days for this one, I would like to see um
last 12 months. I apply. And now you can see it's
kind of up and down. So as I told you before, we want to change the
granularity to weak. And then we have a
better overview. So now we have first
of August last year, up until the end
of July this year. And this already shows us a few spikes and
aye, a few dips. So it's very important to take all of these
with a grain of salt, make sure that you know for your business or
the business that you're working on what
the trends usually are. So, for instance, in the past, I have worked in the
educational scene. So we were selling
online courses. Now, there was always a spike at the beginning of the
year, so calendar year. So around January, February, March, because, you know, New Year New me, people want to, they've realized something, they want to develop themselves. They want to try other
things. So that's a great time for selling
online education. So what we usually saw
in terms of traffic, we also saw a huge spike in the beginning of the year
because that's just yeah, what the trend was
for every year. Also, you'll see a dip pretty much always
around Christmas. So here as well, December time, yeah, exactly during Christmas. You'll also see a
dip in traffic. So also don't be scared of that. If you have an ecommerce store, maybe you'll see increases
on Black Friday. If you live in Europe
or in America and you'll have summer
during July and August, then you'll see a dip in traffic during that
time, as well. But it all depends
on your business, and it really depends on the
product that you're selling. Some products are very seasonal. Think about winter clothing. For instance, you'll only sell those in wintertime and
less in summertime. So this will help you this craft to identify
the yearly patterns, as well as any anomalies. So yeah, the yearly pants
I just talked about, make sure to research those. And you also have
these anomalies that G four is also giving you, which are these
little circles here. So it's just basically
telling you, okay, something really happened
here in terms of the data. Like we saw a dip here
or we saw a peak here, and it just helps
you identify those. Now, these are very
obvious, right? It's like, boom, all the way
up, boom, all the way down. Usually, it's a bit more subtle. But yeah, it definitely
is worth spending your time going back and really looking at the
data and thinking about, what caused this anomaly? And how can we either prevent
it or how can we make sure, that we get more of
these spikes in traffic. Now, this could be
millions of things. You could run a promotion. You could run ads. You could have an
influencer who all of a sudden mentioned your product
in one of their videos, and that's where these
anomalies could come from. So if you want to
get more in depth, then I highly suggest
creating a new report. I would just keep this one as is because this gives us an
overview of the yearly trend. But let's just duplicate this. And this wasn't on
the schedule for me, but I'll give you
this one as a bonus. So let's duplicate this,
and we're going to look at traffic trend. By source. Now, here's where stuff
gets really interesting. So we're going to
break this down by session source medium. And then you're going to see here that we get all of
a sudden way more lines. So if we don't break this down, we just get the total amount of sessions and the
breakdown allows us to get each line individually
by session source medium. So now here we can see
the lines individually, and we can see if
there's any spikes here that occur on some
sources, but not on others. So let's just take this
one as an example. The huge spike here. If we hover over this,
we can see that, yeah, it just grows with 41%. And then below, we also see
the amount of sessions, how many sessions
per source for this. So now we check the lines. So we can see a spike
in this source as well. So, Google organic
definitely increased. We can also see a spike in this light blue one,
which is the newsletter. So this tells me somewhere here, we sent out a
newsletter which yeah, caused a huge traffic spike. So that also explains
why the traffic went up. And we see that some sources don't have this spike at all. For instance, Google ads. So kind of by looking at this, we've kind of assessed that this spike is due
to that newsletter. Where is it again here? Due to a newsletter
that we sent in August and also due to
a spike in organic, which could be because of
the newsletter, right? Sometimes, if you
inject your website with good traffic, just like, for instance, by newsletter, then you'll also score higher
on the organic rankings. So therefore, you also get
a spike in organic traffic. Yeah, so this is
pretty much how I would be reasoning
with these reports. Again, this is super,
super powerful. If you want to check trends, you want to check the anomalies and make sure to write
all of this down so that you know when
the time comes next year that you'll kind
of know what to expect. And one of the best things
you can do is to be able to predict what the
traffic is going to do. It doesn't matter
if it's going to be increasing or decreasing. If you can tell your boss, your manager, your
clients, yeah, whoever it is, any stakeholder, if you can tell them, hey, I'm expecting a dip in
traffic around December. So let's increase
our ads or maybe let's decrease the spend because people are not
going to be online, then that's really showing
your expertise, right? So make sure to write that one down because it's
super, super helpful. Okay. So yeah, that's
the trend by source. So hopefully this
was also helpful. Yeah, again, just
trend over time, as well as trend by
source, which is great. Now, actually, before we
jump into the next one, sorry, but this is just super,
super insightful stuff. I know you're going
to be using this. Let's just duplicate
this once more. And let's just look at the
traffic trend by page. Path. Now, instead of source, we're going to break
it down by page path. Now, this is going
to be spaghetti, for sure because there's
a lot of page paths. But in this way, you'll also see which pages are trending
up or downwards. So here we see the spike
again and we see that pretty much every single
page was having this spike. But here, for instance, we'll see a spike
in traffic here. But just a few
pages, not everyone. We see that this page,
which was not set, which is yeah, unknown, had a spike, as
well as this page, which was the shop new, whereas the rest
didn't have this. So this also shows us, yeah, which pages are performing
well compared to others. For instance, here, the
homepage just shooting up, whereas the other pages
weren't so as much. So something happened here
on the homepage that was, yeah, causing more traffic
to come to this page. So I could just keep going
on about this subject, but this is really where you all bring everything together, all the knowledge that
you've had so far. And actually, just to give
you one last tip on this, and then I'll promise
I'll shut my mouth. I'll give you myself a break. If I see this, if I
see a huge increase in traffic to the
homepage, for instance, between 20th of April to, like, 25 May, I could go here to
this page, page overview. Sorry, to the traffic source. And I want to set
this date trange to 20th of April. Where was it? 20th of April up
until 25th of May? And then just check
the home page. So I'm gonna filter
on the page path. Exactly matches. Ford Nash. So now I'm comparing the um, the traffic trend by page
path for the homepage. So this spike here, I'm
actually looking at, Okay, what Which
sources caused this? Alright, so now I've only
filtered on this homepage. And I want to see,
okay, from that spike, where did the most
traffic come from? And I can see it's from direct. So, unfortunately, this is not really helping me
pinpoint exactly. But sometimes you'll
see that a spike in traffic would actually
be because of, you know, another source, like the newsletter,
for instance, or, as I said, an influencer
posting something. So yeah, this is just me showing you what
my reasoning is. So let me just remove this and get this back
to last 12 months, and then we are
good to go again. Okay, so a bit of a longer
video than I was hoping for. But yeah, definitely a
lot of value in this, and I hope that you enjoyed it.
55. Dashboard - Event count: Okay, so this one is
pretty straightforward. We're just going
to create a table, so another free form here. And we're going to
check out events. So for dimensions, we
want to add event name. And then for metrics, we want to add event count. Cool. So now we're just
going to drag in events here and then event
count for the values. And let's rename
this to event count. Cool. So this is just
going to give us an overview of which events
are firing, how many times. We are going to break this
down as well in the next one, but this is just a
simple report that is very useful just to see what
events are firing the most. So as we can see, Patew is firing the most because every single page would fire a Pat review event. So
this is not strange. But here we do see that the few item list event is
firing much more times, like four times as much
compared to the few item. So few item list is just a
overview of yeah, more items. So, for instance, on here, I'm on shop here, or even I
could go to the Sal page. And just see which
items are on sale. So this is a view
item list event because we are viewing
a list of items. Now, if I would click
on a single item, this would fire a
view item event. So why is this important? Why, you want to know what
people are looking at. So in this example, we know that many more
people are looking at the lists of items than they are looking at
the items themselves. So this tells me that the lists are actually doing quite well, and I am helping people, yeah, by showing them the list of items instead of just
the items themselves. Because I could also
just show items, you know, like this just
separately on a single page. But that might not
help. It might be scattered a little bit. So sometimes it helps if
you create some lists like blue T shirts or most
common seals or, like, most popular
or I don't know, categorize them in some ways. So that was just an example
of my reasoning again, of what I would think of when
I look at these reports. Furthermore, it could
be helpful just to have a look at what events
are firing in total. So if I'm just going to
show a few more rows here, it just helps you understand
your website a little bit, which events are firing
many times, which are not. So yeah, just a simple report
that helps you for this.
56. Dashboard - Event count by page: Okay, so the report
we are building now is very similar to this one. But instead of just
looking at the counts, we also want to know
which pages are firing, how many events
and which events. So for this, we're just
going to duplicate this. And we just kind of
call this events counts by page or by page path,
whatever you want. So instead of just having the
event name and the count, we're also going to break
this down by page path. So let's drag this
one into columns. Sorry, I Rose. There we go. So now
we have an overview of which event fired and then also which
page it fired on. We could also change
these around so that we'll have the page both first and then how many events fired. This could be super
helpful if you want to look at which
pages are causing, yeah, a lot of events to fire. Now, for instance, if I want to check filters and want
to select an event name, which might be
maybe select item. Let's see what this does.
Yeah, this one would be great. So I just selected a filter. Now I'm filtering only on
the event name, select item. So this just tells
me which pages are causing people
to select an item. So for instance, in this shop, these are all pages that
list multiple items, for instance, on the sale page. So this sale page is
listing multiple items. So if I now select this item, then the event will fire select item because
I have selected. So what this does
is it tells me, yeah, which pages are causing
people to look at items. So this just helps
me which pages are performing quite
well out of these. Another one could be
event name matches and then have look at few items. And this will tell
me which items are getting viewed the most. So this product lifestyle
Android classic plushy is getting the most item views
out of all these products. So that's also very
helpful information. So yeah, I'm going to
deselect this filter here because I just want to have
the event count by page. And like this, I just have a overview of which events
are firing on which pages. Now, you do want to
scroll and dig around in this data a little bit to
find some useful findings, but for me, this will
be enough for now.
57. Dashboard - Geo Map: So another one of my
favorite reports to make and to use when analyzing
data is the Geo Map. So for this one, we're going
to create a new free form, and then here under
visualization, we want to select Gomp. So this is going to
give us a map of the world as soon as we
drop some values in here. So for values, let's just
go for sessions right now. Just look at popularity,
and boom, here we go. So now it automatically
created this world map, and currently we see ten of these blue dots because it's
currently set by country. So here under Geo Breakdown, we'll see that we're
currently looking at country. But if I would select city, then it's just going to show
the top ten cities here. But look at what happens if I change the points
per dimension, which I would highly recommend
let's change it to 30. Now all of a sudden, we
have the 30 biggest cities in terms of sessions. So if I change it to 50, then of course, more
cities will pop up. Now, why is this useful? Well, if you are running area specific
campaigns, for instance, you're running a Google
Ads campaign and you're only targeting
specific regions or cities, then you want to know what
the differences in city are. So for instance, if
I see right now, let's just actually
create a filter here to make it more clear. So let's filter on country and we only have
the United States. So now we're going to get the 30 biggest cities just in the US. Now, if I would, for instance,
change it back to ten, and I need to
assess which cities I am considering running ads to, then this would be my answer. I would go ahead, go up to
my manager, and I would say, Hey, I think we should run some ad campaigns here in
New York, for instance. Did you know, we
actually have a lot of traffic coming from Aspen, as well as Los Angeles
or San Francisco. So yeah, you would use
this to say, Okay, let's maybe create
a campaign here, or let's look at
other advertising options for these regions. Now, it does work usually
with other countries as well, but not all cities or
regions are included here. So let's look at Australia
as another example. Oops. Let's filter by country, and then look for Australia. Okay, so it doesn't show
Australia here, unfortunately. Let's see if we type it
in, then we get Australia. So now we should see the top
ten cities for Australia, which also works just fine. But if we look at
the Netherlands, which is where I'm from, then it sometimes doesn't work because the cities and
the villages or towns, they are very close
to each other. So sometimes they connect
to the same server. So Google might not know
exactly where people come from. So let's look at if this
works here. Exactly matches. Another Oh, sorry,
I'm looking at city. Let's filter around country. Boom. It apply? Cool. Alright, so it looks
like it kind of works. Not too much data here. But yeah, this was
just an example. Sometimes you might see
that the closer you get, the more you zoom
in, the less it's able to actually give
you specific data. So just keep that in mind. But yeah, for this example, I would also look at
this graph or look at this map and yeah, kind of conclude, Okay,
our biggest sessions are coming from Amsterdam, the Hague and Rotterdam
and UTrek probably. But yeah, also a lot
from Nimegen Eindhoven. So I would probably
run some ad campaigns, yeah, targeted around
this region in Amsterdam, or maybe run some offline
campaigns as well, because we'll know that yeah
our visitors are over there. Now, another thing
you can do with this is instead of sessions, we pick metrics. And let's see. And we'll select items purchased
or maybe just purchases. And now we actually
get a map of sorry, I'm still uh, I was still
filtered on the Netherlands, which apparently
had no purchases. Now we get something
more interesting, which is the amount
of purchasers categorized by city or
categorized by region even. So if we just check country,
now, this is super, super helpful information
for any manager or yeah, anyone who takes any
business decisions. You could say, Well, we
actually have a market in Hong Kong because
Hong Kong is one of our top ten countries that we have purchases
or even Taiwan, which, yeah, Taiwan
has more than Japan. So even though you might
feel that Japan has a bit more yeah, probably a lot more people living in it or
maybe a higher GDP. You could still now
argue that it's better to maybe advertise in Taiwan because it
has more purchasers. So yeah, this is
really why I love this Geomap and this will
only be helpful if you are, you know, selling
internationally. But I know there's a
lot of people doing this course that are
selling digital products, and for you, it's
definitely helpful because sometimes you really
don't know where people are coming from
that buy a product. And this will really
just tell you. Yeah, Geomap definitely
put it in here. So let's just do let's just call it Geomap because
it's the only one here. Yeah, definitely one of my
top five most use reports if you're selling
internationally.
58. Dashboard - Ecommerce overview: So for the following
few reports, we're going to go into
some ecommerce settings, which I know for all
your web shop owners or managers is going to be
the interesting part. So let's create a free form
and just keep it on table. And we're going to select some ecommerce
dimensions and metrics. So for dimensions,
let's look for item, and select item name. By the way, if you ever
want to just look at some more dimensions and you're not sure
which ones to pick, they are categorized here. So if you're looking
for ecommerce, yeah ecommerce dimensions,
then just look here. Just click there and here's
all your ecommerce events. So item name, let's just
drag this into rows. And for the metrics, let's go
for item feed items viewed, items purchased, and
then gross item revenue. Because we do we want to be
making money on a webshop. Alright, so let's call
this ecommerce overview. And let's drag in the
metrics. We just added. So items fewed items purchased,
and then the revenue. Now, straightaway we have
a perfect overview report. Oops. Um, we have a great overview
report here that is just showing us which items
are selling the best. Just simple, straightforward. How many times were they viewed? How many times were
they purchased, and then what's the revenue? Now, it looks like there's a
little bit of a discrepancy here because how can you purchase more items
than view it? Sometimes it's the case that the item view event doesn't
fire in some cases. So for instance,
let's go to the shop. A lot of web shops, they have a button that is
just saying like, buy now or add to card, and then you straightaway
go to the card. So the item view event, it only fires if you actually
view the item page, right? But if you skip that page
and you straightaway go to checkout or to
adding to the card, then you're not having
this item view event. But if you end up purchasing, you do get an item
purchased event. So that's pretty
much the reason why there's this bit of
discrepancy here. So also great tip, if you are creating
a conversion rate based off of these numbers, for instance, 100 items
sued and then one purchase, you would say, Oh, that's
a 1% conversion rate. Just keep in mind that that will not be the case
if you have a buy now or a two card button
that's not on the item page. Alright, so just please
keep that in mind because I've had a lot of
clients who made that mistake, and they think their
data is not correct, but actually it's because yeah, they didn't really understand the way that the events fire. So this is why that stuff is
really important to know. Cool. Anyway, this just gives
us a great overview of, which items are converting well. So we could increase
these rows to 50, maybe even check which ones
generated most revenue. And yeah, this is just
a great overview. That's why I call it
ecommerce overview. I'll probably check
this every day to see how everything's
performing. Now, this is a interesting one, zero items huge and
2000 purchases. So maybe this item doesn't have an item page or maybe
there's something wrong, worth having a look at,
but my guess is that this doesn't there's no way to go
to the page of that item. Cool. All right, so that's
just the ecommerce overview. In the next one, we're going to check the ecommerce sources.
59. Dashboard - Ecommerce sources: So for this one, we're going
to create a report that's going to allow us to see where
the sales are coming from. Because in the previous video, we just created an overview
of which items we're selling, but I also want to know which
sources are selling best. So for this, let's just
duplicate this one. It looks like we hit our
maximum number of tabs. I knew this was going to happen, which is very unfortunate. So instead of this,
let's just go back to Explore and create
a dashboard V two. So let's just rename it dashboard V two or
dashboard, more like part. Good. Let's select the same
dimensions again. So instead of item name, we want to have session
source. Session source medium. And for metrics the same one. So its items viewed, items purchased, and
then gross item revenue. It's funny. It's
always reminds me that it's like a disgusting
item revenue, you know, like, growth. Anyway, it's just my brain. So let's just drag
these in here. Items used, item purchase, and this disgusting
item revenue. And let's call this
ecommerce sources. Good. Now, it looks like I made a mistake
instead of columns. We should put this on the rows. Otherwise, it goes
from left to right. Now it actually
goes top to bottom. Okay, so now we have an overview of item revenue by source. So let's just show a
few more rows here. And sort this on item revenue. Cool. So yeah, straightaway, we can see the majority of revenue is coming from a
few different sources. And there's a lot of, like, smaller sources that aren't even generating revenue or are just generating,
you know, not much. Now, one thing we could do here, just to give a bit more
perspective is add sessions. Because this allows
me to see, okay, how many sessions were there
and then how many items were viewed from that session
or how many purchases. Because sometimes
you'll see that even though a source doesn't
have many purchases, if it also doesn't
have many sessions, then the conversion rate
is still high, right? So, for instance, the
sts.google.com referral, we can see 202 sessions, but also 45 items purchased. So almost one in
four people coming from this source is
buying something. Now, that's great,
you know, because one in four is amazing. That's like 25% conversion rate. So if I would see this,
I would just say, Okay, let's go hard on
this on this source. Like, whatever this was,
let's just look into it and see if we can spend more
time because apparently, people that come
from the source, they are buying really well. Now, it might not be a
lot in terms of revenue. It might just be like less
than 1% compared to the total, but you're just looking at where do you
want to grow here. This just tells us,
Okay, what you know, what's the data
showing in the past. But from this, we are looking at what do we
want to invest in? So in my opinion, we should invest in this source. Newsletter May also is doing really well, about
20% conversion. So I would say, let's just, you know, keep on going with these newsletters. They were performing
a lot better than the newsletters in
November and October. Actually, much better than the newsletter in July, as well. Here in July, it
says zero purchases, and the one in May has 93. So based on this, I would go to, you know, whoever created these
newsletters, and I would say, Can I see the May and the July newsletter
and just compare, you know, what's the
difference here? Because apparently one is
generating a lot of revenue, and the other one is
generating absolutely nothing. So very important that you have this report because
you want to look at which sources are
generating revenue. Now, you'll always have
these direct none, and you'll have the not set, so just keep that in mind. Like, if this is
the biggest source, like direct none, in this case, if that's the highest
amount of revenue, I would spend some time
looking at if you can set up UTMs much better
or just look at, okay, which, why is this, you know, such a big
chunk of my revenue? See if you can fix
that up a little bit. There are some great
tutorials out there, which you can kind
of reduce this. But yeah, you'll never
be able to get it, you know, to nothing. So this will always be a thing. So try to focus also on the
sources that you do know. For instance, it's
Google Organic and Google cosperCliq. So, yeah. Great report just to get you an overview
of which sources. And as you can see, already just from creating this report, I had two or three
actions that I want to take to see if we can grow some more revenue
from these sources. So hopefully, you kind
of get to drill here and definitely one to
keep in your reporting.
60. Dashboard - Ecommerce Funnel: So next up, we're
going to create probably a super
important one, as well. And I think one of
my favorites is we're looking at the funnel
of the checkout process. So if you don't remember
what a funnel was, it's where you start out broad. So you start out on like a
homepage or a shop page. You have all these
options to select items, and then with every
click, you keep going to the next
step in this funnel. So now the only option
would be to add to card. Then we are viewing this card. And we can go through
the checkout, which is one step further in the funnel, and then finally, we can place the order, and then we have
made a purchase, which is the last
step of the funnel. So we want to know
where people are dropping off in this funnel and we want to know the
conversion rates between, you know, viewing an item and then how many people
are adding to card. So in order to do this, we are creating a new report here, and we are looking at
funnel exploration. So hopefully you kind
of remember from the video on funnel Exploration, I'll go over this again
while I create this report. So for the first thing we want to do is we want to
select a starting point. So here under steps, there's a pencil icon here. You click on that,
and we want to select our first step,
so our starting point. Now, if you remember
from our events lesson, every step in the funnel is
firing a specific event. So let me just
bring up the hoops. Let me just bring up the
omnibk again, the magic tool. So if I refresh, then we're just looking
at this page view. If I now click on an item, now, I've selected it
because I clicked it, and there should also
be a few item events coming here. Let's see. So there's three page views. Sorry, three events. So
we have the pageview. We have a few item list because down here
is a list of items, and we have a few item. I wonder if I can, yeah, make this a little
bit bigger for you. Because it's getting
a bit small here. So yeah, we have the page view, which fires on
every single page. We have a view item list, again, because there's a list
of items down here, and we have a view item event because we are viewing
this singular item, right? It's a product page. Okay,
so we can start with this one with few item because this is
kind of the start of the checkout process. So let's just go
back to analytics, and we're just going to
call this view item. Now, this should fire or we should track this only
when an event fired, which is view item. Cool. So that's the first step. It's whenever someone
lands on an item page. Now the next step, let's look, is going to be if we click Add to Cart, the next
step in the funnel. And yeah, not surprisingly, it fired an add to
card event here. It fired it, of course,
before it loaded the new page because it recognizes when
we click on that button, but it doesn't matter
as long as it fires. So yeah, next step in this
is we clicked Add to Cart. So step two, add to card, which is the event add to card. Cool. Next up is, well, we also have a few
card events, as you can see. So in this webshop, if you click Add to Card, it's automatically
going to the card. So I always know this is
going to be next step, right? But some webshops you
can add to the card, but it just stays on the page, or it might return
to some other page. So in that case, you might want to add another step
that says a few card. We could actually do this,
but it's probably going to be it's probably
going to be yeah, for my webshop, it's
going to be useless because for every
add to card event, I know it's always going
to fire a few card event. So but since we're
in a demo account, I'm not exactly sure how
this is set up on their end. So let's just go
with this. Few item, add to card, and then few cards. So for events, few card. Now, next up on my
webshop is you know, the option is through
the checkout. So if we click on this,
let's see what fires. So here we had the view cards, and now we have the begin
checkout event. There we go. So as you can see,
there's a lot of other pixels firing because, of course, there's
more things installed. But luckily, we can see a
begin checkout event here. So our next step
is begin checkout. Here we go. And then the
final step is to place order. So there is another
event that might fire when you put in
your payment details, or sometimes it has, like, a form start here because this could be considered a form. But for simplicity,
let's just Oh, here we go, as I
talked about it. We don't really
want to know this. Like, you would only do this if you're interested
to see, okay, how many people
came on this page, and how many of those
started the form. But I'm more interested in from the people that
came on this page, or sorry, from the people that went to this page.
Sorry for that. How many of those
placed the order. So how many of those purchased? I'm not going to, yeah, click Place Order
because then I will buy some random random sweaters
for my own webshop. Yeah, just know that the next step is going to be purchase. So we add a step
here. Step five. Purchase. Events,
and then purchase. Cool. So now we have
our complete funnel. We start at the view item page, then we add it to the card, then we view the card, which is for my webshop unnecessary, but for the sake of
learning, it's in here. Then after we view the card, we start with the checkout, and then after
this, we purchase. So this is the shopping
funnel, let's say. Now, you could also give some options here where
it is directly followed. You would do this
only if you know that there's only one way
to arrive to the next step. For instance, if you have a checkout here and you
have a purchase after this, if the only way to get a purchase event is by going
through the begin checkout, then you would say, This is
directly followed, okay? However, sometimes
you have like buy now or like a quick checkout
or like, how do you say, like Apple pay or Google pay, then you would just skip
the entire checkout because it already
has your information, and you would probably go from
like few item to purchase. So if that's the case, if there's more ways
to arrive yeah, to a step in this funnel, then we just keep it
indirectly followed by. So I would just always keep it on his indirectly followed by. Cool. So if we now hit Apply, we should have our beautiful
e commerce checkout funnel. Here we go. So yeah, if you remember from the funnel
exploration video, this is just showing
us the percentage of people that went from this step to this step and then how many people,
you know, abandoned. So we started a few items, so we have 100% here. And then we have 28.7% of those that also went
to add to card. So I know that from
the item page, I know that this
conversion rate from this page to adding
to card is 28.7%. Sorry, my cat's just
scratching the window so. Hopefully, I'm not sure
if you can hear this, but it makes a funny noise. Yeah, so we know that
the conversion rate for the product page is 28.7. Now here's where things get
funny because add to card and view card are not always yeah, not always the next step. So, in this case, is 73% from the people
that add to card. They also went to FewCard. So this tells me that there's
a lot of people that, you know, if you click AT Card, then you automatically
go to Vw Card. On my webshop here, this would
probably be 100% or like, close to 90 because the only
way to go to the card is by adding something or by
clicking the card button. So, yeah, just keep in
mind that it's really important to understand
the checkout process on your own webshop
and just really understand which events
are firing at what point. Okay, so from the few
card to begin checkout, we have 72% as well,
which is a great number. Just telling me that, you know, almost three quarters of people
who are viewing the card, they're actually
going through to the checkout, which is nice. And then 45% who started the checkout actually
went up and purchased, which is an insanely
high number. This is yeah, usually, this is not going
to be that high, so please don't be disheartened when your webshop doesn't
have this high of a number. Keep in mind this
is a demo account, so this is going
to be fake data. But yeah, in my experience, the purchase checkout rate, like from beginning to
checkout to purchase, is usually not 45. It's
more like ten or 20. But yeah, it's a great practice
to kind of try to keep that number high and see if you can change some things in
the checkout to see yeah, if you can optimize it
a little bit better. Because, for instance,
if this is 1%, that means that only
one people in 100 that arrive on the checkout
page is actually purchasing. So that means that you have a problem on your webshop,
and you need to fix. Okay, so yeah, that's basically why we are
creating this report, just to see what are the
conversion rates for each step. And yeah, how many
people actually purchase something
based on yeah, how many started to checkout or how many people purch based
on how many few the item. So if we just calculate this, we have 777 purchases
and 11,000 few items. 777/11000 times 100, which is a 7% conversion rate. So that means that 7% of people that view the item eventually
end up purchasing, which, in my opinion,
is a great number. But yeah, again, this
really depends on This really depends
on your web shop and the price of your item. You know, if you're
selling stuff that's worth over 100 euros or dollars, then 7% is probably not
something you're going to reach. It's probably going to
be much lower. Okay. A lot of information
on this one. But yeah, again, for all
of you out there that have web shops are selling something like this
stuff is super, super helpful to get the
conversion rates up. So yeah, hopefully
you find it helpful. And yeah, I'll see you in
the next report video.
61. Dashboard - Checkout Path: Okay, now, if you watch
the previous video, you'll know that I mentioned that it's really important to understand the
checkout process on your own webshop or the webshop
that you're working on. So just as I've done here, open your omnibug and
just click on the yeah, go through to the checkout and just see which
events are firing. And based on that, you
can kind of understand, you know, the checkout
process and which events, you know, you're
firing along the way. Now, another way
to do this is by creating a path exploration. So that's what we're
going to do here. So if we click on the plus, then we click on
Path Exploration. And as I mentioned in the path video or
the explanation of the path is actually
just telling you from a starting point
where people are going to. So in this case, we're
looking at events. So from all of the people
that started a session, what was the next
event that fired? So, you know, the
majority is going to be page view events, but
there's a few more. Then based on a page view, what percentage is going
for the next event, which is first visit
or session start? So instead of events or
instead of the session starts, we can actually use the
ecommerce events as well. So what we're going to do is
we're going to start over on the top right and have our starting points be
the event name view item. So kind of just what we
did here in the funnel. I should actually rename
this. Checkout funnel. Similar to what we've
done here is we said, Okay, the first
step is few item. But instead of us specifying
what the next event is, we're actually just going
to let GFour tell us, what are next events
that fired from here. So if we look at the view
item as a starting point, almost half of people or
actually half of the people, the next event was
the view item list. So probably, if you went from
few item to few item list, probably a lot of people
were clicking on, like, one of these things or,
like, going through a list. So on my webshop, there's not
really clear this example. But in the GFOur demo count, there's a lot of
people that go from view item to view items. But actually, what
we want to do is we want to see how
many people from View Item went through
to Add to Cart. And if we look here,
that's the third one. So if we now click
on add to card, we'll see exactly the flow of people going
through these events. So 13,000 people view item. Out of those almost
1,700 add to card. And then the next step would be probably to view the card. And so if we view the card, there's probably a page
view event firing, right, because similar to this one, if I click Add to Card, there's a new page that just opened. So every single page
will have a page view, and the page view will fire
usually before the view card. So as you can see here,
page first, then view card. Therefore, in this
path exploration, after a few cards, most
people will have Page View. Now, hopefully this
makes a bit of sense. It's just about which
events fire in sequence. But let's just click on Page View because that's
the majority. And here we can see the
majority of people who then landed on this card
page will begin checkout. So we'll click on this one. Well, apparently, on the
G four demo account, if you start to checkout, the first thing to do, when
the only thing to do is to add your shipping info. So
let's click on this one. Then apparently, if you
add your shipping info, it's opening up a new page,
which could be, I don't know, like a pop up or maybe
it's refreshing, but in some way in the
GAour checkout process, if you add your shipping info, you're getting a new page view. So let's just click on this. And then after this page view, we have a few more options. So as you can see here, a lot of people are actually
going back to the card after they add their shipping info,
which is pretty funny. Well, it could also mean that if you add
your shipping info, the whole checkout process will understand or sorry, the
webshop will tell you, Hey, if you add five
euros more of items, then you'll get free shipping. And therefore, people might
go back to the card and see if maybe add another item or
I don't know, do whatever. So yeah, this kind of tells
us a bit of a story as well. So after the shipping info, a lot of people
add payment info. And it's probably going to
be another page view here. Yeah, here we go. So after
adding a payment info, a new page loads. So we click on this. And now we see some purchase
events, right? So we see more like, it's so funny because this
really tells a story, right? We have people adding
a payment info, opening up a new page, and then another adding
payment info. So yeah, it could mean that there's an error or maybe they didn't fill in
something correctly. Maybe they're refreshing. But yeah, as we can see, there's also a few purchase events. So now I know that this is kind of the end of the
ride for a lot of people. So why was this helpful? And how is this different
than the checkout funnel? Well, if you remember
from the previous video, I told you that it's
really important to understand the
checkout process on your webshop and understand which events are
firing at one point. But what we've done here is
we've actually just went through the checkout process ourselves and we noted
which events fired, and then we just selected
them here as different steps. But what's different from
the path exploration is, in this case, we are actually starting
at the same point, but we're letting the
data tell us where people are going through next and
which events are firing next. So this is a completely
different way of looking at the
checkout process, and it's going to tell you a little bit less information
about the conversion rate. For instance, the six
purchases from over 13,000 few items is not really an accurate conversion
rate because some people after
begin checkout, they might go back to something
else and then purchase, which makes it a
completely different flow or path but what this does, it just gives us a
clear view of what the different options are
in our checkout process. And for instance, what
I've just told you is that there's apparently
a lot of people that after the payment info, they go back to or sorry, after the after adding
the shipping info, they go back to the card, right? Just as I gave an example,
if you add one more product, you get free shipping,
then yeah, of course, you're going back to the card or going to go through
another item. So yeah, sometimes the numbers are
really clear and obvious, and you would see, Oh,
there's a lot of people going from the checkout
back to the item list. Then you'll know
that that's like a logical sequence for a lot of users on your website. And you might want
to change that. You might not want to. But yeah, if you see that a
lot of people are getting stuck
somewhere or they are starting the checkout and then going back to the few items, for instance, then
you'll know that maybe there's something
wrong with the checkout, because why are people starting a checkout and then all of
a sudden leaving again? Why are they not going
through to the next step? Okay. So yeah, hopefully this is really
difficult This is difficult. So hopefully you kind of
wrap your head around this. I highly suggest if you
find this a bit more difficult to mess around with it in the Gaour demo account
and see if you can get yeah, some reasoning from
it, just as I've done now and see if you can make some decisions
based off of these. So yeah, this is also a report
that I use occasionally, especially with new clients if I want to understand
their checkout process. So let's just call
this check out path. And yeah, this is
something that I also use, on a weekly basis and
especially with new clients. So yeah, now you
can use this, too. So hopefully that was helpful, and I'll see you
in the next video.
62. Dashboard - Popup conversion: So this next report
is going to be very specific to your situation, because oftentimes on a webshop, you would be running a sale, and that seal would
have a pop up, right? So if, for instance,
we go to this website, poury.com, we have
a get 15% off pop. Or maybe a website from
one of my friends, there should be a pop up here. So what you want to do is you want to measure the performance
of this pop up, right? Because you want to know how
many people are converting. So in order to do that, we need to have an event that says when the pop up appears, and then we need
another event that says when the form
has been filled. Okay. So this form usually would be tracked
automatically with J four. But in order to create the event that shows whenever
some pop up appears, we would actually need to
use Google Tag Manager. So that's going to be outside of the scope of this course, but I highly recommend
checking out my Google Tag Manager course
if it's already released. I'm currently working on it. So if it's not released,
just hang in there yet. But I do want to show
you how to set up a funnel for the events
if you have them. So let's just
imagine that we have an event that fires whenever
this pop up appears. So what we would do is create
a new funnel exploration. Then change the steps. So this would be pop up shows. And what you would do
is you would select the event that fires
whenever this shows. Okay? So it's currently not in here because we
haven't set this up. But if you are using
Google Tag Manager and you are creating your
own custom events, then it should appear. So you would look for
maybe pop up show. I just create it for now. It's
not going to do anything. And then the next
step would be pop up. Convert. And this event
would fire if there was a form submit inside
this pop up, for instance. But again, this is way outside of the scope
of this video. This stuff is what you'll
learn in Google Tag Manager. So let's just create
an imaginary event, which is going to be pop up. Convert it and
then we hit Apply. Now, it's going to show nothing because I've just created
these two events, but just know that if you
are running some kind of pop up and you want to
track the conversion rate, then you got to set up
events through Tag Manager, and then you can
use those events to create a funnel here in Gaour and have a report of the performance
of that pop up. And the cool thing about this is you can check the
performance from that pop up for different sources or maybe
from different pages. So, yeah, that's where really the magic happens
with this stuff. So again, don't
worry about this. This is what you'll learn
in Google Tech Manager, but I just wanted to show
you that this is as well, one of the reports
that I always use.
63. Dashboard - Segment purchases: So for my final favorite report, we are going to
create a segment. So if you need a refresher, you can check out the
lesson on segments. So let's just click
on segment overlap, and then right here, disappears, where we can compare
some segments. So on the left here, there
are already a few selected. If you don't see these yet, just click on the
plus icon and then you'll get to have
the standard ones. So for this, let's
just select web traffic and mobile traffic, and let's also
select paid traffic. Now, what happens if
we drag this in here? I want to compare
web and mobile. These don't have
any overlap, right, because you cannot be both a mobile traffic session
and a web traffic session. Therefore, yeah, the web traffic plus
mobile traffic says zero. Now, what I want to do in this report is what
I'm interested in is to see the overlap of paid traffic between
web and mobile. So if I drag this in here, now this segment overlap will automatically show
this visualization. And here we can see
what percentage of my paid traffic is part of the web traffic segment and which percentage is part
of the mobile traffic. And there's probably
also a bit of other, which would be
tablet or Smart TV. But this just gives me an
overview in one glance, like what is the split in web
and paid traffic or sorry, web and mobile traffic
for paid users. Now, where it gets more interesting is where we
create our own segment. So that's what I'm
going to do here. I'm going to remove
the paid traffic what you can also do
is just duplicate this if you would like
to keep the other one. But what I'm going to do
is create my own segment. So on the top right here. And what I want to do
is check purchasers, so anyone who fired
a purchase event. So I'm going to
select event segment, and then for the event,
select purchase. So I'm going to rename
it purchase event. Does it apply? So it automatically added
to the comparison. So what you're going
to see here now is an overlap of the
people that purchased, whether they were
going to be mobile traffic or web traffic. And now, this immediately
shows me that the majority of purchase events actually comes from web traffic. So why is this helpful? It's because in a table view, you might not see this
at the first glance, or you might just
figure this out later. But with the segment
overlap function or segment overlap technique, this stuff just gets really, really obvious, and that's
why it's really helpful. So I would highly recommend to create this report as well. What you can also do is
instead of web and mobile, you could look at
organic and paid. So instead of checking
purchases for web or mobile, we're actually checking
which purchases came from organic and
which ones came from paid, which also be an
interesting one. So yeah, as you can
see, pretty similar, a few more from organic
compared to paid. And there's a lot of purchases that weren't organic or paid. So that means that probably
the source was not set. Yeah, I always have this one
in my dashboard as well, just to have a quick look at where are the
purchases coming from. Alright, so that was it
for all these reports. I've now shown you, I think, about 15 of my favorite reports and reports that
I use on a daily and weekly basis for my clients. Hopefully, you've follow along, and now you have those
reports for yourself. Now, another quick
tip I want to give you is if you're finished
with this dashboard, so the dashboard
and the Part two, what you can do is you can
copy this across properties. Cool. So if you are an agency or a
freelancer and you are, you have multiple accounts, in my case, I have
two other accounts, which have one property each. So if you have multiple
accounts and properties, you don't have to recreate
these dashboards. What you can do is just copy
this across properties, and then it appears
on another property. So super, super helpful, if
you want to save some time. Just keep one thing in mind is that sometimes if you create these custom reports
based on events such as the pop up or
the checkout path, the events might not be the same for the events might not be the same per
domain or per website. So you might have
to recreate those, especially the checkout path. You will have to recreate those. But things like segment overlap, that'll just be
exactly the same, or things like ecommerce
sources or page views, so just keep that one in mind.
64. Coming up: Advertising: So hopefully you just created your very first custom report. I hope you're proud of yourself because this is not easy to do. Also, if you've found this
course helpful already, if you've gotten value from it, I'll be very happy if you could leave a review so that I know that you're happy and
that other people can find this course as well. Also, if you can share your
custom report with me. If you want some feedback
or just a little pat on the back that you're doing
right, feel free to do so. Now let's get into
advertising because a lot of marketers are
not just having website, they also run ads. And it's really
important to know that you can combine Google Ads and Google analytics and have their data merge to
get more insights. Now, this is not really
relevant for everyone, but I highly recommend
to still watch this section because if
you're not running ads, you might do so in the future, and it's really
good to understand how powerful it is
to combine the two. So if you're ready,
let's get in.
65. Linking Google Ads to Google Analytics: You are using your own property. So let's just go back
to beautiful plates, and we click on Advertising. I will say get started with
advertising because you haven't linked your Google ads with your Google analytics yet. So I'm just going to show
you now how to do this. So you want to go to Admin here. In the next section, I'll talk
about the admin settings. But for now, let's just go
to Google Ads Links here. And then you want
to click on Link. And here you can choose
Google ads accounts. And now here you should be able to find the accounts that
are linked to your account. So what this means is, if you
have your Google account, which in my case, is
Ahllbns courses@gmail.com. For you, this will be different. So you want to make sure
that this Gmail account has access to the Admin
settings in Google Ads. If you do, then if you click on Link here and then choose
Google Ads account, you should be able to see your Google Ads account pop up there. So it'll say it here as well. To link a GA property to
a Google Ads account, you must have added
permissions on the GA property and admin access on the Google Ads account. So Google Ads accounts
for which you have an admin access
are listed here. So again, you'll
need admin access in Google Ads to be
able to link them. All right? So that's how
you would set that up. And if you then
successfully link the two, then if you go to advertising, it should pop up with some data just as it does
in the demo account here. So again, if you don't have the Google Ads account,
that's right. We'll just use the demo
account for this one.
66. Advertising Overview: All right, so let's have a look at the advertising section. So you'll find it
on the left here. Again, make sure that you're in demo account for this because if you are in your
regular account, you will just say get
started with advertising. So a quick note on this, I sometimes use this advertising report
from within GF four. But usually I would just go to the advertising
platform itself. For instance, if I'm
advertising with Google Ads, I find it more helpful to
jump into Google Ads itself. Right. So here's an
overview of the snapshot. So this is similar
to the homepage, just a few cards here. Then then on the left here, we can see conversion
performance, which while recording this
video is still in Beta. So I'm not going
to touch on this, but just know that this is a new feature that will come soon. So we have a few options
here for attribution. I'll explain attribution
in the next lesson. For now, just know
that the reports for attribution
can be found here. Then we have attribution models
where we can have a look at different models and see how they give
us different data. Then here under planning, we have all channels. So this is an overview of all of your
advertising channels, as well as a table down here. Then we have display
in video 360. So this is only
applicable to you if you are using 360
advertising tools, such as display in video 360. Here, you will see
the campaign name as well as some events, how much you paid for the ads, and then yeah a few
other metrics here. Then this one is what I'm using the most, which is Google Ads. So this is going to give
you an overview of all of your Google Ads campaigns that were running in the
selected period. A great one here is to look at which campaign generated
how much revenue, and then also how many
key events it fire. But again, I find
it more helpful to look at this from Google Ads, and sometimes I even built a Look or Studio dashboard
to look at this data. But yeah, it could be helpful if you're
working for a client. You're not directly
doing ads for them, but you still want to
kind of look at how the advertisements
are performing and which pages are
advertised too. So yeah, you can do
so. And then finally, we have advertising segments in which you can create
segments based on their behavior on
your website and then use these segments to
advertise in Google Ads, which is very powerful tool, and I'll explain to you in
this section of the course. So that's a quick overview. Again, I'm not really
using this too often, but it's great to
understand what it all is and where you can find some information on advertising. So good luck in this section.
67. Attribution and Attribution Models: So what is attribution? We're kind of getting into the advertising side
of things here, so I won't make
it too difficult. But yeah, since this does
live inside of GA four, it's pretty important to
know these terms as well. So attribution is the act of assigning credit
for conversions. And with that, I mean, if there are multiple touch points. So let's say someone if we
scroll through right here, let's say someone
visits the website through paid search and
then organic search. But the second time
they make the purchase. So if we look in our
dashboard, we would see, Oh, organic search generated
this much revenue. However, it doesn't
take into account that people also been to the website before through other sources. So in this case, they also went through the
website to page search. So your advertising does help. However, if you attribute the
revenue and the conversion, if you attribute that
only to organic search, you wouldn't know
that this also made a difference in the
sale overall, right? So let's scroll a
bit further here. Here we have three
different touch points. Cross network, then we have organic search, and
then cross Network. However, only on
the latest session, of course, they
made the purchase. They didn't make a purchase
on the earlier sessions. However, they did go to your website and they
got to know you better. So it does help. So attribution just means where are you going to allocate
the conversion to. In this case, we
have, let's say, if we attribute this
to cross network, that means that we only use this last touch point to
attribute the revenue. I hope that makes sense.
So you can just see it as a user takes a different
path from left to right, they go to your website, they
leave again the next day, maybe an ad a week later,
go to your website again. Maybe they leave. They put
something in the card. They then leave the card, and then maybe during
Christmas time with a discount
through an email, they finally decide to buy. So that's a whole user journey. They went to your
website multiple times and they eventually
bought one thing. So where are you going to
attribute those sales to? Is it going to be
the final email, or is it going to be all of those earlier
touch points as well? And that's pretty much
what attribution is. It just lets you decide
which touchpoints are you going to
take into account. So the touch points we can put
into different categories. We have early touchpoints, mid touchpoints and
late touchpoints. So late is just the
last interaction they had before they bought, and then mid is a
while before that, and then early is pretty much the first interaction they
had with your website. So the reason why the
majority is under late touch points is because
the majority of people, if you go back here, actually only goes to your
website once and then straightaway buys, right? The most revenue is coming from direct, and that's
just one session. So they didn't grow through
multiple sesons here. So that's why the
late touch points is yeah, has the
biggest site here. So on attribution,
these are the paths. So again, a path could be
paid search and then organic. Path could be cross
network and then organic. You can find like
multiple paths. You also have different models. So let's just jump into that. Now, don't worry if you
find this a bit difficult. This is really all
about advertising. So if you don't do advertising, you wouldn't touch on this, so feel free to skip this section. But yeah, if you
do want to stick around and understand
attribution a little bit better, then of course, I'm
happy to explain this. So we just had parts. Now let's talk about the
models because there are different ways to attribute
revenue to a source. So here you can see
attribution model, non direct, attribution
model, non direct. And then below this, you'll see last click and data driven. So these are the names of
the attribution models. Currently, there's only
two. There used to be more. So last click means you will attribute the revenue
or the purchase. Last touch point that they
had before they purchased. So it doesn't take
into account all of the other times that they
went to your website. It just takes into account the one time that they
bought something. Where did they come from, right? So this will be a little
bit different than data driven because data driven, it's actually an
AI model by GOR, and it'll kind of
attribute based on how often people came
through a certain source. Let's say someone came to
your website five times by organic search and then
one time by email. But with the email, they
actually purchase something, then it's actually
attributing a little bit to email and a little
bit to organic search, or it's actually choosing
between the two. So that's just a model
that's trying to get better information for you where people actually came from and what journey they had
before they purchased. So I would always recommend to use data driven if
that's available. But definitely last Click is also interesting because
you can actually see the final push that they had before they
actually bought something. In my experience,
email is a big one for LastClick because it's usually
where you send discounts, and the only way that you
can get someone's email if they either previously bought something and they left
their account details, or maybe they sign
up for a newsletter, which means that they
already been through your website before, right? So if they came from email, it's almost always people that have been to
your website before. So usually, this would be
higher than on a data driven. But keep in mind this
is the demo account, and all of this data
is pretty much fake, so you don't really
know what to trust. But in my experience, that's
what I all see very often. Yeah, so that's
attribution models. In this way, you can
compare the two. So instead of primary channel, feel free to also select
source or medium, and then you can see specifically which
channel they came from. So yeah, again, mess around, see if you can find some
interesting data for yourself.
68. Planning: Right. So under planning, this section on the left here, the more tools you
connect with Jour, the more is available here. So what that means is we
just link Google Ads, which I explained in
the previous video, but there's also different tools that you can link to Jour, which I'll talk about
in the admin section. And then they will all
display here under planning. The first one, all channels is just the collection of
everything below there. So currently it's display in video, as well as Google Ads. And this is just an overview of the channels and
then the revenue that came from those channels, as well as ad
clicks, impressions, costs, so a little
bit more overview. Then we have display
in video 360, which is a tool by Google. Which allows you to yeah, run your ads on display network, such as YouTube,
as well as video, and you can also
link this to Gour. But most of you will
never really do this. And again, I would highly
recommend to look inside the dashboard itself instead
of looking inside Gour. However, it's always nice
to connect the two and just jump in from time to time if you see
something interesting. But I won't go into detail here. And then the final one, Google Ads, you
might just use this. However, again, this is a copy of what you will see
in Google Ads Dashboard, and Google Ads dashboard has just much more features and much more things to
look at for yourself. Could be interesting just to
look at different campaigns. So these ID campaign names. And then by campaign, you can see, you know,
what's the revenue? What's the cost per click,
how many clicks were there. Just to give you an
overview, you know? But again, I wouldn't
jump into this too often. So, yeah,
that's planning. Just remember this is just an overview of
all the channels that you're running ads through, but it's better to yeah, look inside the
dashboard of these, you know, certain
channels themselves.
69. Advertising Segments: And then finally, we have
tools with only one option, which is advertising segments. So a segment it's listed here, which is a Google Analytics
audience that are synced with Google advertising products for remarketing and ad
personalization. In other words, you can
create audiences or segments based on information you have in Google Analytics. For instance, you can
create an audience that says everyone who
visited my website in the last seven days
or anyone who visited the card page from America
in the last 30 days. You can get very specific here. So it really depends on what you want for your advertising, but just know that
you can create these segments either
under the admin settings, which is what we'll
talk about in the next section or
through Google Ads itself. Now this is actually really
powerful because if you have your information in
Google Analytics about the revenue
of your business, for instance, top 5% of
users that spend the most, you can actually build
an audience here and then send ads
directly to these people. Now, this is already
a great example because you're top five
spenders, of course, you want to keep them happy, and you want to make
sure that they know all about your next promo, because there's a big chance that they might buy
again from you. It's just amazing to build audiences within
Google Analytics and then send these to Google Ads and use them for advertising. So just a great way to do this. Yeah, the floor is
yours when it comes to these segments or audiences. But if you are advertising, I would highly
recommend to look into this and maybe go a little bit more into detail into some examples for
audiences or segments. But if you don't
plan on advertising, then you can just ignore this. Alright, so that was the
advertising section.
70. Coming up: Admin Settings: Now it's time to get
under the hood of GA four and check out
the Admin settings. It's a little bit more
boring than the reports, but it's really just as
important, because, for example, what I see with my
clients is that they're not excluding their own
traffic from GA four, which means that if I visit my website 100 times on Monday, then in GA four, it's going to say 100
times that I visited it. But I'm not a user.
I'm the owner, right? So I want to exclude
my own traffic. Now, this is a perfect example, one of the many that you're going to find in
the admin settings. Now, I've created this video, created this section so that
it's kind of a checklist. You can go through it
with me one by one, and at the end of
this checklist, you're 100% sure
that your data is set up right. So
let's dive right in.
71. Admin Overview: So this is how you go
to the admin settings. I've told this before, but on the bottom left here is where the admin settings are. If you click on that, you will
lend straight into those. So on the left here, the options are Admin, which is pretty much the
homepage of the admin settings. So under Admin, you'll find
everything you need to know. Then you have my preferences, which is where you will change all the information
related to your account. So this is what you've
selected while setting up the account, so you
can change that here. So the first thing
to do here already is to change this
default date range to 30 days because it'll give you more data to look at when
you're in any of these reports. So very important, and then
just hit safe changes. So back to the admin settings, we also have setup assistant, which I'll talk about
in the next lesson. Then you have a few sections. So you have account
and property settings, and then account sections, you have a few details here, and then on the
property settings, you'll have a few here as well. So one important thing to
know is that what's on the left here is also
on the right here. So you can see account,
here, here, account, property will be property, data collection, data
collection, and so on. So pretty much what you can
do is just click on this and then you have the exact same settings as you'll
have on the left. Another important thing
here is that currently we are in my personal
GFOur account, which I've created
for this course, which has more options than if you go to the demo
account, right? We're now in the demo
account, as you can see here, the options reduce,
and now here, there's just more
options available. So I highly recommend
for this section to jump into your own Gour account because there are just
simply more options, and some of these are actually
really important as well. So definitely don't skip on
the admin section because there's so much good
stuff that we can do here that allows
us to clean up our data and just to make our experience
with GFour much better. Alright, so that's an overview. Now, let's dive into
the setup assistant.
72. Setup Assistant: So the setup assistant
was created at the time when G
four was released, and most people had to go
from the earlier GA three or Universal Analytics and
had to migrate to G four. So the setup assistant was
pretty much built for that, but it now is an assistant tool, which helps you to set up your admin settings
with Achecklist. So if you click on
Setup Assistant, you will see zero out of
eight marked complete. That just means that you
haven't completed any of this. But yeah, you can just
manually complete these. And then yeah, this bar will
eventually be all done. So that's what we're
going to do now. I'm just going to go
through all of these and explain you which ones are important and which ones aren't. So the first one is definitely
the most important one, which is start data collection. And this refers to, I think it was one of the earlier sections where we talked about the data stream, where we actually set up RGA for property and set up a
data stream for it. So if you go to dataStreams and you'll
see your datastream here, which should be the case because if you
follow that lesson, you should have
this data stream. Here's the information.
Then under setup assistant, you can just complete that one. Cool. We've already
done that one. Then we have customized data
collection and display. So turn on Google signals,
you don't have to do this. It's not mandatory, so
just complete that one. Set up key events.
Also not mandatory. If you click on Actions, it'll take you straight to
where it wants you to go. So for example, here,
undermanaged key events, there will be a
list of events here and you can just mark
them as a key event. Key event is just another
name for a conversion, right? So a conversion, again, is when people either buy
something or leave their contact details when you get something from them.
That's what a conversion is. So if you go to
the demo account, let's just see if it's there. So here under key events, cool. We'll see a
little bit more. So we have add to card
purchase and a few item, which is strange
that it's actually a few items. It's not
really a key event. But yeah, it is in
the demo account. Cool. Sorry, I digress. So yeah, all you need to know here is that you can just
set up your key events, but not really necessary. Define audience, you
don't have to do this. Again, when I talked about
the section on advertising, this is where you will
find your audiences. So I think some of them will
be automatically created. As you can see, are all
users and purchasers. Those are just yeah, audiences
that were already created. So Feel free to make them, but it's not necessary
for your GA four setup. Consent settings is
actually an important one, but I won't talk about
this in this course. This is more about the
Google Tag Manager course. So in short, whenever someone
clicks on Allow Cookies, that's when you want
to fire the Gaour tag. But if someone
declines the cookies, that means they didn't consent, which means you're not
allowed to track them, at least in the
European economic area. So if you're in Europe or
your business is in Europe, you will have to set
up a Cookie banner. And whenever someone
clicks Accept, you'll have to make
sure that that's the only time that the
GF four tech fires. But yeah, this is a little
bit more technical. This is more for a Google
Tech manager course, so I will just skip on this one. Let's just click complete. But yeah, you'll now
know what that is. And then, yeah, it's already recommending to
link to Google Ads. I talked about this in the previous section
on advertising. So yeah, if you're
link to Google Ads, then you can click Complete
on that one as well. Bid on Gour conversions, don't bother about that and
target ads to Gour audiences. You can just do that
whenever you want to, right? It's not necessary
for your setup. Then we have advanced setup, but, yeah, again,
this is advanced. I don't want to confuse you. So let's just skip
on that one. Cool. So let's see setup assistance. So now we're eight out of
eight marked complete. And now let's talk about what the cool settings are in
the admin side of things.
73. Account settings: Let's talk about
account settings. So on the left here
you'll see account, which is the exact same
thing as you'll see here. So from now on, I'll
just remove that one, make it a bit more easy. So account settings. So let's first remember what we
talked about with accounts. So an account here is
a GF four account, so an analytics account, right? And an analytics account can
have multiple properties. So this is all about
the accounts settings, not the property, but the
account side of things. We have property
settings later on. Here we can see account details where we can change the name, the country of
business, ya da ya, yada, everything that's
related to your account. This one is important, which is account access management, and this is where you will grant people access
to your Gaur account. So let's say you are a
business and you are hiring a marketing freelancer, you want to jump into your Analytics account
and have a look. You can click the plus
icon here at Users or user groups and enter
their email address. So important thing is, they
will have to have a Gmail. This email doesn't
matter a Goog account. So that's the arrow
that it gives. So they will have to
have a Gmail account. And that's the only way where, um, yeah, that's the only way that
they can get access to this. So it looks like
aa@gmail.com. Doesn't exist. But yeah, you just enter
the email address there, make sure to notify them, and then you want
to select a role. So usually you would just go for editor because this just gives them access to all
the data and settings. Sometimes, actually, a lot
of times you'll have to give administrator access because if you're hiring an expert on Four, or if people are actually hiring you after completing
this course, of course, you are an expert. You always want to ask for
administrative settings. This is really important
because occasionally, you'll have to go into
their admin settings and just check if
everything looks right. And yeah, so I've had
this too often, actually, that people would grant me access and they
would just give me viewer access or
marketer or editor, but always ask for
administrator access. And if you grant
other people access, always make sure
that you trust them. If you don't trust them, then you'll give them access, right? Below here, you can
actually restrict them from looking at
some cost metrics. So let's say you can give
someone admin access, but you don't want them
see any costs or revenue. Sometimes that's sensitive
information. That's okay. You can just exclude them. Cool. And then if you're
done, you just hit Add here. And that's how you do
that. So that's how you will grant people
access to your account. So an important
thing to know is, if you grant someone access
to your GA four account, they will automatically
have access to all the properties that are
listed inside this account. So for beautiful plates,
there's only one property. But let's say there's multiple, and if I then give
someone access to Beautiful plates account, they would get access to all of the properties
inside this account. So important to understand. Then we have account
change history, which just give you information if anything was changed here. Account data API quota history. Hat Diem. That's a long text.
Don't worry about this. It's only if you have a
Google Analytics API, and there are certain
software tools that make use of that API. You can see the yeah quota, how much they've
used that in here. And then finally,
you have trash. So this is where
you put everyone who's from Florida just
joking, just joking. So in trash, you would put all of the things
that you've deleted. So if you had multiple accounts
and you've deleted them, they will end up in trash here. And they will stay
there for, I think, a few days or like 30, 60 days, and then they will
be permanently deleted. So that was the
account settings. Most important one is the
account access management. So yeah, now you know, and I will see you in the
next lesson on property.
74. Property settings: So we just talked about
the account settings. Now let's dive into
the property settings. So again, the account can
have multiple properties, and now we're actually
just looking at property specifically and
look at these settings. So if I'm going to
change property, then I will also change the property settings
for that property. So kind of structured
the same way. You have account details,
property details, account axis, property axis, change history, change history.
You get the drill. Yeah, if we just click
on property details, it just gives you the
information for that property. You can change this
if you want to. You can also move it to another account or move
this to trash can. Property access management
works the same way as account, but this just gives access to
one single property, right? So you just add user, same thing as before with the account, but just this one
is for property. Change history, same thing. If you change anything
here, details, access, it will come up
in the change history. Again, the data API quota history, beautiful,
beautiful title. Now we have scheduled emails as well, which is pretty cool. So schedule ems is you can schedule an
email to yourself or to other people in this
property by week or by month with reports and
information about GFFur. So pretty cool. You can
click on quota information. You can create 50
emails, as you can see. But as of current, we don't have any
scheduled emails here. And then finally, we have Analytics intelligence
search history. So this just looks at what you have done in G four before. It just tries to recommend some settings to you
or some reports, and you'll just find that here. Personally, I don't use this, so feel free to skip on that one. Yeah, that's property setting. So not too many
interesting things. Again, just the Access management's probably
the important one. Next up, we're
going to talk about data collection
and modification. Now, this is a big one, so get ready because we're
going to have a lot of fun with
these settings.
75. Data Collection and Modification - Data streams: So data collection
and modification. You can already see that
it's about the collection of data as well as how
to modify this data. The modification part
is actually super important because you want
to clean up your data, which means you want to exclude everything that's not relevant. And yeah, you'll understand
why in just a minute. So this lesson might be a
long one because actually, there's a lot of things
to talk about here. But let's just dive in
and see where we end up. So data streams.
Yeah, you already set this one up in an earlier
section, so good on you. Let's just click
on the data stream because there's
actually a lot of settings inside of a data stream that we're able
to change, right? So we have webstream details. We have the name,
we have the URL, that's linked the ID and
then the measurement ID, which is one that you'll refer to a lot of
times in the future. But we have the
consent settings. Again, I won't jump into this one because that's
a bit more technical. So let's have a look at what we can find in the web
Stream details. So in here, we have event settings and
Google tech settings. So events already talked about
this enhanced measurement. GFFour is able to track
a lot more things that you think it's capable
of fully automatically, including scrolls, outbound
clicks, page views. So make sure that this
is always turned on. You're going to have a
look at the care icon, which ones you want to
specifically measure, but trust me, you want
to measure everything, and it just saves
you a lot of time. Now, you can also modify events that are incoming
and the parameters. I'm not going to talk
about this into detail because it's actually
quite technical as well, and you'll just
get confused and, you know, you don't
really need this. It's only when you create custom events through tag manager, and you might want
to modify those. Here, you can create
custom events. You can create them from here, but I always recommend to
create them in tag manager, so I'm not going to
jump into this either. Just make sure that
you'll be able to track pretty much everything just with the
enhanced measurement, which means that you
don't have to set anything up custom, right? So you can just
leave those as is. Measurement protocol
API secrets, not going to jump into that. Redacting data, also not that important now,
also super technical. Now, when we go to Google Tech, this is actually
pretty important because the configured
tag settings is where we want to change
a few things around. So let's just click on that one. So now we're inside
our Google Tag, which is a tag that
use not just for GFR, but also for Google Ads. In here, we can see under settings if you want
to click on Show More. There are a few things
that we want to look at here and that
are pretty important. First of all, you want to be able to configure
your domains, which means if you
have multiple domains, let's say I have
beautiful plates.com, but I also have
amazing plates.com. And let's say if anyone comes from this website
and goes to that website, and I want to specify that
it's pretty much the same one, you can do so in
cross domain linking. So it just means that
you will just say to Gour that this domain is
mine or is related to mine, and I don't want you to see that as a separate one, right? So it also works
with subdomains. So you have beautiful
plates.com, or maybe a discount or
promo do beautiful plates. Dot com. So this is a different domain because it's promo dot
beautiful place.com, but it's still part
of beautiful plates. It might just be that I run a promo specifically
to this one. So if you do that, you
want to make sure that you add that to your
cross domain linking. So you can add condition, include domains that
match the following. So it begins with, like,
promo dot beautiful. Beautiful plates.com.
So now if we hit Save, that means that these
domains are linked and that it doesn't see
the traffic as separate. You don't have to
understand this, but just know that if you are using subdomains, you might
want to add them there. Cool. Next important one is
define internal traffic. Now, this is a big one
because if you are working, let's say, for a
marketing department, and the marketing department
has web designers. That means that
these web designers, they will go to the
website pretty often, just to make changes or to check any design updates that they
made, check if it's working. So what we want, we want to exclude
those people from our data because let's say I get 100 views a month and 80 of them are from myself because I just like to visit
my own website, or maybe 50 of them are from a design freelancer who is
also on my website often. But of course, I will never buy and my freelancer
will never buy. So I don't want them to ruin
the data that's also there. And the way to do that is by
defining internal traffic. So internal means
your own traffic. So how you can do
this, you can click on Create and you can
give it a name. So let's say this is
my IP, IP from O. The type value is internal. And the way to do that is
by looking at IP addresses. So every computer has
its own IP address. So if I'm always visiting my
website on my own computer, I can just exclude my
computer from the data, which means that I won't ruin the data that's
already there. So the way to do that
is by IP address. So the way to find your IP is just Google for what's my IP. Now, I won't press Enter because then you'll
see my iPddress. But just know that if you
press Enter, what's my IP, you will find either
website or it'll just show up on Google what your IPddress is. So
you can just copy that. Make sure that the match
type IP address equals, and then you want
to type your IP. Something like this. So
if I now hit Create, I've now saved my own
IP address and it's now excluding my own
traffic from the data. So super, super, super
important because if you end up working
as a freelancer or if you work in a
marketing department, one of the first things
you want to do is ask your client what
their IP address is because you want to
exclude them from the data, and you want to exclude anyone
else who is working inside their business and is visiting the website
every now and then. I want to make sure you exclude
them using their IPddre. So yeah, just write that down somewhere because
it's super important. One of the most important
rules to clean up your data is to do this. And another tip
as well is if you are working at home but
also working on an office, you will have two
different IP addresses. So I might just say
this is Aca home. Which I can just create like
this and create another one. This is IP for myself, Office, and maybe
random number here. So now I've excluded my computer at home as well
as my computer on the office. So yeah, again, super
super, super important. So make sure to really
write this down. And this is just I don't know, if you're working
as a freelancer, this is really showing
your expertise, right? You're not just
looking at the data. You're also making sure that the data is
clean and usable. So yeah, super, super important. So that's how you define
internal traffic. Next up is an important one as well, is unwanted referrals. So let's say I'm
in my shop here. I'm beautiful place.com. I don't think this is working. Oh, it's actually for
sale. Look at that. Let's say I'm on my website. Well, actually, let's just use my ecommerce store.
So suck loose. If you, for example, shop for a item, add it to the card, go
through the checkout. And let's say there's an option
here to pay with PayPal. So currently it's
just credit card, but let's say there's
an option here, you know, continue with PayPal, which is present on
a lot of website. What will happen is you
will go away from scls.com. You will go to paypal.com
slash some kind of code. And that's when you'll
do the payment. And then as soon as
that's completed, you go back to the main website, maybe to like a thank
you page or something. Very important to
understand is that if you leave this
website or this domain, that means that G
four stops tracking, and then if you come
back to the domain, it'll think that it
started a new session. It'll think that, Oh, this
person came from PayPal, and they just started
their session. Whereas in reality, you actually just
left the website for a few seconds or a few minutes and you came back
to the website. But you came from a
referral that is unwanted, which means that you
want to make sure to specify anyone who
comes from this domain, it's just ignore that and just continue the session
that they had before. A great one is PayPal. So referral domain
contains PayPal. Another one is stripe, because sometimes you
make payment on stripe, and then you go back
to the website. Or let's say, in
the Netherlands, we have IDL, right? So just make sure to
find for your country or your client which
payment systems they have, and just go through
the checkout, do it yourself and
just see if you get referred from PayPal,
Stripe or whatever. Because if you do, you want to add them to these
unwanted referrals. So that your data
is even more clean. Because if you don't do this and everything
comes from PayPal, what you will see in your
dashboard, in your reports, you will see 100% of
the revenue comes from the direct
source or referral, and 100% of the revenue will
come from the PayPal domain, you won't have any information about what happened before that. Right. So make sure to add
these as unwanted referrals. Maybe check on
Google, check with Chat GBT, a few other domains. The biggest ones for me,
are Papal and Stripe. But there are multiple
payment providers. You have a few credit cards that sometimes take you off of your website and
then back to it. So anything that
happens with payments, just add them as
unwanted referrals. So we head save. So now
we've got those as well. And again, just how cool
is it that you can tell your client that you're
cleaning up their data, right? Because one thing worse than no data is actually
skewed data or wrong data because you
don't want to make your decisions based off of wrong data because you will
make the wrong decisions. So two huge ones, internal traffic,
unwanted referrals. Definitely write those down. Another one is session timeout. So this will say, how long does the user not interact with your website before the
session will end, right? So let's say someone goes to your website, they
go to the checkout. They're like, oop, where's
my credit card and then just go go around the
house to find it. They come back in 15 minutes. That means it's still
the same session because the cutoff
is at 30 minutes. If you have, I don't know, a website or a checkout where
it's normal for people, you know, to be inactive for at least 55 minutes
or something, then make sure to put
this on the longest one. Standard is 30 minutes,
which is great. And then you have a time
for engaged sessions, which means that
a session becomes an engaged session if it lasts longer than 10
seconds for this one. So if someone goes to website, they click on a few things. They're on their website
for more than 10 seconds, then this will be specified
as an engaged session. So, yeah, I wouldn't change
this. Just understand that you can change
it if you want to. Don't worry about these things. Yep, that's pretty much it. So yeah, that's the
Google Tag settings. Do not forget about
history as well to have a look at what's changed. So, yeah, you can see here
the changes I just made. And then you also have Admin, but I don't I don't want to go into detail
on here as well. So Cool. That's the web stream details
inside of the data streams. So yeah, it's a huge as I mentioned before,
it's a huge video, but just understand that if you go to configured
tech settings, you really, really,
really want to set up internal traffic and
set up unwanted referrals. Those two are the most important ones to
keep your data clean. So yeah, just write that down and tattooed on your
arm or please don't, but just make sure to really, really,
really remember that. Alright, so that's
that on data streams. I'm just going to
create a separate lesson for the other ones because my mouth is dry and
I just need a sip of water. So I'll see you in
the next lesson.
76. Data Collection and Modification - continued: Ooh, right. I hope you recovered after that big
one on data streams. Hopefully, you understand why it was such an important one. Rest is actually
not that important, but I'm just going to go through them so you know
what it is about. So we have data collection. You can turn on Google signals, which means that you're sharing your data with other accounts, and then they are
sharing it with you. So you'll just get
more information. But you also need to specify this in your privacy statement. So don't worry
about it too much. Let's just keep it off for now. User ID and provide
data collection. A, just ignore that. You can also turn on
granular location and devise data collection. Man, this is really testing
my pronunciation skills. So yeah, just leave that on. Advanced settings,
also leave it on. And so if you specify in
your privacy disclosure that you're using our and how
you're collecting the data, you can just press
I acknowledge. Probably some legal
reasons behind that. You can also import data, which could just be Sales. So if you click on
Create Data Source, here is all the options
that you can select. It could be a CSV file directly
from Salesforce or SFTP, which I'm not sure what that is. So yeah, if that's
something that you want to do, you can
do that right here. And then it'll try to
automatically match the data you've uploaded with the data that
was already in GA. So cool one data
Import data retention is an important one. It just specifies how long you want to keep
the data in here. So you have an
option 2-14 months. I would highly recommend
to set this to 14 months and keep the second
one and 14 months as well. So that's event
data and user data, because this will just
allow you to be able to measure your events
for a longer time. So it's safe Data filters is important because you want to set up
some filters here. So this one's
automatically created, which is internal traffic. If you remember that was about the data stream section and then in the
configured tag settings, and then show more we set
up define internal traffic. So this is where we set
up the IP addresses. But now we also want to activate that filter. Let me
just go back here. We want to activate this filter because the current
state is testing, and we want to put it to active. So you want to click on this
internal traffic filter, and then right below here, you will say active. All right. So now you hit safe,
and now you're actually excluding
this internal traffic based on these IP addresses. So important one that you
have to turn on as well. You can also create
new filters here, which, yeah, internal
or developer traffic. Don't worry about this. So just keep that internal
traffic in mind. And then finally, we have
data deletion requests. That's if you want to yeah, schedule a data
deletion request. So yeah, if you want to delete
your data for some reason, you can schedule a request here, whatever you want to, right? And then they will
delete that for you. So that's data collection
and modification. So next up, we're going to
talk about data display, which is also an important one.
77. Data display: So next section is all
about data displaying, so how you want to
look at your data. Inside of the reports
or the Expore section, you can actually change some
things around there as well. Let's just go through them.
First, we have events, which I would
recommend to do with Google Tech Manager and
not inside Gour itself. If you do want to, you can
just create events here. And just have some conditions. For instance, you can
create an event that says, if the name is purchase, the name of the
event is purchase, then you want to
I don't know, you can modify some
things around that. So again, I would highly recommend not to do this here and to do that in
Google Tech Manager. So that's events. Key
events are important because any events that come
through will appear here, and you want to select
which ones are key events. And key events, again, they're
just conversions, right? So you can specify which of these events you
find most important. Good to know is that
you can also then create audiences
based on key events, and you can then advertise based on key events
or build reports. So it is important that if
you have some events in here that you do mark some
of them as key events. So my recommendation mark anything where you
generate revenue. So any sales or anywhere
where you generate leads, so you get information, you
want to mark as key events. Then we have audiences. As I mentioned before, you'll find those in
advertising as well. You can just create
a new audience here. You can do custom audience
or use a template here, or even predictive audiences,
which is pretty cool. But yeah, you'll need
a lot more traffic to your website before
you can create those. So yeah, here's where you can just build
an audience, right? So let's create an audience of anyone who have not
made a purchase. So yeah, if you click on that, it'll automatically
populate here. So any events that have purchased, we want
to exclude them. So let's say we want
to say 90 days. So anyone who hasn't purchased
in the last 90 days, let's make this 90 days then as well to make it more clear,
and we can just hit SA. So boom just like that, we've
created a new audience, which is non purchases
in the last 90 days. Cool. Yeah, so that's
how you build audiences. And then, again, you can use this for advertising as well. So next up we have
comparisons and segments. So audiences comparisons
and segments, they are pretty much
the same thing. So you build a audience
based on some criteria, as well as comparisons,
as well as segments. So these three audiences
comparisons and segments, they are pretty much
the same thing, but you use them
in different ways. So I'm really not sure
why it works this way. It's actually pretty confusing. Just know that audiences you build them to use in Google ads. Comparisons you build them to use in your standard reports, and then segments you build them to use in your explore reports. Next up, we have
custom definitions. Don't worry about this too much. This is more for
Google tech manager. We have channel groups,
which I wouldn't change either because we have
the default channel groups, which is direct, cross network, paid
shopping, all of these. But yeah, I just
know that you can create custom ones as well. Could be interesting
in some use cases, but yeah, it's definitely
not something I will use. Attribution settings. So again, as I talked about, you have
a few different models. You used to have
first click as well, and I think, like,
something that was equal. But yeah, so currently, they just use models for, which is data driven,
and they'll give you the best possible way of
looking at attribution. Instead of just looking
at the last click. So I would just keep
this at data driven, keep all of these settings
the same as well, and just don't worry about
the attribution and settings. Then we have reporting identity. Don't worry about this either. It could be blended or observed. I haven't changed this at
all in my analytic career, so don't worry about final one is important, which
is debug view. This also works a little bit better with
Google Tech Manager. So if you're using Tag Manager and you are previewing
the website, which means that
you are previewing all the changes that you've made and see if they're
working correctly, then any events will go
into the Debug mode here. So you can also enter Debug mode by adding a piece
of code to your events, but, man, this again, just getting too technical. I don't want you to
worry about this. This will only be
important if you're using Google Tech Manager. So that's data display. And yeah, now we only
have one section left, which is product links, and then we're pretty much through.
78. Product links: Alright, so product links,
pretty straightforward, just means anything that you can connect to Google analytics. So any product or any software that you
can connect with it. Very conveniently, this is
all done by Google, right? So all of these tools,
all these products, they're all made by Google and they're part of
the Google Suite, because they're part
of the same suite, it just makes it easy to
integrate them with each other. Not all of these are important unless you are
working with them. So big advertising agencies, they will definitely work
with display and video 360, search as 360. If you are a data scientist, you will work with BigQuery
a little bit more. If you're an SEO specialist, you might work with
Search Console. So each of these products
will have their own use. But for you as a marketing analytics
specialist who is now, you know, specialized
in GA four, the one you will use the most
is Google Ads, for sure. Most people will have ads
running through Google Ads, so definitely set that one up. But yeah, we've already
talked about it in the advertising section, so you should know
how to do that. If not, you can
just click on it, just hit Link and yeah, link your Google Ads account. Another one I want to talk
about is Merchant Sender. So Merchant Center,
you can set this up if you have an
ecommerce store, and this will help you manage to have all your products
listed in Google Shopping. So if you look if you browse
for a product, let's say, a snowboard boots or something, you want to end up in
those first results in Google under the
shopping section, that's what Merchant Center
pretty much is, right? So you can manage
your products there. Definitely important one,
especially if you work with Shop fi or Woomerce
or anything like that. And then finally, ABC
one is Search Console. Because Search
Console, it allows you to get more information
on what people look for, so what people actually search for before they came to
your website, right? So for this website, Suck
ose. So it's a peril. Let's say someone
is looking for, let's say, St. John's sweater. Maybe they type
this into Google, and then they find this page, this product page, that means
that in Search Console, you are able to see what
they actually look for. So you see that anyone
who landed on this page, a few actually typed
in St. John sweater. Maybe other people typed in black sweater with a church
design or something. So that's pretty much Google Search Console
in a nutshell. It also helps you track
your four or four pages, so pages that are broken. I just really love the tool. So it's more of an
SEO specialist tool, but you can link this to four. And then inside of
the our dashboard, you will be able to
see the reports, I think somewhere here under
user or under Life Cycle. Somewhere here, there
will be a new report, which will be Search Console. So for product
Links, ads manager, so Google Ads, merchant
Center and search Console. Those are the big
three that I always. Alright, so that was it
for the Admins section. I hope that was helpful. I hope that you yeah
really noted down some of the important parts
because yeah, if you follow up the lessons, then you will notice
that there's actually quite a few more
important settings here that are not always
set up by default. So you do want to jump in,
especially into data streams, and you do want to jump in
and make those changes. So hopefully, you've got
that all written down, and now you are a
professional at setting up your GA
four admin settings, as well as ones for clients, and they will
definitely be impressed by your way of
cleaning up your data.
79. Coming up: Challenges: So in this final section, I've prepared a few fun
challenges for you. Some of them are hard,
some of them are easy. If you haven't
watched the videos, probably everything
is going to be hard, but if you did follow along, then you should get a few right. Now, I'm not expecting you
to get everything right, but just give it your best. If you're stuck, you can
just check the videos on that subject or maybe even reach out to
me if you want to. Just have fun with this because it's really testing
your knowledge, right? So have fun with
it and good luck.
80. Challenge 1: Session source: So for this first
question or challenge, I'd like you to go into the G four demo account
and answer this one. Which traffic source generates the most amount of sessions? So again, please use
the demo account. And just to repeat myself, the answer might differ
from what you have because the demo account occasionally
changes its data. So please keep that in mind. But as long as you can
find some report that shows you which traffic source generates the most
amount of sessions, then you can consider
this challenge completed. So please go ahead and pause the video now to see if you
can answer this question. So for the answer
to this question, you want to go to Reports, then under acquisition, you'll
find traffic acquisition. And now if you scroll down
here and you sort by sessions, which is automatically done, the answer is the
first one here. So for me, that's direct. However, this could
be different for you. So if you follow the
exact same steps, that means that you also
had the correct answer. So congratulations.
81. Challenge 2: High active user pages on Mobile: Next challenge is this one. Which three pages have the highest number
of active users? Now, this is the specific part, only include results from
mobile devices, right? So you're going to
have to look for a report or create a report that is showing you number of active users and
also sorted by page. And maybe you also
want to filter that they only include
results for mobile devices. So good luck with this one. Go ahead and pause the video
and see if you can solve it. So this one was a
little bit harder. So if you didn't manage,
then don't worry. The answer is you want
to go to Reports. Under engagement, you will
find pages and screens. Now, because we only want
to get mobile traffic, we want to add a filter for dimension select
device category. Exactly matches mobile.
And then hit Apply. So now we only see
mobile traffic. Then finally, we just need
to sort active users, and the answer will
be the first three. So the homepage,
anything that's not set, and the shop apparel page, those three are the
right answer for me.
82. Challenge 3: Average engagement time per session, by device: So hopefully you manage to answer those
first two questions. They will get a little bit harder as we progress
towards the tenth question, but this one should still
be straightforward. Again, you can use
standard reports or build a custom report
to answer these questions. Both is completely fine by me. Now, next one is what's
the difference in average engagement time per session between mobile
and web traffic? So kind of similar
to the last one, but this time we're looking at average engagement
time per session, and we're looking
at a difference between mobile and web traffic. So good luck with
this one. Please go ahead and pause the video, and I wish you very much luck. The answer to this question
is go to reports again. Now, in here, you want to go to acquisition
traffic acquisition. Now, we don't add a filter. We add a comparison here. So click on Apply Comparison, then mobile traffic and
web traffic it apply. And now if you look at the table under average engagement
time per session, for mobile, for me,
it's 32 seconds, and web traffic for me
is 1 minute 8 seconds. So almost double the amount of average engagement time on web compared to
mobile. So super cool. Again, if you get to the same answer in a
different way, that's also fine. It actually means that you are pretty experienced
already now with A four, and if you've done it using
the same steps I did, then that's the correct
answer as well. So well done.
83. Challenge 4: High engagement pages: Now, I told you these
were going to get a little bit more difficult
as we go along. So I think here's the
first real challenge. I want you to create
a filter which only shows pages with at
least 100 sessions. Now, which of these pages has the highest engagement rate? Good luck with this
one. Please go ahead and pause the video now. Now, this was really
a tough assignment. So if you've managed to do this, then that's really what
I'm I'm super impressed. If you haven't managed, don't worry at all because this
really was a tough one. So for the solution, you had to go to Explore, create a new exploration. Under dimensions,
you had to select page path or page title. For metrics, you want to
select engagement rate, as well as sessions. So for the row, you
want to drop in either the page path
or the page title. I'm going to use page title. For the values, you want to add both engagement
rate and sessions. And for filters, you want to click on this
filter by sessions, and then more than 99. You can also use more than or equal than 100. Both are fine. And you want to sort
engagement rate so that the highest
one is up the top. And for me, that's Android
Classic Navy ECOTO actually another
good answer will be Google beekeepers because
both of them are at 100%. It's just that this one
has a few more sessions. So yeah, again, this was a really, really
tough assignment. So, well done if you've
managed to do this. And yeah, don't worry
if you haven't managed, now you know the answer,
and I'm sure that you'll be able to find this
in the future now as well.
84. Challenge 5: Pages with highest number of exits: So this one is very similar
to the previous one. So if you've built a
exploration or custom report, then you should be able
to get to this answer fairly quickly just by
changing a few things around. So I'd like you to find which three pages have the
highest number of exits. Please go ahead and
pass the video, and I wish you a lot
of luck with this one. And the right answer to this one was to go to Explore again, create a new exploration. And their dimensions,
you want to find a page path or page
title, whatever you want. For metrics, you
want to find exits, and then just drag in
the dimension on the row and the metric to the values,
there you have the table. So now if you sort on exits, high to low, then the answer
is the top three here. So the homepage,
and the shop page, and then the collections
holiday page. So those three pages have
the highest number of exits.
85. Challenge 6: Highest grossing item: Now, this is where it's
getting really interesting because we're now looking
at e commerce data. I'd love you to find which item generated the highest amount of revenue between 1 June
2023 and 31 May in 2024. So go ahead and pass the video and please take your time
by looking up the answer. If you are struggling, I would highly recommend
to go back to the exploration
section and see if you can help yourself out there a little bit. Good
luck with this one. Please go ahead and
pass the video. So here's a fun one
because we are now looking at Ecommerce data, which is very interesting for
especially CFOs and CEOs. So the answer is, you
want to go to reports. Then under monetization here, you will find
Ecommerce purchases, and then you want to
change the start date here to first of June
and the end date to 31 May 2024. Hit Apply. Then final thing to do is
to sort on item revenue, and then here the first
one is our answer. So in this case, it's
the Super G Timbuk two recycled backpack. Funnily enough, it
has what is it? Like 500 billion items
added to the card. So yeah, this is a
great example of why sometimes a demo account
can be a little bit funky, but just know that the item
revenue here is correct. So this is the correct
answer for me.
86. Challenge 7: Purchases from Newsletter: So hopefully you are getting
some of these right. If you're getting
all of them right, then really hats off to you because some of these are
pretty, pretty difficult. But I have full faith that you all are able to crack
a few of these codes. So for this one,
how many items were purchased through November
newsletter, 2024 email? And I'll give you a hint. For this one, you'll really
have to look at UTMs. So see if you can get
an ecommerce report that's showing you
revenue per item, and see if you can sort by
UTM or even filter by UTM. Just see how you go, but that's going to be
my tip for you. So please pause the video and see if you can
correct this one. So yet another tricky one. There are actually
two ways to do this. So you might have gone to Reports and to Ecommerce
purchases again. Then you can click Plus here and find Sessionsurce slash Medium. And now you could probably
look for newsletter. But as you can see,
this is going to give you a lot of different
newsletters. We want to have the
November 2024 specifically. So this is one way
to kind of do this, but a better way to do
this is by going to Explore, clicking
New Exploration. For dimensions, we want to
use session source medium. Then for metric, we're going
to go for items purchased. Then drag this one into
row, this one into values. And boom, here we go.
And as you can see, it's already showing up here, newsletter in November 2024, so you can just write
down 1333 as the answer. You could also create a new filter on
session source medium. And then you want to
say it should contain November and then it should
pop up here as well. So November 2024 apply. So that should also give
you the right answer. So it's just a little bit better and easier to do this through the explorations rather than browsing through
the reports here. But if you manage
to find it through reports, that's also fine. You know, as long as you
get the right answer, then you should be happy. Cool. So yeah, another difficult one, but I hope you manage this one.
87. Challenge 8: Bounce rate, google vs. baidu: Next up is one that
I occasionally use. So this one could be
really helpful if you want to compare different sources and see if there's a
difference in them. So I'd like you to find which first user source has
a higher bounce rate, Google or Baidu, which
are both search engines. So please go ahead and pause the video and good
luck with this. So here's a tricky one that you can do in two
different ways. One of them would be in the
reports under acquisition, you will have user acquisition. And then instead of the first
user primary channel group, you can just use the first
user source and then look for Google as well as
BIDU separately. However, if you can see here, there is no bounce rate. And because we are
in a demo account, we cannot change this
report because normally, if you are in your own account, let me just show you.
And you do the same. So use acquisition,
first user source. Here you can
customize the report, and you can add
metrics bounce rate because it's not standard
on these reports. So if you would do this in
your own Gaour account, you would be able
to do it like this. However, because we are in the demo account and
we cannot edit this, we actually will
have to use Explore. So you want to click Explore, create a new exploration. Four dimensions, type
in first user source. Then you want to
add it to the row. For metrics, we want
to select bounce rate. Then add it to the values. Sometimes you have to drag
it twice for some reason. Then for the filters here, because they're actually
quite a lot of sources, we want to filter on
first user source, and then it contains or it
exactly matches Google. If you type it in, it will
automatically show you apply. Google is 28.6. Then we want to filter on Baidu. And Baidu is 41.7. So the answer to
this question is Baidu because it has
a higher bounce rate. So if you want to try and create two filters
here, let's say, I want to filter on
Baidu as well as Google, then you will notice that
this actually doesn't work. Oops. Let me just create
a new one. Baidu. So now we have two
filters set up exactly matches Google
and exactly matches Bido. However, it's checking
both of them. So what this does, it
actually checks if the first user source is
Google as well as Baidu, but it doesn't do it separately. It's only when a source
has both Google and Baidu, which, yeah, it doesn't happen because it's
either or, right? So how to do this, if you want to filter on
multiple things, you want to select a
filter first user source, then you want to select M rejex which stands
for regular expression. And then we just type in Google, and then I have this
vertical symbol. It's like right next
to your Enter key. If you want to press
Shift and then backslash, then you will get that one and then type in the
results that you want. So you can add more
here. You can add. Facebook, you can
even add Instagram. However, we just
want to have two, so I'm just going
to use Bido and Google. And then we hit Apply. And here you go. So now
it's filters both of them, but they filter separately. So now you have it
in one view, right? So that would just help
a little bit more, especially if you
want to compare, let's say, ten
different sources. So yeah, here we can see the answer to the
question again. The answer is BDU because it has a higher bounce rate of 47.1. So yeah, a bit of a tricky one. If you've done this
just filtering separately and just noting down one by one and then
comparing later on, that's also fine because you still get the same
correct answer. This is just a extra tip if you want to filter
multiple things at once.
88. Challenge 9: Google Ads campaign with highest ROAS: Now, this could be a tough one because we haven't spent too
much time on advertising, but we didn't touch upon it. So you should be
able to solve this, but please don't be too mad at yourself if you
can't because yeah, these are really
tough questions. So yeah, if you can get them
right, hats off to you. So for this question, which
Google Ads campaign has the highest return on
ADspend or ROAS, in short? Please go ahead and
pause the video. So which Google Ads campaign has the highest return on ad spend? For this, we want to
go to advertising. And this is pretty
straightforward. So under planning, you
will find Google Ads. Again, if you have this on
your own account and you don't have Google Ads linked, you won't be able to see this. Let me just give you an example. So if we go to advertising, it would just say get started
with advertising, right? So in the previous
section, we learned about how to link Google Ads and Jour. So the demo account has
one linked as well. That's why we click
on advertising, and then we can
see a few reports. So under planning, we
want to go to Google Ads. And here it's going
to already give us an overview of
Google Ads campaigns, and then all the way
on the right, we have return on ad spend. So if you want to click on
that to sort high to low, that means that
our campaign with the highest return on ADSpend is the HATS search campaign. It's actually returning 5.33, which means that for every
dollar that's invested in this campaign,
it returns $5.33. So it has a $4.33 profit. For each dollar invested, which is a really,
really great amount. Just imagine pumping a few
thousand dollar into this one, hoping to have the same
return on AD spend, that will definitely generate
you a lot of profit. So again, a perfect example of some CEO or CFO asking you which campaigns
are performing well. Boom, just like that, you can filter on return on
ADSpend and there you go. You can tell your
boss that this one is generating a lot of money. And, of course, they
will be happy with that. So yeah, also very important
one to understand here.
89. Challenge 10: Find the Measurement ID: So last but not least, and this is probably something
that you're going to do hundreds of times throughout
your GF four career, which is finding
the measurement ID. So for this one, what is the measurement ID of the North America and
Canada web Stream, which is a data stream. So for this one, you're
going to have to go into the Admin settings and go to
data streams to find this. So very much luck. And please go ahead
and pass the video. So one of the most important
things is to be able to find the measurement ID of a data stream because you will going to need it for
Google Tag Manager. You're going to need
it for Wordpress or WooCommerce, Shop fy. Everywhere that you want to link your Gaour to another platform, you will need the
measurement ID. So the way to find it is to go to Admin
on the bottom left. Then under data collection
and modification, either here or here, you will find data streams. So click on that. And
then as you can see here, there's one Datastream
currently set up, which is the North America
and Canada website. So if you click on this one, then it opens up, and then you will see measurement
ID right here. So you can copy it like that, and this is the answer
to this question.
90. Congratulations! What's next?: Okay. Congratulations.
Okay. Congratulations on completing school. Now, I know how difficult
this subject can be, especially if you've never
even used GA four before. If you've made it all
the way to this ends, you can be very
proud of yourself because we went all the way from the beginning from even setting up an account to all
the way in the ends, creating your own
custom reports, and hopefully maybe even doing
some of those assignments. So yeah, congratulations. What's next? Well, first of all, I want you to be really
proud of yourself because this is not easy
stuff to digest, right? It's our, it's analytics, it's data, it's
sometimes technical. And for me, I know it was a big learning curve
in the beginning. So if you've made
it all the way, just be very proud of yourself. Now, if you can
kind of, you know, feel the warmth inside and
you want to know a little bit more about data or maybe
some advanced tricks, then I'm hopefully going
to create a course on Google Tag Manager and Google Lukas Studio
in the future. So make sure to check those out. But if you were happy with this, you know, you are satisfied, then maybe you can
leave a review, so then I'm happy, and yeah, other people can find
this course as well. If you want, you can stay in
touch with me on LinkedIn. I'll put my yeah, I'll put my LinkedIn
profile in the description. So yeah, feel free
to stay in touch. Show me your amazing reports because they make me happy, too. And for now, just be really proud and I hope you
enjoyed this course.
 Auke Hilbrands, Analytics Nerd