Transcripts
1. Course Introduction: Are you looking to make great
parametric models and test your 3D imagination than grasshopper is a
program for you. Hi, I'm Brendan, or instructor to this introduction
to grasshopper course, where I give you an insight
in how grasshopper works, the few great exercises
to test your new skills. This course is a
comprehensive introduction of grasshopper leading
plug-in for Rhino 3D CAD modeling software that provides
a robust and easy to use a visual programming
environment for customizing designs using
parametric shifting. In this course, you will learn
the basics of grasshopper, how to integrate a
parametric script into your project for creating
intense warming geometry, how to solve complex
problems with algorithms, and how to visualize
3D solutions. Throughout this
course, you'll have hands-on activities and
sample file where you can learn and apply advanced grasshopper
functions and methods immediately that can easily be exported for your
projects and team. I'm a licensed architect. I had to make it parametric
architecture as being part of the design research lab
resided and Patrick shoemaker. In this class exercise, we will be going through
some of the exercises with your own twist, with the instruction declared
in the course materials. At the end of this
course, you'll be able to put parametric design,
the grasshopper, into your workflow and understand how to
make that better, imaginative design
with your word. So if you're ready to
get started making great parametric architecture, work with Grasshopper 3D. Let's go.
2. Chapter 1: Getting Started With Grasshopper: Grasshopper is a great program. Before we get
started this course, I was showing you some of
the things that we working on and also some of the
concepts behind your S number. Essentially, grasshopper is
a plug-in for right now. It's parametric. It essentially allows
you to use some of the functionality of
rhino and some of the functionality of the program itself with also adding plugins. Now, in this rhino seven, which I'm using
grasshoppers in built-in, I believe it's
inbuilt in Rhino six. Essentially, you can get your 3D modeling done the same time you're using a
parametric modeling. If you want to do something
like a unique surface or a certain type of
geometry calculations. You could do that straight
into grasshopper. The way that you're gonna
do that, of course, is accessing it via desktop,
typing in Grasshopper. It's also, of course, one of the plugins that you can always just click on to get to, in the way that you get to
grasshopper is simply by clicking in your standard
menu, the Grasshopper command. Get a drop-down
where you can also just do a grasp or player. Also can see the plugins
or just run that script. I'm just quickly basic
photographs upper. This is where we start
with all the magic.
3. Rhino Requirements: Before moving ahead
in this course, there's some little
rendering and rhino here. If you're new to Rhino, this is something that's
really important to using grasshopper. You probably want
to get your copy of rhino along with this. If you don't have rhino seven, which comes with grasshopper, you'll have to be including
grasshopper separately. But your knowledge of rhino
should really increase with your knowledge of
grasshopper because it's pretty much using the
same functionality. Course, one, rhino and
I'm just more to come. So go ahead and check out that other links if
you need help with your random modeling because that's definitely not bring your across our modeling
to another level.
4. Grasshopper Key Concepts: One important thing to always have when working
with any program is to have a good set of concepts that will lead you as
you work on a program. I've made five key
concepts are going to help you in any of your
grasshopper projects. The first, what is
input and output? This is important concept
because everything in grasshoppers going to have an input and the
theta that goes in. Now put it's going to
come out and do more that you focus on getting
these right before times, the better whatever
happens in between, whether it's a big program
where there's a code, it's going to work out or
just have that in mind, get a clear idea of
your input and outputs. And you're scripting will be more valuable and
more effective. The next one is you
want to focus and isolate solutions as
well as problems. What that means is if there's a part of your code
that's not working right, just separate it out with some maybe test variables
to see what it's doing. That's gonna really
help save time because you can't
really deal with a big, big program of time, even though grasshoppers
more visual editing, It's still operates by
the same principles. If there's something small, it's wrong, it can mess
up the whole thing. So focus and isolate to
get the right solutions. The next is Research times ten. And what that means is there's lots of great content
besides the help menu, communities, full
grasshopper scripting and learning that can
help you in your work. And I say, why not
find those guys? Learn from them? So that's gonna be a
major part of your work. And learning from this
course is one source. Some of my resources great, but also you can just go to several different
sites and find that. And that's something
that will always help you for is you want to save
your work pretty regularly. That's both in the
model and in your code. This is essentially meaning
that you don't know if your computer or cash or this is also in terms
of saving iterations. For instance, if you've
changed something major, save it as a version, make a key virgin, and then save your
things that you might discard in future. Met in another folder so you can always trace your work and
find out what was done. Finally, you definitely wanna maintain readability no matter how big your canvas gets and how many
things are going on. If you focus on readability, dividing things into sections, using colors, using groups, knowing which inputs
are for which, and just keeping those really clear and including
naming the files, that's going to help you
come back and get progress. If you're working on something, if you're working with a team, these are two type
of things that will help you get further. Definitely show that
professionalism and just be more effective
when you're using grasshopper.
5. The Grasshopper Interface: The first thing about
Grasshopper is this interface. What you're going to notice is it's not just sort
of like a window. In a window, you can
have your model and the background can be
working on your grasshopper. When they go into the
interface with like model, you see what everything does. Fully re-scaled the
Grasshopper interface. And xing that pretty
much it's taking from the entire set on the window though
I could close down, exceed those in the background. I can just click this box. Good at art again. You see it's a pretty
simple system and setup. Now you have your
typical farm menu. To open and close files, edit different geometry
or invasion site. You can change different
things about the view, decide what you're
going to be displaying. You also can work on how
the program is computing. All these code has gone on
and you're also helping you. That's obviously basic.
Then in your tabs, you now see the
different types of datasets functionality that
is going to be available. In Grasshopper. These parameters are typically different
types of geometry, Points, Curves, Lines,
numbers, texts, etc. Also different ways of input. This input within Canvas
would you see here? Then you have different
things like math. Math functions. Work with sets, creating, and work with vectors, working with different curves. This is the same for all
these different steps. Objects you can
work on analysis, division primitive
spines is utilities. You'll see the same thing happening with
surfaces and meshes. Then you have intersect, which is approximately
complex geometry right now. Then transform, which also
really great for how you're building out with multiple forms and different ones
to transform it. And then you have your
display functions here. At the end you have
some plugins that some of them have been
actually grafted into the main Grasshopper interface. So kangaroo has
been really useful. Lunchbox is something I
added to this software. And you'll see some great
things about that as well. Those are your OBS. Here are the Mello, all your tabs, your basic
Canvas and interface. At the top we're gonna see, of course, ability to save, to work on our Zoom
for the model. We can very easy to open
a new file here as well. So it's just a little
mini command bar. You can save your views, which is great because you're working on one
part starting here, the other part, it
will be saving that. Then you could also sketch
within your budget. And that's also very useful if you're highlighting something. You can go over to
the right hand side where it sees options about choice, about drawing. Different ways of working
with wireframe or shaded. You can also of course, do some other things
with boundaries and different qualities. So this is just
worked with view. Depends on what model
you're working with. The lower left-hand side, you can see some of
your common commands that you just click here. Click here you this. Based on the canvas. You might use some data
you're either common with. And then on the right-hand side, it shows you where you are
in your overall model. So if you're really deep in it, you get a little bit of contexts in your comp is can
help you find the way home. That's very useful. Now for interacting. And below it's looking
at your auto save information and also
different information about your computing
the solution. That's the basic interface. And I wouldn't go into
how to actually start to interact with your canvas.
6. Canvas Navigation in Grasshopper: To start off, we're
just going to be looking at some
simple ways of operating with the Canvas before really putting
any big code into play. The first thing you
want to look at is definitely
besides navigating, which I'm actually doing
by my right mouse button. And this also would use
my scroller to zoom in, click on any object
in the canvas with a left mouse button. I can drag it. I can write selection
window to select it. Do the same for left. Was partial for the
left or going right. It has to be whole. If
you're going write SP, partial, you're going left. That's the common thing. If you right-click
over any object, you will get the name of the object and you have
some options here. Preview, enable or bake
previews how it's gonna look. And the Rhino interface, we'll
look at that in a moment. Enables says if it's
running or not, bake lets you export it into
your model as geometry. You also get a chancellor
getting runtime warning. So that's debugging code. You also get to choose how was the wire are
gonna be displayed. And we'll look at
that when we start to put commands together. And then you have
here different ways that data can be dealt with. And list it can be flattened,
grafted, or supplied. And we'll look up the value of those when you have an option here to this right here
is the input object. You can set it to one
input or multiple outputs. And you also manage the
things that are in it. Also, when you have
the object in there, you can internalize
it or extracted, which is great because
that means you can make a model and then
put it all into grasshopper. Grasshopper has it, you
don't have open a file. That's definitely one critical
thing we'll talk about. When you click on the
canvas blank canvas area, you have another set of options. You right-click. You have the
ability to lock the solver. So that means pretty
much anything that's running, we'll stop. By default. The program is
continuously running. And so that means that any of the commands is going to be
continuously running. But if you lock it,
It's sort of keep to that one particular dataset. You'll see that's important with certain functions
that are sort of moving over time. Right-click. You'll also get the choice
to choose about Preview. So this is obviously when you're actually selecting
multiple objects. You can select multiple objects to turn preview on and off. You can enable or disable it. You can bake multiple objects. You just worked on
zooming in group things. You can cluster them. And you also can cause CO2, different things like your
preferences or navigation. And you can find
anything in the model. When you double-click
over the canvas, it gives you a
search keyword box. You actually can
just put in any of the commands that you want. So she didn't know
how to find line, which is a parameter. My geometry here. You would just pretty much go to double-click and you could find most things
you're looking for. So like I said again, like when you select
multiple things, you get the choice of grouping. You can select all things that you've grouped and ungroup. You can choose a
color for the group. You can choose a different
sort of outline. By having a group, there's this ease of working and you right-click and
you select that group. You can just disable
the entire group. You can enable United CB. Some of these are active, you can recompute here. That's a very useful way of
working with the canvas. And of course the
ability to Just maybe if you're
really close in Zoom, you just said, when I create
a Zoom, That's great. You can always go
to the wide Canvas. You can go to that previous
Zoom that you create it. And you can always just take out anyone that you
don't want to use. This as a great way of just helping you
manage your project.
7. Chapter 2: Grasshopper Command and Tabs: We're gonna go through the tabs. You're going to
learn about each of these particular set of tabs. And then I'm gonna go
into a great exercise. Of course, this
one's going to be really dependent
on seeing what's happening in the
rhino program itself. We're actually just
going to click on the perspective view. We're going to look
at the params.
8. Param Tab: Geometry: You can see the sort of programs that are
basic geometries and rhino points,
curves, all sorts. If you don't know the type, you can always just test it out. For instance, this actually
we are trying to say, oh, you know, it's a curve. Let me set one curve,
you know, go in here. And obviously some
of the commands are actually not what you think. Because obviously, sometimes
like the one for rectangles, actually I need to
create a rectangle. Whereas the one that
was creating the curve, that yes, don't have
the credit curve. You could just select the
curve and it's pretty simple. They're the same thing happened if you're
trying to get a point. You can click that
point. And actually, when you click Update, Kerrie can right-click
and say at 1 that was already selected. So that's what you're now
seeing is the object. We're clicking on it. You'll see it in green. If you're not clicking on it, it will show it in red. Now that is an option. You can always turn that
off for certain objects. The option to you also don't
draw a preview geometry. Preview up, jump
trees and options. It does slow down computer speed when you are
doing a lot of objects. I do like to see it so I
can just orient my work. Social. That's the workflow. You'll be getting your inputs if you want from
your model. Here. If you do surface, you can just come in here and double-click
the efficient way. Surface. Select one surface. One thing I've done here is I've created several
different types of surfaces or multiple
surfaces sub d, a mesh and a poly surface. And then the program, you actually going
to be choosing mesh. Meshes. Be rep is the poly
surface or solid. Here. The sub d is going to be the selection of
the body surface. In geometry, you also have
the option to create groups. Groups actually are smelly, and some of these
lower objects are just where you can select
the item in here. Usda depress shift when you're
clicking a button already, just said those things that he made together and you could transform or do any sort
of object editing here. You also can click on
just geometry raw. Jump to RA will select any
geometry within the model. That's a catch-all for
items in the model. So those are the two types of geometries that you'd
be working with.
9. Param Tab: Primitives: Next on this Params tab
is your primitives, where you're looking at
things like your Boolean, yes, nos, integer, the number. And they're each
looking a little bit different depending
on what is the input. They have the same name. But if you right-click, you'll see again
the name for that. The standard command issues. You also look in Boolean. See you can set it
to true or false. For color selection,
color is going to be set by different values. That way, integer is
just gonna be a number. You can also have
multiple numbers. You can just say, I'm
going to put this as 23. So now you put your
mouse over it, you see the little
tool tip that says 23. You can see the similar sort
of item for each of these. Color will be actually
showing a number. Primitives are
when we're looking at putting in more
numerical value. And so that's how
they're going to look. You also can include things
like data paths, file path. So you can choose a text
file to control some of the things within your
geometry, including time. It's great to see that you can really start to put
an appropriate time.
10. Param Tab: Input: One way to quickly
always check about an object, like one geometry. Us, we started used
the input tab. Most important thing
I believe this panel, because you can actually plug it in and this is what
we've been doing. We've been plugging in
a single quantum data. And it'll tell you the type of object that's being selected. I can select a different
geometry type. I could select sub d. And it'll tell me exactly what's being referenced or
if it's a group. He'll tell you the group. This also can be used after commands to find
out what type of data and the numbers
including that are export, other input things like
the number slider. We can slide in a
matter of numbers. You can do integers, odd numbers, even numbers. You can also have
a Boolean toggle, double-click, get those done. Have a control knob where
you can change a value. And that way you can work on multidimensional sliders
where your multidimensional removing these inputs are going to export pneumococcal
pieces of information. And I can just create
another panel. You'll see the type of
data that's coming out. Numerical slider or boolean. Also of course have
different things like a digit scroller. So that's another way of looking at data,
depends on what you need. You can create a value list. You can also create
calendar o'clock, so on and so forth,
including importing different types of
geometry files directly. You also can of course, just always connect two
things that's in the model. Input is very complicated. If you're not knowing
what you want to do, That's why I say figure
out the input first. We'll look at that
later in our examples.
11. Param Tab: Util: And the utilities,
we're gonna be seeing different things like working from different ways and how you're
going to move data, I guess, and work with
your programming script. There's a trigger,
somebody that happens, something else will happen. We can pick particular data. You can work on input. You also have some contexts big, then a couple of
different other items. I've never really use
this on an average, but sometimes it's
actually quite useful. Of course, you have your
option to data record. You can date of
record over time. So what you're doing in
the Canvas can export, That's your Params tab.
12. Math Tab: The math tab, we have several different ways of looking at things from math. We have, of course, the basic
operators if you're getting your multiplication
addition powers also have some boolean where we're
saying it's some of the equal than or more than
factorial modulus. These are gonna be here
and you will reach one, see the type of input. And it'll tell you
instructions on how to use it. Or if it's not really working, get destruction by clicking on, if I click on Help and I'll
tell you about the commands. The matrix is we're dealing with a larger set of data, of course, Matrix as having
multi dimension on an excellent and y domain.
This is very important. You're dealing with ranges. For instance, we're looking at the parameters and a curve. Knowing the bounds
is really important. So you can find out the bounds, you can create the
bounds of domains. And so that's very useful
in those operations. And you also can invite a domain and you can also
sort to deal with that. Now, on the other side of these, you might want to be
working with sets because the idea is you
want to work with domain. You can deal with different
elements in it was sets. Also, you can work
with polynomials. For instance, if
you're trying to get a cube or something. A little more important
set of things. If you're looking to put an
equation, you always canal. Very simple by actually putting
in actually expression. Expression is where you get the equation
ability to do that. If you're looking for
something again, stretch it, new keyword, but also maybe look to see maybe
it's on a similar tab. You can also put
in your VB script. So that's something
I like to do and I'll show you a little
bit about that. Because that's way of doing
some things that are in the program because you can be using the coding
language for Rhino. Then you also can put your
time in shock, the time. You can combine it. So that's useful for
different types of functions. For instance, if we were also
working with the scripts, like anything that you're
trying to put in your, I think, open up something and see what elements are
needed to go in. For this variable. This is a little bit
different than you click on the expression. You can choose a format. You can also say x times
two plus y times two. You just had to put in your
x and y, you get the result. For instance here where
I've made this x. Both of them are one. I just copy that and just
click the risk control copy. And just put one value
here, one value here. I created a panel and now we have a little
bit of an issue. It's telling me that it
has an invalid name. That's the issue of
something that's placed in with the
program's name. So you get the change in
name. It's a variable name. It's going to be
inside of the command, including if you're
using a VB script, you really need to be
watching those names. And I just create a panel
to find out the result. That's going to be four. That's two times two. We could of course just replace that with a number slider. We click on that and pull that over the left mouse button. And we can see that
changing in real-time. Trigonometry functions are
another set of functions. The sine and cosine. You have it right here. You also can find things
like the circumstance. Triangle. Trigonometry also can convert between degrees and radians. And of course, as always, there's a lot of
different util commands. This helps you deal with, again, some functions with this
type of data in mass. So you'd go out with a lot of math functions
within grasshopper.
13. Sets Tab: Overview: These set bar is another set
of information that you can use is divided into
two sequences, two sets into texts and trees.
14. Sets Tab: Trees: So trees are going to be the most complicated
thing that we're not really gonna
go too much into. Water, good resource
on a battery and use some of the commands here. Especially this is when a, when a command outputs one
or multiple pieces of data, it might offer it in
a separate arrays. Things like that are
going to be useful when you're working with
really complex data.
15. Sets Tab: Lists and Sequences: But the simplest of course, is just working with
simple list. For instance. If you're creating a list, you actually can do
that with sequence. For instance, if I just said
I want to have a series, series, I can actually
go to particular count. This actually has
a step already at one. This is going to ten. So if I go to my panel, I'll just drag this over
here and you can see that it's a list
going to dynein, that's, that's ten numbers. I can now go into my
list command and I say if I want to go onto
this list and I just wanted to get the first
item, it'll be 0. But if I put my
range or my slider, number slider in here, I turned to integer 0 to ten. Going to be giving me plug
this power set of that one. Give me that index at that item. You have. So if a function
like that and you can actually move an
item from the list, you can find the list, the length of the list. We replace particular items. You can split a list. It gets very creatively, also can weave items
that are not in a list and you put them
together using the width tool. These are course
all best learned with the application we're
going to show later. With sequence, you can do more
than this number sequence. You can also do Fibonacci. Just choose where's
it going to go till? You can choose. Of course, you can duplicate
a piece of data. Just having multiple,
multiple times. And that's an interesting way
of just making a big array. You can call the first or second or choose different
ways of organizing. And that's 4 bigger data.
16. Sets Tab: Text: The next thing you'll be
working on is working with sets where you can
create a set of numbers. Does this definitely
is more mathematical. So if you're more
experienced with math, this be something
you might be into. Finally, on this
tab we're looking at ability to create characters. Also work with
characters as opposed to saying a character
specific one. The ideas that were taken out, particular characters of text. You can ask process texts
using this sort of thing. And this actually can
be a great way to treat a file that you're using. And you also just
export things out 12 3D space as well. From here. If you're looking again to go into these commands, just want to play
around with it. Just do the basic item of just looking at
the type of data. Look at the function,
go to the help. Because there's way
too many commands for what you can really learn, even in a few hours. But we're gonna go
through a great example of just going through
these commands.
17. Overview: Vector, Curve, Surface and Mesh Tabs: Now we're going to
look at the vector bar because it's gonna be simple for looking at things like vectors are
curved surface mesh. These are all going to be
pretty much you're gonna be constructing things or you're
gonna be analyzing things.
18. Vector Tab: Planes: So different things like planes already useful when
you're doing a transform. Especially like your basic, basic claim, is going to be
used for a lot of things. You can also be construct
planes, flip them. Essentially. You can create
them from any geometry. So this is a very much
where you're going to just use your geometry
to work on planes. It's not that complicated.
19. Vector Tab: Grids and Fields: When you're working with grids, you have the ability to make
different types of grids. You can populate geometry. You can say, if we have
a 3D shape or something, I could just go in
here and say be rep for my poly
surface, set one rep. And I actually can just
go and say populate 3D. And you'll just be
within that realm. And that's a great
way, just getting your information right there. You can do that on a
2D surface as well. Making your grids is awesome. It's really interesting way
of working with default. If I go to File and we're not going to
save this previous one, we just want a large
object. You see that? We have just this basic
little grids that we create. And there's all sorts of
parameters for how large it is, which is the plane which has
produced a starting point. You can make radio grids. You can make these
rectangular or square. It ends, give you all sorts
of commands to work on these. The field command is
something that we'll use. But essentially, again,
it's really helping you to work on various geometry
within the vector world.
20. 2: In working with your points, that's the most simple. Obviously. You have the ability
to construct points. You have the ability to
both deconstruct points. Most common ones. For instance, you have your zeros, zeros 0, you can always
just change here. You can set a point to 0. You can add points
with UMass command, but you can, it worked with points that
are in your model here. And you of course can
go through a funnel, things that the distance. In the other tabs knowledge
to discover vector first, vector has very similar items
to the point area where your truck deconstruct
those who can find the unit vector that
will scale it to one. You find these directions. So this helps you
like rotating things. Very useful.
21. Geometry Analysis Commands: You'd go to your curved men. Tab. One grid thing here is that
you also have the sets where your vectors will come
from your cursor. Curve closest point. That's helping you to
get cluster point. This is one of those in our
surface command tab as well. You have the closest
point in P REP. That's a very useful way
of working with geometry. And then it's part of
the analysis tools. Addition to the current
shocking the primitives, where you can be
creating all sorts of types of lines or splines. You also can be analyzing
them, exploding them, joining them, working,
projecting them fillet offset. So essentially it most
things you could do an end run or be
able to do here. Key things that people are often using or the analysis
and division tools. Because you can
divide curves and get information, will go into that. The same thing happens. You also get length, the
sort of information. Same thing happens in your
surface command where you can look at things
like volume area. You can be getting things
like the B rep edges, work on the wireframe. Bounding boxes also
another command that's very useful for a few. Just put a bounding box. You can have a 3D geometry
within your model. It immediately
starts to give you valuable information that
you can now interpret. Little box here. I can just come here
and turn that into my B rep. Set that one be rep. This will give me
that bounding box. And if I wanted to box edges, box corners, It's actually
the way it's listed. You'll get it right here.
So this happens no matter what type of object
you're making for essence of I went here, my solid. I was making a very
simple sphere. Change that bureau
up to be this one. It's giving me my edges. So there's a lot of really
complex tools here. And similar for
analysis for the mesh. It just deals with
a different type of jumps because it's
not so much surfaces. So it definitely nodes was
mess edges, face normals. So this is a great way we were working in meshes
that you're creating.
22. Primitive Commands: Your primitives, you're getting to create it from scratch. You also can do a lot of
great China relations. Indeed, these are
some similar commands from a weaver bird that was
a plugin that was before. Utilities that are going to
go through. And all of these.
23. Util Commands: They're gonna do
some other things. Ways of working with
the vertices are different elements
within the geometry. Utilities will be
joining to be reps, filament holes in
offsetting surface. So those are all
gonna be similar. Depending on the type of
geometry you will find out what you're going to be
working with. These tabs. They have a lot of
things that are going to be relating to each other.
24. Overview: Intersect and Trasnform Tabs: This is a really important tab, the intersect and transform tab. I get to put these together because they're doing
similar things. Because it's more of
a mathematical way of working with things.
25. Intersect Tab: BRep BRep Intersect: You know, you're
gonna be editing things that are physical. And you have the ability to fold the information
that's gone on. For instance, now,
these two lines, now by having to be
reps that intersect. Simple. Obviously if you're
just doing it model, but if you're making a
very big set of geometry, the fact that
Grasshopper going to be solving multiple of these operating at the same
time is really powerful. So now, if we have to
be reps intersecting, then we will go ahead and just physical intersection to be reps versus a line
that would intersect it. It will tell us all the
ways that it intersects. You know, if you're trying
to do that with the plane, this exports, all I need
to do is right-click on these and click
on preview off. You'll see all the lines that
are actually intersecting. So that's a way of
finding that out.
26. Intersect Tab: BRep Plane Intersec: If, you know, if you're
looking at something like a plane that was
intersecting with those. This of course create a plane. If I just created a
plane in the model, surface and surface,
I can just come up. Great thing about it is also, it could be selecting 1. Sometimes, again, something
that you can create, some things it all tried
to create from the model. Get to choose here a
lot of things from my plane that helped me at
least determine that one. Now I can use my prereq
plane intersection. So if I was using one of these, I want to tell me where it
intersects with the client, so that can be very useful. I'm trying to get
section information. Give me curves and points.
27. Intersect Tab: Regions Intersect: The same thing happens
as we were looking with regions where you can split
items, you can trim them. These are of course,
standard things in Rhino. You could also do things
with particular shapes. So that's more of a 2D. Sometimes you can be having
regions for those together.
28. Array Method by Divide Curve and Move Command: You can also erase things. So that's also very useful. Of course is more
like linear versus, you know, copy to a point. Like if I wanted to copy things, I have a line would want
to go and divide my line. And I would come back here, select that one curve. I just made a take that curve. Now. I say, now I want
to make a circle. I want this circle to
be multipole places. One here, maybe
I'll just do LUV. And so that's very simple. Transform command get from
this simple euclidean menu. That's one way that
I would typically be moving things and what you do is you're
not going to appear. You'd be actually
trying to get things like the center point, for instance, like the
point of this curve. Now it's a curve so you really can't get us in a part of the curve
in the same way. This one you can explain
it would be different. For now, the circle,
it's screwing up. So the way you get
the center point of the curve right here
is you really wouldn't be looking add to the That's
sort of a curve middle. That actually gives us
another that point. So you can see some of
the issues that happen. We're working with these. Now. Actually, if you break down the circle into
this bounding box with this control polygon, you now can do your
center of the polygon. So these are some
of the types of things that you'll
be working with. But especially if
I was moving these this curve and I want to move it from the center point to
the line division point. I would just do a subtraction. Always a little bit tricky. Going to take the
point and subtract. This is going to
actually be a vector. I did this. You can see that I have copied this command into
these different areas. So you see how that works, where you're going to be
pushing your value here. And the great thing about
it in Grasshopper is that if you don't
work with my curves, I can just move
it and it's going to be moving parametrically. I can actually build it. I can say, what have I
have like ten counts. Then you could start
being no, the curves. Instead of just
the regular line. Your transformers
responding to all that. That's a little bit
of a combination. Working with a transform.
29. Array Method by Transform: Array: No, because again, I could come back and done that in this way. Where I take my base curves. This is my circle. I could take my my patterns. I could of course, because these are being used currently. Just click over here
and just disabled. But because I've done it here, you can see that the
way it's Saunders, not the way I want it, because
it's not directly on it. But if I move maybe the
center here, you'd see it. A bit of a similar thing. So there are multiple
ways to do things. You can find different ways. But it's always good
to know those ways in case one might have
a bit of an issue. You can always come
in here and change the geometry while
you're working on it.
30. Transform Tab: Affline, Morph, Util Commands: I'm going to undo that line, gives you some abilities for scaling, shearing little more. Effecting the physical
transformation of the geometry. Morphing does similar where
you can do things like mirror, stretch,
taper, twisting. That's great in a proton
that Grasshopper, because it will affect the grasshopper data instead
of the original geometry. So you won't be using geometry. Do utilities, you have
the ability to split compound duty like grouped
on a group and so forth. So these are the useful
or transform controls.
31. Display Tab: Overview: The command that's the sort of less that hourly code through because kangaroo lunchbox are definitely going into
a lot more complex, which you can get to
check my courses for. Gotten to this yet. Lunchbox will be x-bar. When the examples here, display gives you the ability
to show things in colors, to put dimensions on
things in your model. Altitude, creating Zake
graphs and previews, or just working with vectors. And it's great because it helps
you just organize things.
32. Display Tab: Point List: One thing I'm going
to do really quickly, the setup, our list of points. You can see how these
work in action. I'll click and create a points. Now. I can create a point
list about these points, but the first thing I'd do
is create the point itself. The select these
multiple points. Pointless command is here. You see. Now you don't have these points. And short of an order, I actually can be labeling
each of these point. What we've done here is
I've actually created a listing for my points
that I just created. All I needed to do
to add taxi them was simply create my text tag, which you can find here
and just go ahead and click on the Text tab. You also do a text tag 3D, and just come into over the command and you could
choose a size of the text. It can be very large. It helps you figure
out what's going on. You could click on
the point border. And this will help
you figure that out and that's used for
definitely worth finding out. If the orders of your low points in your model are coming out in the right way. The preview also is really
useful because it helps you choose different,
choose the material. You can have custom preview. So obviously, what
you're doing in Grasshopper is a preview of what the model will look like. It's always useful to have that.
33. Display Tab: Graphs: Graphs, you get a couple
of different options. You can make a bar graph. I can put in my points. Wouldn't really want to
put it in the points, but still gives me information. So it depends on
the type of data. It will have a different
interpretation.
34. Display Tab: Dimensions: Then you could be placing
dimensions in your model. For us, if you want to dimension
the angular dimension, you'd have to have your
point a and point B. And then you'll see how
much is the offset. And I'll put the
dimension pretty much constructed from those. I'll do an example here. I wanted to choose my first
two points. I can just do it. Index. We actually want to just
get that list item at the index list item will
just, He's going to say 0. And all we need to do with
us coming here, 11 plus one. Well actually list
want to atoms. We just click that. You mainly see like a
little dimension shrank here and your text. You can either find a way to, to make that what we need. Slides right now is
probably pretty small. Probably want to
come and make that. Maybe five. We get a couple more options
for what are we gonna do with that function. So we're offsetting it is one. Then we're seeing the
dimension right here. Still pretty tiny. So this is something where
you'd be working on. Are you getting the right size? And then of course, there's any problematic thing
that goes just come back and recreate your own
function all over again. That actually is not too
problematic and it's good to see that because it's something
you will have to do. At some point. You're going to delete text or you
change something, just go ahead and delete the little colon and
put it back in there. You'll plug and play
and it's right. You do the same thing if
you're trying to make different types of
dimensions are tags. The display command is up to.
35. Display Tab: Color Commands: Work on those. And the color command gives
you ability, of course, to make things in color and
it exports color information. So this is another way we can add complex
that's information. Within your grasshopper models.
36. Chapter 3: Twist Panel Project Overview: Now we're going to work on
a twist panel function. And it's gonna be a grasshopper
independent command. I'll just start by
creating my first tab, which is gonna be naming,
naming the project. So let's twist panel. This is gonna really
help you out. If you just always
free projects, the input and outputs. And if you don't know exactly, you set them as you go. Program for twisting wall
into panels or twisting. Panels from curve. Inputs are gonna be curves and
output is gonna be panels. In addition to the empathy, the geometry, we are going
to definitely tall, twist, twist above, mid and below. So you'll see what
that means later. But just create that first thing I'm going to do
after the naming, this is saving it. Nowhere I'm gonna
be working on this. Very simply, it could be made here and we're
calling this twist panels.
37. Setting Up Inputs: Yeah, I'm going to
make my top curve and bottom curve here. Copy this. One way to organize your
geometry or you're, you're actually
Grasshopper script. You can actually click
on these little commands here where you can actually pick them all on the same plane. This way would
organize this way. This wouldn't make them
solid in that way. So just note will organize
the script later. I wanted to have one top curve. I wanted to have set one curve is going to
be Meyer bottom curve. The top curve.
38. Sketching Out The Functions: To organize this, I'm gonna
do is we're gonna really simply make a little bit
of a group of this area. One way to make groups is the right-click whitespace and selecting these two objects, clip group actually can label
this as my start point. But it's sort of show
what's going to happen. I'm just going to
use little panels. The first thing is going
to be dividing the curves. We could then be going onto
like just click these, click. The next thing is
gonna happen is to, after the curves are divided, that I will be creating ends. These are the ends of panels. Then I will be creating
that next item. This is where I'm starting
to apply the twist. Top, bottom twist. I'll show you the
other twisting later. Then. At the end of this, that's actually the point at
which I will create a loft. Having this neatly organized
before even starting this is really useful like
and just arrange these four. They can move them as I go. This is gonna be lofted. Know what I'm aiming for. If you don't overtrain
for having one or two, useful to help you
figure out what's next. One theory is going to happen is I'm gonna be actually be using similar inputs for both
my transformation. So it might be duplicating. I'll actually create a group
what I'm doing to one side. So it'll be done
on the other side. So I'm gonna go
ahead and create. Now the rest of my input. There will be working
on the base commands. The control knob is going to
be controlling the twist. Now I have that setup. So now we have our
starting information. Now we're going to go
into our commands.
39. Setting Up Base Functions: Divide Curve - Base Points for Structural Frame: Base commands that we're
gonna be working on for this program is going
to divide our curves. I'm going to use
an, a quick method where I'm just going
to divide the curve onto like to divide it. Again, that's a good reason to have dividing these
different ways. I just want to divide
it as certain amount. So I think just dividing curve
the basic is gonna work. So that's the one
that's selected. So it's always good
to test those. I'm actually going
to create another little input number slider, and it's going to be integer. And so I'm going to set my
base at 20, my top 100. I'll just go ahead. And from that point, make sure it's an integer. I'll put that in here. So each of these curves
is going to be divided. Just going to be duplicating. Going to sort of
stop sort of quick. So I don't create
too much of this. I will just copy
what I'm gonna do. What I'm gonna do
is I'm going to now go into the end panels. What I'm gonna do is really, because I know I need to get each point to
create a panel at the top of each one of these is I'm going to
break the list down. First. Gonna really need to
create a list item. List item is going to
be where I'm going to be shifting. Before continuing. I did want to share this
little cheat sort of thing. Now you see the full names. It's really useful to
find out what's going on. But you also can always
go to your display and click on Draw full
names and it will just show the character. But as we're learning, I think it's going to fall Nimes,
it's pretty useful. The next thing we're
gonna be doing, pilot the curve C
above and below.
40. Setting Up Base Functions: Sorting Point Lists for Panel Edges: We are going to be looking into creating the two
lists so I can get 0. What I'm gonna do
now is I'm going to shift the list of points. I'm going to separate the
point list from the geometry. It's just gonna be the
points specific list. This is actually gonna be,
I'm gonna duplicate later on. Okay, so now that
I have this here, we're going to shift the list. Just one, back to doing that. I'm going to set
the rapt is false. So now this is gonna be one
less value from them here. What I'm gonna do is I'm going
to call the original list. Once you gonna be
the one to two. And the other one's going
to be that to one needs it doesn't need a top
one doesn't either bottom. Here's my coal. Now we have our col,
index selected. We want to make sure to
select the right index. So one way we can, of course, monitor what's
going on is using a panel. Original list started with 9
to this list starts now 32. That means that this listening lose his glass
item instead of 0. This sorry, losses first one, we're going to get the
length of this list. That's going to be
right at the top. Just move these forward. It's gonna be minus one. Going to send an expression here is how you set expressions. You just use x as the
number that's coming in. And you can put your
expression right here. You use things like Pi, pi, and you can also use
different other compressions. But essentially now I
have one that includes the that doesn't include the last and one that
doesn't include the first. So now I have the ability
to make polygons. Width this list. These are gonna
be my top panels. And I'm going to do
everything at the top. I'm gonna do to the bottom
as well. Top of the panels.
41. Setting Up Base Functions: Creating Panel Edges and Axes: So now what we're gonna do is
gonna set in-between point. Because that's, of
course the next step. We could either do is do a
midpoint, curved middle. When we made the
curve, will just go ahead and create that geometry. And we're just creating
a line right now. We're going to use a
line from two points. That would be this one. Starting that first and
then the next point. Now you see this is giving
us 20 lines going great. We're going to get the
midpoint voltage lines. That's going to be
our twisting from, we're just going to
perfect this simple twist. At this point. Going do a rotate command. We're just going to be rotating. It's going to be rotating.
It's very simple. Go ahead and make a simple axis. I'm going to click the midpoint is gonna be where
the axis starts. The way you do this is you just add this sort of like zeros
or one sort of thing. But it is that access point. Then we're going
to choose ankle. Just simplify everything. Get that angle. Get the line. The axis right now they're
all on the same axis. For our axis, we're actually going to create
that with a line. So that line is going to
basically be that midpoint. And then it's gonna be the
midpoint plus a point. We're gonna use R
plus to start this. And we're pretty much fine
to make a vector B points. To be constructed. Two points. We just go to the vector. Here, does the same thing. We're just going to
go up one click. Now we have that,
that upper point. Now we just need to
make a little line. We're probably going to
hide all these completes, all duplicating geometry. But that's gonna be
our access point.
42. Advanced Functions: Rotating The Panels: Now we see everything
plugged in. The control is rotating each
of the individual panels. And we're going to
do that same thing for the bottom and
for the middle. The middle is maybe a
little more tricky. But we're going to get it done.
43. Organizing Repeat Function Groups: The first thing
we're gonna do now, working into our next level, where we're duplicating
key commands. You want to select the
ones that are critical. Actually group those groups simply by clicking
on the whitespace. And second group. We'll just go ahead
and copy this. One way to do that
is select all copy, paste, paste, entire group. And you see that I've
added this point, the central item separately. So that's actually helped me. As soon as I click this end to be doing that on the base level. What I'm gonna do now is just in the same way
I did these points. Massey going to create
an in-between point, between this point
and that point? One way to just simply do that, it is really just
creating lines. Whereas these points
that come out, I take this point list and
this point list together. All I need is that middle point. You could just do curved middle. That's going to be the basis for this point all over again. We just did that same
thing where we select it all copy paste. Now we're just using
that midpoint. Now we have three sets. Now if we want it, the middle
operate a little different. We could just snap. This is
our twist for the middle one. We would tag that into here. That middle could be
operating separately. So now you have the basis. We have our first set. Twist happens here. Now we're gonna
work on our loss, but a little more complicated,
but we'll get it.
44. Loft Functions With Grafted Tree Input: We now have our three
sets for our panels. Going from the top
to the bottom. What we're now going to do is we're gonna be
loft in these curves. And as you can see
from our datasets, we have n result
in all of them are the geometry, just lines. What we want to do
is we want to now we've these lines,
they can be lofted. Let me just go into a
simple loft functions that you can understand
what Laughs are. I create two curves. If I move this up to 20, maybe I'll just
use my front view. The quickest way. Like go into my curve,
function. In Grasshopper. Be selecting one curve, then just duplicating that, it's letting another Curves. And I go into my loft command. What it does is it
will use two curves, know Lawson and I'll
do multiple curves in here by just holding on Shift. Often. However, as you can see, this is a series of
curves and ideas. There's no way it
could be plugging in this and it's wanting one at a time,
it doesn't do that way. But what we do have
the ability to do. That's where now
we're going to use this advanced set
function of we've, we've, we actually can
create an array of curves. What we're gonna do is we're
going to put in each curve, we're going to make
another stream. And the third one is gonna
come in here as well. What we're gonna do
on each one of them is going to graft. Graft is really keeping
them into a tree. Just like that laugh was done. Now I have these weaved. Do you want to make sure
that the middle curve is in the right place? It's sort of not in
the right place yet. This is the bottom curves, little curves, top curves. Now what I need to
do is when I go to curves will have them
all individually. Now, one challenge here is
that it's more than one. We have a little bit of a
challenge because it's just, or it's more than two. There are three curves
that I want lofted. Now as we're troubleshooting
a little bit with the width command
because we want to do some of them
are more intricate. Typically with a wave command, you would have maybe two values. The way you do that
actually you have multiple integer values
of 01 that we putting in those and you would go
ahead and unlocked it and that's how I would do the
top and the bottom because we want to internal twist. We have three values going on. So the way you're
going to organize that is in the pattern. You can make sure that
in the integers 012, just going to commit
those changes. And so this tells you a little insight if you're trying to do some unique stuff. But anyway, so this is all
grafted within the command. Now you're seeing that I now have a three-point
system here. I can always just come
close my top and bottom, and I could just be twisting
the middle of my wall. As you can see, it's very 3D. That's something that could be going to a 1000
different commands. So again, the width
command is incredible. It's very powerful. And so I've shown you this getting from the
start to the finish. Now we're going to work on
maybe making some exports. Make this into
something we've put in.
45. Baking Final Twist Panel Geometry: Now that we've
finished our function, I think it's really
important for us to just find out how do we
export this into vinyl. So we can actually
do some cool things. Export it can make
it into plans. Way to look at that is we really do want to make sure that our loft functions are close to each other
because there's no What do we want to export? Do we want to export
points or lines? What sort of geometry is going
to be useful in our model? And we already have, of course, our input base
Tomlin bottom curve. So I think just for right
now we'll just simplify it. Because again, we have a lot of points and other
stuff in model. One way to just
get those close is to pretty much just like
we're selecting our items, we're going to turn
off the previews. You off. And of course do the same
thing for our points. Now, let's look at
our true junction. What are we looking at? It's really just saying lofts. It's very simple. I prepare my model. For instance, I wanted
to put my panels. Maybe this blue layer, I'm going to need to
select this layer. I actually could just
end my loft command, just right-click and click Bake. I just select the panels layer and I can choose to
make it a group or not. I can name it and just some
other information to it. The mode locked or hidden, make it to be in
the display mode. Also academic decorations. Lines also use way. I'm just going to put it
into the panels layer. We'll look at that in line now. We're actually going
to close one eye. Only one thing we
see with Rhino. You close things. You actually have
multiple panels open. If you don't close
it, you actually can just either do new document if you're
trying to hide that, or you could just
closed altogether. We want to come back
to our commands. But inside of rhino and I
would turn on our shade. We can see the
geometry like twisted. It says definitely
not a flat plane. But each one of these has
its own individuality. Go to my other views. You see it all set up there. I could of course, just come in, give it surface thickness with something like
offset surface. That would of course
help that out. This is the starting point for whatever other functions you know, you're visualizing it. You say maybe I want to
come back in here and change the way it curves. Or maybe I want to make a couple of different iterations and show people could
all be done here. And so these are all
made in Grasshopper in their geometry that can be dealt with just like any
other Rhino geometry. You could work on material, different texture mapping,
give a thickness here, you're getting
actually avoid even turning that into
offsets circus. You just would, we say to here and I have
a little thickness. So it's a little more realistic. So that's really great to
just be putting into there.
46. Chapter 4: Hex Pavilion Overview Requirements Food4Rhino: This next exercise is going to be using a plug-in
from food for Rhino, which has a lot of great
grasshopper apps and food for ANOVA plug
in we're gonna be using is called lunchbox. Lunchbox has a lot
of different ways for working with maps
and different features. And you can see some of
their commands here. So we're gonna be using that. And I'll let you, of course, fans on the web
is you go to food runner, just sign up and
you can be ready to make incredible things. Dislike. You can see here and
you can work on some of the other things that
you're working on and implement even better
plugins with your geometries.
47. Food4Rhino Overview: After you have downloaded
lunchbox and install that, of course he was stop Rhino and soft grasshopper.
And then you restarted. It'll be ready for you to use. I will let you explore some
of the key things about it, but I will go over
the fact that it does have like starts with data tags. You can deal with different CSV. So it's a great way
of putting documents over and making
larger components. We also can have different
things with machine learning, the different mass, and also
different ways of paneling. And that's actually what
we're gonna be using today.
48. Creating Base Geometry and Input: Essentially, we're gonna go in Rhino and we're
just going to start by creating a very simple
sets of curves. Move that left one down. Go up. Just gonna be like
sort of generic. Now that's one of the
things through right now. Actually instead of copying
it, That's one of the, the ways we were working with R. Just want to
very light curves. Slight curve is going to be the attraction of
our geometry here. What I'm gonna do is I'm
going to sweep the geometry. We're going to be
using scraped function of the hexagon
surfaces. This one. The first thing
we're gonna do now, now that we have
our key geometry, you're going to come into
grasshopper and create the panel comic command
we have down here. This is going to be
our hex surface. Make sure to note that our
input creates hex surface. Output is going to
be a hex pattern. We're inputting the surface. You can, of course
put your author name. We'll just name this command. Sir.
49. Dividing The Surface for UV Input: So I'm going to now
create my surface. Input. Was gonna slip. The next thing I'm going to do is really start the inputs
that I'll be using for this. One of the inputs
I'll be using is also for a little bit of
a structure with this, I'm going to be using a UV so you get some
current information. One of the first thing we're
gonna do this surface. In addition to
keeping that input, we're going to make the
input for the division. And we couldn't find
that in our surface. Divide surface, grant and
click at the surface itself. You can see this divides it into certain view
of a certain V. I'm fine with that. Division is 1010 points. But what I'll take this cell, go back to my curve
command and I'll create NURBS curve
from these vertices. Now I have my 11 and
that's just you're using here X1 to change that number on each do is come to create a number of slider. Maybe these integers,
change it from. You just don't need that many. So this is the simple
basic structure for this pavilion structure. These are getting
that input I have here a diagram out what
this code is going to do.
50. Sketching Out The Functions: This code is very simple. I'm going to just create
panels for the base. And the base is this really put that surface structure. Then the first part of our command is where we're
going to is really simple. Create a pattern. Last part is we're gonna create our structure is very simple, but using complicated plug-in, we already have our vertices and structure and we
can go ahead and just anything that we're finished
with starting our points, we can just be filling that out.
51. Adding Hex Panels To The Surface: With our base input
already setup. Let's go ahead and use the simple and effective
little x pattern or Excel's function. And all of that needs
is the surface. We'll just use this. I'm sorry if that
we started with. Only to do now to
change that one. Does this create
numbers sliders for how many you and fee
that we want to use. Currently it's doing 1010. What we want to have
is maybe evaluate. It starts from five. I could go to maybe 50. I'll make sure that
this integer same, both of these courses make
it to a nice setting. We see a raise
along that surface. So that's great. That's simply using a great plug-in to get that set there.
52. Adding Complex Structure With Trees and Sets: One thing we wanna do
today is go a little bit further from the
hex pavilion that we were really starting with, because we're thinking about more architectural,
more structural size, we have to find some
more complex connections that would definitely
suit more structure. And so when I go into that,
it's a little more advanced. You will learn about trees
and also grouping of different information to get a little more composite results. When to start ahead with
our previous script. And we're going to save this
new as our hex foundation. This protects foundation one. And what we have here is
of course our surface and our hex surface above. Now the thing is, I want
to get certain selection of these hex elements. And the first thing I
really want to do is really find out the order. Because each one of
these is like in a list within this group here
from the HEX cells. I'll expand this out
a little bit here. So what I have here is I have my my set here of, of panels. And it also can be
a list of centers. What I can do with
those centers is I can pull those centers in. And I can go to my display panel and get the number for
each one of those points. I give it a nice round
size like eight. Says about 8 ". That's on the units. I can see what numbers are here. For instance, if
I wanted to start maybe selecting all the
panels on the edge, this edge and this edge. I'll just go in and look. And I see this one is zero. I see that this one is five. And the next one
on the line is 11. So it's like six between them because it's
like six in a row. So I'll need to do
is go to my series, which is in my sets right here. Let's get a series. And that series could
start in that order, like I have my zero at my five. Say that as my starting 0.0, my step could be six. And my count would be, let me see how large it is. And I see this goes
to 66 sorting. It's about 11. Okay. So with that, I'll
go create a panel. That panel is showing me that I'll be selecting
these particular elements. And that's just my
first, first set. Let's go ahead and
show that subset from the list, sort of list item. I would just take that set of curves and choose these indexes. So that gives me
all these edges. Alright? And if I wanted to, of course, maybe project these and have like little columns
for each one of these. I could just as the same
user project command. It's also on the curb functions. We just project a curve. And I could just take each of these curves and project them. And this, however, if
we want to protect it, that's just protecting
particular direction. We also could just directly, sort of projected geometry. Sort of directly
to the base plane. So sort of find that, that sort of workflow. That's gonna be
just the aligned, this is projected
straight to the C plane. And so with this little
information here, I have enough to start drafting. What I could do this sort of merge each of these
little datasets here, the predicted one and
the original one. And if I just came
craft both of those, I'm sorry, make sure
there's both grafted. So I'll have like
little column set here. So that's the first thing
I could do with those. I could do that, of course, for this side, I could
do for the other side. That's the basic setup. Now what I can do that started to get interested in
is I can start scaling the, start doing some interesting
functions with these. The, the scaling function is why I wanted to
start using an area. An area can be found actually
right here in the surface. So I can actually choose
that projected base. And it's supposed to just
sort of wafting it as is. I could actually just
come here and scale it. And we're going to go a
lot further than this. So make sure to find that you're learning
these little concepts. Is that centroid
I can have that. That's the center, that's
that little point here. And the geometry
is gonna be that, that projected geometry there. And you see here,
I'm scaling it. And I'll just maybe do 0.5. I use my number slider here. As opposed to going
from top to bottom. I can go ahead and use this. And the bottom previously. Or the one from the
point is at the top. So bunched up. And I could use that. And I can just very
simply have like an interesting thing here.
53. Adding Tween Profiles: There's another unique function that's in the curve world. And it's actually called
Pretty much tween, right? It's the curve between
and I think it's a very valuable
function to help you go-between like multiple curves is to find the in-between curve. You actually can
find that here under this plan menu where you can have like a top
curve and bottom curve. Like you see, I have
my skill curve. It gets have the bottom one. And I could have that top one. And it gives me a one
that's in-between. Just make sure that I'm
choosing the right one, Okay? The bottom one. And before the project, the one, I just use this one. So I would say definitely
find a way to keep these. So it's not too confusing. And actually what I
could do is actually could scale this independently. The currently has been
scaling it together. I can actually scale
that independently and create a much more
interesting loft. Okay, so what I'm gonna
do here is go ahead and take this, that center one. And I sort of have to do some
of the same sort of things. My area command only
works on flat planes. If it does, that's
actually not flat. I'm not going to be able to use my area command of what
I can do is I can make sure I have the point at
the center of my original, my original set, right,
my original points. And what I'll do is that
making that subset, to leave that here, come here. Take that point, set, put that point back
into this list, and now start to do like little
more advanced functions. So I can get some more
interesting patterns. I have a top and a bottom point. Since the now where I have
my list and I'm showing the point from the
surface and I have it. I have it like sort of put it in a separate area and
to keep things clear, you see I'm moving things out. But essentially I have my surface point and
my ground point, and I can just take
that centroid. And again, that's the bottom, my start point and
the top is endpoint. Now I can make a third point. And that third point, and I can just use that as
a middle curve, middle. And from that point, I can actually scale
my tween, right? So just like I've scaled
the previous one, I can now sort of
brings us together. And again, I'm trying
to give it space, so they're each have
their own area. And that makes it easy when
looking back on the code. And take my twin
curve as my geometry, take that center point
as the reference point. There's another way, of course, to get that center. They're different plugins,
but this is a simple way. But the base ligands. And I can just go ahead and
do number slider, right? And now this can start to do some more
interesting results. I'm going to go ahead
and lock the solver. I'm just right-clicking
and lock in Solver. You're going to bring that sort of discrete simple
relates to space these out. You could also click on
plus here to do that. I think that just showing you multiple
ways of doing this. And you can actually click
here and click disconnect. And I'll put this geometry
in the middle here and make sure they're
all graphed it. So that makes it a tree. So what I'll do now is go
ahead and unlock my Solver. And now I have like a bit of a curve function
to this as well. So I'm going to save this and you'll be
able to go through this particular code that can be done to any
of these sets. Right now it's been started with number one or
starting at zero. I could have done
that with a 0.5 and eight even luck sovereign to show you
how that would be done. Oh, just do instead
of just zero. Using our list here.
Like E is zero. And I could go to five. I could just go here,
here and turn this into multiline data, right? 05. Alright? Alright, and that
could actually be brought in. And what you see now is when I go ahead and do locking
of solver to mine data, you see now it's
actually doing to these. So it's really cool
that That's all you have to and that's
actually creating a tree. And because my, my view is displaying my fancy
wires right here, you're seeing where
my trees are. And we can go to
the program viewer. Params viewer is located. I know I have a lot of plugins, but you can see your perimeter viewer
on your, your base set. It's actually in your sets. New tree viewer, where you can really start to
look at what's going on within your model. Actually present viewers
is actually going to be found in this area. So what we're
trying to evaluate, what's going on in a model, what's going on within here? Again, I'm going to
definitely tell you several ways to sort
any of these functions. But right now what
we're gonna do is we're going to be a sperm
us right here, right? And utilities. We're gonna see how
this is organized. And so what we get
when we click on it, you can see like that'd be the numerical definition
of this is an array of 11. This is the rate of 11. But
if you double-click on it, you'll see sort of how
it splits off, right? And so I could put any
sort of set in here. It could be functioning just as well because
it's sort of a, I'm not flattening are the only graphing I'm
doing is at the end. And that's working
fine with that. Okay. I can even skip a set because I was
doing six before. If I want to make it
spread out, I could do 12. So you see that ability? Because I know how many, what is the max of avoiding going over the maximum of these. Okay, so that's,
that's a first set for looking at what we can do. Now I'm going to go into
a little more advanced one in the next. Define that what we
can do from making structure for our hex pavilion.
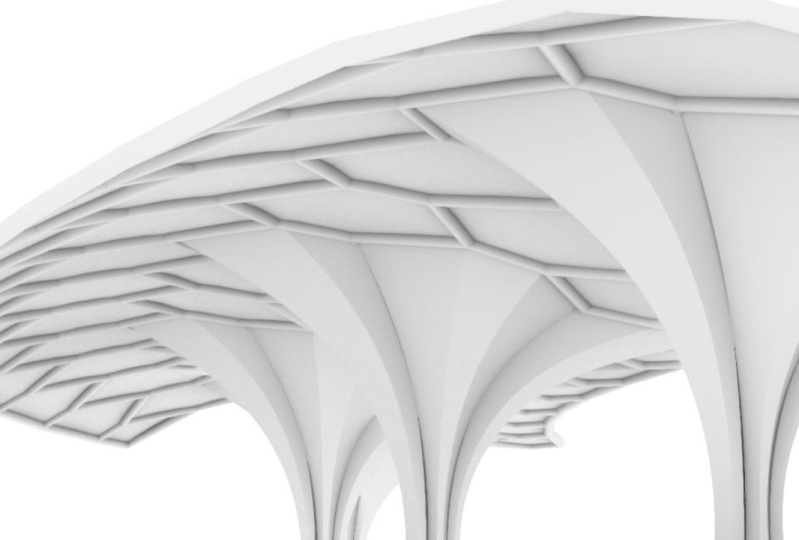
54. Creating Parametric Cluster Forms: As architects, we
definitely want to do a design of all sorts. We wanted to do something more unique than just
maybe edge columns. That's why you have,
what you see here. Where I have my
profile going down. It's like a flower column. And that's what we're gonna
be doing now as we're using a more unique tree of a set
of panels to create form. They go inside of here. We're going to work
on where we were. We sort of started on, but when a look at
our numbering list again to find out
a useful patterns. So a really useful pattern, it can be one of these, but obviously it starts to get more interesting
when you start to say, what if I have 1234 going
down that sort of pattern? And so I'm going to
look in here and we're going to see the numbers. And it will also an
account in order because we weren't
actually use a center. And we're going to make
sure that we can actually create a polygon
with these as well. So I'm actually going
to save this as hex foundation to this is gonna be a little more
complex definition. You see the final code
that has all of these. And it's gonna go 791310 a lot the solver and
get this started. And also I'm gonna
make sure to have a proper count because we need to know exactly
how many there are. And I'll tell you right
now, they're going to be four of them, right? Because I'm spacing it out
from this seven to 25. And you can do that again to 43 and all the way
to our funnel 61, alright, so that's
gonna be four. And so that's gonna be
our, our count, right? And our steps is
going to turn to 18 because we're doing a
different flower pattern. And so that's gonna
be multiple of these. You can do too. You don't
have to do the four. But we're just gonna go
through this exercise. Again. That was our nine or ten or 13 and we'll just make sure we
have the right one here. 791310. Okay. So 79.10. Alright, and that's
it, the fine here. Okay? And I've locked the solver so you don't see
anything right now. So I'm just making
sure that I have the right number sets here. Okay, so I'll go ahead and do this and unlocked the solver. Now you see where now it's
like a four column set. One thing I wanna do is I actually want to
have these together. I go all the way down. Like I don't want to just have it this way up here and
that way down there. So one of the ways we're
going to start doing that, it's going to lock the solver. We're going to make
sure that every time you see it, it's
gonna be together. And so what we're
going to firstly do is make sure when
we scale our bottom, it's time to be individualized. Restaurant a scale
by the whole set. And one of the ways
to get that done is to actually take those centers. Because again, we already
have our list of centers and we have our list of geometry. And we want to go ahead and say, and even now, there's no
reason not to show this. You can see this as we go. We have four sets of our points
here from the top right. And the idea is, the way ahead is sort of showing the four points at the
bottom as well, right? So you have a full point at the top and a four
points at the bottom. And the thing is,
I'd rather have that little point that's
between all of those. And so where I have here now, I'm going to actually
do a polygon. And from that polygon,
I'm going to go ahead. And actually when it go, Let's make sure we have the
right Write command here. As I said, polyline. We're going to use
all those points from the centers and ideas. We're going to actually,
I'll show you what happens is the first
time we do it, it actually is connecting
across these four sets. And that's because the tree
is this doing 12341234. And there's a great
function in the tree, sort of sets tab entry where we actually
can flip the matrix. And when you flip a matrix, we can go ahead and
take that dataset. And whereas before
it was like 1111, we can actually make it
so it's all together, almost like it's
these all together. And I can also choose to
make these clothes, right? So the ideas, you don't
want to add a list. And whereas before I
can use gram viewer, just type that in that
previous program viewer we're showing where things
are branch on the four. But the thing is I want to
have all of these points together versus this
list of points. And that gave me a
different type of tree where it's all in this particular set
versus all that way, right? It's still four, but the four
and it's grouped points. And I'll actually
have to flip it or flip it again at the end. But what I wanna do is use my area command because
this is planar. And that's going to be where
I'm going to base it off of. And now I have a new
set of centroids. Idea is now actually
only have one centroid. But because it's, it's done according to the tree
and it's grafted. When I scale now. And ideas, we're going to
scale before the tween. These. When I put this into here,
it's all in the middle. You see how it's all connected.
55. Creating Mushroom Columns: And right now it's actually a little unique
in terms of it's, it's all sort of bowing out, which is the interesting effect. But I want to really have
an effect where it's like more close together
and mushrooming out. Though this is an effect
you could explore. Now to get that one done, we're gonna do is the previous
set was using a tween. And that twin set was used to scale out by
that local center. But what I can do
now is actually, as opposed to doing that,
I can actually just use this particular point. Second it before, but
change the Z amount, right? And that's going to be a
way to help me say, okay, it's gonna be this center, but it's gonna be
up higher, right? And that also gives me a
degree of differentiation. And so what we're gonna
do is we're going to, and actually there's multiple
points that we have. We're going to use the
function point on curve. And this is going to
help us get a point. And what we're gonna do is
we're actually going to use a bit of a sort
of generic point. Where are we going to use
from the top to find a z? And we also could just sort of, sort of figure that out a
little bit by measuring it. The idea is the height
that we have is going to be something like 30 ft or so. But if we have the
curve that we have, we can already make that
curve from top to bottom by using our points
that we had before. So that's sort of
our base set of points or centroid on the ground versus a
centroid in the top. Right. So using this, this point compared to our
initial set of points, right? We have the ability of getting a line, just
like we did before. We can take that line. Now, if we do this, we're going to actually do
this by multiple lines. And because we're again,
we're trying to centralize, we just need the z value. And I'm not really going to be getting the center
of this again, because it's a little bit
harder because it's not planar. What I'm gonna do is
this really use an item. And we're going to take that in that list and we're
just going to take one of the, one of
the curves out. I'll even flatten the list is just so we can get
a general height. And I'm just using this as a reference for the
heights for this structure. And I'm going to use
my same point here. And I'm just going to
change that height. So I'm going to use
this, this effect. I'm just going to deconstruct a point when you're out
to space out this here. And I'll actually sort of
label little bit so you don't lose some of this. I'm going to use this
scribble function and essentially
labeled these again, these are our profiles
or hex, hex panels. Right here. These are our points or centers. And here is where this is
our sort of algorithm. And we can of course
group it afterwards. But this was again, this is
the algorithm where we're getting our, our
cluster centers. And these are in trees. Because I have my
one-two-three-four admitted into a cluster center. And I could of
course say it as fn, that I can just very
simply group later. I'll give a little space. And so the idea is
I'm going to take my flipped point and
I'm also going to come back here and I'm going to construct a point just like I deconstructed the point. And that's for the
purpose of tick in mind, same x and y. And now having a z that gives us a unique pattern where that
middle is going to go. Because currently,
again, that Twain, it's very nice, but each
one, those are not, they're not being scaled
by the proper center. So by using this center right here and just sort
of elevating it up, we're going to find
a good place for it. So the way I have it here is currently it's
going to be four values here, which is good because it's like it's going to
match with this tree. So we're actually going
to push this anywhere. And it's a little
bit having issues. So we're going to just simply
debug it a little bit here. Um, and the, the challenge we're having
is we're just going to make sure probably again is
just needs to be drafted. Want to make sure we
get that properly. And what we're gonna do here is just sort of debug
it a little bit here. So what I have now is I have four points fit in
the matrix back. I use this base point to the
scale my, my base bottom. Now I'm pushing
this also to scale. Now my base sort
of in the middle. And the concept is I
want to make sure that this one and this
one are connecting. And it's, it's, it's gonna be something you sort of
experiment with a little bit. But essentially
understanding this is grafted and this is going
to be graphed with it. It's gonna be the
critical thing. I think one thing
to sort of work in the world debugging is to
find out these points. We have to find out why does
that point changing in z? Because I'm pretty
much giving a point. And that's because
this data format, you understand this is
actually a zero point. And so separating this out, This point out, and just taking the Z is actually what
we're trying to do. So that's going to achieve that. So that's a little funny,
funny way of debugging. It's always good to
figure those things out. And you now can see what we're, what we're doing
with creating a, more of a parametric
curves here. And we haven't,
you know, that's, that's another function where we get started saying how much does that middle
part come in here? And we also can
choose out where's it gonna be, up or down? And we're going to finish
this out and we're going to, of course, bake these. But it's, this is a great
thing to play around with. And of course, as we finish out, also just saw a
little bit of how you can even get derivative of this geometry and start to do some more
interesting functions. Okay? So right now we
have our set here. We set our little cluster here, using it as a tree. And we set it up pretty nicely. And I think, I think we could just maybe scale the
base a little bit more. I'll come back over here to where we first scale that base. And we had a, we had
a factor of 0.3 here. And again, what we can do is
also just go ahead and put a scribble and label
this base profile. And just have that similar
one as we're working on the twinned or middle
profile. Okay? And that's really great. It can be done for several sets. You could do it at a two, you could do that a three. And then you just have
to sort of figure out the accompanying parameter as you go through that surface.
56. Baking The Final Pavilion Into Rhino Geometry: And we'll go ahead and
just bake this and we'll create some,
some layers here. We're going to go ahead and
just make them GH layers. We'll go ahead and make
a layer for the x panel, will make a layer
for also the stem. If you want to make
multiple versions, you can always do that as well. And we'll make a layer for some furniture that's going to be some other profiles
we put out there. Okay, so right now
with our lives, we're good to make that
into a baked stem. We can go ahead and take our panels and just by themselves. We can choose all of them that
are above this bake those into the hex panel layer. And so some of the
other geometry was really interested
in here, like our base. So the projected base. So we could go back
and find those. If we should just follow
how the code is moving. Where we took a panel
that we projected them. And this actually can make a very nice sort of
furniture feature. I'm, even if it's
even at full scale, maybe can be a little
lily pad type thing. And so what we're gonna
do is just turn that into a curved so we know
that particular output. Go ahead and have it here. We can bake that
into our fern layer. Okay, save this and
go to a blank file. So this is clear this out. So we have a lot of
things to work with. If I choose my fern layer,
select these objects. I could just make
sure those maybe up to 24 " and made
it so it's solid. And turn on my shaded. Now I could go to
my Effects panel, select those objects, and go into my object properties
and curved piping, make a more rectangular segment and make it maybe
6 " that radius. So now you have an
awesome feature space. If you go into Arctic mode, you can start to
see how that works. Now, one thing I would
also probably do is come back into my,
my heck surface. Maybe not make it
glass with this one. B likes of curved glass. I'll just go ahead and
just leave it as a more of a plastic sort of plaster. Does that make it a solid? You can see how
this could create some opportunities and also
it responds structurally. These sports work with these. And this gets support. And branch L. That's a beautiful web using grasshopper to
figure out a space. Just a little
add-on for you guys to look at some
architectural detail going a little bit further in. You can put people in
Little models here, just like my rendering. It's a great way and
it's very simple, just organizing your code. All the data is in there, grasshopper and is base toolset is great to help you
figure these things out.
57. Chapter 5: Intro To Grasshopper Render Preview: Have you ever wondered how
you would actually get your grasshopper code
into actual renders? I'm going to show
you that today. We're looking at the
class where I took these basic sort
of offset splines. And I use a render
preview function and grasp offer that they
will look like this, where you see these
are rendered. I've even done an
animation where I selected all these materials and it was rendered
in grasshopper. So let's go.
58. Base Geometry - Constructing Nurbs Curves: Okay, so where do
I start? Is with a simple curve and a line. And I'll just go ahead and
write the point of this code. This is for preview. Rotated, rendered under
rotated curve panels. Lets us, what I'll call it. What I'm gonna do is I'm going
to take the curve and I'm actually going to create a line. And that line is
actually going to be sort of a constructed line is not actually
really the geometry. But I'm to take the curve from the information from the model. And what I'm gonna
do is gonna break down the curve into
the control points. Already. I see that
there are five. So what I'm gonna
do it on a break my my list pretty
much into a list of each of the points. So each one of these
is going to be 0. This will be one, this would be two, this would be three, and this will be four. That's 31234, and
there'll be five. And fortunately, see this one. This one is fine. Okay. So you just see 12345. And so what I'm doing is I'm
going to add two values. And that's really going to be where I'm going to construct a point and I'm going to shut it or be this big truck point. And that's really
going to have a z coordinate that I'm going to really be using
a number of slider. And we're going to pretty
much go from 0 to ten scale. And that's gonna be
in the z direction. Essentially we're going
to make one curve going up on curve going down. There's gonna be some
minus for one set, has to be a plus
for the other set. And so I'll go ahead and
just login this point. And especially as our
vector geometry works, is add the vector to the point
and go in that direction, extend it and
you'll see what I'm talking about when it goes in. Of course, when we
look at this itself, it's not too much showing
it in sort of close. You see it now. And
that's gonna be how much it's got to be offset. So let me go ahead and
just plug these in. And I'm playing in
just the middle ones. I'm using Shift as I'm connecting multiple
of these lines in. You multi select and also
you press, press out. You can spread out the
canvas a little bit. We're actually
going to save this, just render preview panels.
59. Lofting Surfaces And Rotating Geometry: So now I have two sets because I wanted to
make these all curves. All I need to do is
now construct a curve. And I could say
it's a NURBS curve. Now what I'll do is
I'll just go ahead and it's already going to
parse it properly. Vertice shift. We're not going to use
original, obviously. We're going to use the new ones and they're already
going to be in order. And then I'm going
to use the end and do the same thing twice. And what I'll do is I'll
make sure to disconnect all. Then I'll connect top, like these, which
are subtracted. Then now connect the bottom. So now we see the set
of vector panels. So the next thing I wanna do is of course, with
this geometry, to loft, these top
and bottom curves, select the top,
redshift, the bottom. There we go with that. And
then I want to make a pipe, very thin pipe, maybe 0.1. This model. And I'm going to use pretty much the two curves
panel on the sides. I'm going to make
sure you press Shift so that they both go through. I might actually go a
little taller, maybe 0.3. And we're becoming,
go ahead and do that next element of
rotating around an axis. So this part is a
little more tricky. Essentially, I'm
going to take this geometry and rotate it. And I'm being very simple. I wanted to rotate it
at a bit of a range, like forty five, ninety
one thirty-five. So the way I'm gonna do that, I'm going to use the
function of range. And this pretty much says how many things are
going to be an orange. What I'm gonna do
here is I'm actually going to construct a domain. And when you
construct the domain, you just pretty much have a
0 or wherever it's going to. I could easily just go
to pi two times pi. So that will be a mind
to 60 because radians is the way that the angles
are typically read. So I just put my steps
but break that down. And this will have
all these ankles and orange do as both
rotate that loft. But I don't yet have the axis, so that's the one I think we
made that line over here. So we need to carry
it on over here. Now we can put it
in that geometry and add the pipe using shift. And it's a little
bit fat. What if I wanted to make
a little thinner? Remember I made this
as a number slider. And there we go. So
that's just making that beautiful set of geometry. But now we want to go ahead and make a
render preview of it.
60. Setting Up and Exporting From Render Preview: I'm gonna go ahead
for everything and just turn off preview. Make sure you right-click
over the blank space. Tonight. Preview off. And now we
want to actually go into our display panel itself and display panel warm like two
elements, two materials. I'm going to do one
custom preview. So what we're gonna
do is these pipes we really want to be
having as one material. And it's gonna be harder, solid, and we're going to have the
panel to be transparent. So that would mean we have
to rotate separately. What I'm gonna do
is go ahead, just duplicate this disconnect. I guess I want to
disconnect the pipe or the loft on the bottom. I'm going to disconnect
the pipe from the top. Right. So when we
create this geometry, that's gonna go in here, and it really is gonna
be to customer reviews. Or actually it's going to be too constipated because
it's different material. Either both materials
are going to be plugged in separately. And while I could just
click on these values for a material as like diffusive specular emission,
transparency or shine. You selected this
one type for color. Specular, gives you that
opt for that color. Here's option if
it's going to emit. Transparency is just
really a number. Similar for shine. But I know that my panel
will be transparent. I'm just going to
set it in here. But as I want to for sure and as we
check that it's there, I want to see the color. So I'm just going
to set the diffuse. I need to just go
to my params and to my Color Picker might be the
easiest way for all people. And I just plugged that
in and that also would go for going into the specular. Or if you're going
into emission, those are all able to be
plugged in with a color. So what I need to do is just
plug that geometry in here. And all I need to do is
go into rendered mode. And so now what we wanna do is as we're plugging
into the mixture, when you putting in transparency
is actually 0 to one. So I put in 0.5%. I'm going to turn off my
preview for this item. So now I just see the
rendered parents. And so you can see,
of course there's the rendered as you
change the color. Now I'm going to do the
same thing for my pipe. My pipe geometry is sort
of the general right now. So I need to do this, come into here and plug in the diffuse. I can just choose a color. And now, because you can
see we're in rendered mode, so you see a beautiful
set of rendered geometry. And if you just click on Render, that geometry will be rendered. Just be ready to dislike
the typical rhino geometry. So it's a really beautiful
way to get your result.
61. Animating Grasshopper Renders: So you can just do
a simple animation. I'll just show you a
basic of how to do this. But it will render the geometry that's not even really produce. So it's sort of fun there. And I'm doing is I'm going to close the rhino
render window. And I'm just going
to go to here. And the great thing
about, of course, is also, now have I changed
the slider or anything? It might be slow sometimes, but it will be going one way that people
can, of course this, this to get it exported
is of course to just do a screen capture if you want to just play
around with values. But you also have the
ability, of course, to set a trigger
for animating it. I'm not gonna do that right now, but I will show you how to
animate in general with Rhino. So you click on Render
tools and you see in here, there's an option for
different types of animations. You can set up a son study
in fight to animation, path animation or 360. So I just did a 361 and an options here I have the
options for how many frames, which direction, and
pretty much it's going to go on the center of this window. And it tells you which view port and the capture method
and render preview, which it's right
into the one there. You could also do full rendered that's going
to definitely take loans. So be mindful of that. And pretty much I just want
to do it really quickly. I'll just set it to five. And I'll do is either
click this little arrow. So again, Player Start or just click that and you see
it's gone really quickly. And I'm actually going to
center it. And let's see. I'm going to do now
do sort of again. Sort of see it sort of changed based on where I was located. So if you want to
change where it's going to rotate farm, you
do it from there. And what you wanna do
if you're going to render it, is you click here. And this will actually
go to the Render dialog. And it'll go by the
render folder that you currently have setup
or it will create one. Just be mindful of that. That should be in your options. And this is how you do a
render from Grasshopper. Great little skill. It's something you can
plug in so you can visualize and share your models. And rendered mode.
62. Chapter 6: Plugin Guide: One of the great
parts of working with programs like
Grasshopper and using Rhino is the type
of resources and plugins that you can
use for your workflow. Right now I'm looking at
the website Food4Rhino. That's where there's a
lot of great plugins that you can really
incorporate in your projects. He's talking about a few of the key plugin is going to
talk about the base to those and how to use those concepts we're finding really
good plugins. Essentially things that can help you achieve better Analysis, better formed
development that form finding and better solving
different types of conditions. So let's go and take
a look at it and we'll go into each
of those apps. The first African look at is
gonna be kangaroo, physics. Kangaroos like a
really valuable plugin that helps you put physics
simulations and duty. This is not just that you
will get Physics data, but you can put
that into form and, and really get into some
valuable information about it. What can you really can do is Base definitely on
the current version. So you'd be basically
download it and look at the instructions for
how to install it. You can find those on the
food for Rhino website. And we're gonna go into this one and figure out how to really get some really cool graphics
and project development. Lady bug is another
great plugin. And it really has its
own particular sweet. They even have outside software
that helps you connect pretty much the world of environmental design and
environmental computation. So there's a lot of plugins
that are under this sweet. As you can see, you can
get different information about climate data. It plugs into different
open-source software and let you do things with Sun, temperature, lighting and
pretty much helps you design better architecture
that's applied. And so you pretty much
will download look for the different version
and also some of the different apps
that are included. For instance, some apps are not going to be in
the latest version. You have to check and make
sure that it's down here. And also there might
be some other plugins that you need to download
to get these around. For our purposes, we're just
gonna download the basic
63. Introduction Evolutionary Solvers With Galapagos Solving Area: We're going to look
at the first Plugin of the code for Galapagos, which is a plugin that's
already built-in. What I have here
in my model to see as your basal 1ft With
Galapagos exercise, it's pretty much has a
footprint and the inner core. And the thing I wanna do is I'm going to divide this
in equal segments. However, I have
unusual footprint. So that's going to be
where something like Galapagos is really valuable. Galapagos can be found here and utilities at the bottom where it says up of Galapagos and offer gene pool on its fitness
landscape is related. These are pretty much your core for developing
Galapagos scripts. I have my input of my outer, of my footprint
and my inner core. Divide these into
equal segments. What I'm gonna do is make the equal lines that
are going to split them. Variables, which you can
also call those gene pools. And so what I'm gonna do
for each one of those is after making sort of a surface that's
gonna be divided. Or I can test Area versus just need just
doing it by hand. I'm just going to
say, Hey, look, I'm going to make a line. I have two points, point a, point B for each one of those, those are going to plug into my Galapagos to find
out equal areas. What I'm gonna do is after
course making the boundary, I'm going to create both my
point, construct Points. And it's simply construct point. It's going to be where
I'm going to have a, this is actually about 40. I'm gonna go negative 30. 30. And that's gonna be times 12. So negative 360. I'm going to put one for the right side once
the left side. So that's kinda
be my first ones. And the variability for this is actually going to
be in the y-direction. I'm going to create
a number slider. And that's going
to be my gene pool variable for this one, right? Then I just need to create
a line. It's very simple. Start point and endpoint. Alright? So I'm going
to duplicate that. And it's going to be
at a different way. And I'm actually going to say exertional moraines right here. I actually wanted to have,
is that a much higher range? Now, even just measure here so I can know exactly how
much that's really, what I will do is
make this stereotype. And I'll just set it up. Let's go to my range
of negative 40 to 40. And we of course going to, of course multiply
that times 12. So it's more for 84 times 12. And make it a four at, Alright. Give me this full range. Alright, I'm going to
duplicate this one. I'm sorting these magic bowl. One of the higher-level
one is a lower level. And I'm gonna make
one now can be based on very adding
in this direction. And so we're gonna go
ahead with this one here. This one as opposed to wherever. The y-coordinate. I'm now going to use my control two disconnected
from the y-coordinate, connected to the X. And this is what
I'm gonna do now is connect the negative 40,
which is negative four at. This can be for at. Those are going to be
where those are connected. And actually the same
to be negative here. Here. Lecture that's the right value. And this one, again, this is gonna be the
x-coordinate that it's changing around in. This is really
starting positions. Okay, So I have three plugins from my gene pool that I wanted to be moving around to find
out best Area combinations. Because it's again,
it's unusual shape. That's sort of be the
calculation issue. Okay. So I have these three lines. My fitness set and all
in to do now is using Intersect command so that
I can now intersect my My BRep with the curve. So that's gonna be
my main surface. With these three curves, I could either merge them or just all sorts
of disequilibrium. But I think merging is
gonna be a little planar. So you know what the
plugin is going. Alright? So we'll just give it a little
bit of space there. Alright, and so these
are gonna go into here. We can put our mouse
over the Curves and we find out that it definitely
is a dividing it. And it's sort of saying how many know sets is
it coming up with? So our division is gonna be that sort of set of
what's going on and we're, we're gonna do now it's here, even setup Panel so we can test what do they output of it. Okay? So we're getting like all these sort of
intersection zero. Yeah, that's for just
getting that physical. How many maybe intersection. If you want to actually
get that split area? We would have to split the BRep. So go ahead and make
sure we have the, the code so to get that
split BRep information. So that's gonna be our
next, next challenge. So we're just splitting at that surface to this
one, found the lines. And we're actually going
to use this one more to find the actual in Surfaces. That's where we'd get
the areas from there. We're going to put
our curves here. That gives us the fragments. That's gonna be a little
easier to get home versus just those intersections
though the intersection, obviously, this manipulation, we actually get that as well. But for our purposes, surface, but it's gonna be the
proper function. Okay? So we're gonna do, believe that they're just plug
it back into here. So we have six regions. We have here is the
ability to get the area from these as you plug this in. That area, final area value, or sets of areas, says, what is the difference
between all these? And that's, that's gonna be different because
they're not equal. And I do, I want
them to be equal. What I would do is I
would definitely be getting what are the bounds? This is how I can start to
get ready to plug this into Galapagos because I need to have that final information
rabbit bounds. I now know when I
deconstruct my, my domain, that's going to be telling me the largest area in the small theory and
ideas that are equal, really that to be zero at
close to zero as possible. Right now, if I go ahead
and plug each one of these N to see that if I
subtract one from the other, It's obviously that this is not going to be zero until it
gets to a better location. That's what I'm
gonna do is I want to just really subtract the smaller number from
the larger number. And that's going to tell me
how big is my difference. That's gonna be my number value that I'm going to be Plugin, and that's gonna be my target. Okay? So this is my target. These are my input genes. And we're going to use
Galapagos to solve these. We're not gonna go ahead
and from the main Util bar, we're going to go in
and click on Galapagos. Now, the fact is I can choose
these as my gene pool. But I will say there's another
method with the gene pool. I could actually
make this slider and then pretty much pull from the slider all my values I get. This is the gene pool where
I can click Edit and say, if I had two values
I wanted to test. And I could set the
maximum minimum for both of those off
the decimal value. That can also plugin
just like the slider. But since both the slider
and this can plugin, it's, it's, it's gonna be fine for me to use that for this purpose.
64. Using Solvers With Galapagos: Okay, so now that I have view setup, but I'm gonna
do is I'm going to, from my Galapagos Plugin, hit my genomes to each
one of these sliders. You see it's, sets it a little line and
I'm going to press Shift because I
multi-select these genomes. And it works a
little bit different than just a particular merge. So just be mindful that this is really
sort of see each one, okay, so it's selected all
of these genomes or genes. And fitness is going to
be based off this number. This is again, this is the
number that is the difference. Like they're not in a place where they
need to go right now, as opposed to the normal
way of plugging into here. You actually plugin
from the collapse was app and it's sort of
shows where that's from when we have
all those values. The next thing that we can
do is just simply go in and double-click on the
Galapagos function. Now it goes into
Galapagos environment. This is the Galapagos Edgar, where we're going to really be pursuing the
function for Galapagos. And the idea is, it talks about different
elements of fitness. So we're either trying to
get a maximum or minimum. Those are the options
currently and it only deals with one. There are some Plugin,
more than one goal, but we wanted to get
the smallest one. And there's also some
limits where we can say how long it will run or we could just let it continuously
running and we stop it. We also have option
for determining the population sort of how much do we want
to really go into variation among this set? And you also have
like some help. Barnesandnoble more about
Evolutionary Solvers. We're just gonna
do like simple for this minimum set when you
go into the solver Area. And we can do it as we
plugged those all in. We can just start to Solvers. As we start that solver, it's gonna be now testing like some random
locations for this. And so the idea is it starts off random and
it starts to get averages. You see right here, this is
what the area is currently. The difference between
the smallest and the biggest area right now is it's not that low because
it's still trying to say, Okay, where can I go? Can I go very high?
Can I go very low? So you will see that it's,
it's different areas. So what I can do is
I can start to limit like top 50% of genomes
at the top 25%. You see, it's starting
to figure out what location is going to really good for
getting an equal value. Because it's a
pretty big, right, and it's trying to balance all of those genomes
at the same time. And that's sort of
language it uses for sort of testing
that variable. So as you see, it's getting down pretty low. And I haven't set
a particular time, it can actually
continue to continue that value and just sort
of play around with where can it go for lower
and lower and lower. So it can get that
even division. Okay, so I'm just
letting them run. You can let this run for a little bit to see
how low it can go, because the opposite
could get to zero if it is taking long enough. So right now of course, it's gotten as low as 60. And again, that's supported by the way that I've divided
it and had it start. So obviously, you know, if some of the things are
not really possible, it will let you know. That's, that's gonna be one
of the tests that you can do. But if I was to say that, I'm fine with looking
at the top values now. And we'll just stop at just for sake time where I stopped, Solvers said, okay, that's
the closest they can get me. If I click on any one of these, which is our output, we can just clip in one. And we could just say reinstate. And what it'll do,
it'll show the values at a location, right? And if I go maybe
the top tennis, something like do
the same thing. And it's been relocating and moving up a
little bit to get a closer value to the
perfect one, right? So that's sort of, sort of where it is,
how it's organized. That's going to be
now setting here. I can of course, record these
here and copy this out. But also, if you look
into the window again, you can still see in the window for Grasshopper
all the values that sort of got the most
even results already, right? Because the important for that is obviously
when you press Okay, you actually lost
that simulation. But it was really good
at sort of finding out where you can locate that. That was just one
of the one ways to get a Galapagos Solving. And again, it's, it's
trying to get as close as possible with the
constraints that you give it And one way to, of course, think about as you can always, you can use different
types of genomes. You can change the
location of the core. Say, where could the core B2B the best for all
the equal areas? And so that's one of the
benefits of what you can do with the Galapagos set for
this type of situation. And we're just gonna go
ahead and just save this as Base Galapagos Area. After you finish
any one of these. Obviously when as a result, you can just simply go
and Bake your results. If you've gotten down to a
certain amount of for that, you can always just see
what you have here. So this was really close
to getting equal areas. And so the ideas, maybe we should change
something and design so I can build a more easy
to get that equal area. They region, reduce the size of the core, etcetera, etcetera. Okay, I'm gonna go
ahead and save this. And we actually do want to show like another
variation from this. Because for this particular one, I had it as having
just the same Y. If we wanted to say maybe we can rotate these walls that
we have low angle. I could always come
back and actually do a separate genome for each one of points. So now if we wouldn't
limit it that way, makeup here, do the same thing. What I do again is
that I do have to now connect these new genomes. I'm going to press Shift,
connect here. Alright. So again, it's everywhere. I've just added a new input. So now we have made a
little more complex. We could do that
again. This just to see we get a
little more closer. We can minimizing it. And we're going to go ahead
and start that solver again. So this is going to
those Functions. And really you can
look around this, the Rhino is by becoming
little bit slower. But because we have
that little variable, it can now rotate a little bit. You can play a little, play around a little more and
get it a little bit closer. So I've increased
the freedom and how my gene pool can vary eight. And it's getting much lower
values in terms of saying, Okay, now we're gonna
get that equal area. So that's one way
you can start to refine a script like this. Again, you can change. You have multiple
types of genomes, but you have one
particular goal. And so that's gonna be,
that will be a constant. And you see this is
getting a really, really, really close
to equal areas. And obviously going down, it's just a matter of time, How long has it, but we're
going to let it go down. I'm going to actually let it
go down to competing like 1,000 square inches, really. That will just take
a little bit longer. But again, that's going
to be the basis for understanding type
of script like this. In Galapagos. What we're gonna do next
is going to like a more of a Shortest Path solution, which is another type of wave using block
because when you use the gene pools instead
of this particular set. And again, we're
really close here. This is just a, a
valuable tool for exploring different ways
of configuring data. By Evolutionary computing. Now we're almost at 1,000 and I think we're
almost there very soon. And it's just really
testing every combination. We just go to that top 25%. You see, we've
already gotten there. We'd just go ahead, stop that. And we have all the
values that we need here. So the benefit, of course have Using the gene
pool is that we can just say which particular
gene pool and just use a particular gene pool for
a particular set of values.
65. Finding The Shortest Path With Galapagos: Now we're going to work on
a Shortest Path Galapagos. Evolutionary exercises
use that gene pool. We have a region
that Bjarke setup. And we're gonna go ahead and use a Point Cloud
creating public 2D. Right here. We use
that as the region. We just kinda do 50. This within our Panel. The length here we're gonna do now is create
circles on each one of these. And we'll just do
a simple circle. We'll use that point. And when to use a one to 20
slider to set the radius. We don't have it obviously intersecting and we don't
want to do complex. So something like this. It'd be like a general
way to get through. We're going to
create two points. This is gonna be
part of our genome, but we're going to edit
them and we're just going to adjust it with a line. I would go ahead and
just create that first with a construct Points. Got these two points
beginning at N, one, negative 121, one-twenty. Get our line here. Starting to endpoint. Idea is we're trying to get
a navigate through here. And so by just create a line, of course it's gonna
be intersecting. So we need to start
finding ways to get through here as well. I'm gonna do is I'm gonna
go ahead and divide this line by this curve. And it starts off with
1010 might not be enough. But when we said that the more like 15 divisions and the end is actually going
to be 16 points, right? And so each of these 16 point, this section, we're going
to use a gene pool. I'm going to have
that gene pool. And like we said,
we have here is 16. Then I give it a leeway of of
how much to go up and down. And right now it has
like zero to 100. We're going to make
it negative 52, 50. We're going to just be
using a Move command to create a new set and
when to use a unit. Why? We just have a proper vector
for how that's moving. It's figuring out where can it go through
this area. Alright? Though it has a
particular range already. Alright, so already
have this setup here. And what I wanted to do now is test the intersections between these spheres
and this line. And what we could do
that, that's very simple. With this. This has to be turned
into a polyline. Find this, keep it
as a polyline test. So this will not be a polyline. And our original curves that
we have with our circles, we can do is create
an intersection test. And we're going,
should we do here, is really working or physical multiple
curve of intersection. We really don't have to turn
it to a solid for this one. We just do emerge where
we hit one set here. I have a polyline. Now we have how many points
that are intersecting. Now it doesn't have
any intersection. That's gonna be a no. And we need to have that
as an option because ideas want to go find how
many times it intersects. So we have to do a test
for if it's a null. And this is one of the
test for if it's Analysis. Here. If it's a no and
we just put a list item, we just use the first item. If it's a null, we need to
have a different outcome. So if there's just points,
that's gonna be one thing. Now we're gonna do a
length of that curve. And what we're gonna do is
every time it intersects. So if it's intersecting, we need to give a
little weighted value. And so I'm gonna go ahead
and put a value of 50. And so saying that it's
intersecting, I'm gonna do, I want to multiply times
50 for every intersection. So the idea right now is it saying how many
intersections there are? So that's, that's
great because they just told me how
many intersections. I can just put that
down here as a count. Or if you go, of course, are set here. We just want to know
how long that list is. And so we have the length
here already of ten. Idea of if it's a null, we're going to have that
information as well. Okay? So this is, if there's intersections though we want actually the one that we're
smart intersections. So We do here is use a gait. And it's really a string. And actually we do a
string filter and ideas. If it's going to be, this tells us right now. If it's going to be this, right now, it's given value, so it's going to be false here. But if it's null,
it's gonna be true. So if it's gonna give values, we're gonna go ahead
and use this, right? But if it's giving
us that length, in the end, add this
to this length. But if it's going to be a issue or this actually is
true and it's already zero. That's, that's our
ideal condition. We're just going to
set this to zero. So zero is now going to
be added to our linked. Okay, So let me just quickly we describe what's
going on here. Okay? So we're creating a population, so Point Cloud circles and
we have our lines edit the genome of how this
power line is gonna be moving its final form. So I setup a gene
pool right here with the same amount of
points is our polyline. Now we're moving
up and down from the Solver, creating
new polyline. And then Paul and his testing
against intersection with the Curves in the point cloud, which is now a circle Cloud. And so the ideas I wanted
to make sure to know if it's not going to intersect with anything
which does what I want, I still want to have
a Shortest Path. And so I need a string
filter to find out if it's intersect with nothing obvious, intersect
with something. If it's interesting
with something, it's sort of is invalidated. So I want to wait it higher. So higher amount. I can even put this to be 150. The idea is, I want
only the paths that go to no points, no circles. So it's finding
The Shortest Path. And I can even help it by starting off by maybe
locating a little bit of it. But it is I want
to Shortest Path. Okay, even set if I wanted
particular beginning in. But I'm just
simplifying it for now. To get The shortest path. That final value, I'm going
to set it to a number. I'm gonna go ahead now and
introduce my, my Galapagos. And I'm going to go ahead
and set my genome into, we plugged in, right? And I set my fitness to
be based on that number. And I'll end to do is
double-click it here. What we can do now
is I'm looking for the minimum Madam intersections
and just make sure it's working probably would just go Started and just let it run. Emily, it's just
going to do like some random value to see
how can we get this. The Shortest Path
going through here. And right now again, I'm waiting all those
intersections as invalid, so I need to find paths that do not have any intersections. So it's understanding it to say, Hey, that their values too big. So I just wanted to
be a big difference between for the intersect
or if it doesn't, it starts to getting
zero into sections. It will just be
looking at the Line. The Line value should
be closer to like 300. Without any intersection,
the intersection of all adding value that
will just invalidated. They were trying to get
down to the smallest value. So that's a good way. And again, I've tried to
make a little simpler by having gap between here. Again, it can go
probably really small, but you just needed more
time and a little more. Maybe a point on your line to get more and more
precise and ideas. It's crawling around
these circles and it's getting
smaller and smaller. And the idea is, we just let it run. Again. You can also fix the
first path so you can start it in a little
bit better one or you can, you don't adjust it so
that first-pass can give you particular designation. Okay. So like right now, she's getting like, it's
still sort of high values. I'm gonna go ahead
and stop Solver
66. Adapting Galapagos Solver Equations: Get in here and just start
to give it some values. Right now I'm seeing it
as intersecting a lot. I feel like I wanted to go
away from intersecting. So let me give it
some, some direction. We cannot avoid giving
those intersections. So right now I've
given it a path. There is zero. As you can see here.
It should be zero. And then sections. You see here right now, where it's, it gives no
link. That's zero length. So it's actually, actually
does come and find, give me a zero ton of value. So that's give me the value
of that baseline to 70. Even I start here. And so we minimize
I started Solver. Just from right here.
You will have like a little more guidance with ideas. I wanted
to Shortest Path. So it's going to
actually start to test on each one of these
values getting closer and closer to a path that
can be the minimum. Well, understanding,
if I intersect it, I'm going to be out-of-bounds. Okay? So that's one
way you can help guide the Galapagos process. You start off with input that is targeted to
where you're looking. So it's a little bit of
augmented in that sense. Okay, So you've
seen as going down. Again now, you see the
values are a lot closer. But again, it was before just understanding a
little bit in the dark, but it still could get close. But now as I'm saying, okay, you start off with
a bit of a solution. There will be giving
you that Guide. So that's just one way
of getting that started. Again, you're saying like, we wonder why there's
so much out here. I think as you, as you
allowed to go longer, we've sort of testing
where it can be pulling the values in and making
them a lot more streamlined. Because as you can see, this
value is going down to 56, 55 over the time. You don't even find
it to get lower. And so we're gonna do now again, I'm going to stop the Solver. Again, this is a way of finding a short
path through here. You could turn that
into a polyline or you could give it other guidelines. You could start it
at different points. And it's just pretty much
understanding the field. I understand. So I'm gonna go ahead and
just look at the top, top 10% of genomes is
just reinstate it. And I can see those, how they go through the path to understand how is it working. So again, this is something
that can be done in 2D. This OSCON can be done
in three-dimensions. And the different ways to say, how do you get The
Shortest Path. Also could even do a sort of analysis of what circle size provides the easiest
path through. So that's just a
different target. So that's a very great
way of seeing that. As you can see, this, this path and all these were
sort of derive it from here. And I can even start from
this current set of genomes. And I can just click on
Start from select genome. Even go even further
on that optimization. Again, this is again more
of that targeted Path. Or I said, Hey, let me choose this and let me start from here. And let's see you get better. So you can see it's, it's even improving even further down. So it's parses letting it
sort of evolutionary compute, but also you can
start augmenting it to find the type of value
that you're looking for. Seven, go ahead and stop that. Click. Okay. Again, what you can always do
is you can always save any, any particular gene
that you like. You can plug that
in again later. If you want to set up certain
types of certain paths, you can put that in your code already and we just
go ahead and save. This is gonna be our path to. And these are ways
that you can really just start to imagine how a Evolutionary Solver can be solving different problems
for you in your code. Now, so you don't have
the code and it's scriptable. How
do I get to this? You can just go
straight through and scripted into your algorithm. That's the use of Galapagos. There's a lot of
different functions that you can start to
figure out over time. But this is essentially
going to help you pretty much
solve some problems without having a script
or do 1,000 options. You just can do that
directly within the program.
67. Introduction To Ladybug Tools Environmental Analysis: And we're going to look
at the benefit of working with environmental
Plugin based on Ladybug. Ladybug, me, just go here. This is install from
Ladybug plugin. There's also some other
features on Ladybug. Go those here. We're going to start with
the basic sets so you understand what it means
to work In Ladybug. And so I'm just going to
do some Ladybug test. Just call this panel. Well, just basic Ladybug. And so we're just gonna be looking at some different
Base Functions. The first thing you start
with Ladybug is looking at environmental information
that you plugin. And that's gonna be your
base for everything you do. Next thing, you can
also analyze data visualized now as Geometry, etc. but you have to start with
your environmental data. So we're actually going to
start by looking at UVW map, where we actually
can just go ahead, let it load a little bit time. We just give a much Boolean
toggle or a button. So we can actually
just load that. And it's going to
take us to an app that lets us download a map. We can go ahead, just follow what sort of gives
us directly to. The idea is every single
Environmental map plotted out to give certain information throughout
the year where the sun is, different temperature data,
range, septation, etc. and so that's what we're
looking at with this. So that's of course
a reason to have it, the good internet
connection when you're logging
into this as well. So we're just going
to let that load. And essentially it's going to be pulling in from
places around the world. And you can pretty much just
go into the map and say, Oh, I like this particular area. Let me find out about it. But every place is not
going to be equal. B. If that area doesn't have the best map mobile choose somewhere that's
a little closer. We just covered this one. Come back here. The great thing about is
when it's downloaded, it's going to be in your
file, you'll be saved. Your Ladybug folder. We've downloaded that. Okay, So it's fully loaded now. Here we are. So what we can now start to do is we don't
really do look at our model. This is really
just understanding what's going on In Ladybug. Now we have an EBW map. We have a start file. And the idea is this
is Professor whether following information about what's happening
around that time. There's also the
start file and ideas. These are pretty much
saying what happens throughout the year with
that weather information. Until those, those are your
base function where you just get that map going. You download the, the
link and put it out. Now we have the EBW file. Now we have the ability to
start looking at that data. And what that is is we can, we can go ahead now and just
import the data and now get particular climate data that we now start to visualize. So we just plugged it in
from that you PW fall. For each one of these is
usable as information. Have you click on one of these? It's not going to
actually be just a bunch of normal numbers. They are all sort of formulated. So maybe a dry bulb
temperature is, It's going to have a
particular array structure. And so the idea is these
all have to be interpreted. And so what we wanna do
is before we started talking about visualizing and
we also want to make sure we're looking at how
we want to visualize. So we look at the analyzed data, we have the ability to
construct the data. We can say a particular period. We want to see whether
from a particular set of Started Today, end of the day,
that's sort of thing. And we also have
the ability to say, do want just the headers, do you want the just
the data itself?
68. Creating A Sunpath Diagram In Ladybug: Right now, if we
were really click more onto see
something like that, very simple, like a Sunpath. We want to just get
that information. We are going to be looking at information needs
to be pulled in. And that's gonna be
visible from how these are organized in this file. Information that's E,
the variable that has a underscore before it is
something you need to plug in. All the ones that
have the underscore afterwards is something that they're actually
going to give you. The idea is you have to plug
in the center point for that Sunpath, the location. So if I would just put just
a point, can shut point. And as my center
point and ideas, North is our sort of gives
like a generic north, but I can always rotate
that location is going to be given this one. And we go onto our Ladybug, we'll see what it's showing. Just using that 00
point location. This is a very visual
function obviously. And ideas. It is not really showing you data at the moment
because we haven't said that any
particular which days. That's where we
started to look at the importance of
analyzing the data. Okay, so if we start and setup a Analysis period that
starts to break this down. And ideas were saying, What day is we start in, what month, what our, and when do we end
in that period? That gives us either a
period of oil or dates, these different
formatting information. So if you want to say, we want to just look at
what's happening in June. We can say we're going to
just be dealing with June. If we wanted to say maybe we're starting on the first day. We can always slider. Want to say we're maybe looking at if we would stay
in the same day, but we want to see maybe
going from 06:00 A.M. to 06:00 P.M. it's gonna be 18. 18 our and we have that here. We now have values both in
our OISE and our period. So now we get the
plugin to these values and it can get any one of those. Would you see pretty much
this is one particular day. So the idea is
throughout the day that Sun is gonna
be that location. And what we're gonna do is
the idea is if you want us, we want to change the
arrow that we started. You see like it's sort of pretty much showing every per hour. But if you want to change
the day of the month, it will actually start showing
a little bit Multiple. Now this one is only setup
to particular that value, but if we can always come in here and maybe make this to 30, that'll make it a little
more interesting. So we can be going see
what happens on a month. And if we even plugin this one, the 12 for the
month, you see it. You can show multiple
period obviously. But I can also just select
one particular set. So pretty much how it's, how it's showing that
particular time and data that's gonna
be visualized for this one is just a Sunpath. And so I just know where the
sun is in that relationship. So that's very simple way of visualizing on one particular
set of inflammation. There's actually quite a lot of information that's
actually visible. From here. Of course, you see
all these temperature sets. The question is, what can
these also be used for? Well, because it dry
bulb temperature, the temperature that's gonna be the day we actually can
find out when is the hottest and the day will
actually plug that in as data. Now, the idea is we
plug it in directly. It can start to show you
where's it going from. And it's sort of
saying the minimum maximum dry bulb temperature. So it's going 17-33 to the, the woman's part of the day is gonna be when the sun is at the highest. So that's in June. And if you go from your
you're above view, you can see what
makes it about that. So it's a great thing
that Ladybug does. And this is just for
visualizing the Sunpath
69. Creating A Sun Hours 3D Diagram: We can look at some
other information. We can create some
other types of graphs because we know
where the sun is, like that just
showed us directly. But if you want to visualize pretty much from
where the sun is. And maybe, maybe we want to find out with an
analysis of Geometry, direct Sun Hours, that it's gonna be where we can actually take something
like a building. And we could take,
if I, for instance, wanted to take that middle
structure right here. Go ahead and just put that as like you just put
it in as Geometry. So that my building, I could be finding
out what is Geometry. And also could actually
input the context as well. So this is my main building. And I could put as
Geometry my site. I can just click this
other elements in, right? I could be plugging
those in as my context. My building, I just
put G building. And my vectors are
going to be from my son information alleles. Lot of these values already
plugged in a little bit. But I haven't set up
my legend parameters. And we will look
into what that is. And we also need
to put this one, have a Ladybug toggle. Say when you want to
start it running. And so that you can put over there and it says
it's true or false. And we also can change
things like the CPU count. So I'm going to really look at the vectors and
vectors is going to be the base of your
summer information, which is USD, can actually
get from your Sunpath. Like what I can do that
can enable, enable it. I can turn off the
Preview. I don't want look at it particularly. And I can take things
like the vectors, those vectors from that period. This we plugged
directly in and want to make sure that we have all of
our final Sets values here. What we can do here is now it does tell you
that it's optional. So we do have the option for
not showing that as well. But I could do is I can
go ahead and just click true for running that. And what we need to do
to, to finalize that. And the arrows saying we didn't have anything
from our grid. A grid size information
is gonna be valuable, but I want to start off
with a simple number. Close to one, or I should
probably bigger is better. It's going to take longer
the more grid size you have. So we'd have to let time
for that to compute. Let's take a lot
of the Functions With that when a zoom-in. So what you are starting
to see is how large is that grid is for how
it's going through there. You see it's really small grid that we want to make
that little bit larger. It's going to say
pretty much where is the sun going to be becoming? That's a nice way of saying
that let me make it larger. I do like a full maximum. It could be doing something
a little bit larger. But the idea is that
I have information about how much sun is getting
to that building, right? And that, that's a, that's
somebody who has put directly and we'll look at lighting legend parameter
is a little bit later. Right now we're just seeing
a direct set of information. We can of course turn off our other geometry or turn
off the preview of it, make it a little bit cleaner. And pretty much it
has that ability to calculate the effect of other
spaces on your building. That's one great thing for that. We can also even just by looking at just
what we're doing here. If we wanted to even just
see the ground plane, and we want to see, we'll just put that
as geometry as well. One Geometry. And we just
wanted to see the ground and the effect of how much sunlight hours
are getting to it. We could be plugging that trade in as the jumps you want to analyze and sort of
shows just square. It turns out to Preview here, sort of shows how much
sun is getting here. So that's the benefit
that you can see. We have this information
and you see the graph also is actually sort of size
two, that footprint. But if you have like a site
that has a lot of buildings, you can see this is the place that's gonna
be the hardest, etc. and that's gonna be really
valuable thing for that
70. Customizing Legend Parameters: Let's go ahead and look
at Legend Parameters. So we've just looked at
Sunpath and we looked at saying that direct Sun Hours are some really valuable tools. But you also can come in here and change the way
that you see legends. And that's gonna
be in your extras where you get to choose. Here is Legend Parameters
from that extra menu where you can choose how everything is
that you're looking, How is the data actually
being, being operated? Differences you have
your How many hours is gonna be available here? Obviously, Sun doesn't get here and the day
this to10 building, it's going to be close to zero. But if the sun's
visible all day, pretty much all the angles,
you're going to see 14. So what we can do is there are several ways
that we can choose. What we will see when now. We can just plug this in. This sort of as is. It's going to be just
basic. It's the normal one. But we can come in here and
change things like font, which is how things
are gonna be. So particularly seen. Each one of these has their, their set of information here. So there's a lot of
different options here. Like if you want to
change your color range, you would actually
use one of these. And that's important for
extra is make sure you always look at the
information about it. This has like
several, zero to 26. Now just go ahead. Sets for how you're
going to see color. So that's one of the beautiful things
that you can set up. Sit here. And it's, it could be a beautiful way of understanding
what's going on. And so you also have again, your minimum and
maximum of idea. If you want to exclude
values, you got always say, instead of saying, saying one or zero, we can
start with one. And we can avoid also
the maximum as well. Or we can choose to use
that one. I want to do 13. We can choose the course. How many segments that would
be valuable here again, make sure the, you
using that wisely. If I want to do maybe eight
segments, plug that in here. And just this implies
for what's going on here
71. Exporting Ladybug Diagrams: And anything that you do here, you can always hide your geometry that make it a little bit cleaner if
you want to export it, you can just always, your
screen captured a file. For instance, if we were trying to locate a
particular sets here, we can go ahead and click here. And we're just saying direct
Sun Hours perspective. So that's the star valuable set that you can be exporting it. The same thing goes, if you want to include multiple
sets of data, we can go ahead and turn on a previous wanted to
see where the sun is. And this scale is
also adjustable. Right now. It's maybe one. We can actually go, go just put a direct number
slider to this skill. I see skill that down ideas. We want to see this and find out where exactly the sun
is at that period. You do see that it's
showing that Legend above. If you don't want to have any of this
particular information, each is one of these
actually does come out. You can just put
a sort of export, may be the form of geometry. You turn this preview off. We actually see
things individually. You don't have to choose
all that information. So that's gonna be
another benefit. And can, we can bring each
of those little elements and, and those lines. So you don't have to
just see everything and put my color points N or not. But anyway, that's
some of your, your, your sets that you
can be looking at. And you get that information
that Ladybug plugin there
72. Creating A Windrose From Wind Data: Look at another set
of information. What if we want Adjust, maybe take and understand
another set of, set of data that
maybe is valuable. Again, we'll start
with EBW map and say, maybe if you wanted to have
information about the wind, would be looking at maybe
more of a Windrose. Windrose has its own
set of functionality, whereas we're still gonna
be Plugin the data. And they data could be again that that set that
just be coming with maybe the particulars
of a particular period. Four, we choose anything there, we just say, Hey,
which stated we want. So I think it's fine to
just say that we're, we're using the data
that we could see. Put off the dribbled as
the data we will look at. We don't have a
particular a period yet. We could just come
in, take that period. That period again is a
different definition than boys. But again, we selected
that particular set. North had already set. Wind direction is
going to be important. So we're going to plug
that in from this EBW map. And even from this
set right now, we're already
actually able to see quite a valuable
set of information. What we're gonna do now
is actually make a point. We actually just put as a has a location for a Windrose. You see also we have a
Windrose data right there. Again, if it's, you know, you have a lot of diagrams, you might want to just
be split those out. Well, you could just
export any one of those. Okay, So right now the
scale is a little bit off. Who want to make sure that
that scale is going to be very much visible. Because it's pretty much
saying that it's a very low, low when pretty much
from your Guide. And so because of that
big differentiation will definitely be needing some custom Legend
Parameters so we don't miss out on
the information. We're going to do is
go back to extras, go to my Legend Parameters
and plug that N and ideas. We're working with a
minimum and maximum value. If we look here, we can see that our maximum that we really want, if we go to 030, 20s, if we say our minimum
is really going to be something closer to
the five or something. And our maximum is closer to 23. That's going to be
us seeing this here. And we need to make
sure that we're also seeing the size
of this appropriately. And so I'm gonna go ahead
and come back here. Maybe adjust some of
the segment count. One. You have to really
play around with some of these values so you can get enough information. Now I've actually set up a unique Analysis period
for this Windrose. But one issue is again, is it's pretty small. One of the thing I'm gonna
do to adjust that size of Windrose data is I'm gonna go here and make a slider
for frequent hours. Alright. So one thing that
frequent hours does, it actually lets me change the
size of the Windrose data. No matter what period, you know, right now I have it going
throughout the year. This one is going
from the fifth month, the year, 12 months. Like I can come back here and adjust the size so the
data amount of the same, it's saying that the, you know, right here
I have the, the, the, the largest wins are
gonna be on the outside, the smallest who live inside. So the idea is the data
can be pretty similar. But it's going to be important to sort of
see that scale here. So that's gonna be
what helps you. You can also get the
color as it turned by the particular data that we're looking for with
information like that, like I do wind speed. Let's look at the dry bulb
temperature as my data. It's going to say, Okay,
when does it hottest? And obviously if
it's the same day, daytime period, it's going
to be the same heat. But if I want to a
differential for that graph on how much speed isn't a win. So that's going to
determine a look, that's gonna be the value
you're looking for. So that's how you
use the wind rose, and that's how you
get the particular ways of how the data is going to show in terms of how
large is there gonna be. And you can again, just do that. Screen, capture your file. And just say when rose, you've just set up a particular view and
you can keep doing that. For that information
73. Ladybug Conclusion: So those are some
of the great values that you can be looking at. With Ladybug. You can be finding out several different things
about your model, how it works on an
actual environment. If you're designing Toronto, you're designing in
Boston or the UK, you can find out
information about it with a Sun is doing. Now those are some of
the basics and Sets. Again, you can always
be dividing out more information
about that site, including different comfort
studies or degree days. That's definitely if you're
having more knowledge or your research more into
particularly comfort values, you can research that
there's great books on environment design that you can be going to for
those sorts of things. Also internally, just
finding out what you want to see, it's going
to be really important. So I would definitely
advise to play around with some of these as you're going through
and just focused on reading to understand privilege. I think with with Ladybug, you're going through one thing that you're looking
at it at a time. So I think it's good to
do it little by little. Again, there's some,
some more resources L, So there's a forum
for Ladybug group. And I think that's gonna
be something that will be valuable to you as
you go through here, but it's pretty straightforward and can be putting in Plugin. Make sure you
connect it to your, your weather
information than just our refine the results
to get the value for your project that is
going to help you get the inflammation that
you need to go ahead. Sleeves are data on
so you see a lot of great information
that you can really plug in one
about your project
74. Introduction To Kangaroo Physics For Grasshopper: Another great set
of plug-ins for Grasshopper are the Grasshopper
plug-ins for Kangaroo. And Kangaroo is a set of Plugin functions that are
pretty much about physics. As you can see, this
is the Kangaroo bar. It has parts that I deal
with finding goals, dealing with different
things like rigid bodies, working on particular types of Geometry and Physics
constraints. We're going to actually
do a simple set here. But essentially there's a lot of different things that you can control and create
here with the program. And that's the beauty
of how you can start to use this to understand what things are available. We also have things like working with particular
type of geometry. So it's both Physics Geometry, and I'll go through it and we're going to actually be
putting things together. Now, this is actually based
off also using Solvers. That's how it takes that constraint information
may be gravity, location anchor,
and it puts it into the Solver so it can
demonstrate the Physics. And then it will export
it as what's happening. So
75. Starting A Kangaroo Script: Go ahead and, go ahead and click on the first main
function for Kangaroo, which is the Solver and
rationally is the bouncy Solver. This start a little
bit backwards. Detail all the areas. So the Solver takes all the information pretty
much about the system, the physics system, and also a button to sort
of loaded or unloaded. So I'm gonna go ahead and
create a toggle first. And that's going to be the
primary element for this. And that's this irregular
toggle switch in Grasshopper and goals objects is going to actually be
what we describe next. The first thing we're
gonna do for the goals, I'm gonna go ahead and just
create a couple of sections. I'm going to start with
inquiry information. Then actually going
to talk about the next inflammation
which is on the next set, which is actually the
load information. And finally, we'll look into the constraint or
links information. And that's, that's
also called a spring. That's the way things can physically get back
to original state. And I'm going to also start off course with our Panel
just to talk about this is a Kangaroo
basic physics test. Alright. I'll just basic, basic exercise where we'll
just do Input is Base Geometry and output
is Physics model. Okay? Okay, so what we're gonna do is after looking at
this particular set, when I look at the
initial condition set, which is the base Geometry, That's what
we're going to start. And actually, that's just me putting that as a scribbling. I'm going to copy
that, this scribble. Copy and paste that in. And we'll solve the base
Geometry. This is gonna be over. So I'm actually going to
start with really simple. I'm just gonna start with
this line we have right here. This is going to be my curve, is the regular Grasshopper
Curve set one curve. What we're gonna do is start
by thinking about the load. And so we're going to break
this down at the point. And that's gonna be
how Kangaroo looks at everything because it's
forces that act on points. I'm going to use endpoints, which is from the Curve
menu, widget to click here. An idea is we have the starting
point in the end point. Those are gonna be both. One is gonna be
chosen for anchor. What's gonna be acted
on by other load. To get the load function, we're actually going to start
with our primary function, which is our load function,
will just put this here. And we also, while we're at it, also will put our
anchor function here. So the idea is only one can be the anchor if you want it
to be moving by Physics. So we're just going to choose a mature which is one of these. Okay? So that's going
to be our anchor. That means this will be stable. So this, this Kangaroo
function of Angkor, it's gonna be plugging
in that point. We don't really have to the Plugin to many
other things here. There is a shrink to this in case we might want it to have a little bit of leeway to
move for other elements. Okay? Now both of these
have to go into, and I want to use the merge
command from the set menu. Both of these have to go into the load function for
it to be acted on. And I'm going to add
the force vector, which I'm going to
have as a unit vector. I'm going to just
do negative one. And actually I'll
just to a slider. So it's gonna be a
little bit where I can change that if I wanted
to put negative one here. And this is the basic
Kangaroo Function, put that force vector in. Finally, when to
look at a spring. Spring is going to
be where I set up a relationship from this curve. So it will have something
in the connect back. That's the basic of Physics. Physics. You'd have something that's
acting on a point in how the relationships
are between each other. So I'm going to take this curve, I'm gonna do a curve, a link. And you can see that right here. Measure the length as opposed to just saying
the same length. I'm going to say maybe, it can possibly Move
times maybe 1.1. So it can be moved a
little bit larger. Okay? So that's my multiplication
for value first. And then I can go into my goals Line and set up
my link function, which is also called Spring. This goes in here as
a link and the curve itself goes in as
that line there. We have that the lines, each one is just Wind
or is it says curve, but you really need
to be only putting them to point lines
into that function. Okay? So all these are going to be compiled into the
physics simulation, our spring, our load,
and our anchor. And of course there are
other elements that if you're exploring, but these
are the base elements. So you can learn from
that how things work. Then these all had to be merged. Just a regular set Function
to put these together. And you can just put
one on top the other. The order is not
specifically as important. And so after this, we're gonna go ahead
and plug these all in. As you see, it actually started the function that's
because it's on false. We've or on reset, it's
not going to work. But if we click on,
that will work. Also you see the
speed that is going, that's based on the iterations. If we set that to two, it will go a lot slower because it's sort of
showing that and you see it sort of swinging a little
bit because it's really bouncing as that dimension. It's not like super solid. Okay? So let's go into a little
more complexity with these. And this is our base
model for a Kangaroo. So this is the base
and I'll just do the scribble Base
Kangaroo function. Alright, and I'm gonna
go ahead and just save this document and we say this is our base Kangaroo. So what we're gonna do now is going to go a little
bit more advanced. Okay? Because ideas, everything
starts with how these two points or
multiple points are acting. There constraints,
different loads. So let's go a little
more advanced because if we could do
this with one point, we also can do this The Surface. And I've actually made a nifty little function and you have that in your assets
UV Mesh surface. Because the idea is if
we can do this as one, look at the ability of what
we can do with multiple
76. Advanced Mesh Simulations In Kangaroo: Now we're going to start with our second model In Kangaroo. And this is where we
get to really play around with it and then little
more advanced contexts. So you can see I've
already set up my naming for this
Kangaroo Surface function. Working with inputting
a Curves sets Mesh, also outputting a physics
simulation model. So again, we have
our base Kangaroo Function or base Geometry. We have our anchor or
load our spring sets. And then we have our Solvers. And the Solvers is where
we just take all the data in and get it ready
for simulation. We're gonna introduce something unique with this one as well, but when unrelated to
start with a base one. Okay, so what I want to do
here is actually work with curves that I'll
turn it to a Mesh. I want to see something like
a vault at tunnel, right? So generally you could
loft something like that. But ideas, what if we
want to play around with different forces or
something that manner? Well, the way that'd be
done again is to take this and go ahead
and create a Curves. And I've actually
made a Functions that multiple curves
when choose one. I've created a function. I'm to turn this into a Mesh. And the reason why is
because actually Mesh is better for processing
and Kangaroo. So I'm actually just
started with this and I'm gonna go to
my function which you have included and it's
called UV mess Surface. Uv Mesh Surface takes a curve and it will loft it and
it's pretty Mesh loft. Then we'll take it and
it will divide it and you can actually start
using that and Kangaroo. So let me go into here and
we'll go back into our code. And the idea is, I will
just take this function. I'm just lofting core
of like you normally would loft with surface. Only. Lofting Surface. We are preferring to
loft into a Mesh. And if you want to
learn more about this, this is actually a
Cluster function, but ideas that's not going to be the
purpose of this class, so we're just going
to simplify that. But essentially, this goes to the process of turning
curves into a mesh loft. And the value of it
is that you have the you Curves and the
V Curves that needs to behave differently when
it comes to springs. Mesh itself is
something we can get information like where all
the points are or the lines. And it's also you have your vertices that are
available here. Okay? The first going to
choose what is gonna be important to have as
our Edges and ideas. We want our Edges
to be just here, like we get to
choose Base Edges. So for that vaulting. So what we're gonna
do is first work on this anchor and get the
anchor essentially. Now we have a set of points. We're going to need
to be working on getting the nearest points
to those existing Curves. I'm going to use the
closest points Function, which is in the Curve menu. You can see it here. We're just using different information
about the closest point, close curve, closest point. And I'm looking for the
vertices that are in here that recommended closest
to this curve. Right now It's, I think it's make sure that's gonna
be the right function. Curve closest point
to occur, okay? Okay, So we're gonna put
this curve into here. I'm going to put in
the vertices as well. That's going to show that
the nearest one and ideas, we want to make sure that it's checking for both curves, right? So what we can do is
always graph this Input. And so that makes it, so it'll go onetime through
that 1.1 time to that one. So the idea is we
wanna do a test to make sure the points
that are the closest. We're going to say if it's less than 0.001, that distance, then what we're going to
use this a little bit of a mask filter to make sure that we only get the points that are actually on that curve. And so we're going to use a
bit of a logic function here from this set where
we pretty much are going to call
with a pattern. So we can take this
list of points. We only want the
points that are gonna be less than that
distance to that line. We're going to take the pattern. So it's smaller than, put
that as our coal pattern. And we look here and
we see that it's a lot less points because it's
just 11 that are on that, those two lines, those are gonna be our sets
for our anchors. So we tied to the ground
at that location. Well, we can do is this very simply get this
as List of Points This regular Points and go
ahead and flatten them. Now we can do a little
space over here. These can be sort of
in the same place, but we probably need to expand
it out just a little bit. And now we're gonna do is put in our Kangaroo Functions again
and push our Solver back. When I go ahead and put
our anchor function, we'll go ahead and put
our load function. And we'll go ahead and put
our function for our spring, which is dealing with a line. And this is the most
simple way of doing this. Obviously, there are ways
to deal with how things be close or how things
will be farther apart. Also here, this is
the simplest one. So I think this is a
good structure to learn. This program with. All these points are
gonna be the boundary. When I go ahead and plug
that into our anchor, we don't really
do anything else. Again, there's a shrinked if we start playing around with
how things can move, think it's going to sum plus. Now go ahead and add this
to the group. Alright. Alright, here. We can go ahead with
our load to say we were all the points to be
calculated in the load. So that's gonna go ahead
and put these all here. We can do a force
waiting to lose. So we're gonna do,
we're actually wanted to do it, the vector. But this time we're actually
going to be focused on going up Parametric,
gonna do one. And we could change that if
you wanna do more later. But I want things
to be going up. So these are gonna be
added to my load group. Then finally, what
we're gonna do is now think about the complexities of making this surface a spring. So it works about the same way. We need to get the
curves themselves. So I can easily get
that by merging. That's all I have,
all the curves. Then I'm gonna go ahead and
just flatten it. Right. Then I'm actually going
to be needing to as well. And even I could just
flatten them here. And I'm remembering that
order because there's a bit of a matching element
that's going on as well. I'm going to also
get the length. And so that length is going to be now since I
have actually two. And I didn't fully explain
that, I'll show this here. I have a set of you Curves
and instead of V Curves. Okay? And so I'm going explain that
here because the idea is, if you're starting to
look at constraint, well, if you're having
everything equal, if you want the catenary, which is the curve of
that Physics model to go this way if you
don't want it to be pushing out and the
other direction, you need to make sure to know which one is being a
trend to which axis. And I'll even show you what happens if you use both of them. But we're going to start off by just looking at this and we
get even for this purpose, taking both of these photos, show what happens when
you just do both of them. Put them on both
as a Curve Length. And I do times 1.1. And actually just
do a slider 1.1. And you'll go ahead and
multiply your links. So essentially it
has a little bit of leeway for how much it can move. And you take this and
put this in line, they take these other values. And now put these
as your length. And that leads to the group
organization purposes. Now we have our little merge, or we're going to
merge all set 123. We're actually going to add
another function, actually, the function which is going to be actually show
this is actually where we allowed to bring in our Mesh that we have
gotten from here. And actually can reinfect the Mesh that we got
from here as well. And that's gonna be for
our visual functions. So go ahead and here. Put them at another level. That's more for visualization. Okay? Okay. So I'm gonna go ahead and plug
that into here as well. And what we can do now
is run that model again. You see, it's not
really even ideas. Everything is pushing out. And if we come over
here that's running, it's moving in both
directions now. It's not like living
like a vault. It's living like something
that's moving on both axes. And that's the reason
why we want to work with U and V. The you, you lines are all
going this way. And the villains
who have gone that way and I won't grew up lines. And so we're gonna do
is when I turn this off and start with that
different methodology, we're still going
to actually end up with one spring, though. We could do too. I'm simplifying it. Because in fact actually that might be a little bit
better to do two. Sometimes it's, it can do one, but I think maybe for
verification purposes, you understand it better. It's two. We're gonna do two sets here. And That's gonna be the easiest way to
understand that I believe. So. One is going to be and we just had to make
sure which one it is. All these needs to be exactly
the length that they have. So one is gonna be the best. For this axis. We're just needs to be operating differently if you want
to have it smooth. And what we're gonna do is go
ahead and copy these sets. This we can do maybe 1.1. And I'm going to
plug these in here. So what I'm gonna do is
also make sure again, this is the multiplication
is already here. I'm going to go ahead
and flatten each one of these at this level. Okay? So this one has, these curves are here, are gonna be able to widen, widen, and become a vault. Okay? So since we all this is pretty
much the same function, is spraying one, spring two. We're going to
add to the group. But it's duplicate of this. We of course can make it more
pretty by aligning them. Okay? So this is two sets of springs, and we're going ahead
and put that in here. And we've also added our mesh so we can see how
it's going to operate. And we'll go ahead and
see that function. So when a little bit slow, I think it's because of
values a little bit high. And it's not working perfectly. So we're going to find out
what could be the issue here. So we're going to make sure that it's still
plugin that old value. We're going to make
sure it's only plugin one per value here. Okay? So it's
actually going to be our lines are going to come
from each divided set. And so let's try that again. Now we'll see a smooth tunnel. See it's sort of acting and
Physics succession there. And so now you see that
how beautiful that is
77. Exporting And Customizing Kangaroo Geometry: Now we can now directly
simulate what happens if we start to expand this
out. It starts to do that. Or if we pull it
in, the smaller, we have that little sort of
in pulling element happening. Or if we increase this set here, it's getting bigger
or smaller, right? And you can see it's
sort of physically bouncing as it's
coming to settle. And whenever it's finished. Again, this is the bouncy
Solver you can use. The other Solver just will give you though
this Conclusion. We now have a set of geometry. As output. We have our V List, which is our vertex six
updated vertex with I, which is talking about how many iterations took to solve this. Alright? So what we can do is use a list item to break down
things as they went in. Pretty much everything
will come in the same way it
went in this way. If you want to do your show at the top,
like for instance, if I want this above to be
the top, I could do that one. That will help me. Let's say true again. That will help me to say if I wanted to go to my x2 index, that's going to just have
to make sure it again. Merging these, be careful that everything
that comes in is going to be a not a tree with
just Kangaroo elements. So this comes in as the
Points and how it operates. You can see how
things are coming in. However, it's still pretty
evident that how it's going to come out is gonna be
based on how many lynxes. So you can say I always get
the length of everything or the size of the set. This thing. That helps you sort of find
out where everything to 64. Okay? And when we have this, then we can also just be pretty much locating
where things might be. We issues another Panel
to locate that out. We also get just very
simply move all the nulls, things that don't really
apply to this list. And that's also done
in the set menu, which is clean a tree. It's a little bit of a tree. We want to remove
the nulls, true. And it gives us 221 items. Now, we can see exactly where everything
is and we see meshes the 10-20 index. And it starts at zero. So just go ahead
and put in to 20. So that's where we
get that mess surface and we can also export that. You can bake it and
bring it into Rhino. So anything we want
to do with that in terms of form a function, we can just do that right
from out of there, right? We can also, as you can see, also there's a lot of lines. We can export all
those lines as well. So that's gonna be
a useful function. Obviously, if you want
to say with the lines, for instance, right now is only one Mesh,
diversity is a lines. We could just very simply divide that out and take
those lines as well, and just make those lines into our own
particular function. But since obviously
we know the Mesh, we can also just very simply
deconstruct that Mesh. And we will
deconstruct the Mesh. That's another way of us getting different information from it. We want those. This
will give us the faces. So that's another sort of little set here when
you're looking for this. But in general, if we just go ahead and
actually it's removed to 20, this will again revolve you avoiding moving things too much. We can just sort of get our index and
we'll just do a sublist. And we'll just created
the main disk, construct a very simple
domain of zero to 219. From that original list. That should be all. There are lines So what this one, we can
also be baking this. And we'll just make
that as a Curves. And just take that and we
can leave that as a group. So we have that a group of lines that we could very
easily turn into a pipe. Or using Grasshopper,
just use this little, this little function here. We have that already. We can turn into Panels
or anything else. But of course we can get
geometry or measure anything. So I'm gonna go ahead and turn those off and we look
back at it again. All right, so what
we can do here, now just sort of look at what the process was
for creating that. This again is our post-processing
where we can turn these into other types Geometry out this make this
a little group. And then we get on or off. For output. I'll just make a scribble
this to describe that one for you here. And then that to that
group. Let's look back over the function
and what we did. And of course you can get as
complex as you would like. But I did, is we were applying a load that this is
similar all around. We of course also
could just have a load that affects
only one side. I'm gonna show you
that one as well. And that's going to
definitely get a lot more unique from point of view, we're looking at how things
are actually operating. And then we made sure after a run or load also to make sure where's our anchor coming from. We have anchor now on
these particular sites, the ones that are close
to those two lines. Even if we would come back here. And again, we want to Trump's to civilization if we
only want to use one. If I didn't add both of
these as my Curve set. One, said, Oh, I want to have, this line is the only
one that's going to be holding back. I could very simply start
the simulation again. You see how it goes up, but because there's
no constraint, it's just floating, will you? It also can be an
interesting effect, right? So the idea of the anchor and the load is
gonna be pretty critical. Will go ahead and turn
that to false to true. And that's one way
that that would work. And breaking down
how the loads work. Again, we have a constant load
effecting on all of these. If this load only affected
maybe half of them. If we made a sublist,
for instance. That would also show a
unique way of how this could be interpreted. As possible. All the vertices, we just double-click here,
create little bit of a node. Hit sublist ringlets here
to get that function. Whereas if you look at it, it has 121 values. If we made a domain. And you can create a
particular type of filter to say which points
you want to have effected. But if you want to affect maybe particular set subset of these, and these
are all Points. We're just saying
maybe zero to 60. Think it's already
started at zero. Just plug that in here. And so if we only want
these points be affected, as opposed to taking
away this general load, you want to duplicate the load. And maybe this one could be
a little bit larger file. So we want this don't have a
little bit stronger effect. Who take this, put
this down here, and also plug this into here. You will also make sure that this is not going to
be changed too much. Said here. You're saying a bigger impact on these points then on these. So that's, that's another way of adding a little bit of
diversity to your Functions. And we real-time see what happens when there's more
force applied on this side. And fortunately, again,
everything comes out in the same order we just really added
on to that tree. Pretty much. We, if we look back at it again, It's actually a
little more values. But when we remove the nose, still zeros at the 221 set here. And so the take the Mesh is still going to be the same item, so the nulls are different. Other functions
that are going on. However, again, that's
how the loads work, That's how the anchors work. Go ahead and add this to here. And then finally,
the spring's work and the constraints work by pretty much just dealing
with one line at a time. And pretty much in the systemic, you can match the
lines to the meshes, etcetera, everything
that's in the system. Another little function
also for visibility. So you can also see you
want to maybe start to play around with it is
to add a grad function. And as you can see, the graph actually
has a strength, just like lot of these
other functions. If I just plug that into here. You also see an
ability to push and pull the elements here I'm gonna go ahead and
start it from scratch. Right now I don't have a
lot of power and my Grab. Right now it's just a ten. If I got to go ahead and put
50, increase the shrinks. And we're just really start from scratch. You see that? When I select a particular
point and then model, we just sort of show what
happens when I pull it. Right. And so the things
that are anchored, I can't really push. But show me like
if I want to put a particular type of
force and the model, I can see that acting
and you can have more than just vertical
are vertical angles. You can have anchors
that are going in different
directions, etcetera. These are all part able that you could
put into your models. So again, that's just looking at some performs but also
some advanced forms. So you have this to play around with pretty much
as you figure out, how do you want to understand and operate with your Functions? I think that Kangaroo is great for taking the protective
Physics Simulations. We could be looking at how favorable
structures with work. Also maybe even if you
were trying to figure out maybe a little bit of
Physics For Structure, you could do using
this for that. And then again, it works with a simple set of information. You can of course
add different types Geometry and get them
to some of these. They all work pretty
much the same way. Just making sure that you just remember the order of
how you putting things in lecture that when it goes into the soul where you're
just being cleaned with it. And also when you're
exporting just that you are examining to make sure things are coming out
the way you want. Now we'll get to some great, great models using
Physics in Grasshopper
78. Course Conclusion: Thanks again for joining me in this introduction
to Grasshopper. We went over a lot of commands. And Grasshopper, it's
such a big program, but we're able to do
two exercises with me. Go ahead and check the
activity includes within the course for your own activity where you can take some of
these to the next level. You can also just really
start to play around with Grasshopper and some
of the great resources. Again, I've put some
resources in the course. If you need help with your
rhino do to improve and rhino, then go ahead and look at my course page for
more classes in Rhino so you can be
developing both ears at the same time because
this credit necessary. It's been great to be
in your instructor. I wish you the best
new modeling and I'll see you in the next class.
 Brandon A Gibbs, Architect & Innovator