Transcripts
1. Crypto Course Intro: Blockchain is the future of computing, and it's disrupting major industries across the globe. Think of it as a massive experiment similar to the creation of the Internet. In just a short period of time, consumers adapted to faster networks that connected the world. Blockchain is a decentralized platform that provides a foundation for cryptocurrencies. It's a digital account in which all transactions are simultaneously reported, accurately sourced, and accessible without a central authority or middleman. In this course, we will discuss cryptocurrency trading and blockchain. Learn to develop your own cryptocurrency outlook and trading plan. As always, my goal is to provide a foundation of skills that will power your investing.
2. Blockchain 101: Hello and welcome. Before we get to the specifics of trading cryptocurrencies and investing, we must understand the basics of cryptocurrency and blockchain in this 101. We start with what is a digital currency. A digital currency is not attached to any central issuing authority or regulatory body, and that can mean the government. It's truly decentralized. Meaning that no body or government is deciding when a bitcoin is created, the quantity and how much bitcoin is created, and where a digital currency is transacted. The creation of this is the bitcoin. The bitcoin relies on this crypto network that is exchanged in a peer to peer form into string of data on an open ledger, and it records every transaction simultaneously. In total it's about a 107 gigabytes worth of data. Now, what is a blockchain? It's an automatic central ledger and there's really no middleman because the network is kept track simultaneously. Each ledger is organized separately into blocks and it compares, creates a consensus, it creates an accurate record keeping, and it's transacted anonymously. How do you keep the record on the blockchain? Well, first, someone announces a transaction to the blockchain and that transaction creates unique accounts. This account is given a string of code, and that specifies who the transaction is being sent to using a bitcoin and how much of the coins are being transacted from point a to point b. The users then add this transaction to a block. This block is then distributed along the blockchain to create a string of simultaneously recorded transactions along a network. To specify the uniqueness of the blockchain, we compare it to the common day clearing house or a centralized database. Think of these nodes as each transactions that are being sent to the clearing house to then reconcile and create this ledger. Now this clearing house can be seen as a conventional bank, any type of government authority. That clearing house is really meant to string together and create this ledger. That can be costly, time-consuming, and creates a lot of bureaucracy, which really stimulated this whole revolt of creating something that's much more efficient and anonymous, and this distributed database. Each transaction creates its own ledger simultaneously. Now, the cryptography behind this creates an anonymous feel or anonymous truth on this blockchain. There's really no central authority to spot fraud. Cryptography is a coding language that hides each identity and the blockchain is up to the community to verify this with keys. The keys are basically mashed data that represents the use to unlock the market. You can either have a private key or a public key. The private key is used by sender a that signs it to basically record that transaction privately. It's announced publicly to the block chain system. Then the block chain system uses this private key to unlock this transaction and that recreates a public key. If that publicly works, then it verifies that transaction and it also verifies a proof of identity. Then that's recorded on the ledger to create the string of transactions that's all sourced by that one private key transaction, that was made public, verified, recorded, and made on the ledger. Think of this as a chain of command. Now if we move on to how this was all created, the underlying technology, it's really one big math problem that creates these algorithms to solve called hash functions. The hash functions are actually developed by the United States, NSA. It creates about 10 minutes on average with billions of guesses to try to solve this problem. These are all organized, numbered, and check so that all transactions are kept automatic. That automatically creates an account of your personal wallet status. If we go back to person a, transacting a bitcoin to person b, there's only one way to know whether or not they have enough bitcoin in their wallet to then create that transaction, which eliminates fraud. The only way to do that is that you create this math problem. Imagine billions upon billions of all these transactions that are created into this algorithm just to verify whether or not person a has an open wallet to transact with person b and beyond. So the mission is that in order to solve this hash function, these computers are created that generates billions of guesses. In about 10 minutes, they solve the problem. Once they solved that problem, remember the keys transaction that's all taken place, that creates a block that's going to be added to this chain. Along this blockchain is verified transactions on this open ledger that's truly decentralized. Once that block is added to the chain, you guessed it, a new math problem is created. This new math problem just then, goes along this string that's creating this massive network of peer-to-peer transactions simultaneously verified, gets rid of the middleman, and it's all automatically adjusted along that block chain. It's all done anonymously. As we create this trail, what's the true value in it for people keeping this network up to date? Well, we have these people called bitcoin miners. These bitcoin miners are responsible for creating these computers to solve the algorithmic math problem and we call these as "volunteers". These volunteers mine massive amounts of data, they build computers to solve these problems, and they're actually awarded about 12.5 new virtually created bitcoins out of thin air. This keeps the system afloat and it also keeps miners solvent. Because the hope is that as more people use a blockchain that creates value in the system and those 12.5 newly virtually created bitcoins expand in value as more demand is increasing on this limited or low supply. Now, these bitcoin miners and blockchain in general really relies on demand. You want to keep the blockchain moving. The increase use of blockchain increases the value of these virtually created bitcoins that then goes to fund the volunteers or the miners to create new blocks and solve these math problems to keep the system running. I know that's a mouthful. But that's basically how the system works. Think of these as a streamline transactional code that's using billions and trillions of transactions. But the caveat here or the problem here is that the more data that's created, the more demand is funneling this block chain, the more costs or money that's going to be involved in building these massive computers. So what's in it for the miners down the line? There's going to be less new coins created to reward the miners over time. As I'm going to state it later on in this video, when we get to trading and the whole investment idea behind blockchain is that you're really going to rely on this demand one supply gets fixed. Eventually, the last bitcoin is going to be about the 21th millionth coin, which is going to be mined in probably about two years or up till 2140. So you've got this short window of opportunity, that our supply is going to be contracted with hope that demand on the blockchain system will continue to expand and enhance the value of bitcoins, which will make mining more efficient and also more rewarding. But the more data, the more expanded that the system is, the more costly it's going to be. Perhaps miners will try to charge a transaction fee on top of that. The hope is that the miners will not contract to create this central authority to where bitcoin can truly be decentralized in the future. With that primer and that 101, let's begin with learning how to trade and invest in bitcoin as a cryptocurrency and as a digital currency addition to your portfolio.
3. GDAX Platform: Hello everyone and welcome back. This video lesson will cover how to buy and sell digital currency using the Coinbase platform, and then we'll also provide a walk-through of the GDAX interface in order to buy and sell digital currency. The first thing you're going to do is log into coinbase.com. It's a platform for digital currency holding and trading. Currently they operate with Bitcoin, Ethereum and Litecoin. When you log into coinbase.com, you're going to scroll down, it tells you a little bit about who they are, what they do, it's a global service, they have about $20 billion or so in digital currency exchange with 11.2 million customers which is really nice. There's a three-step process to get started. The first step, which we're going to do is sign up and create a digital currency wallet, and that wallet enables you to connect and exchange your local currency to cryptocurrency. There are two options in order to exchange. You're going to either use your bank account which has lower fees associated with it, versus your credit card in order to fuse your exchange, your local currency into digital currency. For example, you're going to take US dollars and buy some Bitcoin on the exchange in order to trade that Bitcoin against cryptocurrencies or your local currency with the dollar. Your third step is going to, as I said before, is buying the digital currency. You're going to exchange your, let's say US dollar local currency to buy some Bitcoin, Ethereum, and Litecoin to begin as they say, using the future of money. Now there are multiple use cases for using cryptocurrencies as both a storage of value, a mobile wallet in order to exchange, or you can use it on the trading exchange to speculate on price movements. You can also use a mobile wallet on your Android or iPhone, you can also securely store it using their full control over a crypto network of private keys and a multi-signature vault. You can also buy insurance against your covered cryptocurrency holdings. It's secured way for you to put together a vault. You can also do an instant exchange, which immediately exchanges your local currency to the cryptocurrency, and this is a very unique feature for investors. It enables you to operate recurring buys. You can institute a way to slowly accumulate cryptocurrency over time by scheduling buys on a weekly or monthly basis, that enables you to skill into an investment instead of being trigger friendly in the moment. In order to exchange cryptocurrency on a marketplace, we're going to go to gdax.com which is operated by Coinbase. This is basically their trading sweet. It's an entire ecosystem of electronic recordings of all desire transactions in the marketplace. If you notice here, it's a lot of busy work but it's basically recording all the positions as agreed upon by price and size, which is recorded in the chart. The chart is basically shows demand and supply at a given moment in time, this is a candlestick chart which we'll go over in the next lessons, you can also change the interval from one minute to five minutes to one day, and each candle represents that time increment. You can also have an overlay over 12 or 26 exponential moving average over and over that period. It basically shows you all the agreed upon prices over time. The bottom panel here is the volume. This is the total number of crypto currencies traded during that given period of time. You can see during volume lifts, those are extreme price readings. Extreme lows and price on high volume gives you an impulse move up whereas extreme highs on volume going down gives you extreme readings to sell. Here is the market limit or stop, this is where you're going to enter your order at specific conditions. A market order enables you to enter a trade and any price currently traded in the market. Limit order enables you to set a price cap on how much you are willing to pay for a particular cryptocurrency. For example, on Ethereum here, let's say we just wanted to get in at 308.30. We will enter that as our limit price, nothing more will be executed. Stop enables you to get out at a certain price. Let's say we don't want to dip below 307.50, you're going enter that into your stop, and it ensures you that cover. Here is the order book or what we call the level two quotes, which basically shows supply and demand at every price, at a particular size. You're really going to eye into the highest bid and the lowest ask. The difference between the highest bid, which are shown here in the lower green, and the lowest ask, which is shown here in the upper red, is the spread. The spread gets constrained or it expands as buyers and sellers agree upon certain prices. Here you're going to look at, as a way for you to assess buying and selling pressure and it gives you comfort in buying at the ask but with the appropriate bits support. If you're going to look at the ask, which is the upper red, and you're looking to buy at a particular point where sellers are pretty much active, so you can get at that low point in price, let's say you're looking for the highest or the lowest ask price. Let's say 310.20 versus a high bid, that's going to give you comfort at 310.09, you're going to use that range to position against whatever direction you're thinking the price is going to go. This is extremely useful for short term traders in the day trading environment, what we're going to do next is use technical analysis to aggregate a lot of this price noise in the short term in order to scale and to position trades over the intermediate term. That's the exciting thing about trading. I'll see you next time.
4. Technical Analysis: Welcome back to the second recording of Intro to Cryptocurrencies, Block chain and Crypto Trading. The first video before this, we talked about how to transfer your money from local currency be it US $, Japanese yen, into Crypto-currencies like Bitcoin, Ethereum, and Litecoin. Now we're going to dwell a little bit more into the trading aspect of it by looking at technical analysis on how to position trade by looking at key indicators like price, trend and momentum. I outlined more of my trading technical analysis skill sets in my previous course on learning to swing trade using charts. Go take a look at that for a more in-depth analysis. But for here we're just going to do a brief primer on it and relate it to Cryptocurrencies. Beginning with technical analysis, what is it? It's basically a way for you to measure supply and demand by looking at recordings or aggregated price movements over a given period of time. What we do is we look at trading activity or price direction. It's not forecasting. It's just a way for us to monitor different levels of supply and demand on a chart in order to position your trade accordingly for the appropriate risk-reward profiles that enables you to trade with confidence, giving a higher probability of a setup that performs given your objective. That's what technical analysis is all about. It's looking at the price movement to avoid of any type of distractions on the macro level or anything like that. It's aggregated movements in order for you to position against a particular or within a trend. As I said before, it's rules based system. It gives you defined entry and exit strategies with the use of momentum indicators or trend indicators and ultimately what we look for is the price confirmation. I use a lot of candlesticks, which is a Japanese method of recording price movements over a given interval. You saw at the previous lesson we looked at different intervals on a chart. It can either be a five minute, 10 minute, one day, one week, one month and each candle on that chart records the price movements within that range over the given interval. For example, if we're looking at a 15 minute chart, that one candle is 15 minutes of price movements during that time period. You have a bullish candle or bearish candle. Bullish candle is generally filled with green or sometimes white. It's generally a favorable color that shows you when the bulls are in control. Basically, when the close of the price is higher than the open of that day or that interval. The Wix here on the candlestick represents the highs of that period, let's say a day and the low of that period. Same goes for the bearish candle. The only difference between the bullish and the bearish candle is that the price closes below the open of that period or of that day. Let's say if you're trading Ethereum and it opened at 300 and close at 320. That's a bullish candle because the price at the close was higher than the open. Inverse to that, let's say that you're trading Ethereum and it opened at 320 and it closed on that day or at that 15 minute interval at 300, that's a bearish candle. It shows that the bears were in control of pushing the price lower than the open of that given period. That enables us to just show where the momentum is heading. If we are having cluster of these bullish candles, let's say that things are opening or prices or opening at a lower price, but then the bulls are consistently able to push it upwards, you're going to see the chart rising in tandem with that bullish momentum. The same goes for bearish and you can basically follow that trend giving your setup. What I like to do on a technical analysis approach of a chart is looking at support and resistance. It enables us to identify areas of demand and supply and also enables us to locate price exhaustion, and we're also able to measure moves for producing targets or stops on the chart. Here we can see a fictional crypto x currency. You're going to have to follow the price movements as they go along. Here, the bulls are currently in control, but then they consistently got stopped around this level and we call this a supply zone of about 40,50. That's what's capping this move here. Then the price decline. You had some support here. It declined through support it's giving us a bearish confirmation. But you can see here it always gets saved by this level of about 35. That's where the buyers are situated to then buy at prices at that low level. We call it demand zone around 35. Then price had a series of higher highs and higher lows, which we call support. It broke out of this resistance that was tested multiple times. Tested once, tested twice at support, and then it became resistance. Tested once, tested twice, then broke out here. We can take a measured move of about this height from the prior support and resistance to that demand zone of 35. Difference between 35 and about 38,50 would give us a high price north of 41. We're also looking at price extremes or price exhaustion. This is when you're getting a fairly tight candlestick. The higher Wix showing that there was a large range between the high and low of that period. But the close was right near that open, which shows that the bulls and bears were at a stalemate of that particular candlestick, which shows us an exhaustion. I'm going to highlight the exhaustions here of about that supply zone at 40,50. There was an exhaustion that told us that the bulls and the bears occurring at a stalemate and that push the price lower. Here we see an exhaustion of extreme Wix and extreme range, but tight consolidation in price agreement, which gave us an impulse move. Basically, just falling out around. Here is an easier way of highlighting support and resistance by calculating a moving average is basically the average of prices over a period of time. So you have, you got a 20 period moving average can be 20 days,15 minute bars so give it. The 20 period moving average provided support for this particular price range and then once you've crossed over, it provided resistance. That gives you an area of, again, demand and then supply. That shows us when we're going to enter traits, whether it be at that moving average of demand with increasing highs and increasing lows, or selling at that period of supply with decreasing eyes and decreasing lows, signifying a downtrend in price as opposed to an up trend in price. As you can see, the supply demand, the resistance support gives us a area of control on the chart in order to position our trades accordingly over more of an intermediate term. You can also use this over a very short period of term. But over the short period of term, you're going to use what we use in the prior video. Those level two codes of instantly recording supply and demand. If you want to aggregate a lot of that price movement up to the intermediate term where you're going to take a position trad e. We're going to use more of the support resistance to technical analysis, the moving averages in our favor to produce high probability set-ups and that enables us to measure our targets on a chart. The next lesson we are going to go through some of the Cryptocurrencies to put this all into action.
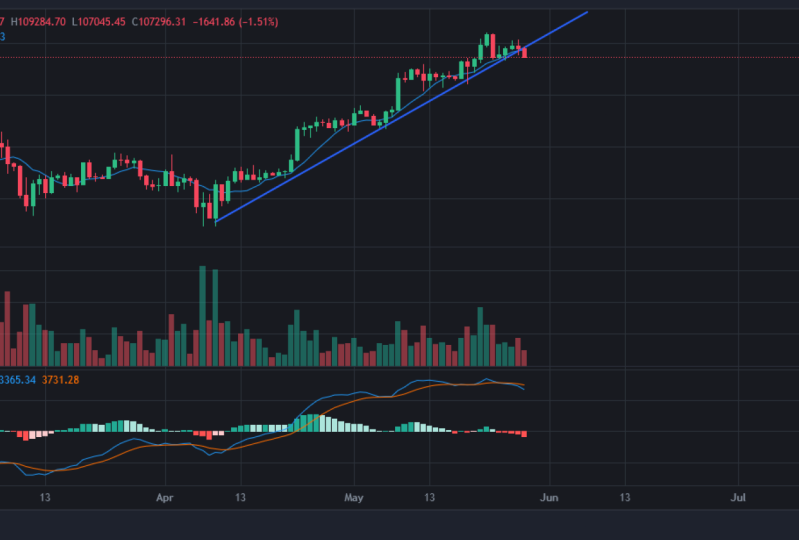
5. Chart set-ups: Hey guys. This video will just cover a quick lesson on how to use some of the technical indicators that we covered in the prior lessons to gauge trend, momentum, and tradability at the end of the day. Here's just a simple daily price short of Bitcoin BTC versus the USD, and that's the exchange rate that we look on. Always best to use probably the coinbase price data and this is I just use a trading view.com platform and I'll paste that down below the link to get some of the price charts and it offers some good real-time data that you can track during the day and just gives you an overall assessment outside of the GDX platform of conducting more in-depth technical analysis. This is a basic screen that I use whenever I look at securities all across the market, starting with Bitcoin, what I tend to always do is just use a 40 period moving average. This will be the 40 day moving average and what this does is it calculates the average price over 40 periods and each price is plotted to create this moving average line. This basically shows you the median or the mean average price point that tends to create some central tendency along with price data. Prices usually tend to use this as a support or resistance or tends to go back towards this area of central tendency over time. These dotted lines here are the TD sequential. It's more of an in-depth thing. I'll go into probably this in another class. But basically this just plots nine consecutive price closes upward or downward creating either a green or red area of stop, or support, or resistance and prices tend to hit this line point after a nine consecutive counts. For example, nine price bars down, all coinciding from the low of each would create this by zone of support and then nine upwards would create this sort of area of resistance and that ends up being our stop point as we gauge the trend further. As you get these color bars down below or up above, that basically tends to tell us counter trend exhaustion of areas where you either want to trim an existing position within the trend or position within the trend during minor exhaustion, and I know that's complicated but that's basically telling you what these things are on the chart. I also use some Fibonacci points which just basically shows you the retracement of a prior trend move up or down. In this case the trend is shifting up from the 17th of October on-wards to present. A retracement of that move from this point upwards to this point would be 61.8 percent, which tends to give us an area of support resistance in this case support because prices have tended to bounce from this level about after seeding it here, it probably close north of that here, close north that here. That's a good area of support that will lend us a good buy signal above this resistance point and above capturing back that 40 day moving average to then give us a firm buy signal that the trend has been refreshed and we pierce over the 5K level, entered around 6K and we're getting a little bit of exhaustion. You see that the TD setup has provided us with a sequential zone of resistance which allows us a little bit of a pullback so I'd be looking at support initially to about 23.6 percent of this up trend retracement that would enable us to assess zones of support and probably position with the trend going upwards. If we do break that, that will give us confirmation that the trend is shifting downwards and we would position accordingly. To the bottom pane here, this is a squeeze momentum indicator that I use and I try to jot down a definition without going into too much of the math behind it. The squeeze momentum indicator which basically measures market momentum and volatility or the speed of price change to identify moments of price compression which has a squeeze leading to an impulse move either up or down. It doesn't really tell you direction of a movement it just tells you when something big is going to happen and in layman's terms, it's basically measuring periods of low volatility, low action, but increasing underlying momentum. So the momentum is measured remember the price change or as volatility is measuring participation in this price movement. When there's low participation, the markets trying to gauge direction and it's not really telling us where it's going to go, and we can probably try to assume that via these charts setups that we use or other indicators that will give us a probability of a move up or down within the squeeze of an impulse. That gives us a price zone, or if you will, that's grid. But navigating within that zone in the direction of the trend and momentum is difficult. We have to assess that as we go, if that makes sense. Here, when looking at the colors, the pink basically tells us when the squeezes on. All right, we're waiting. This period here, we're waiting for something big to happen, waiting, waiting, waiting. We didn't get anything and it's always good to wait after the squeeze is on to get to the gray bar, and the gray bar basically tells us to execute. And here, for executing from a period of price trending downwards, we know that there's a little bit of a downtrend. We're just waiting things are pretty flat. Then we got this demarc T sequential nine bar down of exhaustion. It's basically telling us here we are getting some sort of a long tailed candle. Then there was a stalemate that basically tells us that there is a counter trend signal to go against his prior trend. We got the gray bar area. The squeeze has been off leading momentum to take charge. The bulls are activated, they go up, they hit a little bit of compression here at the resistance from the setup from the prior and Arne bar count and then we're off to the races. We got a little bit of compression here, but it's within the sort of zone of increased. We really don't pay attention to it. We probably want to trim positions around here, which makes sense because we've got that sequential countdown. You wait for maybe the color shift to get out of your position. You probably want to exit somewhere around here. We're getting a little bit compression in between that's basically showing us our beers are gaining momentum. We have shifted below negative squeeze and then we got to price quiz again into October and this is when people were trying to start writing off bitcoin. But then you got some news that impulse to move up to 5K 5000. You got a little bit of squeeze, you probably waited around this period here to go long and price then advanced above resistance here to make all-time highs around 6K and now you're seeing the color bar start to shift. So the squeeze has been off. It has sort of exhausted itself from this run-up. It gives you a chance to probably scale out your position at most. Without going too much into time and over seven minutes already but you can also do multitasking from analysis. You can look at this at a four hour basis, whereas each candle represents four hours of trading. This tells you the trend for Bitcoin as of this time has planned out, and again this is showing us towards probably this zone of support which is static. This is taken from the daily measurement of that retracement move. You can also zero down to maybe 30 minute chart its a lot more chop and a lot more noise but this is mainly for short-term traders who want to scalp get in or out of a position very quickly. Five minutes. I mean it becomes less reliable the shorter you go. But it's just your general feel. I do want to say cryptocurrencies have not been in for a long time as we all know. Weakly charts, we are in a long-term up trend. It's very hard to gauge trading from this especially the monthly chart. I mean, you're not really getting anything indicators are less reliable. For cryptocurrencies in general, it's good to work off of maybe a four hour, one hour chart up to a daily chart and that gives you a good trading analysis zone. Without going too much into time, I love technical so I can do an entire video course on this an enhanced version. ETH USD is theorem and again, use coin-base, and you can tell that it delirium tends to lag. This major price chart just messes up my chart so I'm going to go off of the log and more into this. So the daily price chart shows us we did get that run up here and we're sort of been flat. Movements has not really been telling us anything and we do know that it lags Bitcoin for hours, kind of choppy as well. But we're in this flat zone of compression and where the price squeeze so we really don't know which direction this thing is going to go, but maybe we can go on the daily and see that we are below the 40 day moving average. We are below resistance from 360, 370. I tend to also sometimes use the cloud and that's another thing we'll go into with the cloud here as we've gotten self compressed. I would probably be looking for a little pullback support area around here before we reignite the trend upwards. We are in the zone of sort of lower highs and that's concerning because you get in this price stop here, price stop here and I would not be surprised if we get any lift more up. Nine bars will give us a countdown sequential of resistance somewhere around here and prices do look a bit little bit range bound to limited at this point. Much of the move is sort of behind us and the market is trying to reassess where things are going to go, and that's okay. You take the signals as they come and you move in the direction of the trend. Like coin is also another one, LTCH, USD This is fairly new in terms of trading. Again, you're seeing the same thing here, but it's confirming maybe more towards the downside than ETH or Bitcoin. You can also look at these things together. You can do ETH versus Bitcoin or get to BTC versus Coinbase. You can see here that ETH has been under-performing Bitcoin over the course of maybe this year from the summer months and you can trade these things against each other, against the $ even against the yen or any other currency. This gives you a general feel of how to look at charts, how to use indicators, and how to really map out your market and map out your trad. If you're interested, leave a comment down below. I'll probably do a series of videos looking at charts of this setup and teach you how to put this set up together maybe a little bit of the math behind it and we can run through global markets heading into 2018. So if you're willing to become a trader or investor and you want to position your asset allocation, that can be something really cool and exciting to look at. I can just run through a whole bunch of charts, gold, $, yen, few stocks would have you. This is really my passion. Let me know if you're interested in that. But hope this is very helpful for looking at cryptocurrencies from a technical perspective. Let's get back to blockchain and cryptocurrencies in general.
6. Strategy & Risk: In this video, we'll discuss trading strategy and risk management. Figuring out which time frame is appropriate for you and looking at high probability risk-reward profiles of a tree. When we look at the time frames, we're distinguishing between day trading, swing trading, or investing. For day trading you're closing out of positions by the end of the day, meaning that your positions are going to be very small in terms of looking at your time frames. There is more price noise and this is reflective of the volatility. But you're also using tiger stops. The more transactions that you do, the more costly it is going to be. That makes day trading pricey from a transaction point of view. When you're looking at swing trading, you're holding positions for a few days to maybe a few weeks. This allow time for the position to confirm direction to the upside or downside there are less transactions involved and this allows you greater or wider profit zones to take advantage of. For investing, you're holding positions for a few weeks to maybe a few months and you're benefiting from developing a portfolio of digital currencies and this is because if you're using shorter position or smaller position sizes it allows you greater flexibility to navigate or hold multiple digital currencies. Investing requires a great deal of patience and comfort with longer time frames. If we're looking at this chart, we're looking at the relationship between speed and due diligence. Due diligence is the homework that's required to really look at a position and figuring out the value when a crypto trading is on the upper left-hand corner, meaning that you're looking at the day trading or order flow approach and really looking at that speed of price changes and it doesn't really require a great deal of debate when you're deciding whether or not to execute on that trade because you're looking at such high-frequency data. The edge here, in my opinion, is swing trading. You're looking at that speculative factors that aggregate a lot of the information that's coming out of the day trading or overflow or high-frequency price noises and using that to your advantage of holding a position for maybe a few days to a few weeks and allowing you that wider price zones of opportunity. When you're looking at value you're either looking at the storage utility aspect of Bitcoin appreciating over time by holding it for a long period of time or you're looking at the underlying technology of block-chain that require a greater amount of due diligence and really honing on the value of this technology. When we look at cryptonomics, here's what you need to know. There's a fixed supply of Bitcoins over the next one, two years and it's about 21 million mining capacity and this really means that in order for price to increase for Bitcoin or cryptocurrencies in general, you are really going to need that demand component to increase. This can either be the utility function, the means of transaction or block-chain expanding in the Cryptocurrency domain. That's really going to be their driver of price acceleration over the long haul because you're going to have that fixed apply and you're going to need demand to pick up in order to keep that price elevated. When we're looking at analysis for cryptocurrencies, we're either going to use the measurements of price over different time frames, and that's technical. We're either going to benchmark these cryptocurrencies against each other or the more standard FX approaches and we know that the risk here is pretty high because it's volatile. You're looking at 20-30 percent price swings and that requires a greater stop when you're trading. When we're looking at crypto versus FX, it's a decentralized market versus FX. That means that there's less concentration versus FX and there's greater stability in FX when you're looking at exchanges or legal certainty because governments haven't really wrapped their head around cryptocurrencies, digital currency spaces, or block-chain for that matter because it's so new and it's against the norm. It's a decentralized system rather than a fiat money based system and when we're trading, it's important to only invest what you're willing to lose and remember that you're utilizing price fluctuations and volatility to your advantage and you have the ability to develop a portfolio using a unique and uncorrelated value for your trading portfolio and that's where cryptocurrencies come in, which we'll discuss in the next lesson. For analytics, it's very, very important to stick to your process and that's what we discussed in the prior lessons when looking at price charts, plan your trade and trade your plan and the components of this is going to be the recording of all your trades by monitoring your performance relative to your trading plan and the best you could do is keep it simple. A trading journal will help you with accountability and it's also a tool to learn down the line and always, always, always adjust your strategy based on the new trading data and your unique objective in terms of what you want to get out from trading cryptocurrencies.
7. Cryptocurrency Portfolio: Welcome back. In this class, we're going to be talking about cryptocurrencies and a portfolio, which is pretty unique and pretty cool. The first slide talks about invest in crypto. Cryptocurrencies as an asset class. A lot of people in the investment field don't view this as an asset class and I would agree, I think that cryptocurrencies is a marketplace. It's a digital currency marketplace and it's extremely volatile, but in the end, it also offers a bit of diversification query portfolio and I think it untaps a new marketplace, a new regime, and that regime is decentralization. The method of that is blockchain, which we'll discuss a little bit about in detail. Is it appropriate for the long haul? Is it appropriate for hedging? Or is it meant for speculative positions? I think it's more appropriate for speculative positions because that volatility, it can also be a method of hedging. Maybe if we're looking for expected value portfolio to increase via this unique risk, and you can look at that relative to your other holdings. For the long term, I think that the underlying technology is more appropriate rather than looking at cryptocurrencies. That's because it's so fresh and it's highly volatile that if you're investing in digital currencies or a long-haul, you're more susceptible for higher risk, and you're going to need to be compensated for that. You are also looking at the various uses for cryptocurrencies and broader block chain, and that's really more about value oriented investor. When we look at money as a digital asset class, we're going to divide it between conventional and crypto. The conventional money is really the fiat currency. The money that you use currently is based on the belief that it will be continued to be used in a legal form of transaction as opposed to when it used to be backed by gold. Fiat money is money that is not backed by physical commodity to this current day, and it's really the faith and a value that's declared by a central authority. Whereas in crypto currencies, we're looking at a digital currency marketplace that's depending on this block chain system. Blockchain is pretty much a decentralized ledger. It accurately sources the demand and supply simultaneously and its community power, rather than a central authority having control over the money supply, but it has a limited supply, which we talked about in the prior lesson, which again, focuses mainly on the use case for that demand picking out to justify a price. When we look at the conventional use of money, it's either they're going to be a medium of exchange, a storage of value, or it's going to be a unit of account. When we look at cryptocurrencies, the use is really the potential for it to be the utility. Increasingly more accepted as a digital currency in terms of transaction, it can also be held in a digital wallet, which we looked at in one of our prior videos. In terms of a unit of account, it digital currency cannot be converted to any other currency. It can either be converted from either your US dollars or whatever dimensional currency you've got to a digital currency. It cannot be put backwards. If it's going to be a utility, you have to incorporate that extreme price volatility. If this is going to be a unit of measurement, that unit of measurement is going to be changed pretty dramatically when you are looking at that relative to a fiat currency or more conventional currency. It's pretty sticky. It's going to be there and you're going to know that something that's valued at $1 today is not going to be $4 tomorrow. The volatility in that it's pretty much light. In order for it to be a utility, in terms of a value, something that's going to be utilized as value, you're going to look for this market to mature over the years. That's really going to be the use case for crypto replacing or becoming more of a conventional asset class. When you look at volatility, a lot of people are talking about cryptocurrencies being extremely volatile, and it is, but it has become less volatile over time. This is because it's more stable and you're utilizing more liquids arctic exchanges. It has greater regulatory clarity now, and it has more broader or ownership, and it's more reliable when you're looking at price discovery data. The chart to the upper right corner just shows the extreme volatility of Bitcoin daily price change. Around its inception of about 2011, the daily price teams around 50-60 percent. That's extreme. Over time it says pretty much evaporate. It's about 10-20 percent, and that's more manageable. This is because there's a lot more certainty, a lot more stable exchanges, and a lot more familiarity with Bitcoin as a trading vehicle. If you look at the use cases for Bitcoin, over time, it has become more conservative. You're looking at about 44 percent to about 64 percent, and now 54 percent where people are using it strictly as an investment rather than a transactional medium. That has dampened the volatility over time. It's still pretty high, but it's becoming more and more conventional way. When you look at portfolio consideration, you're really going to distinguish between unique risks or unsystematic risks over systematic risk. This is market risk. Portfolio managers or investors are really more concerned about systematic risks. What are the risks that a market can have on a portfolio of securities overall? I you have a less securities in your portfolio, you more exposed to uniqueness because you're concentrated in a few number of securities, whereas if you're holding a lot more securities, maybe 15-20 in portfolio, you're more concerned about the overall market risks on the fluctuations in the value of your portfolio. If you're focused on systematic risks, this is where digital currencies can come in to mitigate that market risks, and the market is not really going to have a command on the digital currency marketplace because it's unique addition to your portfolio that can mitigate any type of downside or market risks factors. Whereas if you're holding a limited number of securities, digital currencies can also come in because it's less concerned about unique risk of each individual holding, whereas you're going to be compensated for this outside recently taken in. When you look at portfolio considerations as a whole, you really have to look up your ability to survive extreme price swings that are occurring in the digital currency marketplace. There are short-term opportunities to add Alpha to your portfolio, and you have the ability to get filled for large orders, which is not really easy for such early on market. You've got to worry about slippage and a lot of these things of an exchange that's not as conventional as equities or FX, you're really seeking their premium return for this unique risk. This can be interesting because if you're looking at a portfolio and you're assessing the return for this unique risks, digital currencies can come through with this high amount of preset you're taking, but you're also attaching the premium on top of that. That can be something justifiable in terms of adding into your portfolio. One thing to look at over the long haul is its potential for new institutional buying like pension funds and so forth into this digital currency markets base or into block chain as a whole. That can attract a great amount of capital, and this is where the demand kicks from the market sense, not really the product sense, but from the market. This is really driving an institutional money that can really increase the value of cryptocurrencies over time. That's something the track over a long period of time.
8. Future of Blockchain: So you've made it to the end and now we figure out what's the future of Blockchain? What's the purpose of all this and where are we headed? Well, we start with looking at ICOs. An ICO is basically the Blockchain equivalent of an IPO or initial public offering. Typically, when a company wants to issue stock to the public, they issue an IPO, they go to the market, they raise funding, and that's how they exchange equity for value of shares in their company. Now, companies nowadays that are most likely to be on the Blockchain issue an ICO, which is a decentralized way of valuing a company and participating and they're expanded value via shares of an ICO, which is Initial Coin Offering. The cryptocurrency ICO market has exploded from an only maybe a few years back, I think I'm not too sure on that. But the chart here just basically shows cryptocurrency ICO stats of 2017 this year. So you can see from January on through the summer there's been an exploded total amount raise of about 600 million in ICOs and total raised here, It shows that the total number of ICOs is about 176 this year so far, and you can see some of the major projects like Filecoin, Tezos and EOS exchange to EOS stage onwards and the total amounts raise. So there's lot of activity in this ICO marketplace. Again, it's like this revolt of the norm. It's where everyone can participate on this ledger. Blockchain has been the platform to streamline this digital enhancement. Here you can also see the rise of ICOs in a pie chart form. ICO is by category this year 2017, it was mostly infrastructure related. Now I'm not sure particularly what they mean by infrastructure. It could be this Blockchain infrastructure where it's Cloud-based or it could be infrastructure as in physical like man-made infrastructure on the Blockchain. I think it's more of the former, and then you also have trading and investment. This is an interesting point for me, particularly because I'm coming from the trading and investment background. This whole idea of smart contracts on an exchange. That's really interesting because you get rid of this clearing house and every tree transaction. It limits the cost of transactions by having this de-centralized ledger, and the more complicated transactions get when you go into like futures and options or synthetic collateralized obligations and things like that are really reminiscent of the financial crisis when we add all these exotic derivative instruments we're stuck with those exotic derivative instruments, but it hasn't gotten more efficient than what it was in the turn of the century. I think that now what we're getting is a smart contract, phase to where becomes a lot more efficient, a lot more decentralized then you get rid of the middlemen, and I think that's an area to explore. I don't know if there's value in it yet because it's still grand experiment. But it's interesting to see that trading and investment made up about 15 percent of the rise of ICOs this year alone. Then you're getting data storage. So that's probably the infrastructure part that I was looking at. Finance is smart transaction payments. Getting rid of the PayPal is those middleman. To where transactions can be easily recorded from a buyer to a seller simultaneously. You don't even need the storage clearinghouse to reconcile your transaction because it's reconciled on this Blockchain. So an ICO that taps into that to create this value of payment or this transaction extremely efficient, and that's why it's getting 6.7 percent of the rise of ICOs this year. Then you get Gaming and VR and betting. You can imagine how this will work out in sports bets, commerce, in advertising anywhere where there's like a creative or some value that's being exchanged like real estate art, music, energy. The outcome is fascinating via this rid of the middleman because it's created these costly way of managing a market on a lot of these value oriented objects, if you will. That now is getting more accessible, and I think that's extremely interesting to explore at least. Ethereum, we didn't really touch too much in this program and in this course, but maybe in the future. But Ethereum to me is highly, highly interesting as a platform and I think that's what separates it from Bitcoin. I think when we looked at the charts earlier at some of the technical analysis, you really see Ethereums were lagging, and I know that a few weeks prior to this recording, somewhere around late September, there was this run-up in Bitcoin, I think because something went on in China or there was a much more stimulated demand in Bitcoin, that's when I think it hit 5k, 5,000 in value. Ethereum lagged that you rarely see anything confirming from Ethereum or ETH versus USD or any other currencies until maybe a few days later. So it was lagging this move in this broader Bitcoin rise. Then it did eventually get to rise. But I think that lack shows that there's some fundamental disconnect between what Bitcoin is and what Ethereum provides as a platform. Basically when you look at Blockchain as an application and its use as this utility on an enterprise to where it enhances an existing digital ledger, that's where this grand project of enhancing a decentralized system comes into play via Ethereum. The whole point of it is to keep tabs on transactions simultaneously recording them. In this form of smart contracts for multiple industries. The chart here ends to the left just shows the share of ICOs, assets that are built on the Ethereum Blockchain, this massive project. You can see it has taken over other Blockchains in terms of shares. So July the 17th, it was pretty much all Ethereum this summer, which is pretty fascinating. Percent share of total market cap of crypto assets. You can see that Ethereum makes up about 76 percent which is massive share of total market cap of crypto assets and Bitcoin is about 15 percent. All other platforms are about three percent. This massive use of Ethereum as a platform has gained a lot, a lot of underground involvement that's not really made mainstream. I think that there's a lot more to come from Ethereum. If you're thinking of investing, that might be the spot to go when you're looking at ICOs that are leveraging the platform of Ethereum to create the decentralized digital currency exchanges or Blockchain enterprise experiments of the future. So there you have it and good luck and all the best exploring cryptocurrencies as a potential asset class or a potential game changer.
 Damanick Dantes, CMT, Macro Trader at Dantes Outlook