Transcripts
1. Class Outline: Welcome to my Forex
trading class. My goal is to introduce
you to the world of forex. I've been trading
for a while now, but I remember what it
was like starting out. So I created the
course to be used as a Fast Start Guide to Getting
up an octave in for x. You will learn what you need to be aware of before you even make your first deposit of
real money into your broker. It's important to have this
knowledge before you start putting your hard-earned
money into a forks account. For X offers a potential
to make some extra money. But if you enter a
position to large or you fail to safeguard
your traits, you place yourself
at a high-risk. However, you are here
and ready to learn. So I hope to overcome this by revealing to you the
ins and outs of forex. I've divided my training
into two sections. In the first section,
you will learn the theory of Forex trading. I will introduce you to the main concepts and the
main platform for trading. You'll learn about
the types of forks, traits, how to calculate
your position size, and how to safeguard
yourself from blown your account in
the first few traits, that will be a very
important lesson. And I'll also show you
an effective technique for entering for expositions. In section two, you'll learn the practical side
of Forex trading. The main focus will be on technical analysis
of your charts. I'll introduce you to
different types of indicators. And when they are
most effective, I'll share with you
strategies that have withstood the test of time and are commonly found in the traders toolbox for trading. And I will show you
the best way to back-test a strategy so
that when you trade life, you can expect
better results and not test on tactics
using your own money. There's quite a lot to cover. Before we move on, I'd
like to mention that the first few lessons
may seem difficult. My aim is to introduce you to
a lot of concepts early on. They initial exposure to these
concepts will be valuable. And in the second
part of this course, you will see them applied
to real trading situations. Once you see the
practical side of things, a lot of concepts we'll think
in and start making sense. When I was learning for x, I tried to study all the
theory before making a trade, and this was overwhelming. The most value I got was when I opened my first account
and started trading. The practical side enabled
me to understand the theory much more clearly and I believe the same
will apply to you. I'm not saying that you have to trade with real money initially. What I'm actually recommending
is that you start out using a demo account
and using fake money. They experience
will be priceless. Thank you for
joining my training. I hope that you find the
content interesting. Let's get started with
the prerequisites you need to know before trading.
2. Trading Basics: Before you Start Forex: Welcome to the first lesson. I will cover the main terms that are used in Forex trading. The purpose here is so
that you are familiar with them or at least have
heard of these terms. Then in the following lessons, you will see how
this terminology is used in a live
trading environment. So the first term is currency
pairs, pretty obvious. There are three
types and they are categorized based on popularity. The eight most frequently
traded currencies are called major currencies, and you can see
them listed here. Next we have the
minor currencies, the middle group and
the least popular, or the cross currencies. Again, it's a sliding
scale based on popularity. So you can trade any of these. And when you set up metadata
for the trading platform, you will see where to
find these currencies. When you see a currency pair, they will be quoted like this. So you can see US
dollar and Swiss franc. The base currency is
the first currency. It shows how much the base is worth against the
second currency. And the second currency is
called the quote currency. Next we have pips. Any currency movement
is measured in pips. Pips are on every
chart measurement. You will use pips to measure your orders and size of orders. It's like the way
to navigate through that your charts using pips. Depending on the currency
and the broker you're using. You will sometimes see pips. Other times you will see many
pips or known as a pipette. It's one-tenth the
size of a PIP. Again, you will
see this in action later when we jump onto
our trading platform. In Forex trading, there
is a large potential to make money because you are trading using your
broker's money. When you buy a currency pair, you do not own it. This is not like going
to an exchange and physically changing here
US dollars to Euros. When you buy a
currency in forex, there has to be a
corresponding cell to complete your order. This is because in forex you
trade using leverage, e.g. for every $1 you trade, you could potentially have
$100 at your disposal. This would mean
that you are using a one-to-one hundred
leverage on your traits. The positives are that
you can earn a lot of money as you're
trading with larger sums. The negatives are
that you could lose all your money by using
your broker's money. However, there is a safe guard to prevent this from happening, and I will share this later. Different brokers offer
different leverage for trading. It can be even as high
as 5,000 leverage, although this is too risky. When you are starting,
I suggest you use a leverage of one to 20. As it's not too big, you need to learn the
mechanics of trading first before taking a risk and
trading with larger leverage. To make trading with
leverage possible, your broker will require a money deposit
known as a margin, and then you can
set your leverage. This money deposit is
known as your margin. And margin is
simply a portion of your funds that your Forex
brokers set aside from your account balance
to keep your trade open and to ensure that
you can cover any losses. It's the equivalent to
security when getting a loan, essentially, you are
borrowing money from your broker in order
to make larger traits. E.g. if you have $100 in your account and you're
trading with $1,000. So one to ten leverage, the broker takes a
certain amount from $100 as the margin
for that trait. When the trade is completed, you get back your margin. If you are trading
with a $1,000, but your account
only has $100 in it. If the trade goes against you, your entire account
can be wiped out. So how do you save, guard
yourself from having your account liquidated
if your trade goes bad? The answer is by using
a stop-loss order. This is an open order
that is a number of pips away from
your entry price. If the stop-loss is reached, your position will be
exited and you will only lose a
predetermined amount. So what is this
predetermined amount? It's your risk ratio. When it comes to Forex trading, each position you
enter represents a risk to your account balance. So if it goes against you, you lose a certain
percentage of your account. E.g. if your account is $100 and you are
risking five per cent, then your stop-loss
will be placed at a level that if it
is hit you lose $5. Are generally acceptable
process is to use a risk ratio of 1-2%
of your account. Now the reality is
when you're trading, you sometimes hit
consecutive losses. If you are trading
at 10% risk ratio and you hit five
losses in a row, then you are down
50% of your account. If however, you are
using a risk ratio of two per cent and you have
five consecutive losses, then you are down
only ten per cent. So this is a safe guard and stop losses should not
be treated lightly. Now let's talk about lot
sizes or position sizes. For x is traded in specific
amounts called lots. When you place an order
to buy a currency, it is specified in lots. The standard size lot is 100,000 units of a
certain currency. But there's also a mini, micro and nano lot sizes. Some brokers show you lots, while others show
actual currency units. Depending on the lot size, each pip will have a
different money value. When I go to the trading
platform, metal trader for, then you will get familiar with lot sizes and placing orders. And then we have the broker. And the broker is a
company that is handling your account and through
which you are trading forex. Forex brokers will quote you two different prices
for a currency pair, the bid and ask price. The bid is the price at which you can sell
the base currency. The ask is the price at which you can buy
the base currency. The difference between
these two prices is known as the spread. Instead of charging
a separate fee for your Forex transactions, the cost is built
into the buy and sell price of the currency pair. So the broker makes money by
selling the currency to you. And the broker also makes money by buying the currency from you. The difference between
these two prices, it's the spread and it can be known as the
fee for training. And a couple of more
forex concepts here. As you are using leverage, you can buy and sell
in Forex transactions. When you buy, it's going long. When you sell is going short. And when trading forex, you can select the
timeframe that is most suitable to
your trading style. So you can trade a five-minute
charts, 15 min charts. Or if you want to have a
more long-term strategy, you can trade daily charts
but more on this later. Don't worry if this seems
like a lot to take in. The first lesson is
meant to introduce you to the terms in the
following lessons, you will see how everything fits in when you start Forex trading. By the end of this
first section, you will become familiar with these terms. I
can promise you that. Okay, Let's move on.
3. The Platform for Forex Trading: Welcome back. I have unimportant
step for you to take. I think this is necessary so that you can follow along with my next lessons and
get familiar with the process of trading forex. And that is to open a demo
account with a broker. There are many brokers available depending on your region, you may have to find
a local broker. In this lesson, I'm not recommending any
broker because this is all about setting up a demo account so
that you can trade. Once you sign up for a broker, you will download their
trading platform. And one of the major
trading platforms is me2 iterator for this is like your control module for executing trades and
managing your account. The platform that I use for
demo purposes is a wonder. Let me show you how it works. Here's the old one, the website. And this broker is actually
quite a good broker. So if you consider to use it for live trading, It's an option. But I find that their
demo account is really, really great and it's
very easy to set up. So what you would do is you would just go to their website, click on menu, go
to CFD trading. And then you can
click on Try them up and, or starts trading. And you can open
up a demo account. So you'll have to register
an account with them. And when your account is open, then what you can do, or actually you can even
go there right now, just go to platforms
and then Meta trader for they have a number
of other platforms here. Personally, I don't
really like I never tried on a phone or just
the screens too small. They have a desktop up. And I went up, which it's okay for trading. But the thing is it
doesn't have all of the features that I'm after. So metal tray the four I'd say this is the
tool that you need. It's like a control unit. Everything that you
need for trading, for setting up charts is here. So what you would do is
click on metal trader four. And then here again,
you can either click here to create
a demo account, filling all your
details, register, download the metal
trader platform, and then when it's downloaded, then you will have to just open the platform login and you'll get something
that looks like this. This is metal trader for and pretty much
all of my lesson, I'm going to be using metaphor for explaining you
how forex works. Explaining you how
to set up orders, showing you the
different types of indicators that you can use. So I would say that
metal tray, the four, It's the best place to start Forex trading as a demo account, of course, but it's
the best way to learn all the ins and
outs of Forex trading. Later on, you can have a
look at the other platforms, but I have a feeling
that once you learn mandatory for you,
we'll stick to it. This concludes this lesson, so I highly recommend
that you go out and create your own demo
account at this moment.
4. 3 Types of Forex Orders: In this lesson, I want
to introduce you to the types of forex orders. There are three orders you can take to enter our position. The first is a market order. When you either buy or
sell using a market order, it means you are buying and
selling at market price. The order will happen instantly at whatever
the market price is. Disorder can be relevant
to your trading strategy. But there are two
more order types that you should be aware of. First, let's cover the
buy, sell, stop order. I find the easiest
way to remember this order is with an analogy. So let's say you're waiting for a bus and you are
at the bus stop. The bus drives and stops, picks you up and drives
on and it drives on in the direction it was initially
going in for a buy stop. Order is like being
picked up at a bus stop. So let's convert this
analogy to price. For a buy stop order, the price starts lower than
your ideal entry price, but you anticipate
that it will increase. So you place your order
above the current price. If the price rises, then your buy order
will be executed, and then hopefully the price
will continue to rise. A sell stop order follows the same principle except you want to enter a short position, so you want to sell
and you want to enter it below the
current market price, whether it's a buy stop
or a sell stop order. These are pending orders, so they only get executed once the price
reaches your level. Next, we have something known as a buy limit order and
a sell limit order. In a byte limit order, you anticipate that
the price will go up. But first, it will
make a pullback. Or you look at the
chart patterns and currently the price is too
high for you to enter. So what you do is you want the price to come down and
if it reaches your level, then it will trigger a trade
and then you will enter. So when you create
a limit order, you expect the price to bounce. So it will go down, hit your order and then
bounce and continue going up. The same applies to
sell limit orders, but the opposite applies. So the price is going down. You think it's going to
go down even further. But you expect it
to make a pullback, in this case, go up before
it takes another drop. So you place a sell limit order above the current market price. If the price goes up a little, it will execute your order, you will enter it, and then hopefully you expect
the price to go down. And that's all for the
three order types. I hope my analogy has made this much simpler for
you to understand. Do not worry when we go
to mete trader for you, we'll see exactly
how the bi stop by limit orders
are market orders, how everything is
applied in action.
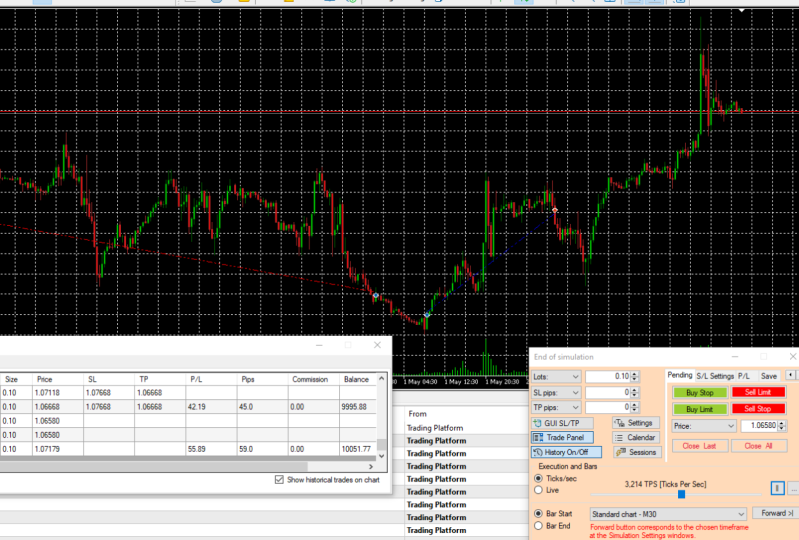
5. Forex Orders in Practice: In this lesson, I want
to show you how the different order types Luke, in a real trading environment. And by real trading environment, I mean a simulated
trading environment. So as you can see
here, we have a chart. It's the Australian
dollar, Japanese Yen. And I can click Play, see how the chart performs, and then pause it anytime
I want or if I want, I can just skip it
ahead 1 bar at a time. So here we have a chart. This pink line here, It's a slow moving average. I believe it's a 200
period moving average. And this is a
technical indicator. I'll introduce you to these indicators in
future sessions. And the red line, it's 15
period moving average. For now this is not important. What I want to show you
is the order types. So we have a chart pattern
that seems to be going down and it may actually bounce
from this moving average. So what I want to do is I want
to buy it at this moment, by it at market value. So I would just click on Buy. And what happens
to this green line represents my BY order. So instantly I will enter this position and I
will hold currency. So let's play and see
where the price goes. So after the initial drop, the price actually went
in a good direction. So what I'm going to do
is I'm going to terminate this position with
a small profit. Okay. I have just closed it
and as you can see, we bought it here,
closed it here. In a live trading environment.
You will not see this. This is part of the plugin
that I'm using so that I can play around with past data and sit and test
different strategies. So this was a market order. Now let's say, let's just
play it a little bit. Okay, We can see that the
price has started to go down. So I want to place a sell
order at market price. And again, we see
this line here, so it represents my Excel order. Let's see what
happens to the price. Okay, it went completely,
completely against me. So let me just close it. And that was a sell order. Here. We see that it
didn't go in our way, so we would have lost money. Let me just actually
skipped ahead a little bit to see something a
little bit different. Okay, we have a chart pattern here and it seems
to be trading up. So now I'm going to
do a buy limit order. So what I mean by, by limit is I expect the price to go
up and I want to buy, but I don't want to
buy at this level. I want to buy at a lower
level, something here, e.g. and this level, it's actually 17 pips away from the
current market price. So I will click on
here on pending order. And I will select the number of pips away from the current
market price at 17, and I will click on Buy limit. So as you can see here, it has created a pending order below the current market price. This is like by limit order. Now, let's see if
this works at all. Okay, It has entered below. And if we look at traits, we have currently
one open position and here's the Profit
and Loss of this trade. This is a simulation, but it would be nice if
it went up a little bit. Perfect. Okay, I'll pause it right there we see
this current profit here. This was a great example
of a buy limit order. Price was here we wanted
to enter it here, we set up the order here. When the price fell, it triggers this pending order, entered our position and
then the price went up. So let's close this
position at a profit. So this was a byte limit order. Now I'm going to show
you a sell limit order. So e.g. a. Sell limit order occurs when
obviously we want to sell, but we want to sell
at a better price. So current prices here. But we want to sell it at, let's say this level. So let's say we want to enter a sell order at 14 pips away. So I'll send setup
the distance at 14 pips and I'll create
a sell limit order. So it's appending order. If the price touches this
point, it will sell. Let's see what happens.
Okay, this time didn't work, the price just fell down. However, I still want
to use this example and show you what a sell
limit order looks like. So I'm going to modify the current order and I'm
going to set it up here. So the price is here. If it reaches this area here, it will trigger my cell order. So currently you can
see here we have a sell limit order in place.
Let's see what happens. Okay, the order, it changed. So when it reached my level, it triggers the order. And now we are in
a cell positions, we are in a short position. Okay, little problem here. We entered the cell position and then the price went
up, doesn't matter. But the whole purpose
of this exercise is to show you what
the traits look like. I'll just move the price
along a little bit. Here's another example,
prices going up. And let's say this time I want
to enter a buy stop order. So a buy stop order is I am entering the order above
the current price. I will set up my
bicep order here, which is 12th pips away by stop. And what I'm anticipating, what will happen is that
the price will go up. I will enter it here, and there will be another, say, massive breakout and
the price will go up again. Let's see if this works out. This by stop order. If you rewind the
video a little bit, this was a buy stop order. It hits this area, it entered my trained, and now I am in a byte position. I'll pause it here, and
this is a great example. So I anticipated a little bit of a breakout at this level. And what happened with
splits triggered disorder. There was a bit of
a pull back and then the price went up again. So I would be in profit. That was an example
of a buy stop order. And this one would
have been profitable. And now, although there is a strong uptrend in
this chart pattern, what I want to show you is an example of a sell stop order. Let's assume that I think the
price is going to go down, but only if it
breaks through, say, this zone here, I'm going to sell setup a sell stop order, 26 pips away from
the current price. I think there's a bit of
price action going on here. Perhaps this is some
sort of support. If it gets broken, then the price will go down. So 26 pips away, I'm going to click on cell stop. And here's my pending
order myself stop order. And here you can also see
that type is cell stop. Now let's play and see
how this plays out. There's a massive
uptrend going on here and something
has happened here. What I'm going to do, I think, I still think this
is a great example. I will just modify disorder. So this is the new zone. If the price drops to
here, it will enter, it will trigger my
cell order and then I anticipate the price to
go down even further. Finally, it fell and this sell
stop order got triggered. Now I am in a cell position. How many purposes?
That's 35 pips. Let's say I want to close it. And this one was profitable. So that was the
three main types. So what I just showed you in this video was the market order. The order is executed immediately whether you
are buying or selling. Then we have the bias top
or the sell stop order. And by limit and a
sell limit order. I hope this clears out the theory that I presented
in my previous lesson. And now that you know how
the orders actually work, do not worry if this is new, it takes time to learn. And when you actually login to your own demo platform and start setting up these
types of orders. They will become
second nature to you. Thanks for watching
and let's move on.
6. How to Calculate Position Size: In this lesson, I
want to go over the easiest way for you to
calculate your position size. The reason you need to know what size you are
buying is because you are using leverage and buying orders with
borrowed money. If you enter a position size too big and the trade
goes against you, you are at a risk of
blowing your account. Before entering any trade. You need to know the
trade size or lot size or position
size, let's call it. All of these refers
to the same thing. And to calculate the lot size, you need to know the following. The currency pair
you're trading, your account size,
the risk ratio. So how much of your account
Are you willing to risk? The stop-loss level? So at what price will
you exit the trait? This will be your stop-loss. And you can calculate this by how many pips away it is
from your entry price. And you need to know
your trade size. So how much lots are
you actually buying? Do not worry as I'm not diving into a mathematical calculation. For this, there is
an easier method. Just go to this website
and fill in the blanks. Quite literally. I'll show you that right now. Here we are on the website
and it's literally the easiest way that I know of how you can calculate
your position. So you start off by selecting
the relevant currency pair. Then specify your
main account currency and the account size. So let's say we have one account and a
$1,000 in that account. And we want to risk $10, which is the risk ratio
of one 1% of our account. Then specify the stop-loss level or how many pips away your
stop-loss level will be. You will calculate the number of pips by reviewing your charts. So you will use metadata for, for this, for the trade size. Let's leave it at one in lots. You can change it to
units if you want, depending on your broker, and then click on Calculate. So here we see that
we are risking $10. Here's how many
units we are buying, and here's the size of
the order, 0.07 lots. So this is the one, this is the figure that
you will plug into metal trader for to
complete your order. Why make life difficult when
calculating a position size, it is really so easy as
just filling in the blanks. Let's continue to
the next lesson.
7. The Strategy for Entering Trades: In the previous lesson, you learned how to calculate position sizes for your traits. Now I want to show
you what you need to decide before
entering the trait. It is not enough just to
open an entry position. Each trade you take requires
at least another trait. Can you think of what
I am referring to? As you're using leverage for your trades and
you need to put up some of your account balance as margin to open up position, you need to protect
your balance. So you do this with
a stop-loss order. Thereby, you protect your
account balance with a maximum you will lose if
the trade goes against you. So you have an entry position. And I stop-loss order. As you're starting out, I
suggest you take a step further and set an additional
take profit order. Price fluctuations are
unpredictable and as simple news announcement can
make the price go crazy. That's why it's important to
secure yourself and plan out what a profitable and losing
trade actually looks like. So I cannot stress this enough, but you should always
use the stop-loss because there is two greater
risk of blown your account. Leverage trading is
nice, but it is risky. Stop-loss is the safeguard. Many advice that you
should never risk more than 2% of
your account size. When deciding that take
profit and stop-loss levels, you should calculate how many
pips apart this will be. Here's how this
looks in practice. Here I am in metro either for, and currently I have
the British pound, US dollar charts pulled up and I am using the 15-minute charts. So I can see that it's making, the price is making higher
highs, higher lows. It looks to be going upwards. So let's say I want to enter a market order and I
want to buy right now, the current price is here. The stop-loss. I want to set
it below the previous low. So I will set it at this level actually to make
it a little bit easier. Here's my stop-loss level. And the take profit. I'm also going to set this up. So I'll set it a
roundabout here. So from the current price, I have a stop-loss
at 48 pips away, and my take profit
will be 70 pips away. So I go here, I
click on New Order, and I make sure that
the symbol selected is the British pound, US dollar. Here I specify the lot size, so I'll make it a small
order, 0.01 volume. So the stop-loss will be me, just fill it in 1.20 060. Take profit will be 1.2 1239. And to show this to you, I'll delete these lines. Everything is set up, so I am going to buy, okay, I've entered that trade. This green line here shows the current price
that I entered. As you can see here, you can see it by and
the size of the order. This order here, It's my stop-loss order,
it's appending order. And when I hover
my mouse over it, I will see that the
potential profit at this stop-loss, I mean, sorry, the loss I will make
at this level will be $7.41. And it even shows me
that it's 50 pips away. This metal trader on one that it's showing me the micro pips. So I just divide it by
ten and I get pips. So 506 micro pips, or 50 pips away. Now this order here at the top, it's my take profit order. And again, it is a
pending order that will be hit if the price
reaches this level. So we chose me again that
the potential profit will be $9.85 and it's 67 pips away. And if we go over
here to the bottom, we can see the current
order that I've placed. And currently I'm at -40, $0.04. However, we already see here, this is my stop-loss, which has already
been set up and a take profit which
has also been set up. In a live trading environment. What you can do is you
can move these traits. Let's say I want to change
the stop-loss to below. Here. I've changed it. So this will be the
new stop-loss level. So here I will only lose $3.42. Similarly, if I want to adjust the take profit order,
I can just move it. And now this has been
set up differently. Alternatively, if
I want to exited, I just click on the cross and now the order has been exited. So I sold it at a loss and
then I go to account history. And I can see that on
this particular trait, I'd lost $0.35. Now I'm going to show you
another way that you can open a order and then later
setup a stop-loss. So just actually just quickly. So again, newOrder market execution and I'm
just going to buy. So this is the level
that I have bought. Now to set a stop-loss.
Here's what I can do. I just clicked and
dragged it over here. And it automatically
set up a stop-loss. And at this level I
would be losing $6.92. Okay? So I'll go to trade. I will exit this trade. That's what I wanted to
show you in this video. I would say that the best
way to start trading is to make sure that you
control all elements. Price fluctuations are
really unpredictable. So with a trade
goes against you, It's good to have a
stop-loss in place as a security so that you limit the amount of money you
can potentially lose.
8. Forex Platform Intro: Welcome to the next lesson and actually welcome
to mete trader for which I have already
called the control module for all of your
Forex operations, I think this is the best tool because it's the easiest tool, although it looks a
little bit difficult, especially the first
time you login. Once you login a couple of
times and use the platform, it's actually very, very simple. I have already
configured my charts. I like the white
background charts with green and red candles. Other people like
something different. But actually, this is
what you are going to see when you open it up. This is the custom
default in there. This is the default settings. And personally I
do not like this. So what I do is I go to properties and I
format the chart. And I've already created
a template that I like to use, triple EMA, but let me just remove these indicators so that you can see the basic charts that
I like to play with. I think this is the
traditional white background, green and red candles. Now, when it comes to forex, what you need to do
is you need to decide what time-frame do
you want to try that. So if you want the
long-term game, you can use for our charts,
perhaps daily charts. The advantages of trading
or even 1 h lead charts. And the advantages of trading these timeframes are
that the charts, they're actually a lot cleaner. It's much easier to
notice certain patterns and even the indicators that
I will show you how to use, the indicators, they are more accurate on a longer timeframe. But a lot of people, they have more time
so they can actually go and try the 15-minute charts. This chart, the euro New
Zealand dollars, 15 min, actually looks
quite nice because there are patterns forming,
there are transforming. And this looks very,
very tradeable, but sometimes depending on the time of the year and
depending on the currency, 15-minute charts,
five-minute charts there, they just look like a big mess. So 1 h and for our arbitrary, but it all depends on
your trading style. So you will have to decide how many hours you spend
in front of a computer, how many signals you
want to see per day, and then decide on the ideal time frame
for your trading style. Let me go over a couple
of principles that I covered in the first
section of this course. Firstly, I will go to symbols. And here's what I
want to show you. Depending on your broker, you will see different
types of settings. Sometimes you will
see major currencies, minor currencies, and
cross currencies. However, I'm using the
one, the demo account, and it's pretty much, I have a full list of currencies
under these categories. But basically it
works like this. Yeah, they, they
are mixed up here, but basically major
currencies are the most popular
currencies that are trading against the US dollar. Minor currencies are
less popular currencies that some trade with you as though some trade
between each other. And then the cross currencies, they are the currencies that
are not popular like e.g. check corona trading
with the police latae, there will be a cross currency. But what you have to do is they a lot of these currencies
that are grayed out. So you will have to
double-click on them. Select the ones that
you want to trade. And then we can close this and then they will appear here. And then what you do is
you open a chart window, you will get the black
themed chart settings. Then you can, you can
create a template, load the template that
works best for you. Here's another template
that I've created. Next, what I will show
you is over here, this is a demo account and
you can see the balance of my trading account
and the free margin. Now when I want to
open a new trait, I click on new trade. And let's say I want
to buy at this level. Here's the volume 0.01 and I'm trading the Australian
dollar, Japanese yen. I will not set a stop-loss here. I'll take pleural
fluid. I'm just going to create a buy order. I click on it. And this green line
represents my entry-level. And here you can see that
the balance is $1,733. Free margin has lowered because margin of $50 is used for
this particular trait. So this is the margin, this is the money
that I put up from my very own balance so that
my broker can make the trade. And I believe to leverage that
I'm using in this account is probably about
one to 20 as well. Now, if I want to
add a stop-loss, actually I can just
click and drag it below the moving averages. And now I have a stop-loss placed 53 pips away
from my entry price. Now you will see, again, depending on your broker, sometimes this will
be displayed in pips. Other times in many pips, here I have 530, it's in many pips. So I just divide by ten
and I see that 53 pips. That's how far away
my stop-loss is set. And if the price goes down
and hits my stop-loss, then I would lose $6.17. But I will actually close this trait because it's
just a quick example. Okay, next, because this section will be focused on indicators, I will show you some strategies, how you can use
different indicators or different price patterns. If you do want to, like, I've added three moving averages here to add the
indicators I could hear. And the moving average
is a trend indicator. So I would just click on it
and then it would be added. So then I can customize
this moving average, whatever I see fit, and then apply it to the chart. This is the platform. Hopefully you have already set this platform up on
your own computer. In the next lesson, I want to
actually dive a little bit deeper and introduce you more
to the types of indicators. So I'll see you in that lesson.
9. Trendlines for Trading: Welcome back. In this lesson, I want to talk
about trend lines. And trend lines are lines
that show you zones at which there's a huge chance that the price will reverse. So it's very relevant
to what swing trading, and it's also relevant to
figuring out the trend, hence the name trend lines. I'll show you how
to analyse a chart and you may be surprised
by the results. Now, this is a normal chart
of the British pound, US dollar, and 15 min. Of course, trend lines do
apply to 15 min charts. However, because of the
fluctuations in price, I think it's better to analyse trend lines over
I hire time zone. In this case, for an example, I will use the for our charts. So this is how we figure
out the trend lines. Basically, we draw
the trend line, click the button, and let's
connect a couple of bottoms. And we can also
connect the tops. Let's make it fit a
little bit better. And actually, I think
this is actually a random chart that I just popped up when I
loaded the wonder. And I think it's a really
good example of trend lines. Here's the thing, especially
the top trend line. What we see here
is that the price bounced from the
bottom to the top of the trend line then
binds to the bottom, to the top, to the bottom. And then what happened here? Actually, I can draw another
trend line like this. And as you can see,
the price goes up, bounces to the bottom, bounces through, top,
bounces to the bottom. And basically the way that
you trade with trend lines, while there are lots of
different variations. But the theory goes like this. Once the price reaches this top, there's a high chance of
a reversal happening. So you can place a
short order to sell. And then when the price
reaches the bottom, there's a chance that again, it will reverse, so
it's time to buy. So that is the first version of trending trading
with trend lines. The other theory is that
if a trend line is broken, then the chances are
the trend has been broken and it's time to change. So in this case,
the trend line gets broken and instead
of going up again, it started slowly going down. Then we have this trend line, which I would say it is a
trend line because we've got 1234 bounces here. You could say there was
a fake-out attempt. Okay. We are to the
current time periods, but let's move back in time. And maybe I can show you
another example of trend lines. Actually there are plenty of
examples right over here. So I'll select the trend line, can draw on here. And here. Now, what happens with
trend lines is that sometimes they're parallel in the same direction at a time. They can be opening like they can be expending
trend lines, or in this case, slightly
decreasing trend lines. But the theory is that
if you figure out that, okay, you figure out
there's a point here, a point here, point
here, point here, draw your trend
line, then you can predict where the price
is going to bounce. So here, if you
draw it like this, you've got the bounds here, bounds here, and a couple of more bounces
before it breaks. And when the train
line actually broke, it started forming going up. And you will find
it hard to believe, but we can draw another channel. So another two trend lines here. So we jumped from, we have two highs here,
two bottoms here. We draw the trend lines. And as you can see,
the price moved. Maybe it didn't go exactly 1212 bouncing from
top to bottom. It's trade within this
channel, within this channel. And this is another
great example here. When the price broke
through the trend line, it came back to the trend
line and this trend line. So here the trend line
was I support zone and the price always bounced away
when it hit the trend line. But once it broke
through the trend line, then the trend line
became a resistance zone. So it hits here and
then it came back down. And I'm willing to bet that we could draw some sort of
new trend lines here. And then as you can see, price is trading within
this trend lines. Okay, I think I'll
zoom out a little bit. Okay, this is for our charts, but as you can see,
the price was, I mean, the price, it was like a pattern and
it was going down, up, down, up, and mostly it was trading
within these trend lines. Could even go to daily charts. Here again, I can see
the same pattern. You can actually draw
it quite clearly here. So we feed the price was
trading within these zones. Now, if I zoom in a
little bit, yeah, I think that's I mean,
considering that it took me 2 s to draw the trend lines, it's a pretty good
indication of the trend and a pretty good
indication of where the potential swing zones are, where the potential
bounces will occur, then if there is a
actual breakout, that is a good signal, that there could be
a turnoff events and trend could
start to go down. And actually over
here, look at this. This is just absolutely amazing how many of
these points, I mean, it's not a coincidence,
but you can literally, I mean, this is a
textbook example. It broke through this channel. The trends changed from an
uptrend to a downtrend. And then if you look at it, we just have a series
of bounces exactly off all of these trend
lines until it gets broken. When it gets broken. Well, there was another I mean, there wasn't a change of
direction to an uptrend, but there was a change in
the pace of the downtrend, So it started going
down more rapidly. So essentially, you can draw trend lines on any
level that you want. But 1 h for hour
and daily charts, you'll get the most exact trend
lines because the charts, they look the neatest. If we go to 15 min charts, actually this chart
looks quite good. But sometimes what
you will find, the chart just fluctuate way
too much in the trend lines, they look really, really bad. The principles that
I've showed you here, they apply to all timeframes. But I'm just saying
that it's clearer to see these trend lines in say, 1 h for hour and daily charts. And the way that you can
trade them is you can use trend lines as one tool
for your trading strategy. Of course, what you
can also do is you can combine a trend line with an indicator to get you a
second confirmation, okay? Is the price going to
go up from this point? So what you could do
potentially is you could even use relative
strength index, e.g. and then see if, if
the price coordinates, so if the price is
at the bottom here, is that at the bottom of the
relative strength index, is there a chance
of it reversing? But the focus of this
lesson is on trend lines. And I wanted to show
you how the price moves and how easily you can actually draw
these trend lines. And you can use it as a tool
to enhance your training. Okay, Thanks for
watching. Let's move on.
10. Support and Resistance Zones: Welcome to another lesson of technical analysis of
your Forex charts. In this lesson, I
want to focus on support and resistance zones. And by the end of this lesson, hopefully I'm going to show you something which you
may think is quite odd and actually quite predictable when it
comes to price charts. Support and resistance works
on all of the timeframes. However, I find that because of the fluctuations
that happened in price, It's better to take
a higher timeframe, like 1 h or four hour. And I think this will be
the best way for me to show you support and
resistance zones. I'll just format this line. So the yellow line looks good. And actually I placed
it here tactically for a good reason because
I think this is a good support slash
resistance zone. And the second one I will
place right about here. Well, let's start
with resistance. Price was going up. It hits this zone over here. And then rebound, tried
to hit this ONE again, rebounded here again,
and here again, we have four touches
of this zone. And it never broke
through this zone. Because we have these clusters of price action at these levels, there are resistance
on the price does not want to break through
and go further up. Now let's examine
the support zones. From here, the price fell, bounced off this level
and fell over here, bounced off this level again. And we could argue that there
was a bounce here as well. So there are three touches here. It didn't want to
go further down. Therefore, this is
a support zone. And I've drawn the
top-level resistance, bottom level support. And as you can see, the price is nicely trading
within this channel. You can use this to
figure out when to enter. You enter during the,
when the price is at the bottom or when to sell, you sell when the
prices at the top. Another thing that I
will show you here, this one over here, the price cluster through,
didn't break through. This was a resistance zone. Price came back down, came back up, broke through. And when the price breaks
through a TKI resistance zone, then the resistance
becomes a support zone. And then as you can see here, it was a resistance
zone over here, and then it became
a support zone after the price broke through. Let's move back a little
and maybe I can find you another example of
support and resistance. And I think I've just
spotted something. Actually. I think this looks quite well. What I could even do. Move this like this. And I think I have
good examples here. The price was going down and
it bounced off the zone. Bounced off this
song, came back down. And then finally, it broke
through the support. When it broke
through the support, it found another support level, which was over here. Then when it went back up, the previous support
was a resistance. And when we look at the price
charts, it actually is. This example is really good because you can
see that the price, it's trading within
these channels, within the support and
resistance channels. And you can actually
predict where there is a high chance of the price
actually bouncing through. Or here the price went
down a little bit further. It was like a fake-out. So you would have thought that maybe it would
go down further, but now it's picked
herself up and then start to trading within
the channels again. But then when it broke
through the resistance than the resistance
became the support and the price
started trading up. And the thing is, you can spot support and resistance zones
on pretty much any chart, any currency pair whatsoever. The only thing that I would
suggest is that you use the high timeframe
because it will be a little bit more accurate. Let's go. Okay. So this was the one-hour
let me just clear my chart and I will
change to a daily chart. Examining this, I
I think we have a zone here because you can see there are
plenty of touches here. So this is a resistance
area and other touch here. And I think there is one here. Move this down a little bit. And I think there's
probably one here as well. But as you can see, there was a touch here, attached here, attached here. And then finally
it broke through. There was a touch
here and attach here. And then here's an interesting
situation because when the price broke through
this support level, it fell down to a
previous support level. Now I will move the chart, not exactly sure
what will happen, but I think this
is a good example. This support level over here. It was more or less the
support and resistance. You're never going to
know exactly these, these are like zones. So actually another
way that you could, you could portray these zones
is something like this. It's not totally accurate, but it does give you an
indication where there is a potential for the
price to bounce. This support zone, I'd say it was pretty good because
we have a bounce here. Perhaps we could move
it a little bit here, adjusted, but we do have a
bounce here, bounds here. And this support zone, that once the price
broke through, it became a resistance zone. It's actually, it was
adjusted a little bit. But the price kept
on trading within these two zones and was
bouncing off from this zone. They didn't want to penetrate
the Zona, go any higher. This is a quick video I wanted to share with you a
different strategy. Some people, they use
this all the time. But I definitely
think you should be aware of this because support and resistance
zones are real. And they serve as
a tool which you can use to analyse the market. Thank you for watching.
Let's move on.
11. Forex Trend Indicators: Hello again, Tom.
Here in this lesson, I want to go through a couple
of the indicators that you can use to develop
your own trading strategy. I click on this button here. Now I can add all sorts
of different indicators. I've selected trend. And I think I will start
with moving average. So I will set up a 50 period
exponential moving average. This just means the
way the moving average is actually computed. So there are a couple
of ways I always use either simple
or exponential, but you can play around and try different moving
average parameters, and I can add it. So this is the first indicator, and this is a trend indicator. And by trend indicator, it's supposed to show
you when the price is going to trend up and when the price is
going to trend down. So how does it show you this? Well, this is like, you could say it's a baseline. And when the price
breaks through, Moving Average,
there is a chance that it's going to
continue upwards. So here we sold
breakthrough and fail. But then here it broke through, broke through this indicator, and then was trending up
for how many 208 pips? Remember from the
previous lesson, I have 2087 here because
that's showing me mini pips. So I divided by ten
and I have the pips. So 208 pips. Then we have the price. It broke through
the moving average, tested it out as other resistance area
didn't break through. It's completely again because
it quickly fell back down. And then it started
trending downwards for another 207 pips. So if we entered it here, it would have been a really,
really profitable trade. And then here's another example where the moving average good broken and the price went
up for a further 208 pips. So this is a moving average
and it's actually really effective when the
market is trending. Let's go back in time. I can show you another example. Okay, I think I have found something which will
be quite interesting. Something that will be quite
interesting over here. Okay, that's a really,
really ugly color. I'll just make it
something that's just more friendly to the eye, a little bit too friendly. Okay, That's better.
Ignoring this, we see here the price was above the moving average and
it was trending up. So this was a trending market and everything was okay here. However here, the price, the price will sort of
in a consolidation, it will just moving up
and down, up and down. And as you can see, the moving average, it
didn't predict anything. It was just being
broken all the time. This is the weakness of the
moving average indicator. If it is a consolidation market, well, the moving average will give you a lot of fake symbols. So the trick is you
have to figure out when it's going to be
a trending market. And that's when you enter it. So any type of trends? Over here, we have
another consolidation. By consolidation, I mean, prices just going nowhere. It's just moving up
and down, up and down. And for this moving
average is useless. But if we go to for our charts, and you can see whenever
there is a trend in place, moving average gives
you good, good signals. So this is, I think
I'll remove this. This is the moving average. It's a trend indicator. We have other trend indicators. Another one is known
as Bollinger Bands. And this is based on
the moving average. It will give you three lines. I'll format it so that it
looks a little bit better. The basis of the
Bollinger Bands is we have the moving
average and we have the average directional
movement that determines the upper band and the lower band and the price, it's supposedly bounces
within these bands. So the theory is if the price goes to the
bottom of a band, it's a chance to enter because the price
is going to go up. If the price goes to
the top of the band, it's a chance to sell because the price is
going to take a turn. So it's another type of trend indicator sometimes
can be useful personally, I don't like this indicator. It gives a lot of fake symbols. However, it could be a good
indicator that you can use to place your
stop-loss zones. And I'll show you
another trend indicator but for a different chart. Okay, Let's use the
euro check Corona. I'll open the chart window. And the indicator
which I will add, it's a custom indicator. It's called the super trend. Blue will be much more visible. And the way this works is
that it's a trend indicator. And when you see the red line, it's a chance to
sell because there's a high chance the price is
going to start trending down. When the color of the
line changes to blue, it's the time to buy because the price is going
to be trending up. So as you can see here, little bit of a movement here, but it was giving us
signals to buy here. This was a nice movement. It was a chance to sell. Color changed here. It was a chance to buy. It's a trend indicator. So it works best when
the price is trending. In a consolidation may give you a couple
of goods signals, but it's best used in
combination with an oscillator. In that case. One thing that you
could even do is you could add a moving average, which I showed you earlier. Let's say I hundred 50
period moving average. You could use this to determine the direction of the trend. E.g. if the price is
below the moving average, then it's a downtrend. And in a downturn, you would
take all of the red signals. So this would have
been a good signal. You would sell here, would have been a good signal, and you would sell here. What you need to do
in your own time, you do have some homework
is you have to check out all of the trend indicators
to see how they work, but also you can import
your own indicators. So I imported something
known as the super trend. This indicator is quite useful. They indicators
are actually very easy to find because all you do is you type in MT four
indicators in Google. And you will get tons
of resources where you can download these
indicators for free.
12. The Oscillators and when to use them: Welcome back. In this lesson, I want to talk about the next type
of indicators, and these are the oscillators. So you have a whole list of
different oscillators here. And basically, let's do the relative
strength index first. Actually, I will just adjust it so it's a little bit
more presentable. Yeah, that's pretty visible. So the way it works is
you have two zones. The tertiary level, you
have an oversold level. And this can be 30, can be 25, can be 20. However, you decide
to customize it. But it's an oversold level. So basically, the
way it works is that once the price
goes below this, then expect a reversal. That the price is
going to go back up because it's over salts, so it's a time to buy. So if we bought here, we would have been profitable. Let's see, the next
breakthrough happened here. Here. So if we bought
around this level, wouldn't have been great, but the price sort
of bounced up. Now we have the 70 level, which is the oversold level. So it can be 70, 75, 80 depending on the price chart and depending how
you customize it. So basically, when
the price goes above or touches this line
or crosses this line, it's in over bought territory. And it means it's time to sell. Here. It was the RSI
was touching the line, so it was a time to sell. So if we did cell here, we would have been profitable. Next time it touched
the line here and here. Well, if we enter on
the bird this level, the price did fall down. The thing with oscillators
is that they work really, really great in a
consolidation market. So if you have the
price which is moving from between two
particular zones, it's not trending anywhere, it's in a consolidation, then these oscillators, they
actually work quite fine. When the market is not trending, then trend indicators
do not work, but oscillators do work. However, when the market starts trending will then turn
into educators work. But the oscillators, they
fall apart completely. Probably there wasn't enough
movement here for trading. So when the line, when the oocyte line is
just between the lines, just forget about trading because the price
is going nowhere. And then the price
started trending. And here's actually
a good example where this indicator
falls apart. In that here we had a
touch of the indicator. So a brief crossover, it could have been a
chance to buy, buy. The thing is market was
trending downwards. So it would have been a lot. Actually, let me rewind this. Okay, here's a good example. The indicator crossed below
the poverty level line here, given us an entry point, say roundabout here or here. Now if we hit Enter, we would have made
a lot of many, many pips profit and would
have been a good trait. Then the market starts
to trending downwards. And we got a signal
here to enter. It was a fake signal,
we would have lost. But then the second signal
to enter, we got here. And if we entered it again, we would've been
quite profitable. So this is the RSI. Let me show you
another oscillator. The stochastic oscillator, actually not my
favorite oscillator. And I don't use it, but I think you should
be aware of it. I'll just adjust
this to make it a little bit more user-friendly. So in this indicator you have an overboard zone and
an oversold zone. So basically, when the
line crosses below, it means it's overboard. And then when
there's a crossover between the two lines here, it's a chance to, in this particular case, to buy. So if you bought here
would have been, would not have been
a brilliant trade, especially since it
immediately had a pullback. And then when the
line goes above the 80 level and
there's a crossover, it means it's a chance to sell. But as you can see
here would have been a bad chance to cell. Here would have been, well, not brilliant as well, depends on your stop-loss. Here actually would have been a excellent opportunity to sell because you would
have made a lot of profit. But the thing that
you can do with this particular indicator is you can play around
with the parameters. So I will just set it up a little bit longer
time periods. And now the indicator, it looks a little bit better because it doesn't have
so many movements. Now I could tweak
it even further. And I suggest that you do. Follow a longer timeframe, it actually looks much better. I don't like where there are too many oscillations because
it's not too much clearer. But this is an
indicator that it works really well in a
consolidation market. So we would have a nice
dice entry signal here. We would have another
nice entry signal here, clear as well,
depending on where you would place your stop-loss, there was a good prediction. Here we got a sell signal which
price kept continuing up, but the second cell signal
was actually quite good. So as you can see,
based on this chart, I slightly adjusted the settings for the stochastic oscillator. And now it looks a
little bit much nicer. And I would say the
signal that it gives you a more dependable. But on its own, I wouldn't use this signal if
you're planning to use it, it's best to combine it
with another signal. So e.g. you use this as your
primary signal and then you have another indicator which is your secondary confirmation, which hopefully will
keep you out of trades like like this one, e.g. where the price kept on
going up, kept on going up. And maybe the second
confirmation would say, okay, it's time to sell here. When you're setting
up these types of charts and using
technical analysis, it's best to actually combine
the indicators to figure out a combination of a trending
indicator on oscillator. The combination that works best for you that
you're comfortable using and gives you
the greater chances of success when you are trading. And I will show you another
popular oscillator. It's called MAC D or MACD, and it's actually stands for moving average
convergence divergence. And this is the default mark, the indicator, but I think
I have another one here. I don't have the indicator here. So what I'll do is I'll pause the video and I
will download it. Welcome back. So
I downloaded it, added it to the metric for indicator folder and
refresh my indicators. So now it is available
in my platform. And this one looks much better. So I'll delete this indicator. This one I'll delete as well. And this one I will format so
that it's a little bit more user-friendly or
friendly to the eyes. So this is the moving average convergence
divergence indicator. And the way that it works is when the two lines crossover, it's a time to enter a position. So if the lines cross-over
below the middle line, you have a zero line here. It was a crossover
below the zero line. It's a chance to
enter to go long. And as you can see,
this indicator would have been good over here. Now when the lines cross-over
above the zero line, it means it's a chance to
go short and to sell here. It would not have worked for us. But the crossover here was actually quite
decent and we would, if we caught this trait, we would have made
a nice profit. Then we have another
crossover here, which means we would have
traded very, very nicely. So again, this is an oscillator and basically you
have a zero line. So if it crosses
below the zero line, it's a chance to enter. If it crosses above
the zero line, it's a chance to sell works very good In
consolidation markets. Here we have a
downtrend in market. And the signals were again,
actually quite solid. So one of the strategies
that you could adjust this, that you could just
wait for this, for the crossover to happen, even if it's actually
a trending market. Here's a cell signal. At first it wasn't
all that great, but then we get another
cell signal here. Eventually it went to our favor. Now there was a turn
of tides, I would say. And we have a buy signal here. Let's see what would have
happened if we bought it here. So it was a fake signal
and we would have lost. But one thing that
you could do is, well actually what I
highly recommend is you never use one
indicator on its own. You need to use
another indicator. Now the MCC D, it
is an oscillator. So what you can do to
determine the trend e.g. is again, you could
add a moving average. Basically, if the price is
below the moving average, it means it's a downtrend. So the market is trending
and you could take all of the cells signals
using an oscillator. So in this particular example, here you have a sell signal. Here you have
another cell signal, Here's another cell signal, Here's another cell signal. So because the price is
below the moving average, you know, it's a downtrend. So you just ignore all the buy signals that you get and you get quite
a few bicycles here, just take the cell signals. And that's another
strategy that you could test out and see perhaps
it works for you.
13. Where to Next: Congratulations for making it
to the end of this course, we covered a lot of content, but now you are ready to
start on your forex journey. I suggest you use
your demo account first to get familiar
with trading and forming a strategy
that you can follow consistently. Now where to next? Even join my YouTube channel. It's full of strategies
and forex tips that will help you along the way
of becoming a forex trader. I've also included this link in the resources section
of this course. In my channel, I've
uploaded a number of fork strategy testing videos, and I highly recommend that you watch them
because you'll get more insights into the
reality of trading forex and what to expect in terms of returns from certain strategies. And don't forget to subscribe
to my YouTube channel. This way you'll get access
to my latest tutorials. I hope you enjoyed this course, but now it is time for you to put this knowledge
into practice. I wish you all the
best in your trading.
 Tom Wiztek, Marketing and Recruitment Specialist