Transcripts
1. Introduction: Hi, and welcome to this
course diagram and estimate Like a P with
Glot and row dot IO. I am David Armen Daris. I am an engineering lead
and a software architect, and I've spent years
running project kickofs where the hard part
wasn't the work itself. It was getting everyone
aligned on what we were actually building and
how long it will take. I'm also the founder
and CTO of Delta Witz, a software consultancy focused
on engineering excellence. In this class, you'll
learn how to use clot and draw IO together to go from a blank Canvas to a full architecture
diagram in minutes, and then turn that
architecture into a GAT chart with real
estimates and dependencies. We'll cover four things. Setting up Clots MCP
integration with draw IO prompting Clot to generate and refine
architecture diagrams, breaking your architecture
down into tasks and phases and generating and
validating a Gan chart. This class is built for project managers and
engineering leads. Anyone who needs to communicate complex systems clearly and
make credible estimates. You don't need any
coding experience, a clot account and Ratio, both of which are free
to get stattered. If you ever started a blank mirror board at
the start of a project, not knowing where to begin, this class is for you. Let's fix that and see
you in the first lesson.
2. How Claude works with Draw.io?: At my company Delta Wt, we have a client that
needs a trading web App. So we're going to use this
as the hands on scenario. The problem is stated like this. A retail chain needs
a web app where customers bring in used devices, the staff evaluates them, and the system manages
pricing and inventory. So we have four components here. We have a Frontend
where we have the customer portal and
the staff dashboard. We have the backend
services, authentication, evaluation engine, the
inventory management, and then we have
the database layer, which consists of
persistence stores for device records, pricing, and users, and we have
external integrations like a payment gateway or
a notification service. So what is the old way versus the new way
of doing things? Every hour spent
manually diagramming or estimating from Gut fill is
an hour not spent building. Today we have cloud and other AI tools in
order to build faster. So why not use these AI tools to also
diagram and estimate faster? So here's what changes
with this workflow. In the old way, we have
manual diagram Hours of dragon drop in the
new way we just prompt and the diagram
is rendered in minutes. In the old way, we
have estimates from gut feel and past
experience alone. In the new way Gantt chart are derived from real
architecture components. In the old way, we work everything when
architecture changes, but in a new way,
we can iterate with Glut instantly via
follow up prompt. So clot speaks
draw Dio natively. We have MCP, which stands
for model context protocol, which is the bridge
that lets clot write directly to
your draw Dio Canvas. You don't need any
copy pasting and no manual from a tin
because clot generates XML. So it can write a structure, draw XML instantly, and then it can render life this diagram. You just need to
describe what you need in plain language, and then you can
refine with Bond. Each iteration takes seconds, so you can stay in
the creative loop. Claude handles the markup
and the difficult part. I hope you like it. See
you in the next lesson.
3. Enabling Draw.io MCP: Okay, so now we're
going to enable the draw AO MCP connector. So that is very, very easy. Once you are in the
clot desktop app, you go here and
click on settings. Then you go to the connectors, and I have this
already configured. But let me remove it
and do it from scratch. Just click on this button
called at Custom Connector. You can name this
whatever you want, and then you have to put
the remote MCP server URL. And it's this one HTTPs
mcpw dot IO slash MCP. So this will let Clot access the MCP DRO and execute actions. So we add this,
and there you go. That's the only thing
you need to do in order to enable the MCP from IO.
4. Prompting Claude for the architecture diagram: Now that we have
the MCP enabled, we're going to start
with the first step. The first step is prompting
clot for a system diagram. So we're going to describe the trading system
in plain language, and clot will generate a layered architecture diagram
directly into your Canvas. Pro tip. Be specific
about the layers, the actors, and the data flows. The more structural
detail you give, the more accurate the output. So we can see this as
a series of steps. The first step is
to write a prompt. We're going to
describe the system, the components, the
users, the data flows. We're going to be as
accurate as possible. Then Cloud will
generate the diagram, and then we can refine it. So let's go to Cloud
and let's go here. And just for the sake of order, we're going to create
a new project. This project will be
called Trading Web App. What are you trying to achieve? An architecture diagram and
gant chart or a trade in web. Okay, great. So here, you can optionally add instructions on how
you want the AI to behave. You can add files to
put more context, but we don't need
too much context. We're going to do
this from scratch. So I will write the prompt here. I need to design a system
architecture diagram for a retail trade Webo. Please create a layer, create a layer
architectture diagram in drawdo with the following. So actors, the actors are
going to be the customer, which is an external actor, the store staff, which
is an internal actor. So these are the people
using our web app, right? And the layers. What
are the layers? Well, we're going to
have a front end, the customer portal,
the staff dashboard. Oh, I'm going to stop this. I am not done yet. Second, we're going to
have an API gateway. Which is going to be
a single entry point for all clients. We're going to have
some back end services, the AT service, the valuation engine,
the inventory service. We're going to
have a data layer. So POSCRS we're going to have
the PoscRs skull database, the read cache in case we need one and external integrations. So probably a payment
gateway, we want one, and some notification service, for example, email or SMS. Data flolows to show we want the customer going to
the customer portal, going to the API gateway, going to the valuation engine, and going to the
payment gateway. What else we want
to show the staff, going to the staff dashboard, which goes to the API Gateway, which goes to the
inventory service. The OT service sits between the API gateway
and all AACN services. Color to differentiate
each layer and group back in services. Inside a container labeled
internal services. So this prompt as well, you can use the help of AI
to generate this prompt. If you have more information, well, you put that
information here. If you don't know yet what are the things that
you're going to need, then you can use the help of AI. As this is a very,
very generic use case, then I used AI to generate
this prompt as well. Okay. So now let's remove
this and you can see right now that
Claude is already wanting to create the
diagram from draw dot IO. You can see it's already
trying to create that XML that I was mentioning. Let's click on always allow. As you can see, Claude is
already creating the diagram. So now we have an
interactive diagram where we have the actors, the customer external, the store staff,
which is an internal. So both go through this
front end layer where we have the customer portal
and staff dashboard, and all of these
make requests to the API gateway layer where we have the single entry
point for all clients. So the clients, in this case, will be the web app for the customer portal and the web app for the
staff dashboard. The back end, well, we have the internal services, which are the off service. So it can be JWT, JSON Lap token or O of 2.0, we have the valuation engine which gives the trade pricing, and we have the
inventory service, which is useful for
the stock management. And you can see also data layer, which has Posgrs as
the primary database, and a read cache for the sessions or any
other type of cache. And this valuation engine, as you can see, is connected
to the payment gateway. It can be stripe or
it can be brain tree. That depends, well, on the payment processors you have available in your country, and the inventory
service is connected, sorry to the
notification service. As you can see, the arrows
are a little bit messed up. But you have the option to
go to Open indo dot IO. So you open the ink and here you will be able to
edit this diagram manually. Right now, the diagrams
have these problems where the arrows specifically have these problems where you
have to move them manually, but that is after you
do the iteration. So I recommend you first
to do the iteration, and then you can move all of these arrows
so that they are not overlapped or maybe these things are better looking, you know. So all of those details can
be done after you iterate. That's exactly what
we are going to do next, the refined phase.
5. Refining the architecture: Okay, so we can refine now
without starting over. Each follow up prompt
applies one focus change, so you don't need any
rebuilding from scratch. Some examples at a component, at a fraud detection
service between the valuation engine and
the payment gateway. We can also say
reorganize the structure, group the backend
services inside a VPC container, and
we can also say, Hey, apply some styling, use some AWS icons for
the infrastructure layer. One prompt means
one focus change. This is the best practice. So keep prompts scoped so that it can produce cleaner and
more predictable results. Let's go to clot, and let's actually
do one of these. Add a fraud detection
service between the valuations engine
and the payment gateway. So let's go at a fraud
detection system between the valuation
engine and the what was it? The payment gateway and
the payment gateway. Okay. Let's see what clot
is going to do. So clot is going to
create a new diagram. So this is one of the limitations
right now with the MCP. It's not going to update. It doesn't have an
update diagram. It has a create diagram. We can also be sure if we go to settings, maybe this one. Here, you can see
in the connectors that it has create diagrams
and search shapes. So these are the only two
things that the NCP provides. So those are the tools
that the NCP has. So there is no update
diagram or delete diagram. I will create a new
diagram from scratch. That's why I told you in
the last lesson that, okay, do those rearranging of the arrows and all of those things once you are sure
about the final structure. So in this case, we have now the fraud
detection risk scoring. Okay. And yeah, this is
a little bit messed up. But again, you can
open this in Dryo and you can move this for
the final architecture. That's the only
thing that is going to take you some time. That's the only time
consuming task, making sure these
arrows basically don't overlap because
right now it is trying to do its best effort in having all the
diagram in one place. That's why the
arrows are overlap. And maybe the blocks as well. Okay, so the fraud
detection service has been added inside the internal
services container with three new connections. The valuation engine to the
fraud detection labeled risk check to the transaction is scored before any
payment is attempt. The fraud detection to the payment gateway labeled
approved only clears if the risk check passes and
the fraud detection to the notification service
alert TRO triggers an email, SMS alert when a
transaction is flagged. Okay. And it also says that the fraud detection
ulcerates from reads, which is typical for fast
look ups of blog lists, rate limits, and recent transaction history
during risk scoring. So this is how we iterate. I hope you like it.
Try doing the same. But for example,
recognizing the structure or applying styling and
see what the results are. But always keep in mind one
prompt, one focus change.
6. Extracting the task list: Now that you have your
architecture diagram, we're going to ask Claude
to read the architecture. So you don't catalog the
architecture manually, you ask Cloud to do it. One prompt will turn your
finished diagram into structural task list ready
to fit into the Gent. So what is the bridge prompt? It's saying, based on the
architecture diagram, we just build identify all the key components and
group them into build phases. For each phase, list
the main task and flat which tasks are
blocked by others. So it will output the
component inventory. So every service and
module from the diagram, it's going to have a phase task breakdown where
you have the discovery, the design, the build,
the Q, the launch. We're going to see if
Cloud is able to do that. And we're going to have
these dependency flux, which task can start
until others are done. So pro tip, this output becomes the direct input for your
lesson four Gant prompt, so no formatting is needed. But one thing to keep
in mind is that when we paste when we copy and paste
this prompt into clot, Clot will try to create
the diagram in drawiO. But I think drawiO is
not the tool to do this. So in Lasson four, we're going to compare it with another tool, which is called mermaid. But I already copy and
pasted that prompt here, and you can see it's trying
to do the diagram itself. One, phase two, phase
three, phase four, and the phase one
has Poscres setup, ready setup, service
API gateway, and then we have
the core services, the integrations
and the hardening. So this is what it generated
because it thought, Hey, I was doing diagrams. Probably we want
another diagram, which is a gant chart, right? But what we actually
want for Lesson four, I mean, if you are okay with
this chart, then go ahead. You can use it. But what
I want to use is this, the phase one, the phase two, the phase three,
and the phase four. So we're going to use another
prompt in order to generate this with a specified format in order to fit it to mermaid.
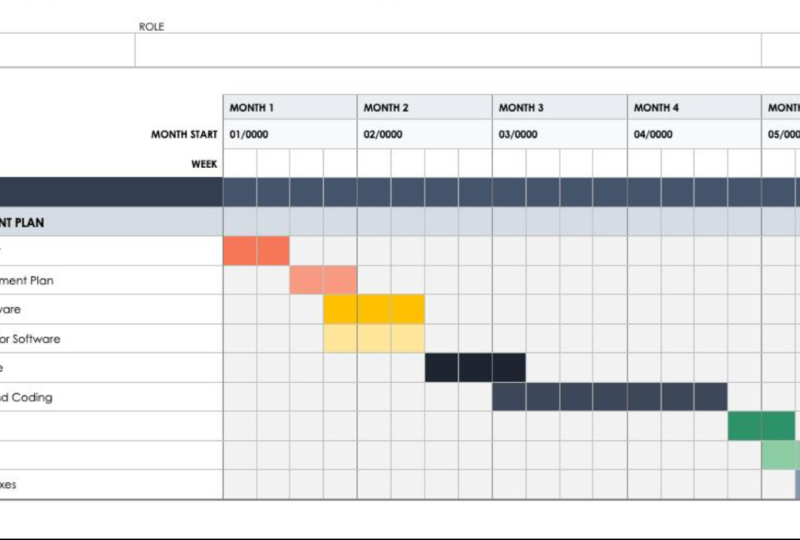
7. Creating the Gantt Chart: Great work so far. Now, we have a basic
Gantt chart diagram, but we want to make it better. So we're going to prompt
Clot for a Gantt chart, but specific for mermaid. So we're going to take
the structure task list that clot produced
in the last lesson, and we're going to fit
it straight back in. So Clot will use Mermaid JS Gantt chart with duration dependencies and
sequencing already baked in. So the sample prompt you can use is using the phase and task
breakdown you just gave me, create a GAN chart in
Mermaid JS format, assume a ten week
timeline and show all dependencies between tasks. Okay. So after we do that, we're going to render the code that clot is
going to generate for us, and that is Mermid code. So we can put that into Mermaid Live or any
other supported tool, and then we can fine
tune as scope evolves. So those are the steps, pass the clots output back, get the mermid code
and render that code. So let's go to clot and
let's paste that prompt. So I'm going to just copy
this and paste it here. So as you can see it
is still trying to create a draw IO diagram. So it is obsessed with doing
things in draw dot IO. But I will tell it, give me
the mermaid s code instead. So let's see if now
Claude does it better. Oh, okay. So let's copy this. And let's go to Mermaid
and put it here in code. So right now we have
a syntax error. If you have an account,
you can do this AI report. But let's go and copy this error and paste
it back to cloth. Because what I think
is that it didn't, it has this markdown. So let's go back, copy the code. I actually just wanted
the code. So here it is. Here is the Gantt chart, but this is better, right? So let's expand it. And let's see that the
Postgres still setup, the ready setup and
the OT service. That's going to start
on April 26, right? And this can be
independent tasks. Then you can go with the
API Gateway skeleton, and you can do the
valuation engine and the inventory
service in parallel. But then after you do
the valuation engine, you can do the customer portal. After you have the
inventory service, you can do the staff dashboard. And yeah, you can do in parallel the
notification service. In parallel to customer portal, you can do the fraud
detection service, and after the fraud
detection service, you can do the payment gateway. And in parallel with the customer portal and
the fraud detection, you can make sure to guard everything
with authentication, and in parallel with
the payment gateway, you can do the
fraud rules tuning. And then after you
do everything here, you can do the end
to end flow testing. And ultimately, you can do the load testing
and the scaling. And you can see here
that you have the dates. It ranges from April
26 until June 7. So this is a ten
week build plan for this retail trading web
app. So that's great. Obviously, you have
to check this. AI is just a copilot. You already saw that it made some errors. It
was giving me this. I tried to render
this, with markdown. But it failed. Well,
it didn't fail. It's just that it doesn't show as nice as in the Merman
that Live Editor. So I tell it, Hey is the error. Just give me the code, basically, and we
render it ourselves. It still tried to make
the create diagram. It still tried to
call that tool. So yeah. We just told it, Hey, just give me the
Mermaid that Jazz code. I tried to render
that in the markdown, then just give me the code. And with that code,
we were able to render the Gantt chart. So that's it. I
hope you like it. Seeing the next lesson.
8. Challenge the result: Once you have the Gantt chart, remember that this is just an estimate that
AI can make mistakes. A Gantt chart from Claude is just a starting
point, not gospel. Use this checklist to pressure test it before
sharing with stakeholders. Critical path. Does
the sequence of blocking tasks lead
logically to launch? So if we see the diagram, yeah, it makes a lot of sense. For example, the load
testing is at the end. So it makes a lot of sense
that the load testing, for example, goes
before everything else. That makes a lot of sense. Dependencies, no tasks start before its predecessor
is complete. You can see, for example, customer portal goes after
the valuation engine. Does that make sense to you? Well, it can make sense to
you depending on the team. Example, your front
end engineer can start this even from the
beginning of the project, and they can start mocking data in order to make advances. So actually, if you want
to be very efficient, you don't need the
valuation engine to be completed before
the customer portal. Customer and staff dashboard, they can be done before every
vacan service is completed. But again, that depends
on your team size. If you only have one person
working on this project, then probably, yeah,
this makes more sense. So that's the fourth point here, team assumptions, team size and availability are
stated, not implied. Maybe if we told Claude, Hey, we have a end engineer, we have a front end engineer, then probably this chart will have changed to
take into account that, but it assumed that probably we only have one
person, I don't know. Buffer time, explicit buffer is included before the
launch milestone. So yeah, you have to take
into account the bugs happen. A lot of things can go wrong. Maybe you don't have access
to the infrastructure. A lot of things could
happen in any project, so you have to take
that into account. So Pro tip, use the Gantt chart to challenge assumptions and not
just document them.
9. Conclusion: We are reaching the
end of this course. For the class project, you have to pick any up idea, use Cloud and draw that IO
to produce two deliverables. They have to be
generated entirely with Cloud and draw that IO MCP. The first deliverable will
be an architecture diagram, have at least three layers and one external integration and begin chart with at
least three phases with dependency and the output as mermaid dot js and rendered in a Mermaid viewer like
mermaid dot Live. So what can you do now? You've built a workflow
that compresses hours of planning into
single focus session. You can now diagram fast. You can turn a
verbal description into structured diagram minutes. You can iterate easily, refine architecture
with prompts, no drag and drop rework. You can plan end to end, go from the architecture to the task brr down to the Gant, chart in just one session, and you can make these
estimates visible. So you can surface assumptions so the whole team
can challenge them. Next step, apply
this workflow to your next real project
kickoff before the whiteboard
session, not after it. I hope you like this course, and we will see each other
in the next course. Bye.
 David Armendariz