Transcripts
1. Day Trading Introduction: Hi, my name is Gufrey. I'm a 26-year-old day
trader from Germany, and I will guide you
through this course. I will give you the building
blocks of ICT day trading, and I will use the
presentation in the background as well
as trading charts to change your perspective on the markets or maybe guide
your first steps into those. So with no further delay, let's get into some keynotes. I structured this course
into eight chapters. This is the introduction video. Then we got the
project introduction. What skill I want
to teach you follow that by content like
assets and order types, the software which
will be trading, a short introduction into
basic market terminology, an overview of the
strategy we use, what liquidity is and
how we identify it, and concluding it with a
short summary or Outro. Starting now with a deeper
introduction to myself, like I said, my name is Godfrey. I'm a 26-year-old German with an obsession
for these charts. I'm a day trader with
five years of experience, three of those
with ICT concepts, and I'm always learning
never satisfied. I'm funded with two companies
with $25,000 and $50,000. You can also find
me on social media like YouTube, X, or Instagram. Follow me there. If
you like my teachings, I share some extra
content on these. What I will teach you are overall ICT concepts on day trading and
introduction into those. This course here starts with universal trading knowledge
and ICT liquidity concepts. An important message to tell is that I did not invent
those concepts. They are founded by ICT, the inner circle trader, and I don't give
financial advice. My goal here is to give everyone an easy introduction into those concepts in my
own simple terms. You can find way
more information directly on ICT's
YouTube channel. He is the mentor of your mentors and he is the ghost
in the machine. You can expect from this course to gain a real understanding of the market and an
independent your analysis. You will gain confidence in your decisions and
trust them way more. It is you against yourself
and the market is a mirror that will show
you your own personality, there's a lot to
discover about yourself. Reading candles
and understanding smart money will also be taught. In total, the goals are, know what assets, instruments, and orders are,
reading candlesticks, understand longs and shorts, get to know trading view, learn about basic
market structure and the basics of
smart money concepts, as well as finally identifying and anticipating liquidity. This all leads to you
making your own analysis. My reasons for teaching
are quite simple. I like teaching itself and
giving away information. It is helping others
who struggle and untangling the hard to
understand ICT concepts. To be fair, I also
want to diversify my own portfolio next to
trading. That's it so far. I hope you are curious
of what I will show you. I'd love to welcome
you in the next video, so follow me deeper
into the rabbit hole.
2. Project Introduction: Welcome to this teaching in
which I will present to you the project that I
want you to be able to do once you have
finished all the lectures. They will all build up
upon each other to give you the skill needed to do what I will show
you in a minute. I shortly want to remind you of the goals that I set out
for everything here. They will make more
sense when you move on, so just have them in your mind. Firstly, I want you to see
retail and their concepts like support and resistance failing and see that they are
being victimized. Secondly, I want you to gain the anticipatory skill so that you can expect
movement in the market. A key word for this
is when thirdly, the goal is for you to see which liquidity will
be targeted next, and the keyword for this
one is where price will. There are terms or things that you don't
understand immediately, don't worry because
at the end of every relevant chapter,
there is a glossary. Otherwise rewatch certain
topics or ask about them in the forum
where I will give you a answer as quickly as possible. Like I said, everything will
come together in the end, and I'm confident you will be
able to do the assignments. Everyone, even traders
with some experience, will learn something from here. Okay, let's go
through the process first and then look
at two examples. The project consists
of two screenshots. The first one should show a naked chart at the time
where you got the idea, the price will go to
a certain liquidity. Identify and outline the
equal highs and lows and note them accordingly as buy side liquidity or
sell side liquidity. Also, type out which
instrument you're looking at, and at which time
you got the idea. The second screenshot
should show when price has reached the liquidity or when it didn't
do as you thought. In that case, describe
what else it has done. Also type out your emotions that you had during the
move and after it. Be honest as it is
just for yourself. This is an example for
the first screenshot. I outlined the liquidity above as bust liquidity and wrote out instrument NQ time 1:50
P.M. New York Local Time. I identified the relative equal highs above
the market price. The BST liquidity will
be reached, I believe. This is an example
for the second one. The text says, price has reached a relative equal highs and I'm happy that my
thoughts were right. Then as an additional
note, I typed out. I'm able to see the relative equal los cell side liquidity and I'm expecting that next. This is a bonus for
the other side then. I typed out. Price again reached
the relative equal lows. You can see the arrows,
which are entries and exits as I traded
the first move. I think this will give
you a brief overview of what I want you to do. So then what should you
do with the screenshots? I want you to post
them into the gallery where I will answer
questions or help you out. Also, I think it's
beneficial if you watch other people's screenshots and try to learn from their
experience as well. Repeat this process over and over to gain a true
understanding. This won't be learned
by doing it just once. But if it's repeated over time, and that's it for the project, I guess everything is clear, and I'm looking forward
to seeing your posts. Be open minded for the lectures, and I will see you
in the next one.
3. Asset & Orders: Welcome, everyone to
my very first lecture, which is going to be about
asset classes and order types. I've decided to give
it a nice name like finding your instrument
inside an orchestra. I want you to
understand that there are risk involved in trading, and everything I do here is just for educational
purposes only, and I recommend you to get
professional advice from someone who is actually
allowed to give it to you. Alright, so the very first
question before we get into any charts is what
do we do as traders? So first of all, as traders, we buy or sell assets,
holding onto them, and then sell them after
a certain amount of time, reversing the whole process and getting out of our position. This leads to two questions
that we can answer, which is how and what? What do we buy and sell? And the answer will be
assets and instruments. And the other question is, how do we buy and sell, which is orders in the markets. Inside this lecture, we will
focus on these two elements, and I will start by going
over assets and instruments. Okay, what do I mean with finding your instrument
in an orchestra? It's, of course, an analogy. I designed this schematic here to show you
what I mean with it. I hope everyone can see
my cursor right here. This is the whole orchestra, which is representing
the market, and we can see there
are subdivisions inside this orchestra
like drums, strings, woodwinds, and
brasses, and we have also another subdivision
inside these divisions. Let's, for example,
take the strings here. We have violins, lllos, violas would be there as well. On short summary, we
have the orchestra, which is representing
the market. We have those sections
like the strings, which represent asset
classts, for example, Forex and we have the
instruments like the violin, which represent the
financial instruments like Euro USD in this example. Knowledge I will provide
to you is teaching how to play an instrument
and reading the notes. The fact that the
orchestra and Market have instruments at
the most basic level is a reason for me to actually bring up this analogy and I hope it makes
sense to you guys. We then have another example, so this should maybe drive home the point a little
bit more clearer. We have on left side the
market and on the right side, the orchestra, and we
can see, for example, that orex and strings are on the same level as well as
then the instrument with USD, the violin or cello or GBP USD, which we will go
over in detail more. So don't worry about
that too much. Just as a concept for the
whole market situation, I thought it would
be appropriate to compare it to an
orchestra. All right. Without further ado, let's
go into the asset classes. There are plenty
of asset classes available to look at or
to trade in the market, and I wanted to give you overview of what
they actually is. I have the top
five asset classes sorted here by volume in 2023. The first one would be
derivatives with $3.75 trillion. The second one is the Forex
market with $1.875 trillion. The third one is bonds
with $500 trillion, followed by the equities market, which contains 75
trillion euros dollars and the number five position is currently holding the
cryptocurrency market with a little bit
over $27 trillion. Again, I'm talking
about the volume here, so the sum of all financial
assets traded in this market. Yet, this is not every
market available. There are a lot more and I thought I just briefly
mentioned them to you. Which are commodities,
money markets, real estate markets, and
private equity markets. But for us, the most important
one are the top fives, and I'm going to cover them in detail over the
next few minutes. So let's start with the biggest one, which is derivatives. So the question is,
what are derivatives? And this short answer is
that they are contracts who gain their value on other
assets like stocks, bonds, equities, for example. Essentially, they are a bet on the future price of that asset class without
even owning it. You will buy a contract and this contract can increase
or decrease in price, which will give you your
profit or your loss. People use the derivative market to hedge, speculate or leverage. Each of them will be
explained later on. So how do they even work? A derivative contract is made between two
parties and they set the conditions for the contract that you buy or sell
in this moment. There are a lot of different
types of derivatives, and we're going to cover
the most popular ones, which are futures, options,
swaps, and forwards. So futures is the
most common one, and I want you to pay special
attention to this one. It's a contract that will
be executed in the future, regardless of the
price at that time. It is the most
common derivative. There is an obligation to it, so everyone must fulfill their side of the
contract at that time. I personally prefer to trade futures contracts since they are the most secure ones,
the most precise one. And this is why I suggest
you to do them as well. The next contract types
are options this you purchase the right
to buy or sell the asset at today's
price in the future, and you will obtain
this by paying a small fee or premium
to the market, which is why there are also no obligation to
fulfill your contract. The third contract type swaps. Swaps allow two
parties to exchange assets directly and with no
involvement of a third party. They are often used to
exchange currencies, interest rates, cash flows, or other instruments, but they contain a lot
more risk than, for example, futures
or forwards do. In about four words will be
the fourth contract type. These are private and
customizable contracts to buy or sell an
asset in the future. They are very
similar to futures, except for that there
is no market maker or third party involved. They are more risky and
they are OTC contracts, which means over the
counter contracts. The next asset class we're going to talk about is
the Forex market. ForEx stands for foreign
exchange market. It's a market for
currency speculation, which will always involve
a pair of currencies. You can imagine when buying one, you automatically
sell the others. They are most traded by banks, institution, government,
central banks, or corporations and
the exchange rate shows the value of the
currency X against Y. In this example,
we have X over Y, which would represent
euro over USD. If you believe the Euro will
rise against the dollar, you will buy Euro USD, and these are based
from the money markets. For example, Euro USD will be then comparing the Euro
index against the DXY, the US dollar index. And listed some more popular
pairs like Euro USD, Eurocad, Euro JPY,
many, many more. We're going to talk about bonds. So the first question
is, what are bonds? Bonds are technically loans that you give out to entities. Mostly they are governments. So you lend them
money and you receive an interest after its
termination date, which is called maturity date. Imagine giving the US
government $1,000 for one year. They promise you
an interest of 3%, so you make $30 after one year. Different types of bonds, like we said the
government bonds, which are considered very safe, since the low risk of a
default of a whole nation. There's also corporate bonds. These are issued by companies, and advantage would be
higher interest rates, but the risk is also higher. Las, we have the
municipal bonds. These are issued by
cities or states, and these also bring
other advantages like tax free interest payments. So another question
that may arise is, why do people choose bonds? They are steady income
with regular payments. You can decide the risk
level for yourself, like choosing a larger
bond or smaller bond. Great tool for diversification
of a portfolio, I decided to show you
the symbol of one, which is US ten years, which is the US ten
year bond, for example. Okay, let's talk about equities. The equity asset
class contains stock and other connected
instruments like indices. Stocks, for example, represent their ownership in a company. After buying a share,
you own a small part of the company and you
become a shareholder. And as a shareholder, you have a claim or profits
of that asset. One way to profit from a
company are dividends, which are mostly
quarterly payments from the company's profit. The other opportunity would be by increasing the value
of the share itself. So just buy and hold. There are two main types
of stocks which are the common stock and
the preferred stock. In the common stock, you get voting rights and you get a potential dividends
on the profits. The preferred stock, however, guarantees the dividend payment, even if bankruptcy is filed, but you gain no voting rights. I also want to take
a look at indices. Indices are a collection
of stocks into a basket. They have different sizes and represent different
areas of the economy. Listed the most popular
ones in the US, which are the S&P
500, the NASDAQ. There are a lot more
like the Dow Jones, for example, the German
one is the Duck. And like I said, I trade futures contract on
Indices the most, which we will call
index futures. Lastly, I want to talk
about cryptocurrencies. Cryptocurrencies is a
very new asset class, which was pioneered
by Bitcoin in 2008. Cryptocurrencies are
digital money that use a very strong encryptions
to secure transactions. One key feature is that they are not controlled by an entity, but rather
decentralized managed. Next to Bitcoin, there are a
lot more cryptocurrencies, which we will call alt coins. Like I said, here are
some key features. They're digitalized
and decentralized. They're mostly on a block chain. You acquire ownership
of your coins, and the feature is the high
volatility in the market. These are some coins that
you might be familiar with Bitcoin, Etherium,
Ripple, Cardano, but there are also plenty of
more coins, like light coin, doch coin, Solana, avalanche, and so on and so forth. Alright, this is a
overview over the market. I designed this
little overview here, so we have everything
on one slide. These are the top five ones. So please be aware that there are more of it, but like I said, we will focus on the derivatives and the
futures, for example. Let's turn our attention to the second question that
was posed in the beginning. How do we participate
in the markets? And the answer is order types. So what are order types? They are commands to the market, which are mainly used to
enter into a position. There are multiple
order types which will only vary in precision
and timing in the market. The most common one you should know is market and limit orders. Now I can see the
question, what are market and limit orders?
Let's go over it. Market orders are
immediate entries that prioritize
timing over price, so the order is
executed immediately, but due to slippage, you will get a slightly
different price when executing. Contrast to that, limit orders
are focused on the price and will only be executed when the market reaches
a specific price. They are buy limit orders for longs or sell limit
orders for shorts. And again, these may
not be activated when price has not reached
the desired limit. There are also
other order types, which mostly are not relevant, but I want to highlight
the stop order. It is very crucial
for risk management, and I recommend it highly to you to have it on
every single trade. Then there's also stop
limits, trailing stops, good till cancel, day orders, fill or kill and so
on and so forth. But like I said, the
main takeaway here is market orders and
limit orders. All right. This concludes the
first video lecture here about assets and orders. Here's an overview
over terms that you may not be familiar
with in the beginning. Read through them,
try to memorize them. Thank you for your attention. I will see you in
the next lecture.
4. Software Setup: Tradingview: Welcome back to
the next lecture. In this lecture, we're going to talk about the
software introduction, which is trading view, and I am going to give
you some setup tips. Every trader needs a chart, and most people ask themselves where to get started first? Most traders nowadays use a
software called Trading view. Personally, I also
use Trading view, which is purely a non affiliated
recommendation for me. There are two options.
You can either use the web browser or
use the desktop app. The advantages of
trading view are plenty. First of all, all key
features are completely free with some comfort
options for a very small fee. And in this lecture,
we're going to focus on its features and a few
personal setup tips. My recommendation
is the desktop app, which you can download
from the link which is displayed on
your screen right. Advantage of the desktop app, for example, is that it uses
less RAM of your computer. Welcome to the standard
interface of trading view. This is what the initial
setup will give you. Before I tell you
my adjustments, I will give you a quick
guide over most things you can see here and we will begin with the
white boxes here. Here I display them separately, so it's a little
bit less confusing. The bottom scale or X
axis is the timescale, depending on the time frame. In this example, it
is the daily chart. It shows one candle representing
one whole trading day. A fluctuations up and down are compromised into
one single candle. The right scale here or the
Y axis is the price scale. It shows the instruments
price and I usually use a logarithmically scale it makes it easier to look at
longtime price developments. The most important feature
here is on the scale. It is where you set
your time zone, and despite your
initial thoughts, you will always set it to New York Local Time
or UTC minus four. There are two major
reasons for this. Firstly, it unifies our
or everyone's view. There's no difficulties
in understanding, and you will immediately know what I refer to at
any given time. Secondly, believe it or not, the algorithm that controls
price runs on that time, there will be more details
on this in the future, and you will make
your own discoveries and observations on it. Don't fight me on
this one right now, just go with the flow. This is the header right at
the top of the desktop app, which has quite a
lot of features, so I will quickly cover
them and go over them. This is where you can find more tabs and switch
between them. It works like a browser and
is pretty self explanatory. In this window, you can
change the appearance of candlesticks to other
mostly useless things. Nothing here is really needed. The only thing you
will need is time and price and candles. Box here is allowing you to split your screen into halves, thirds, or quarters
or even more. It's useful to have more
than one instrument on one screen or split up your screen over
different time frames. But in order to split it
up into crazy sections, you will need a paid
version of Trading view. One screen, however,
is more than enough. This section here
is for searching other instruments or comparing them to your
currently active one. You can also find your
profile settings here. An important one is the
time frame selection. Like I mentioned earlier, it is changing the data that is compromised into
a single candle. The ones I have
set as a favorite here is what I recommend
to you as well. Next up are some not so relevant
options like indicators, which are the most useless, then we also have alerts
and the replay mode, as well as the undo
and redo buttons. Lastly, this feature
allows you to switch between different
settings and layouts. You can see I created a
special one for this lecture. Next up, we have the toolbar. On the left hand side, you
will find the toolbar. It's the tools we use
for our profession, like a carpenter
will use a hammer. Set favorites and make them
show up using this star down here and these are my favorite tools that we
will cover at a later point. A rough summary
for them is lines, measurements, positions,
and text or drawings. Lastly, on the most
right hand side, you will find the watchlist. It is a place where you can save and collect your
favorite instruments. Good idea is also to
organize them into sections. Don't blame my spelling. English is not my
first language. Here's one section I created, and it contains some instrument I use for my macro analysis. The plus at the top lets you add instruments to
the watch list. These two options allow you to switch between watch
list and alarms, and the rest is
not really useful, so you shouldn't need
to worry about them. Now you can see two
layouts of the charts. The first one is
the standard one. The second one is
my personal layout. The standard layout's
key features are red down close candles, green upclose candles, and the dark background
with a grid. Comparing it to my own layout, the differences are black
down close candles, dark green upclose candles, a gray background
with no grid and black borders around
each candle's body. Now let's talk about how you can change your setup.
It's pretty simple. You start by right clicking the canvas, choosing settings. Navigate to symbols or canvas, depending on what
you want to change. Change it into your
desired settings and mine are displayed
for comparison. While you at it, you can also
check out other options. As a rule of thumb, there
is no right or wrong setup, and you should choose
what makes you feel most comfortable.
All right, everyone. Let's take a look at the tools that I just
presented to you. I want to show you a
few tips and tricks about them and how you can
apply them on your chart. First of all, I have
the cross here. It allows me to always get back to the setup
with the dash lines, which will be the default one. We then have a vertical line. As the name suggests, it is just a vertical line. You can change the layout of the vertical line and
also the thickness, which you will be able to do
with almost every tool here. Next up, we're going to
talk about the trend we won't use it to
mark our trends, but rather to point out
levels and swing lows, which we will cover
in the next topic. You can hold control to
anchor them to any low, and you can hold
shift in order to make a vertical line
either horizontally, vertically or at 45 degrees. The next one is the arrow. I use it for marking our charts and to
point out some things. Next up, we have
the Fibonacci tool, which I adjusted a little bit. I use these for deviation
and measurements, my settings look like this. And as you can see,
they projected range into the future
with half a range, one full range added,
another half a range, another full range, which
you can imagine like this. And then the half point would be half of
this range again. And you can also add this one, and then you'll see it is
the 200%, for example. I copied this box while holding control and
then dragging it. Speaking of the box, it is here, same as the lines, you can also anchor
them to highs and lows, drag them to the
right or to the left. And these are my settings. We then also have just
this vertical line. It will go into
infinity to the right. Another cool tool
is the grand box. I use them to split up ranges
into quarters and halves. In this case, we can
see the whole range, the halfway point, the 25%, and the 75% point. Settings for this are here. And like I said, it will
be used to grade ranges. This is a topic that we will
cover in another course. Next up, I want to point out the short and the long position. These tools will be useful
to enter into positions, and they represent limit orders more on them later
in the lectures. Lastly, I want to show you
the text boxes that I use. So we have the normal
text box, the callouts. We have a drawing
tool and a path tool. You will find these
in my videos, so I just put them in
for completeness sake. Is then how you can
arrive at such a setting. Going forward, I will be
using these settings, so don't be confused. This is it for this lecture. I hope you had a comfortable introduction into the software. Thank you again for
your attention, and I will see you
in the next lecture.
5. Basic Market Terminology: Welcome back to yet
another lecture. The topic this time will be about the most
basic market terms. It will give you
a short overview over the language we speak and hopefully makes you understand a few terms and concepts
that you didn't know before. Let's get into it. All right, let's start with the first topic and probably the most needed. What are those candles and how are they
to be interpreted? Please keep in mind that my
down close candles are black, but I will use the red
ones to explain it, since it is the
usual standard one. On the right side, you can see a general overview of
how we describe candles. The first interpretation I want you to
understand is that we differentiate between a candle's
body and a candle's wig. The upper illustration
shows this concept. You can see that the candle possesses two wigs and a body. One wig is at the top side, we call it a premium wig
and one is at the downside. We will call a discount wick. In between those, we
have the candles body, which is where you can
find the colored area. Overall, we are
describing and looking at OHLC so open high,
low close candles. Each candle has these
four characteristics, and looking at these two
candles on the right here, we can see the high, the open, the low, and the close. For a Barish candle,
it is the high, open, low and close. A general reference, you will realize that
the green candle is called up close candle since its close is above its opening. We also call this a
bullish candle and you can imagine a bull pushing price
higher with its horns. On the other side, the
red candle or in my case, black ones are called down close candles since they have a close below
their opening. They are also called
bearish candles. The idea behind
that is that a bear is smashing price
down with its paws. This is how every single
candle is formed on the day hourly minute or
even seconds time frame. It's a universal interpretation, and now you also
understand what it means. Now, let's take this
understanding one step further. We are going to take a look
at how each candle is formed. This is one of the
main concepts in ICT's repertoire and it is
called power of three or AMD. Firstly, on the left side, you can see a different
interpretation on how a candle is formed. In this case, a bullish
candle and it goes from open to low
to high to close. If you take your eyes
to the right side, you can see a different
view on the candle. You will notice I put three
faces over the arrow. First phase is the accumulation. This is where the market
is held in a range and orders are built up
above and below the area. Then we typically see one side of the initial
range get broken, which we will call
the manipulation. A lot of things happen here. We will cover this at
a different point. It essentially traps
uninformed traders and is also known
as the Judas wing. The third stage then is the true move and is
called distribution. Price will be taken in a
quick manner to a goal. Usually, price then comes off of its high and closes near to it. Usually, it will be 70% 80%. The AMD accumulation,
manipulation, distribution concept
or power of three. Not every single candle
looks exactly like this one, but I want you to think
about these three stages. Observe it for yourself in your charts and I think you
will be able to find these. Now let's take a look
at a few examples. This is the NASDAQ and it is
the 50 minute time frame. Let's look at how this
daily candle is formed. The day starts a true day opening at 6:00 P.M.
New York Local Time. We can see an accumulation
happen to roughly 9:00 A.M. Where price starts the manipulation phase
and drops sharply. I didn't draw these
two lows in here, but notice them and when you're eventually rewatching
this whole lecture, you will have a light bulb
moment. I promise you. After the manipulation, there is the distribution higher and
away from the manipulation. Notice how price comes
back from the high, and it closes near to it. I hope you can imagine
it as one candle now. Let's take a look
at another example. This is again the
NASDAQ and again, the 50 minute time frame. Same play going on here
through the opening, accumulation in a large range. One side gets broken
in the manipulation. See this low here,
and then quickly distributes away with a
close near to its high. Of course, these
examples seem obvious, but I want you to really
go and study old moves. Don't take my word for it
and go see it for yourself. Now let's talk about
legs and swings. These are the building blocks of the architecture of the markets, which we will call
the market structure. Let's start by looking at a leg. A leg and price are multiple consecutive candles in a strong one directional move. This is defined by a clear direction and often
found in expansion phases. Multiple legs combined with retracements will
become a trend. Next up are swing points. These are turning points
in the market who are often located in
areas of liquidity. They will form major swing loads and swing highs in the market. On the right side, you can see a few examples for legs and swing I hope this helps you to identify
them for yourself. Okay, guys, now we see what types of market
structure there are. Either price moves in the direction which we will
call trending markets. In this, we got bullish
and bearish trends. Bullish ones make higher
highs and higher lows. Bars ones have lower
lows and lower highs. If a market is not trending
and is held inside a range, we call that condition
a consolidation. There can be higher highs, but then we also see lower lows. This is done to build up orders, which is similar to the
accumulation phase. This is an example
for a bullish trend. We see higher highs, higher lows and their small legs down which do not violate
the previous lows. On the other hand,
this is an example for a bears down trend
with the opposite, meaning lower lows
and lower highs. It is also worth mentioning that trends facilitate on
every time frame. You can see them on the daily, four hourly, 50 minutes
down to the second charts. And for completeness,
this is a consolidation. You can see the price is
held inside a range and see the choppy and uncoordinated
movements inside this range. Some highs are broken,
some lows are broken, but there's no clear
trend inside the market. The last thing in terms of language you will need
is the roadmap of price. There are four conditions
the price can do, which are consolidations, expansions, retracements,
or reversals. Two things are always true. It starts with a consolidation, and it is always followed
by an expansion. Price then can either retrace to give another expansion
leg or reverse and attack the consolidation
this visual here helps you to understand
how price will be booked. We see the consolidation
and the expansion as the set stages and
then how it can move into a retracement
or reversal. For some definition,
a retracement is a pullback into an expansion
range to then give another expansion leg
whilst a reversal is a turning point
in the market and usually attacks the
original consolidation. I know this is a
lot, but rewatch it, and I'm sure you
will understand it. So let's take a look
at it in action. Here you can see all phases of price delivery on a 1
hour timeframe on NASDAQ. We see it starts out with
the consolidation here, prices held inside a range, then we get a manipulation
away from it, followed by a strong expansion, a retracement into
the expansion leg, then followed by
another expansion, we then see another
consolidation, another expansion downward. And unfortunately, you can't see the turning
point right here, but it reverses and
changes the trend overall. Once again, here's the
glossary for all terms. I know it was a lot
of information, so take your time to take it in, possibly rewatching this part. This is a big chunk of
the market terminology, and I hope you now understand more and I eliminated
some question for you. This is it for this lecture, and I hope you have
learned a few things. Thanks for watching, and I'll
see you in the next one.
6. Strategy Overview: We'll come back to the next
lecture where we will really dive into the strategy we
follow and how it works. I will give you a
deeper look into smart money itself and
why and how we operate. What really drives the market
and how can it be used? I want to pull the curtain
back a little bit here. Orders are the blood
of the market, and every buyer or seller needs a counterparty to
enter their own position. In this context,
I once again want you to look at market
and limit orders. On the left side, I drew a conceptual overview on how
market orders are executed. Buyers and sellers are linked immediately while times
prioritize overprice, they exchange the ownership
over the instrument as well. The right side shows
how limit orders work. Due to a different analysis, two parties want
to sell and buy, but not at the current price. They prefer a certain price and only when this is reached, ownership and money
are exchanged. Now, for spot markets, meaning without any leverage
with direct ownership, this whole is pretty clear, but the biggest asset class, so the derivatives
allow people to speculate on instruments without ownership and with a leverage. But from my own
personal experience, it is often hard to understand how these
processes even work. Leveraging a position
is simply borrowing more money from an exchange
to increase a position size. Will increase the profits, but also increases the losses by a factor of the
borrowed money. If a loss is as big
as your own money, you will get stopped
with what we call a margin call to prevent negative balances
on your account. In both cases, longs and
shorts are essentially contracts that will increase or decrease in its own worth. Long seems simple,
but I prepared what I think will
be a nice analogy. For long trader believes through his analysis that an instrument will increase in its price. He then buys a contract
that says in the future, this instrument's
price will be higher. When this contract
is then closed, he was either right and gets a profit because the sell
price is higher than the buy price or he
is wrong and receives a loss with the sell price
lower than its buy price. For shorts, imagine locking the current price and promising to buy the
instrument later. So you will sell
first and buy later. In this case, a lower
price will give you a profit and a higher price
will give you a all right. I hope this cleared the function of longs and shorts
up a little bit. So let's get into more details. Let's spice things up a little more and talk
about two more, in my opinion,
crucial order types, a stop loss and a take profit. In the middle, you can
see a long position. Just reverse everything
for a short. We got the take profit, which will give you a
profit in a green color, and we see the stop loss, which will give you a drawdown or loss moving in the red color. The take profit order
is an exit mechanism that will automatically close
your position in a profit. It is a limit order and will be executed when price
reaches a certain limit. And again, you see the
trading view symbols, four longs and shorts
underneath similarly, the stop loss order is
also an exit limit order. This, however, will
take you out in a loss and it is
really important. Accepting a loss and
limiting the drawdown is a huge part of becoming
a profitable trader. Every single trader
loses and limiting and managing risk is better than losing crazy parts
of your equity. So now let's get into the differences between
the majority of all traders and ICT traders
or smart money traders. Let's take a look at the most important takeaways and then find retail
and SMC traders. Every trader can be forced
out of their position with their stop loss
since everyone needs a counterparty to engage
their own position, is how big players like
banks, institutions, and governments absorb
the orders and use them to pair them up with positions
of the opposite direction. The beforehand
mentioned algorithm will fulfill this desire. It is commonly called the Interbank price delivery
algorithm or IPA for short. We as small traders, compared to the big ones, will get offered the
price at the very last. Those players can then enter their positions without moving price too much at one time. They do not enter everything
completely at once, but rather spread it out over mechanism will be covered in
a different lecture though. Next up, we will talk about
fundamental differences between smart money concepts
traders and retail traders. First of all, we as
ICT or SMC traders do not believe that buying
and selling pressure is moving the markets. We know and acknowledge that IPA moves or books price
using algorithms. This manipulation
is designed to take out the uninformed traders
so bigger pockets can enter. SMC is also not moving IPTA. You can imagine
it as a fly on an elephant's back riding the
right wave and not fighting. So this should bring up the
very important question of where do retail traders
place their stop losses? Who are and how are
retail traders thinking? In the true sense of the word, retail traders are small hobby
traders with a small fund. The difference is
that SMC traders are aware of what actually
happens in price. I or we will refer to retail traders as uninformed
and misinformed individuals. They represent 99% of
all traders out there. But how do people end
up in the retail group? We can answer this with a typical pattern
that will occur. Firstly, a person will be
interested in trading, usually during large higher
time frame expansion phases, it is often supported by a sense of fear
of missing out or Fomo which will make sure that there is a feeling of urgency. Next up, they rush to inform themselves on every
possible way. This is nowadays mostly
done on the Internet or in classic trading analysis
books information they will find and learn is, however, the retail theories. This feeds them right into the desired narrative
of the market makers. Sometimes people get lucky
over a short period of time, but most will lose money, either partial or all of it. Those who win will maybe
become influences for the wrong stuff
and unconsciously lead more lambs
to the slaughter. After losing their money,
they will be frustrated thinking there is no way
trading can be done. The market will be
described as random, which is totally untrue. They quit without ever
gaining any understanding. Rule of thumb, you can
remember that 90% of all traders lose all their
money within the first year. Then we got to ask ourselves, what do retail traders learn? There is no lie 1 million
things you could find, which is all BS. There's scandal counting,
volume profiles, RSI, EMAs, V web, Bollinger bands, and so on. But by far, the
most known concepts is support and resistance. This idea is especially
nice because it tells retail traders where
to put their stop losses, which is exactly what
we want to know. Let's take a look at support and resistance, just a
little bit more. For clearness, this
is a wrong idea. I do not subscribe to it
as it is not working. The only thing that is
working is time and price. Let's remember that retail
traders believe that buying and selling creates a pressure which
will move price. This will make them
think that buyers and sellers are actively
defending levels. Already defended levels
will be defended again and the more often
price revisits an area, the stronger it
becomes in their view. SMC knows that this
will just build up orders and increase
the likelihood of the levels getting broken. Levels above price are called resistance and levels below
price are called support. SMC will see that and know
that it is not working. Stops will be accumulated and it will just
increase the likelihood of IPA manipulating the price
right there, right to them. Here's a random piece of price
action with random boxes. With enough imagination, you can see touches that
will make sense, but it's very unprecise and ignores that wigs also
trigger stop losses. Give ten people this screenshot and let them draw in
support and resistance, and you will get ten different interpretations of
where those are. Once again, it is not working. However, it is the
most pushed concept. SMC or smart money
concept traders have a very different
view on the market. We are inspired by
ICT and a concepts. He is the innovator of all
concepts regarding SMC. We also acknowledge
IPAs existence and the manipulation in the markets in favor of the big players with
way deeper pockets. We also understand that retail traders have a
target on their back and will be taken out to be paired with bigger orders of
the opposite side. The right side shows a conceptional drawing which should remind you of
AMD or Power three. We see the accumulation phase
where retail thing support, so they even go along there. Once time aligns, the manipulation occurs and
they will be taken out. After that, they distribute
price higher and away. Here we see the
same things as in the concept accumulation at a support followed
by the manipulation, then price distributes away very fast and before
reaching the goal, it makes people even
believe that it is a resistance and they are
inclined to sell there, eventually wrecking them and
taking price even higher. Here we are again with new
terms you have learned, surely a section you
might want to rewatch. We are at the end
of this lecture. I hope you enjoyed and
learned a few things. Stay tuned. I will see
you in next video.
7. Identify Liquidity: Welcome back to
the final lecture. Now, we are going to
talk about liquidity, and I will teach you the
skill of spotting it. Let's not waste any more
time and get into it. As a short reminder, there has to be a loser
for every winner. It is not a charity event, it is war and you trade to
make some bread eventually. Every individual has
signed a risk disclaimer and knows about the risk
that is involved in trading. There's no need to
feel sad for anyone. It is you against the rest
and against yourself. So in total, price
has only two goals. The first one is seeking liquidity to which I will
teach you the basics. In this course here,
there's more to it, but you will need a bigger
view on everything for. Teach you here is plenty and serves as a good starting
point for your career. The second goal of price is to reprice into inefficiencies, which is to offer fair value. This is something
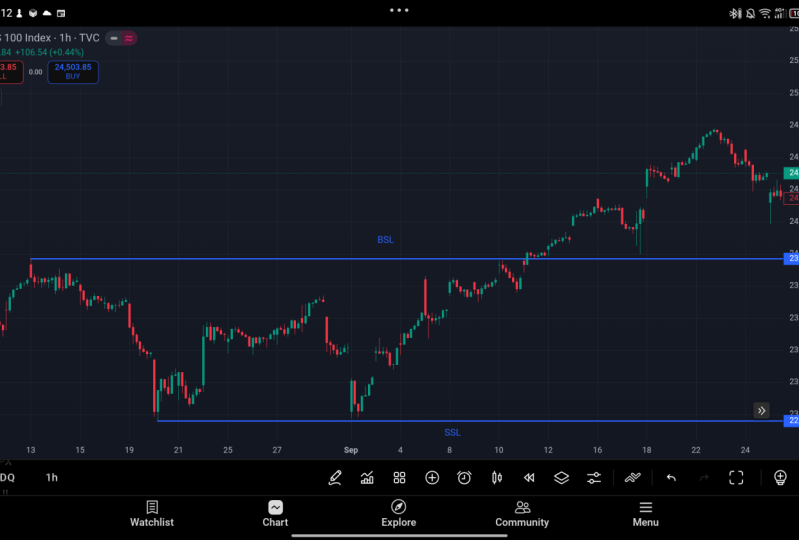
I will cover in another more advanced course, so stay tuned and follow me to not miss D. So for terminology, if a liquidity is
above market price, it is called by side liquidity, and if a liquidity is
below market price, it is called sell side
liquidity or SSL. This is because the st of long
positions is a sell stop, and the stop of a short
position is a buy stop. Again, we are just a fly
on an elephant's back. There are huge players in these markets with
incredibly deep pockets. They do not care about
anyone's feelings and won't hesitate
to stop you out. You got to ask yourself
if you want to be victimized or if you follow their footsteps
and ride the wave. ICT used to say this quote very often and you
should think about it. If you cannot spot
the liquidity, you are the liquidity. Let's get into what liquidity really is and what it means. The previous topics all lead to this topic, so
let's bring it home. Liquidity refers to
the availability of orders above and
below market price. These can be triggered by large players to get
into their own position. It's not just a single
position or stop loss, but rather a clustered area
where a lot of people, so retail traders put
their stop losses. This is because of either retail concepts telling them to do so or because of
psychological factors like rushing a stop loss. Higher and without knowing what the market is likely to do. Like I said, those orders will
be paired upon triggering, so it can be seen
as fuel for price. And without the
absorption of orders, price moves lethargic
and bloodless. So where can you find liquidity
or where does it reside? In order to answer
that, we got to think about where stop
loss will be put. First of all, there
will be stop losses above swing highs and
below swing lows. Of course, these pools
will be bigger on higher time frames
and smaller on lower essentially
individuals will gamble on each high and low, trying to pick the top or
the bottom of each swing. A stronger form or
the strongest form of liquidity are relatively
equal highs and lows. These will be interpreted
as a stronger form of support and resistance
by retail traders. This is why more people
will trust it and place their stop loss below the lowest or the highest
swing in that formation. The size of the position will also increase at those levels. These pools will be
even stronger if the second low or high does
not breach the first one. Another type of liquidity, which is often over
inefficiencies. But again, this is just
for your knowledge and the topic will be covered in
a different teaching itself. Show me some love and I'm
more enticed to produce it. There's also all the blocks, which will also be covered
at a different time. I just want you to know
about them already. But why is it even important
to take stop losses? One of the biggest
reasons is to cover up how and where big
players are positioned. Also, like I pointed
out a few times, it would create a huge slippage. Means that price is moved a huge amount due to the
lack of the counterparty. This leads to a disadvantage
that there is not a good entry price and the
true intention is given away. Another reason then that one of the main goals of ensuring price stability
will be violated, which leads to bad
market conditions. Another important topic
we should also cover is what type of liquidity
conditions there are. The first condition or environment describes low
liquidity conditions. This means that there is not a big pool above
and below price. In such conditions, price does not have a lot of
resistance to move. This area is ideal to trade in as it supports
trending conditions, and we describe price lags in this environment as low
resistant liquidity runs. On the other the environment
of high liquidity. It is where we find a lot of liquidity above and
below market price, and it means a lot of
interests and orders, which creates high resistance
for price to move. We find these often in
consolidating markets and price is prevented from
making lasting large runs. Runs inside these conditions are described as high
resistance liquidity runs. I advise you to avoid these. Next up, I want to discuss who else is part of the
liquidity providers. First of all, we got
the market makers. They are the biggest entity and constantly offer
buying and selling. This allows everyone to
always participate and ensures the goal of efficient delivery as
well as price stability. Next up, are the private
and public players. These are small funds or medium funds entities that
participate in the market. This is liquidity in
the form of stop loss. Lastly, there are also electronic
communication networks, which are the intermediates between different
layers of the market. They also provide
liquidity to all players and also aid in creating
price stability. There's also different factors for price and its delivery. Firstly, I like to mention
the economic calendar. Depending on what
events are happening, price will behave differently. The weekly profile
changes dramatically with these events like
CPI, NFP, FOMC. The other factor time of day. Also, which day of the week
it is will be very important, especially for price
delivery and what to expect. These topics will be covered as well in a different
teaching altogether. But for the economic calendar, you can always check
out forex factory.com. High and medium impact news.
Study it for yourself. The next thing I
want to show you is how price engages
a liquidity pool. We differ between two ways
price can engage liquidity, which is one, running a liquidity and two
sweeping a liquidity. Let's start with
running the liquidity. It means price is
aggressively engaging the pool and then continues
to move in that direction. Most of the time
price is then seeking a higher time frame
liquidity pool or is entering price discovery, meaning all time highs. The second way price can engage a liquidity pool is by
sweeping the liquidity. Means it's absorbing
stop losses. They are triggered,
and then price reverses and seeks the
opposing side of the market. So from cell side
liquidity to buy side liquidity or from buyside liquidity to
cell site liquidity. So in summary, a run will result in a strong trend
with strong legs, while a sweep leads to a reversal and a
change in character. This is an example for
a run on liquidity. We see the price runs into the pool and continues to
run in that direction. Here we see a sweep of
liquidity and it shows that price takes out
the stop then reverses. Also note that the sweep
usually closes above their liquidity while a run closes beyond it,
meaning the candles. Finally, I want to do a short
life exercise with you. This will reinforce what
you have learned and is a nice way to practice
your analysis skills. It will bring together everything you have
learned so far. So feel free to participate.
No pressure here. So on the next slide,
pause the video at first and try to identify
areas of liquidity, sweeps and runs, consolidations, expansions, retracements,
or reversals. I will give you the
answer in a few minutes. I will give you the answers
on the very next slide then, treat it as a challenge for
yourself. And let's go. This is the Bitcoin
chart in 2021. Take a minute, and I will show you some of my analysis next. All right, here we
are. We can identify buyside liquidity,
CLSA liquidity. By side liquidity,
Calcite liquidity, we seen uptrends here. We also see sweeps, eventually a breakdown here, breaking all those
alside liquidities changing the trend
direction here. So we have a run on
liquidity down here. We then see a
consolidation here. So we could see also
an expansion phase, retracement, expansion. Then we're down here
with the consolidation. We see initial cell
site liquidity, swept once, swept twice. The candles barely closing
below this one here. Then price is reversing, seeking the other side
of the marketplace. Running that direction,
starting a new trend, so expansion,
retracement, expansions. Till here, it's a run. See this liquidity down
here, price comes down, consolidates a little bit here, absorbs all those orders in a sweep, then displacing away, continuing the trend
with an expansion, all the way to the initial
buy side liquidity from here, sweeping it once,
coming back down, sweeping it again, breaking
down below this cell site, changing the trend again, short consolidations here before breaking down again, and so on. How much of that did you spot? If you spotted
some of my points, you did very well already. If you didn't, don't
feel discouraged. This is just the
beginning and I've got so many more tools that will
guide you in finding those. Okay, this is it for
the final big chapter. This is the glossary once again, and I want to thank you already for listening and
paying attention. Next up, we're going to
have a short summary of everything you have learned. If you made it until here, I congratulate you already. It can be a very dry topic, and I'm proud that
you held onto it. So see you in the next one.
8. Final Remarks / Outro: This concludes this teaching, and I want to just
briefly look at what I have covered and
what you have learned. Hopefully. I gave you a brief introduction
into day trading using ICT concepts and creating the fundamental knowledge that you will need as you move on. Hopefully, I have sparked a few fires for more
learning inside you. So the topics that
we have covered are, what assets and instruments are, which order types there are, what trading view is, and how to set it up properly, reading and interpreting candles gaining an
understanding of legs, trends and basic
market structure, concepts like power
of three or AMD, the four phases of
price delivery, how longs and shorts function, what retail and smart
money concept traders are, and what the main difference
between those parties are, understanding the very basics
of ICT's market views, the definition of liquidity, including the types
and the providers, what a sweep is
and what a run is, and we did a short eye training. Is all I have provided for you, and now it is time for
you to take action. I'm looking forward to review your projects
in the gallery. I think the assignment
should be clear by now. Use everything you
have learned so far. While you have watched
this teaching, price has fluctuated and most likely seek some
form of liquidity. Can you spot it?
What do you see? Don't hesitate and
show it to me. I still got a few things to say. Firstly, in my opinion, you are not suited to take
trades with money right now. You don't have the full
perspective on the market, and I just gave you
the building blocks. Anticipating where price will
go is an important skill, but it's not enough
to engage it. There's more to come, and
those elements will help you in finding your style and
guiding in your analysis. Please rewatch parts that you haven't understood immediately
and ask questions, for example, in the forum, and I will answer them in a
very short amount of time. The element that I have
taught you here is called identifying the draw
on liquidity or DOL. It is part of finding your
buyers in the market. And this is it. Thank you
so much for watching. I appreciate you so much, and I hope you liked
me and my teachings. I would also highly
appreciate it. If you could review this course so it can reach more people
and help them as well. Also, follow me to never miss another course
I might produce. This will encourage me
to keep going here. Stay safe, stay healthy, have fun studying
until the next time.
 Godfray, Teaching ICT Concepts in simple terms