Transcripts
1. Introduction: When I see a dataset, I see a mystery where I can find the insights from and then tell people about it and teach people. Hi my name is Nadieh Bremer, and I'm a freelancing data visualization designer. Today in this class, I'm going to teach you about creating more effective and more beautiful data visualizations by taking your data visualization beyond the default. I'm a freelancer, and I worked for a very diverse group of planes fromaD Google News Lab, to The Guardian, to Johnson and Johnson. I also create a lot of personal projects on topics that really fascinated me, anything astronomy like, Lord of the Rings or Dragon Ballsy even. But I also love talking about data visualization and getting people enthusiastic about what you can do there. So, during this class, I'll be taking you through the different ways that you can go beyond the default when you create your own data visualizations. This could be combining different charts, reusing a chart in different ways, looking better at the design of the chart, and finally hacking it into completely different things. So, I think this class is actually useful for a very different kind of group of people. I think it's useful for data analysts to make better graphs to explain what they actually found that a data, for front-end designers to create better visualizations for websites of the client's data, where also graphic designers to be more mindful of exactly what they're trying to convey and not just turn everything into a line chart or reward chart. So, what I hope you will take away from this class is that you have a whole arsenal of different things that you can try, and that it's not very difficult, you can just think on the four steps. Try and apply them and then see which one works best. So, after you've taken this class, I'd really love to see your data visualization, so please share them in the project gallery. So, excited to show you what I've been talking about so let's get started.
2. Beyond Default Data Visualizations: In its essence, data visualization is making data visual. So, having numbers, or having strings in a way like country names, and converting that to visual elements. Something like circles, or text, or shapes, or widths, or heights. Every kind of these visual aspects that can be converted to data in some way. So, data visualization is encoding data into visual elements. It could be numbers, or strings like country names, and then you turn that into visual elements. These could be shapes and widths, colorist, opacities, movement, text, all of those things in such a way as to reveal insights to mere humans who then can understand what the data has to say. I mean, just open up any app like a fitness app on your phone, and you'll see all kinds of small data visualization about the number of calories that you've burned, the number of floors that you've walked up, but also with banking apps these days you can see how much money you still have, how much money you still owe. You look at these things to get information, and don't look at them like, "Oh this is a data visualization," so it's becoming more and more subtle these days. So, there are two kinds of data visualizations that I find most incredible. On the one hand, it's the visualizations that know how to visualize both the whole and the details both at once in an intuitive way, and also looking beautiful which is a very difficult spot to reach, but there are those that reach it. On the other hand, it's the visualizations that really reached their goal. Say you have a visualization that tries to convince people about a certain cause, about signing a petition, or doing something and actually reaching that. Improving the- or increasing the knowledge of people so that actually maybe governmental changes are made. Those two are the most amazing I think. So, default charts are great for getting across very simple insights. The bar charts, the line charts, but if you want to make that one important data visualization, or get that point across to your manager, or to your audience, you want to go beyond the defaults and then be guided by the data and the goals. You can use the default as a base, but then you have to transform that to take into account how your data is different than any other data in the world. That's why it's super important to actually take that step, sit down, think about it, and trying different techniques that I'm going to tell you. A way to actually get beyond that default, to create more effective charts, I'm going to explain four different techniques you did I use a lot when I create my visualizations. So, one of them is combining different charts to create something completely new. The other is reusing a chart in a different way, so looking at the elements in a more abstract sense and we're using it for different ideas. Then we have designing it because it's not just about the data, it's also about the colors, the layout, these things and how that can affect the chart. Finally, if you want to go for something completely different, how you can hack somebody else's chart, or someone's code into something completely different. So, next up, I'm going to explain to you how you can combine different charts to create something that has a completely new meaning.
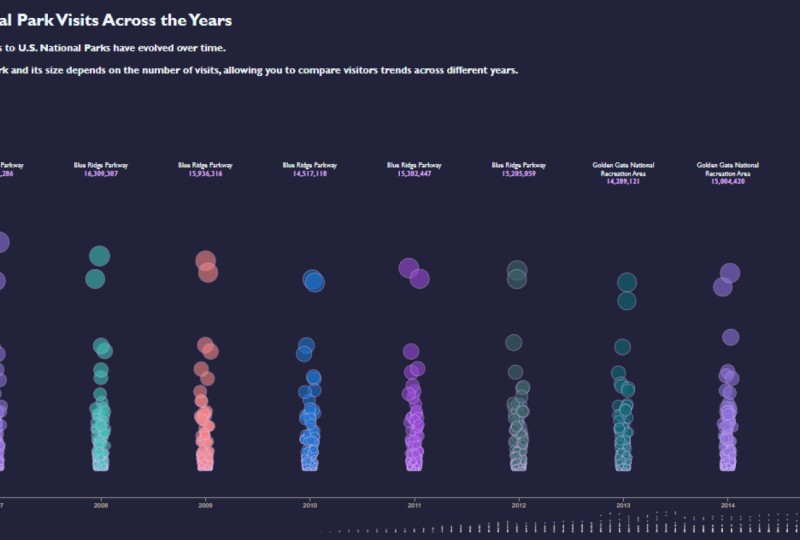
3. Method 1: Combining Charts: So, for me, there are reason why I want to start with combining it, is when I have data that has lots of different variables. So, I have to use lots of different visual channels to actually reveal those variables. By combining different charts, you actually have more of these variables available. So, the scatter plot could become with the circle sized or the bar chart, you could do something crazy with the heights. Maybe that would be something, and you end up with almost something that's similar to a TreeMap. So, it's about, if you have more than just two variables, five, or six or seven then, combining these charts gives you more and more. I am not actually make all of those variables visible. So, let me show you what I mean by this. So, the first idea is relatively straightforward. Is really combining different more normals charts together to create something that's actually new or using it in a slightly different way. So, the most obvious idea of combining different charts is really picking the basic elements of separate charts and then putting them together to create something new, or even better. A straightforward example is connected scatter plots, where you think you're looking at a timeline chart. I'm showing you right now one from The New York Times, about driving. It looks like a little line chart that's moving, and it's a really weird ways, but it's actually a scatter plot, where all the dots on horizontal, we have auto fatalities per a thousand people. The vertical and the horizontal way a vehicle miles driven per capita. Each circle here is one specific year, so the values for those two axes, one specific year. Because they are chronological, you can actually connect them by a line. So, more inspiration from a line chart. Then, we can see better to trends that are really going on. It's going up and down, and suddenly there's a large increase in auto-fatalities. Then, there are these annotations that explain what is really happening. This chart is maybe even getting so popular, or more popular that is becoming its own thing as a connected scatter plot, but that's how new charts really start as remixes from other charts. Another example can be something that's called a Beeswarm chart, which is really a combination of more of a histogram and a network chart. So, each of these circles here is a song, it's actually 2,000 best songs ever, and they're clustered to sit at the year of release. The idea is that on the horizontal scale, they're sitting as close to the year they were actually released in, but there is nothing that really guides the vertical scale. They're just clustered along that ideas. So, it combines this thought of a histogram with the thought of clustering and networking to create this new unique shape. Here's another example that's really combining two different charts. We have these circles here on the outside which is something called circle packing. The ideas is, this is based on occupations and you have hierarchies of occupations. So, here we have all occupations. Within that, we have management professional, and related occupations and within that, we can create even smaller groups. Eventually, each of the white circles represents how many people actually have that occupation, but to create even more contexts, I actually added bar charts within each of these circles to give an idea of what the age division really is off the people in these occupations, to see if it's mostly older or maybe younger, or if there's a difference in between that. So, this is really pushing bar charts into the circle packing. So, another technique is actually to combine charts in a more onion layered version. So, you have many charts and they all have one thing that's in common. Usually, that's time, doesn't have to be, I'll show you an example that isn't. So, they have time in common, and then you see different layers and you can combine them across the radius, and then give so much more context instead of just showing one chart. Here, we have an anonymized version of a visualization I once made for client, where we have this onion structure. So, we have these bar charts in the center, then something on the outside with colors, and had to do with more of a customer satisfaction. The axis, here we have new clients coming in and finally, there is these different kinds of marketing things happening. So, there's really this onion layer, and by combining these things, we can see, well we're there. When there were more complaints, was customer satisfaction going down? Or did we get a whole bunch of new client due to certain marketing techniques here? So, you can have many more variables in your visualization, but also the combination of all these things makes it just look more visually interesting and appealing and draws people in. Here's another example of this onion idea, where I've taken the number of traffic accidents that occurred in the Netherlands. I wanted to know if that's correlated with reasons why there could be more or less traffic accidents. So here, we have the traffic accidents in this layer, this is red line and within that, I've plotted the amount of rainfall in a very central spot in the Netherlands to see if maybe if there's a lot of rainfall, there are a lot of traffic accidents or if there is a less daylight, we don't see as well, so there would be more accidents in this area or in this period of the year. Even looking at snow days. Is that a reason why you would have more traffic accidents? So again, layering these things so people can see, trends or patterns emerging about why traffic accidents could be more or less often occurred. But you don't always have to time as the variable that connects all of the charts together. You can just have onion layers as onion layers. For example, here is a visualization I build up for the 50 different chapters that card captors occur which is a Japanese manga has and how these are connected. So, we have an inner ring of the main characters. Then, there are these lines that connected to an outer ring, that represents the 50 chapters. By hovering over this, we can see in what chapter each character actually participated. On the outside, we can see other things such as which colors were on the cover of each chapter or which people were actually in that chapter. So, it's here a connection between characters that combines the things together and not necessarily time. The final concept with combining it is more on the periphery. It's more the UI elements of one chart that you can implement in another chart. For example, in their visualization, sometimes you have more data than really fits the screen, and usual technique that you can use for that is to focus in context technique where you have all of your data, and here we are looking at baby names and their popularity with the most popular baby name at the top, and then number 10 here, and then across the different years. So, for example, in 2004, Emily was the most popular US girl name for a new babies. But we have data since 1808, but that's just too much to put into that screen. So, we have this mini-chart that shows all the data from which we can select a window that shows a smaller piece of that data in the bigger chart over here. We give the user complete freedom to actually select what they want to see. While this technique of this window started out for line charts, but I thought well, wouldn't that be real useful for bar charts as well? Sometimes you have lots of bars, but you don't want to either show the top 10 or the bottom 10, you want to be able to show all. So, after some programming and some headaches here and there, I managed to create this version where you have a brushable bar chart. Brushable is a technical term for this selectable window. Now, we can move this down and have the same idea and see more or less charts. So, it's the idea of how one chart is being used to make it effective and applying it to a completely different chart. Another version is actually using Voronoi which is a fascinating thing in itself, a mathematical technique but it can help with creating better interactivity. We are using a Voronoi to split up your data or the area surrounding your data into cells, and when a person who is hovering this cells, they cross from one to the other, so they get closer to one data point than the other data point, you're going have a tooltip chain between the two. So, you're seeing these blue circles here and these blue lines, and that you would normally not see that but you would only see the tooltip happening. But that idea of this Voronoi, this algorithm, is something that isn't applied to make the chart better. So, knowing what charts they are actually are that you could combine, starts with knowing where to look and the place that I find really useful is called the thedataviscatalogue.com, which is actually dataviscatalogue.com. Where you can see all of these charts, and you can see, select one and get more information about what they really are, and how you can read them. Sure these aren't all the visualizations in the world because it's a design practice, some people can be very creative, but it has a lot of visualizations that you can use to get started with your first combination of data visualizations. So, if you're just starting out with combining different charts, there are easy ways that are already being done. For example, if we have a scatter plot, where we have the dots and then the two different axes, where you can then use the idea of a bubble chart where you have the different size bubbles and make all the scatter plot circles different size, you add a new Voronoi. It can be as simple as that. Or if you have a bar chart, and you say you have different genders. You have females versus males. Instead of making them both below each other, maybe you can make it look like a tornado chart as they're called, or population pyramid. I guess sizing circles is often the easiest way to start. Instead of having the circles all be the same size, use that visual channel that you still available of sizing the circles to add a new variable that can give more context to the readers about what they're actually seeing. So, if you're a beginner with data visualization and going beyond this default then, two is are really good way to start, but it doesn't have to be two. It can be three or four or more. For example, here I have these three different charts. I have hierachical edge bundling, it's very difficult to pronounce, where we have these lines and connections. We have a bubble chart with the idea of sized circles. Finally, there's a doughnut chart. So, a circle sliced into different sections. If we then combine that and want to make that into a new chart, we can end up with this. So, this chart, where I have the inner lines, the size circles on the outside to give an idea of how often those lines are actually used, and then this donut slices sectioning off groups of the same element. So, combining three different charts to create something new. So, now we're done with combining it and going on to the next step, reusing charts.
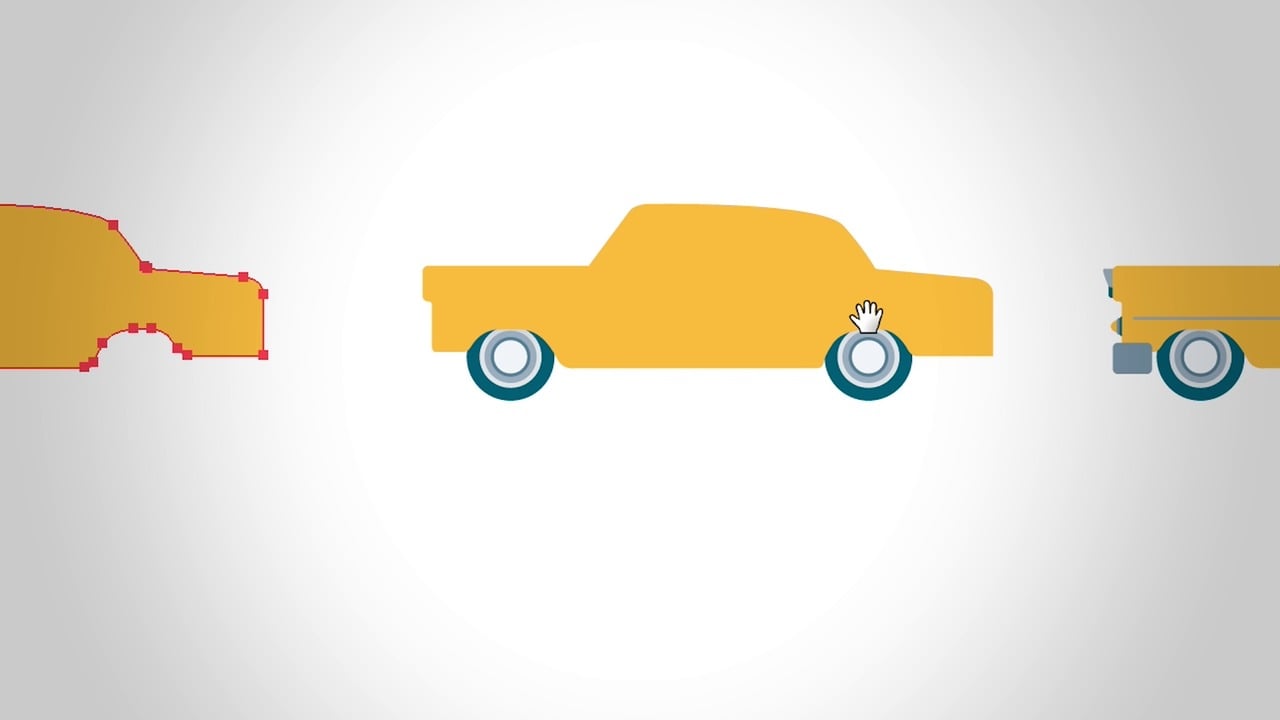
4. Method 2: Reusing Charts: So now, we're going into reusing a chart. It is again just what I say. It's reusing a chart in a non-typical way. So, we're using the basic elements of HR to do something else. As an example, we have doughnut charts, but if you are able to change the width of each doughnut slice, you can actually turn that into a radial bar chart. For example, in this animation I created once for a presentation. We start with a doughnut chart, and then we adjust the thickness of each slice, and we end up with a radial bar chart. So, here's another example of reusing even the doughnut chart for different things. Here is a visualization that I made of all 5,000 gold medal winner since the very first Olympic Games in 1896. There's a lot of data but that was my goal. I wanted to take these 5,000 data points and visualize them in a way that would invite people to actually investigate what happens through the history of the Olympic Games. But what really happens here is, it's a whole lot of rotated and stacked bar charts but I've made them by using doughnut charts. So, each of these slices here is kind of like part of a doughnut chart. But, because they're kind of rotated and they don't go the full circle, they're more similar to stack bar chart, so I'm reusing a doughnut chart to create such a stack bar chart. It doesn't actually have to be very complex, you can do these things in whatever tool that lets you do database not just the tools that I happen to use. There are many blocks on people taking the available charts from their own tools they're using, it could be excel, or tableau, or anything else, and how they've turned that into something by reusing a chart in different way. A resource that really helps me to also get better at the reusing different charts is Pinterest. It really helps me in the design phase. So, I and I have these Pinterest boards over here, very particular database Pinterest boards: Data art, Beautiful, Radial Clear and Simple, Geospatial, Vintage. In each of these, I collect the things that I've seen fit in each of this different subjects, and I go through these, then thinking about the data they have, the thing that I want to do, and then the kind of trying to figure out which of these sort of click with what I want to do, and because there could be different things. On the one hand, it could be charge like this, this bump chart over here, and I could save that. But I'm also inspired by this sort of more court diagram like chart. I can save them both. Because they see them both at the same time, I think, "Well, that's interesting", or the inspiration of one could help me on reusing the other chart in different way. It's sort of this collection of what other people have done that really helps me along as well. You don't have to reinvent the wheel yourself every time you create a visualization. Use what other people have used, remake what's out there. So, reusing is maybe a little bit more advanced than combining. Because with reusing, you have to be able to look at a charts elements and see them more in the abstract sense. The different pieces that they are instead of how they're always used. To me, this came sort of naturally. Because I always sketch my designs first. So, I'm not guided by the options of the tool that I'm using, I'm guided by what I have in my head and how I want it out on the paper. So, if I then create something that is a radial bar chart and then have to figure out how am I actually going to create a radial bar chart, which then sort of reverse engineering, I think, "Well, maybe I can use a doughnut chart and then turn that into a radial bar chart." So, it's more than- once you get more comfortable creating designs on paper that are not that typical, then you become really good at using your available charts to actually create what you have in mind and put on paper. Because you that dot on the horizon to actually aim for. So, even though reusing it is slightly more advanced, I mean it more in the way that it's conceptually more advanced. It's conceptually a little bit more difficult to actually come up with it, but it's necessarily. I'm not talking about programming. You can do reusing with any tool, Excel, or R, or D3. It's about reusing a chart that is available in a slightly different way. You don't have to program to do that, you need to be smart and creative in how you're going to take that chart and reuse those elements in a way that maybe it wasn't meant to, but you're creating the thing that you wanted to create. So, that was it for reusing charts. Now, we're going to look into designing charts.
5. Method 3: Designing the Visuals: We're now going to look into designing your charts, and with this, I really mean the visual elements. So, the fonts, the colors, the layout, the exact placements, the effects, and how that can actually transform a chart for something that's not nice to look at to something that people will actually want to investigate. So, for a lot of tools that let you do visualization, the defaults are actually not that good. I don't blame them. I mean, the programmers that made these tools possible like something like Excel, they weren't database experts, they just did what they thought was right. So, by just making these visual elements differently, you can highlight the things that you want to highlight and dim the things that you don't actually want to stand out, like gridlines. Gridlines shouldn't be black or they shouldn't have to be blocks around a chart, you can dim these or remove these. So, those are the simple things. So, don't trust your tools defaults. So, as an example, here is a sketch that I made for my baby names visualization. I knew I wanted to do something with position from 1 to 10 and then place them from the years 2005 and on and then each line would be a specific baby name. So, this is very simple. I haven't really thought about colors or these things but you slowly start adding that onto. Here would be the first visualization that I had working from day three. So, this is the first time I saw something successful on my screen, and it's not looking pretty at all. We have all of these axes in the wrong locations there. The lines aren't even connecting and we have this awful rainbow like skiing, but you start to changing things up until you get what you want. You start changing, maybe I can do something with the colors, because right now it's more of a confetti of colors and they're more distracting than anything else. So, try and create a color palette that is I guess less colors than this, and you can also use that in a way to have another visual channel to put data into. For example, the first letters of the alphabet are so normal to us, we can even see them in this ordered fashion. A is one, z is 26 and then somewhere in the middle, and therefore I thought well, why don't I create a color palette that looks at the first starting letter of a name, and then applies this to the lines. So, in the final result, we still have some nice colors going on, but now it's less visual cluttering and actually data in there. In the same way, by designing it, is again the idea that, I don't really have grid lines in here because they're not needed, and I look at my fonts, they are small but not too obtrusive in a way. They're there for people when they want to see it. So, with charts, what you really want is that the data is the first thing that people see, it's not the numbers, not the gridlines, not the legends. So, you have to figure out how to mute the gridlines, the axis in such a way as to make it less obvious, so the data stands out when they want to look at it, and then if your eyes are searching for what I'm actually looking at they then find the axes and the legends. So, there are three things that are my favorite things to actually play around when we're talking about designing. My favorite one is color. So, color is so important for your data visualization. Maybe it's even more difficult to create a good color palette for a data visualization designer than it is for a typical graphic designer because now your colors typically also have direct meaning. So, they need to be able to fit that and look good together. So, it's not a bad thing to actually spend a good deal amount of time trying on different color palettes. You can either be guided by the data itself, for example, if you have something about characters for a specific animated movie, maybe they have their own colors of how they physically appear, it could be the client's brown colors that guide you, but don't try too fix at that because usually brown colors they are too similar so you have to play around with that. A way for me I always start with a rainbow. It makes my screen more fun to look at when I'm in early development and then when I start playing around with it I notice that some things aren't working and I figure out that well, this is actually maybe more of a orangey red kind of vibe that I'm having now with the way my data looks. Maybe it's about flowers and that can be very bright, maybe it's more muted and I need more blue. So, take your time to actually sit down and look at colors. So, besides colors, and then I guess my favorite thing to think about is layout. So, how do you really lay out your chart? Because it's not just the chart that matters. Where do you place your title, where do you place your legends and your axes to make sure that people look at it and consume the information in the way that you wanted to consume. So, typically you want them to look at the data first, then they move to the title to understand what they're actually looking at, then the gridlines and the legends come into play and maybe then some sort of extra annotations that supply more information about what you want to say. So, thinking about how you're going to put these things in order you can think about, well, in the West people are used to reading things in a left to right manner, so try maybe lay it that. So, we look from top to bottom so the less important stuff comes at the bottom. That's how you think about layering things and also look at webpages, and more general I guess magazine designs can give you great inspiration on how you can also use that in your own data visualizations. I mean, inspiration really doesn't have to come from data visualization alone. I was once inspired by a peacock feather to create this visualization about Olympics. My final technique that I prefer most for designing charts has to do with effects. So, it's really the attention to details here, and these are just some examples, some very specific examples. Depends on the tool if you can actually do this, but it gives you an idea of how small are some of the effects that I'm talking about. So, the first one here is connected to colors, and it is about blending modes. So, if you're a Photoshop or Illustrator user you probably know this, that it's how colors if you place them on top of each other, how actually the resulting color will look. In data visualization, this is actually really useful for several things. So, let me first show you an example of what a blending mode really is. So, here's a small example that I made about blending modes. We have multiply and screen, those are two blending modes that I like a lot. The one makes things look whiter the other makes things look darker in a very simplistic sense, and when it is wider, you get this nice technique of it looking as if they are more Caribbean created from the same spot I find. But, let me show you one of these is actually using no blending mode. So, the difference is quite stark I find. So, here we have a blending mode going on right now, and now we don't. You see this circles are just way less interesting to look at, but it's actually useful as well. For data visualizations, you often have overlap, but it's not always fair that there's overlap going on. If you have line charts of the average daily temperatures in 2015 of different cities, you plot maybe New York layer then Amsterdam, and they could overlap at some point, but why should New York be on top of Amsterdam? I mean, all this cities are of equal importance. So, that's when I use blending mode to actually make sure that where the lines cross that there's sort of a different color going on that from which you cannot see which line lies on top because the colors are blended. This is also true for circular scatter plots, where again these are slope charts, very interesting charts, I suggest you look up what they are, but these are slope charts where the circles are overlapping on the left and on the right. Again, why should an Impala overlap an Antelope. So, this is very much dummy data I created. That's not fair, they're of equal importance. So, I can apply this blend mode to then make it less apparent which one is overlapping. You see that they're overlapping but is not apparent which is overlapping which. So, mixing blend modes has real use for making your data visualization I guess more true, but it also has a very interesting visual side. Something else I try and play around with is gradients, and these could be radial gradients or linear gradients, and in a very silly example because I used to be an astronomer, I like to create astronomy related data visualizations. I have this chart with our nearest stars plotted into so-called HR diagram. So, to make this visualization a little bit more interesting, since stars are spheres in reality, I made them look like spheres over here and not with the essence of making in 3D, but more lifelike. Or even here where I'm trying to make them look more like the glowing orbs that they really are. By using radial gradients, by making the outline maybe a little bit darker, the inside a little bit wider, it gives more dimension to all of your circles instead of making them all flat circles of the same color. So, another fact I use a lot, and this one I'm showing more because it is the inspiration I got from this technique which is called the gooey technique, you can see these circles going around on my screen. I got that from a loader that I saw on the web. So, sort of waiting loader, and I saw that I thought wait, that's super interesting. I can take that code, grab or take it out of there and use it on my data visualization. So, wherever the areas that you're working at, you can take inspiration from wherever. But this technique I like to for example have here, where I'm visualizing the 150 largest cities in the world. For a fun effect, you can have them all grouped together into one clump or have them break apart from one clump in this gooey effect. But also when they go back together and some of these cities are in the same country, when they go back together, they become clumps as a country again instead of this separate circles. So, there's again the use of a real database use because it gives the viewer intuitively the idea that they're looking at a full country again instead of separate cities. This can continue. You can create motion blurs that in D3 that you can use to maybe say the top running speeds of certain animals. There is an anatomy of gradient that you can use to highlight flow here in this one of the most famous visualizations ever made according to some people, Minards visualization of Napoleon's march towards Russia, and then back again to show that the troops were going that way towards Moscow and then back again here in black. My final piece of advice for this one would be when you have labels and legends to always place them as close to your actual data as possible. In this example, I have a dotted chart, and what I see often is that the legend is to the side with the colors and you would have bluish with cheetah and then greenish with Dolphin, but then people actually have to go from that doted chart to the legend and back and forth and back and forth and have to keep them in their mind what each color was. So, here it's actually quite easy to just move the label, so what each color means to the chart itself. So, maybe when you're coming to Data Visualization from more of a graphic design background, you have a better feeling about how you can do these design things, and when you're more from a data or programmer side you feel like you don't have the knowledge to do this but that's not true. It's the small steps that make the difference, and by really paying attention to designing your charts, you can make something that looks also more beautiful and more professional, and you can really see the result that it has on the people that you're showing it to. People are just generally more attracted to things that look better, and they believe things that look better are true. So, there are many benefits actually putting in that time to think about what colors to use, what things to hide, what things to highlight, what things to annotate if you really want your data visualization to be as effective as possible. All right. Next up we're going to look into hacking our visualizations.
6. Method 4: Hacking the Code: So, now we're hacking your visualization. With hacking, it's a little bit of a gray area, but I definitely mean when you have to really go into the source code of an existing visualization and adjust things quite drastically. But, I have to admit, I also find when I see some charts created in tools where you cannot actually go into the online source code, but they've been completely changed from their initial chart and it isn't something different, that works fantastically well. I still won't call it hacking it, even though there is an overlap with reusing and combining it. But, in general, it's just the most advanced level of going beyond the default. So, what hacking it, I think the most important thing to remember is that you don't have to start from scratch when I have created or designed something that seems completely new. There's often something out there that closely resembles your design or idea. So, the idea is that you can start from that as your base and then start adjusting that until you have what you want. Of course, this is slightly tool dependent on exactly the thing and how close you can find that thing to the idea that you have. But, trust me, somewhere on Google somebody has created something that's closer to your design than just nothing. So, for this as examples, I actually want to show you the same chart and how I hacked it in three different ways. The basic is called a chord diagram. I think it came from genome visualizations with the genomes of animals and humans. But, it's now part of D3. It's a standard chart that's easier to create. That's why it became part of my arsenal of possible charts. It is quite a difficult chart to explain to other people though. That is a whole other story on its own, but generally this is how it looks. So, you have a circular element where are these the flows between sections. So, here we have phone brands and how people switch between the phone brands. I won't go into the details, but there are connections here of people going from Nokia to Samsung, or the other way around, and that many more people went from Nokia to Samsung than from Samsung to Nokia. But, this chart has so many interesting facets that I could reuse in different ways. For example, I thought even though for a normal chord diagram, these flows, so from Samsung to Nokia and back again, they are asymmetrical. They're not the same. But, if they are the same, the chart actually becomes a lot more easy to understand. So, I made an example. Here, about all the movie collaborations between the Avengers and the MCU at the time. The thing here is that, if Iron Man appeared in a movie together with Black Widow, the reverse is true as well. So, here are all of these connections are symmetrical. The thicker one of these chords is, that more often these two characters have appeared in that movie together. Here, it's actually a little bit more of reusing, because I've not gone into the underlying code. The only thing I did is really think about how to structure my data, so that the visualization would do it in the way that I wanted it, and I don't have any of these hills. Here we have a visualization that shows what people have done for their education, and what occupation they end up doing a year and a half after graduation. This one is also based on the chord diagram. It starts with this one and it turns it into that one. So, there are a few things going on here. So, to show you how I created this chart, it starts off more in the reuse term of things, where at the start I had to create. So, in this version over here, these chords are going from everywhere. So they're going from here to there, all the way across, just a little bit to the side. But, I wanted it to go only from left to right, left to right. So, I had to figure out how to construct my data to make sure that that always happened, which here you can see a screenshot of my notepad. Then, I made that visual. This is my starting point at that time. It was based on the normal chord diagram, but with only with the data adjusted. I thought, well, how can I create this gap. Well, what if I add a dummy chart that has no information and then I rotate the entire thing, and then I just hide it. So, now the gap is there. In essence, this was what I had in mind, but not quite. So, this is how far I got with reusing it. So, I'm creating this chart from a chord diagram, but now we have everything going from left to right. We have this gap in the middle, it's not quite typical. But, it's really, it's almost a hack because there's something there, we just don't see it. But, I wanted these two to be, I guess, more pull apart. Because that's the thing I drew. That's the sketch I had in my mind, which is this sketch over here. So, these two arcs over here going from education to occupation, I apologize some of the text is in Dutch, with these were just a little bit more pulled apart. I'll go very specifically to D3 where I was hacking my way into. I could easily move these outer chords outward, but for these inner ones I had to dive into the source code of D3 for the very first time, which I found particularly scary because I hadn't been programming with the Web and JavaScript and HTML and CSS for a very long time. But, luckily it was only a few very small horizontal offsets in a few locations that give me this. With some better sorting, I ended up with this, which I found visually more interesting than the one I had before. Just put a small change in pulling them apart. That gave me just by trying something small, gave me the confidence to maybe do that more often. Go into D3 source code more often and hack my way to the chart that I wanted to create. So, with different colors and the actual data, that's how this one came about. The final one is where I truly hacked away. I want to create a visualization about the Lord of the Rings. I found this fascinating dataset about number of words spoken by each character in each scene of all three extended additions and I knew I had to do something with that. So, I had a sketch made where I placed the people, the members of the fellowship in the center, and then the locations where they spoke around the inner circle, and then they would be connected by these strings. The thicker the string, the more words that that person spoke at that location. I didn't know of any tool that could actually create this chart, but it reminded me of the chord diagram with these arcs going around and then these inner chords flowing. So, I thought maybe I can start from there and see how far I'd go. Here we have, in some basic steps, so this is more on abstract sense, the different steps that I took. Now, I animated them smoothly just to show you how that would go. But, this is the basic chord diagram that I started with. At first, I dove into D3 source code and I've tried to figure out what's the most fundamental thing I need to do. Well, these chords they need to stop in the center to be more specific for my design. If I cannot figure that out, then probably this isn't the right way to go. That's how I see these things. I typically when I remix things I try and do that in small steps. I don't plan everything ahead. It's more that I try and figure out what's the next most fundamental step that I need to do to get it closer to my design. If I get the first few out of the way, then typically you're already in the more design-it phase already. Once you have the first major steps done, then you're sure that's going to work. If it's not you have to compromise and maybe do something else. But, no need to plan everything out ahead. So, here I needed to get these strings towards the middle. I dove into D3 source code and actually got that to work. Getting rid of that excess space that was apparent was next step. Well, maybe having the actual Lord of the Rings data, which was a little bit more, and some more appropriate color palette was also getting around that time, a good thing. We have nine members of the fellowship. So, next major thing was to actually make sure that these interests locations ended up with the right location. But, now I can see that my design was actually missing something. This was getting way too squished. So, I could barely read Gandalf or Legolas at the bottom. I thought, well, I can just pull the two halves apart. Let's see how that looks, because these two just happened to be kind of 50-50. So, that worked out. Then the final thing, this is really more of a touch. Attention to detail is that I adjusted these chords, which was also again inside D3 source code. So everything looked a little bit more natural in this particular case. Then, there are some attentions to detail like using Elvish to explain half the Mordor and how you would say that in Elvish. I think I don't know how to read it, the thing on the ring. There is also some interaction going on here. The idea here is that I started out from that chord diagram and by going into D3 source code by starting out with here the original, I guess, function that creates the chord diagram, I could then slowly mutate that into this new chart, that I call the loom chart, with the strings on the sides. You can barely see the original chart in here, but it's still a completely new chart that you can use for different reasons. So, that's what I mean with really hacking it. Just making it your own, but starting with somebody else's fantastic work. So, another tip. If you have or if you're working with tool that lets you do more interactive charts is to supply an interaction. It doesn't have to be very grand or anything. Hovers are a really good way to give focus. So, in this visualization with the words spoken in Lord of the Rings, there are many of these inner strings going on. So, by just having an interaction on a hover and highlighting only the people that spoke there, you can provide the focus, or vice versa, when I hover over a character in the Lord of the Rings. I see only the locations where he spoke and as well hide the ones where he didn't speak. Because it's not always about showing the information, it's also about hiding what's irrelevant, so that everything that remains is relevant. So, hacking is actually the most advanced of the four techniques. It comes about when you feel comfortable with whatever tool that you're using to create your visualizations. So, with the examples that I showed you, I was mostly referring to D3 because that's the tool that I've been using. But, you can also hack things with Excel or Tableau or ClickView or Looker. It's about that moment when you are so comfortable with the tool that you're using that you know of ways to do things or combine things that you even never know it's possible. It's about no longer you conforming to the tool, but the tool conforming to you instead. You can use everything that you have at your disposal, and your knowledge, and create something that nobody can see what is actually based on originally, and it's super effective and super new, and people would want to see it and recreate it. So, although there are many great tools that let you create data visualizations, in my personal opinion, if you want to go and create these more effective, creative, and unique visuals, I would definitely recommend you learning a little bit about D3, or actually a lot about D3 if you enjoy it. D3 just lets you shape your visuals the way that you want to. It's like Lego blocks that you build together to read the visualization that you want. You're not confined by click boxes or drop and dragging stuff. It's much freer than that, and that's why you can create these shapes that are completely unique, but customized some data that you have and the goals that you're trying to achieve. So, although you can do lots of amazing stuff in Excel, you will never get to this point that you can do with D3. So, if you're really passionate about data visualization, really try and get into programming so well, it can take you three levels up.
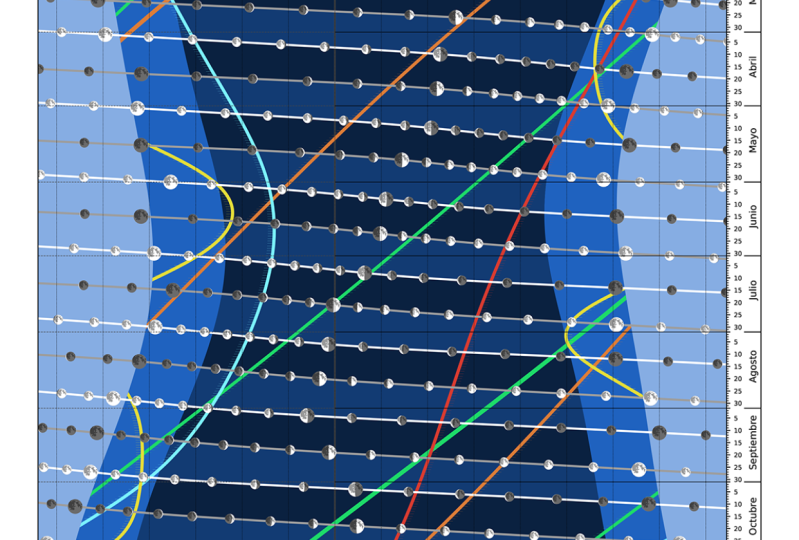
7. Tips & Tricks for Gathering Data: So, the one most fundamental thing for data visualization is actually having data. So, I want to show you a few tips of how you can find data online. For here, it's important I think, when you create your visualizations, especially your personal projects where you want to learn, is that you find a subject that truly interests you on a personal level, a question that drives you personally. Such as for me, I wanted to know how many words that the characters of the Lord of the Rings had spoken on different locations. I was driven by knowing the answer to that, and that eventually led to the visualization. So, instead of maybe going to a government website and trying to find some dataset on the population in different cities, try and find a subject that truly interests you and you'd be surprised what data you'll find online. So, the most straightforward and easy one is actually just Googling. Google your topic together with the words data or dataset, and then really having the patients to click through the examples in the first two or three pages of results, and what you'll typically can find is one good thing in between there. I call these one-off structured files, they're hidden within some GitHub repo, or they are hidden within a Google spreadsheet, or maybe just an Excel file or a CSV file. So, it's a website that is specifically about that topic. There are websites about all of the Nobel Prize winners, there are websites about all of the nearby stars that some satellite has actually measured. A final interesting dataset that I managed to find by just Googling is a genealogy dataset of 3,000 people connected to royalty that went back more than a millennia, so like a gigantic family tree of how the royals are connected together and how intermarried they are now, which I turned into a project as well for that personal year long collaboration that I did. So, there are also websites that contain structured information, but not in some ready to download format. So instead, the data in essence is fixed inside the HTML itself, it's fixed into the way different elements are styled on the page. For example, IMDB, you can search for some movies, and then you get this list of movies returned, and all of these movies are contained within the same styling of divs and other elements. I can therefore download that html and search for specific styling. All of the movie titles for example could be contained within an H1 of class movie title, but you don't have to program to do this necessarily, there are tools out there that let you do this with clicking and dragging and setting it up, I've tried them, they're quite amazing and you can get really interesting data from them. There is for example, also on amazon I could find the list of the 100 top-selling fantasy authors that I could use for a books project later on, because, another way to find data online is with APIs. I have to admit though that I don't often use these because they can be a bit of a hassle to set up, but nonetheless, there are times when the wealth for information is just too good to ignore. APIs come around when for example a website or an app has so much data that they just can't put it all out at once, it's just too much, so you need to be very specific in what data you request. And so, with those 100 fantasy author names that I've gotten scraped from Amazon, I then put these to do the good rich API, to request information about the top 10 most rated books of each of these authors. So, gathering info about the number of ratings, the average ratings, title of these books, these kind of things. Thus, even you can combine these different data finding ideas to get to the final dataset that you're looking for. You can also ask others for advice, if you don't know maybe somebody else knows. You can ask them directly to your colleagues or maybe on whatever social media that you're on. So, for me that is Twitter, and for one of the months of our personal collaboration I didn't know what to do exactly. The topic was community, and I knew it had to be something that would fit the World Wildlife Fund, but couldn't get it any more precise than that. So I asked Twitter for advice on what data or what topics that I could actually look into. Then it got lots and lots of very interesting links that I started browsing which led me to new links and so on, until I finally came across this website, where I saw the the greenness as measured from space in a particular week in June and then I knew that I wanted to do something with this. So, eventually that turned into this project which is, well, visually very minimalistic but that's what I wanted. I wanted something that would be easy to understand, about how the world changes in it's greeness throughout the year. Finally, you can create a dataset completely manually, you don't need any code. For our nostalgia month with the personal collaboration that I had, I went into Draggable Z that I used to be a fan of that. On Draggable wikipage I found these lists of all the fights that happened during this anime, because the anime is about fighting, I thought it would be very fitting if the visualization would be about all the fights that happened. So, I just copy and pasted all of these lists into Excel and split them apart with some of Excel's simple functions into the dataset that I needed. For another month in collaboration, I was looking for data on butterflies and I searched for two hours to find a really proper dataset for butterflies. But eventually I had to resign myself to the best options into the contained within the website called gardens with wings, but I didn't want to have to program my way into all the information that was here. So, I just clicked through all of the options that were there and copy pasted the information that I needed into a final file of about 90 butterflies. It took me maybe another hour, but then I had this very unique dataset that I could use to create a visualization about butterflies. What I want to show with these different things is that there's not just one specific way to find data, especially online. There are so many different ways of Googling and finding the straightforward CSV and spreadsheet, to scraping it or even just doing it manually. It's not just hardcore data analysts would have those magical skills, and it really helps if you're driven by that personal project, that personal quest about that you're truly interested in to find the data that you need.
8. Final Thoughts: So, now you've seen all four techniques, the next thing that you need to do, is create data visualizations following these techniques. The best way that I think you can do this is by picking a topic that you are truly passionate about, thinking about a question about that subject that you want to know and then going out and trying to find some data about it, and then visualizing the answer to that question that you have. It will be amazing if you then share your result in the product gallery, so I can see it, and other people can see it. Because again, inspiration comes from each other. So, sharing is really the best way to grow in this community and have other people give feedback on to you that you can use, and to create better visualizations the next time. So, when you create your next data visualization, I really hope you think about these four techniques to creating more effective and beautiful visualizations, to make it more personal, more unique, and really push your work to the next level. So, thank you so much for taking this class and I really can't wait to see your work.
 Nadieh Bremer, Data Visualization Designer and Artist