Transcripts
1. Introduction: Hello. Do you find yourself struggling to come up with the right look and design for your reports? I know that's how I used to be and it was such a pain to figure out how to give reports that professional look. I always hated showing what I created because I feared my boss or my clients would think that I would look like an amateur. Well lucky for you and me, I came up with a foolproof method for creating something truly gorgeous to show off your Power BI skills. After this class, you'll be able to create stunning reports that fit exactly the vision that your team and clients are looking for. This is the method that I developed that is meant to be fast and effective. When I start a new project, I want my clients to quickly know what they want the report to look like for me to be able to create that design efficiently without spending enormous amount of time on it. I know that if I show you the basic framework for my technique, then you'll be able to take it and make it your own. Now I know a normally not a teacher, so I apologize if this class is not as polished as some of the other ones you're probably taking. But I thought my method is clever enough to be worth sharing with others. So just to give you some examples of what you're going to be able to build. This is a report design that I've made previously and that I now have as a template that I use for new clients and new engagements. This is another one. And the basic idea is that we can start from complete scratch and create these designs and come up with the ideas for the design and how the layouts are, the colors, how everything should be set up to make it for a really easy way for your clients or your boss or your team to see all the data that they're really interested in. And what's nice is with this method, you can actually start to compile all these different template designs that you can put together that you can use for each new project. So once you have a design made, you can use it and show it to new clients or new projects. And they can kind of pick from the ones that they like. And you can use that as a starting point.
2. Finding a Design: As the first step, you need to come up with the idea for the design. Now I personally don't like starting a project without least getting my clients to have an idea of colors or layout or a general design, a basic end vision of what they want the report to actually look like before I start. Now, I'm not a design focused person. I'm not particularly artistic. So what have people like me do? Well, we start by looking for inspiration. Now let's find a design that actually makes sense. So before I start, I think it's a great idea to have at least a place where you can kinda gather together all your different design ideas. This is a library of all the different designs that you find that you might not use now, but in the future it'll be just so much easier to find them. And I think you'll get an idea once I've walked through finding the different designs, why it makes sense to kinda put it all in one place so you can reference it in the future. So the way I do that, you can do this in PowerPoint or a Word document or just save the images and put it in a folder. But what I've actually done is put together, I like to use Notion. And so I have like a little notion database of all the different designs that I've found over the years. And I kinda went through and just put in a hundreds or so different designs. And what's night at least about Notion is that I can share this individual library with my clients. And I basically just ask them, Hey, look through this, tell me which one speaks to you, which one you like, all the different layout and colors or whatever. And then we use that as the starting point that gets them to, at least from a project perspective, buy into a specific design and know what we're going to basically look like before we start. That makes my life a lot easier. Say that I ask them to look through here. They might look at a particular design and click on it. And then they say, okay, let's start with this one so that at least makes life easier for me and I want to make life easier for you as well. So the first place to find design ideas and inspiration is one of the simplest places is just Google images, right? We're going to search for Power BI report. You can do Power BI dashboard or anything like that. And all we're doing is just going to scroll through these images and look for something that speaks to us, right? So the same thing as before. If a design catches your eye, that looks particularly good or it looks like something you think you can accomplish. I would suggest just saving that image and putting it into some kind of database like in Notion or anywhere else. So this is one place I won't bore you and spend too much time on Google Images. I figure most people know how to use it. The second option, and I just want to go through a couple options that I think would work well for anybody to find a great design idea. The second one would be on Pinterest, again, another kind of image search website. So if we use search more broadly for like a business dashboard, you'll find a lot of really cool ideas and design ideas. And even if they don't aren't reports at a built-in Power BI, I'll show you how to basically transform any design that idea into something in Power BI. Now, this is actually a great example and I'll try to zoom in a little bit on this image. What you'll have to do as you go through these design ideas, you really have to make sure that you pick one where you know you can actually accomplish what you're looking at. So automatically by looking at this image, I can see there's a problem with this particular visual in the middle. It would be a little bit difficult to accomplish the way they have the kind of the background of this visual here, everything else looks fine. I know there are visuals in Power BI components that I can use for these KPIs up here and these charts here. But this one is going to be a little bit tricky. It can be done, but I think it would be a little bit tricky. So you can kind of look at a report and as you get more experienced and you understand everything better, you can basically start to look at certain visuals and say, Okay, that's going to be a lot more challenging, then say some other design. So I think that's just an important note as you go through and create your little portfolio of ideas to make sure that, you know, you don't put yourself in a position to bite off more than you can chew, where you're going to have to let your client down and say, well, I can't actually make it look like that. So Pinterest is a great option for that. Now, there's probably a lot of other places you can search for images. Some of the ones that I found a really great That probably wouldn't come naturally to a lot of people if you go to dribble.com. And so this is a, as far as I understand it, a place for designers to kind of show off their work. And I think for that It's awesome to get an idea of what very design focus people think a great dashboard would look like. And this is just awesome. And again, the little bit of the problem with this one is that you can run into a challenge of how on earth you are going to actually accomplish the design. So be a little bit careful about promising to be able to replicate or to do something inspired by it. Something like this would be pretty challenging. You would have to do a lot of changes to the visuals to get something close. But at the same time, we can use a lot of what we see as inspiration, right? We can like the colors here. I really do like the different very faint background colors on some of these KPIs. I do like the structure of it and the layout. So in that way we can use any of the designs on here as really just a great starting point for thinking about how you're going to make your own report look beautiful. I think the last place I'll cover that I found to be really helpful is canva.com. And so if you go under business presentations, so these are supposed to be slideshows that people use, but they can also just be a great way to find a design for a report. So the thing is these are obviously presentations. So if you find one with some color palettes that you really like, what you can do is actually just come in and create the presentation itself. And then just hop between the pages and see what some great options are. This is actually it looks pretty good. This could be a great slide for a Power BI report with the title and then this little accent piece on the right. These are just great places for you to understand, like what could look really good in a report, right? Like even something as simple as this, just the finer details of the title, the subtitle, this little accent piece on the left, this little dot as an accent piece. These are all great ideas that if I had to come up with them on my own, was super difficult. But by seeing it first, okay, now I can really take inspiration from this. So like I said before, I really recommend that as you come across ideas, you take the picture of it. You put it into a little notebook or a portfolio where you can remind yourself of these great ideas so you don't have to keep coming back to Canva 10 different times to find a bunch of ideas. You can kind of go through one presentation and find like five or six different ways of creating a great looking report and just make sure you save that for the future. So next, what we're gonna do is we're going to take one of these design ideas and I'll walk you through the fairly simple process of taking that idea and translating it into an actual working Power BI report.
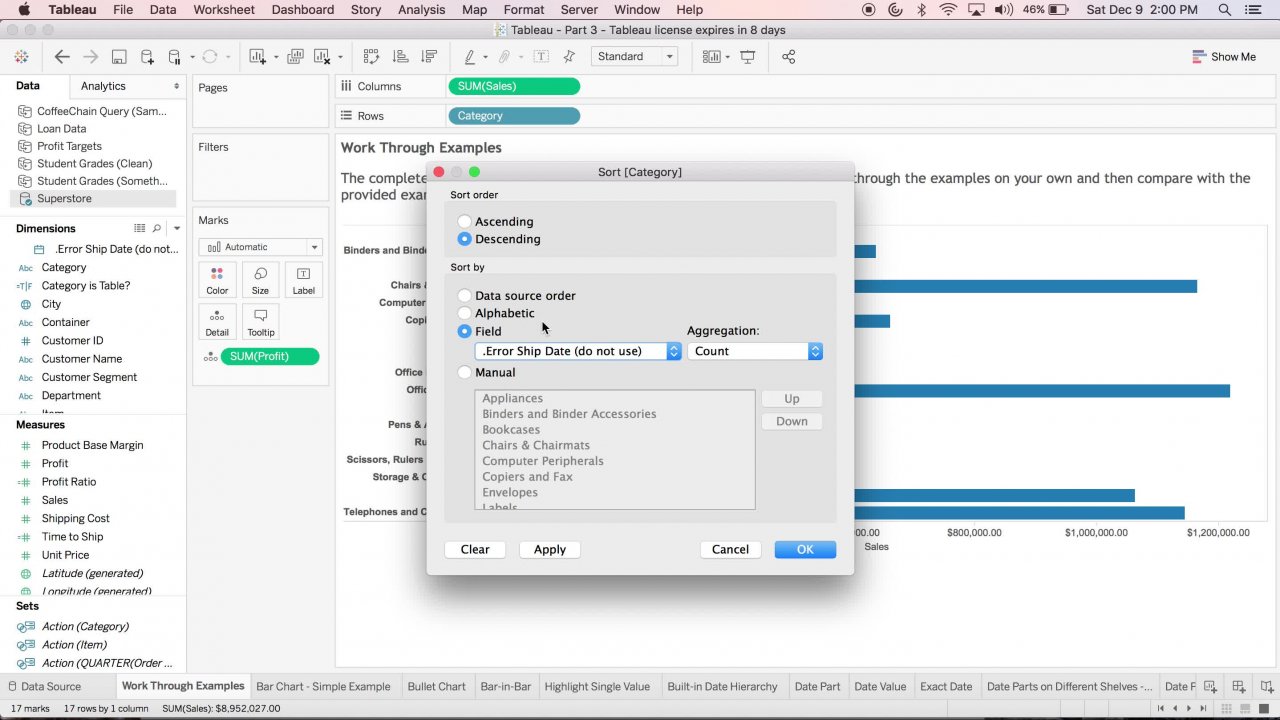
3. Building the Report: Alright, so we can get started on actually building one of these designs. And so I'm just going to walk through a fairly simple example. And I think you can pretty much understand exactly the method that I'm using in order to create basically any design that we find and kind of extrapolating on it. You know, you don't have to copy exactly what you see, but really just use it as kind of a springboard to fit to whatever project that you're doing. So here's the example that I've found and I've used before. So to get started, what I've actually provided in the class is a template file that kinda makes life a little bit easier. I would like to start with at least some specific fields and data in the file itself. And that way it makes really easy for a place holder. So that when I'm putting visuals in and kinda making the layout, I want to just put something in there to just get an idea for what will the colors look like. Being able to put titles and axis titles and kinda all those little details that you kinda have to clean up as you're building a report. You can just kinda get them out of the way. To begin with. That way, once you've pulling your data and you're ready to go, you just have to worry about the calculations, right? You just have to build the KPIs. You just don't have to worry too much about fixing all the colors and things. You can just kinda drag and drop things in. So that's what's really nice about at least having kind of a starting point. And what you see here is the starting point that I've created and in the template file in the course, you can use all of this and it's really just very crude. I have a date table here that's connected to some of the other data points here. And really this just provides you the ability to do some kind of sales over time and different things that actually look pretty okay. And just again, just the place hold while you're building the report itself. So you'll see me using it as I build out this report. So typically the first step is if we take a look at the picture that we're using here, I would like to just use something like snippet to just grab the picture here. And that way I can just pull it into 3D paint. And the main reason here is I just want to get the colors right because I really like the color scheme that they have. And maybe I can make adjustments instead of orange or something else. I can just switch it to a blue, but we can just start doing each of the pieces. So if I grab the little tool here just to check what color it is, then I get the hex. I can just copy paste that. And then I can just hop in and start with the background here. So this just make life really easy to just start getting what we're creating to match exactly the design that we have. So I think you can kind of understand at least the process that I'm going to be going through here. So if we look at our design and a couple of floating elements, so we're just going to use shapes for these, these bigger picture items. So you can see we have a square here and a square here with some shadow on it. And that's really all we're gonna do, right? You can see how this method is going to be extremely quick and efficient because we're not going to waste a ton of time building out all the little details, or at least trying to think of all the little details. So I just created my shape. I'm going to have to do some adjustments here. And I'm going to be moving a little fast simply because these are all just the rudimentary items within Power BI. And this is not going to be a class where I've walked through every single formatting shape item on the left. All right. Probably because as a new updates come out, this is kinda change, but really I just encourage you to understand all the options that you have so you can really make the reports exactly how you want them to work. So if I just go ahead here and there's some items I want to change just to make sure everything looks good. Lot of times you have to check the outline, the fill, and so now I'm kind of just getting the basic gist of it. So I have my two shapes. Come back to the picture here. I just want to check what color were they using for this bottom shape. Okay. I just grab that. I hop into the background of that shape and then I just remove the fill and there we are. So if I just deselect it, so now you can see we're starting to get there, right. We're kind of already at the place where that's what they had built here. So some of the other elements that I can start adding, like we can see there's a little bit of a shaded white transparent area here for the top-left in the kind of the title section, again, you can just grab another shape, put it up here. Then we can maybe do a background. Parents see something like that. How does that look? Just make an adjustment here. Remove the outline. And so another thing I encourage you to do is if you want to, I typically am either too lazy or I just don't feel like messing around with the current theme file because that will control a lot of the colors and all of the options you see that outline keeps coming up. I could come in here and turn some of these elements off and to make sure that the colors really match what I'm looking for. But I find these theme files to be kind of infuriating to use. So I like to kinda just make it how I like to and then reuse the visuals throughout. So you can see here we have the basic premise. So let's start popping in some visuals. So we'll do What did they use here? So a column with a line. So we'll want to put this in here and you're going to see, I'm going to just keep hopping back and forth and see. Okay, so now I can do what I had before where I can just drag in a date. I'm just going to make it look nice and total sales. So you can see, it's kinda nice to have this visual here with some placeholder data. So I can just place it and see what we're doing just to align the corners. So you can really get all the details exactly how you'll like it. So you can see how just getting this in place. So that looks pretty good. And we could even check what's the background color here because that's not an exact white. So we can come in here to background. Switch it. All right, that looks pretty good. And we will want to check all the different details. Like put the alignment of the title and the middle, change the color to hear a little, something a little lighter. It's too light. So you see the process here. It's a fairly quick way to just get the design into place and get at least some level of design that is already done. And you can see this recording has only been for about five minutes and it took me about five minutes to put together does design. And I can kinda walk through all the different areas to match everything. Of course, I'm not going to waste your time by sitting here and make an absolute perfect mockup design here because I think you get the idea of the process for building this. So that's really all the goal of this course was the kind of put you into a place where you can start to make all the adjustments to get a design that is exactly what you need for your team. So you can see where I'm walking through all the little areas. Like I can see the titles of the axis are not quite right. So let me find the title color. So you can see once we have one that works, I can just copy paste those two others. And that's really it, right? So once we have all these things kind of in place, maybe if I just add a line value. You can see here in the colors area we can go Data Colors and switch to the red, which is matches up with what they were doing in the design that we're following. So this was kind of just a walk-through of how I can get started and get a design going very quickly to match something that I think looks really nice. I'm gonna kinda cut it here because I think you get the premise of it. If you have any questions, feel free to start a discussion in the class or anything like that. And I'll be glad to help and answer any of those questions. So next what I'm gonna do is just walk through some of the tools that I think are super useful for building really great looking reports that can add really some of the extra detail in there that makes it look great.
4. Additional Apps: So to make a report really look extra special, I think sometimes you can take steps to just add more detail. And so interesting elements to it, such as a much more interesting background or icons, or just putting a little more thought in detail into the actual visuals that you use, rather than just kinda the standard boring bar charts, line charts and things like that. So the three that I really want to highlight that I've used myself and I would really encourage you to use, I know there's tons of other ones, but these are at least the ones that I think would be really smart to be on top of. Mentioned the first one, which is super obvious, obviously, it is the extra Power BI visuals that others have built. And these are just awesome, right? You can build some of these advanced card ones are really great. The KPI ones, I think, compared to the gauge one in the circle charts, that the pie charts that come standard, these other ones, the advanced ones that are free, are just excellent. I mean, these are really, really great looking and they will just make the report looked at much more special, right? So I really encourage you to take some time to go through each of these visuals. And I would definitely try to make note of the ones that you really like. Maybe put them in a, In a notion database or somewhere that you can remember which one it is because I have found myself, you know, even if you're just looking at KPIs, trying to remember which one you use on that last project, it can be a huge pain in the butt. So I would really recommend if you find one that works really well and it looks great. Keep using it and set little notes to yourself so you remember which one it is. So that's the first one. The next one that I want to highlight is the Heikki app. So I put a link in the course to this. This is awesome for creating the backgrounds that you're going to use. And so you see some of these really nice looking backgrounds where you can have the report in a general area and then have some extra little details at the bottom, you can kinda see here where even just minor changes to the configuration gives you just this really great looking report or report backgrounds. And all of this comes out in high resolution. So you can really just adjust this exactly to what you need and to fit your company's colors. So I think this app is just exactly what you want. You can get it in PNG once you're done, but you can look at all the different options. I think this is just hands down one of the easiest best ways to create an interesting background. And you can see from this report, this background image over here. It really just had such a great detail how it meshes with all the colors of the port. I just think that looks awesome. So this app is such an awesome use case for that. The next is to just get some illustrations and icons. So draw kit. There are so many websites out there that can give you free icons and illustrations, but draw kit is awesome. You can download these, you can insert them. I mean, just to add little avatars or some of these illustrations to your report. I mean, that is so 2021. These little illustrations and everything that you can just put it into the report really will just take it to the next level. So these are really the ones that wanted to highlight and how you can really create a beautiful report that is going to be a huge impact on your team or your customer. I wanted to keep this course nice and short so that you could get to the point and really understand my method for at least creating these reports very quickly. So I hope you liked it if you have any questions or issues or anything like that, feel free to pop any questions in and I'll gladly help. All right. Thank you so much for watching.
 Kenn Andersen