Global Car Sales Dashboard – Data Visualization in Power BI
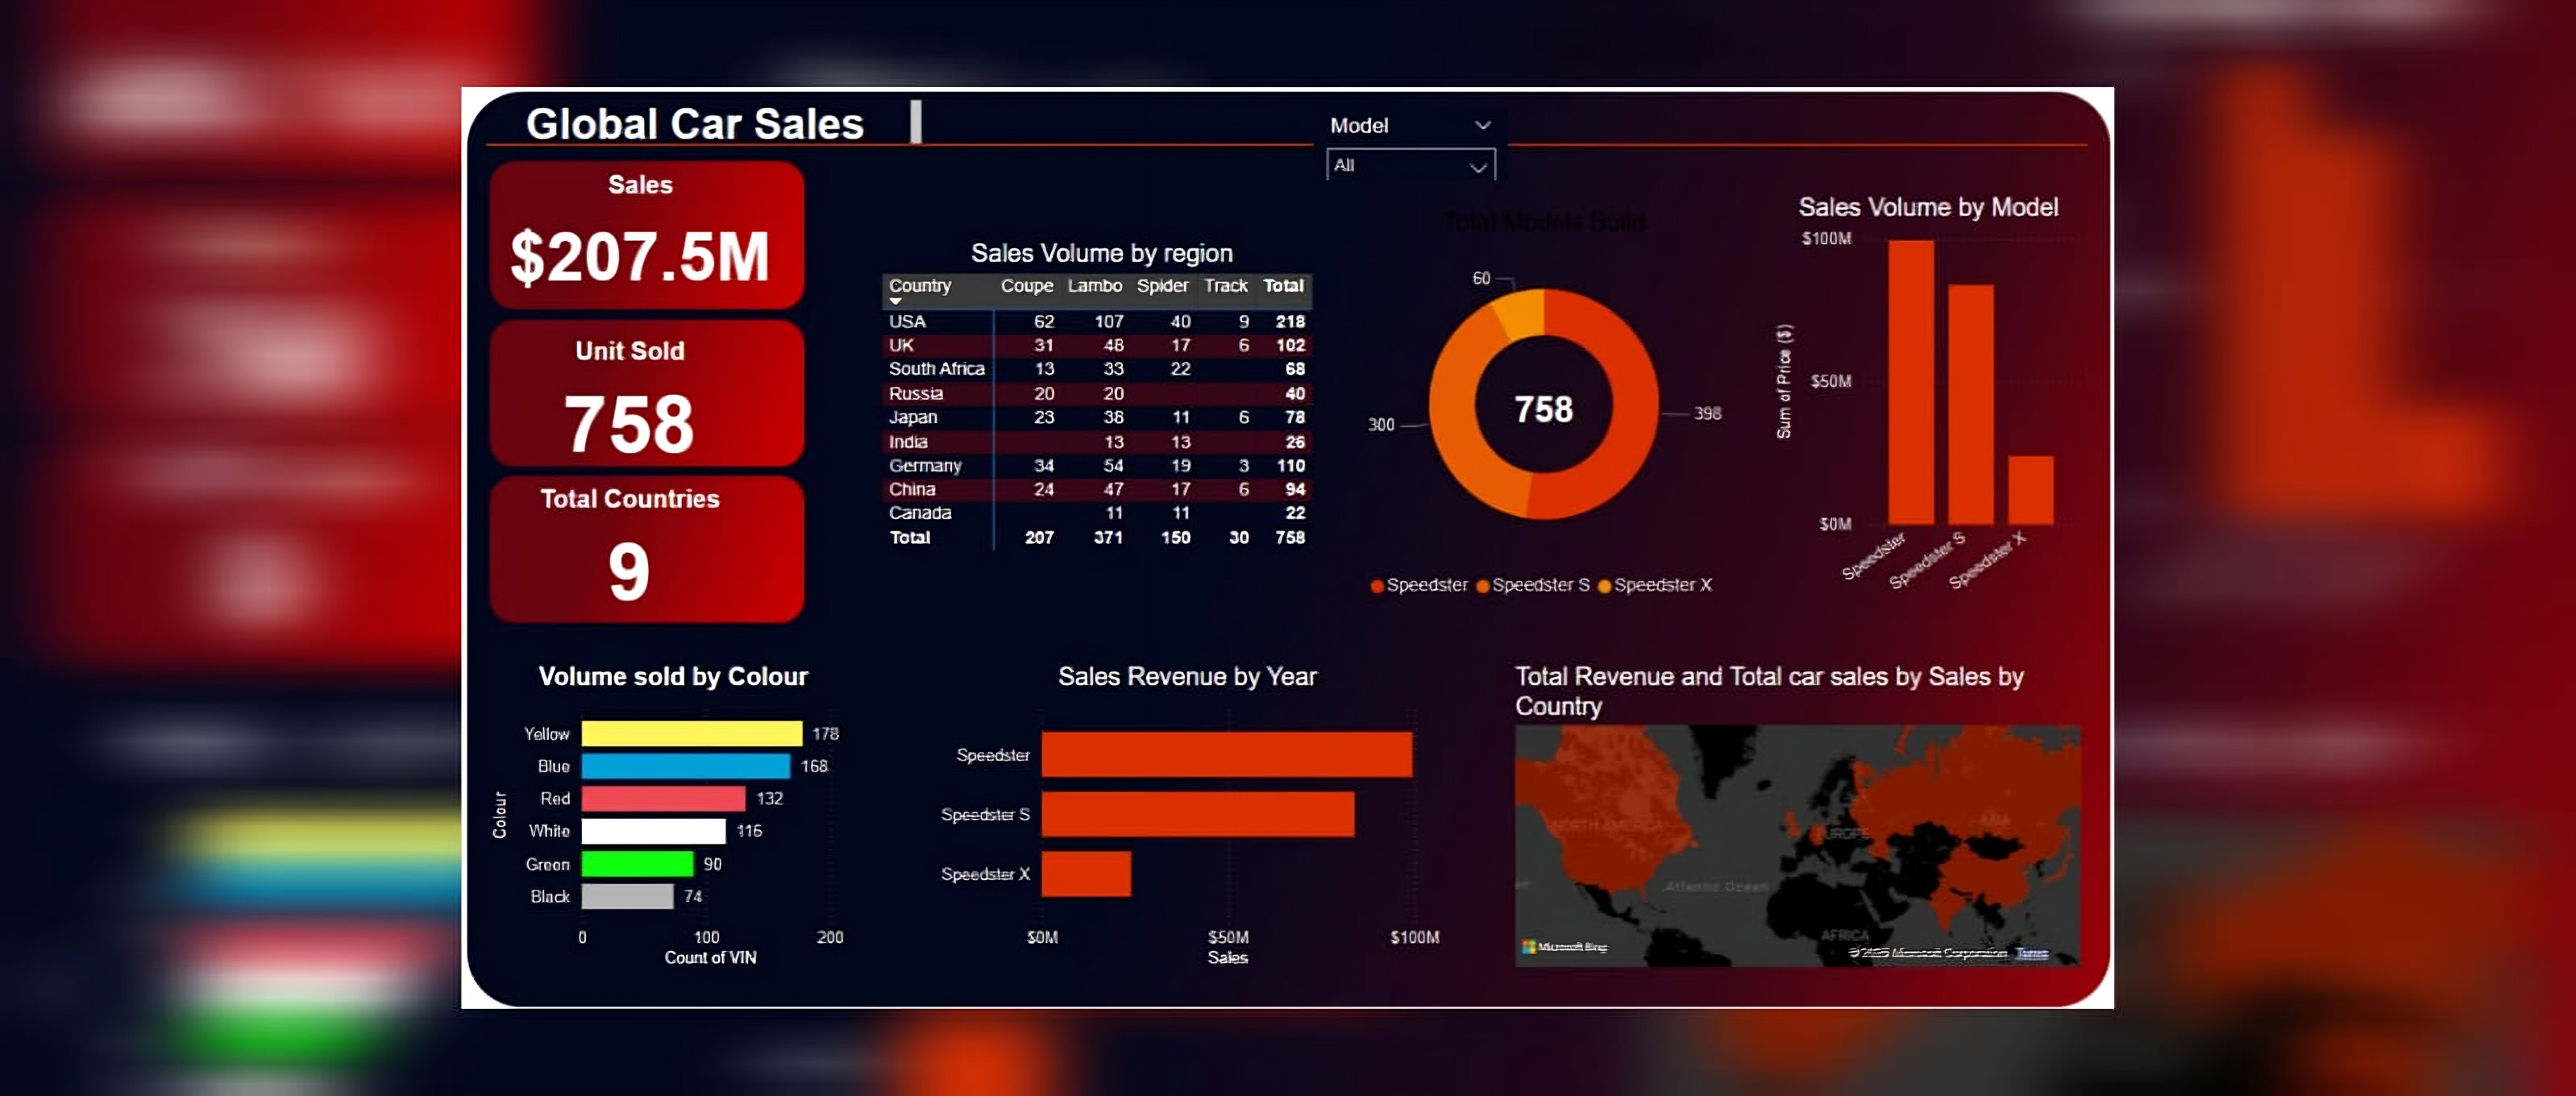
This Power BI dashboard provides an interactive and visually engaging analysis of global car sales performance. It consolidates key sales metrics, including total revenue, sales distribution by country, car model, and color preferences.
Key insights featured in the dashboard include:
-
Total Sales & Countries Covered: Displays an overview of total revenue and the number of countries where sales have occurred.
-
Sales Volume by Region & Model: Highlights car sales across different countries and car models, enabling comparative analysis.
-
Total Models Built: A pie chart showcasing the distribution of different car models produced.
-
Sales Revenue Trends: Tracks revenue growth over the years for different car models.
-
Volume Sold by Color: Analyzes customer color preferences based on the number of units sold.
-
Geographical Sales Representation: A global heatmap visualizing revenue distribution by country.
This dashboard is designed for automotive industry analysts, sales managers, and decision-makers to gain data-driven insights, identify sales trends, and optimize business strategies.