Birth Dates in 2003
In this visualization, I wanted to represent which month had the highest number of births and the days of the week that had the highest number.
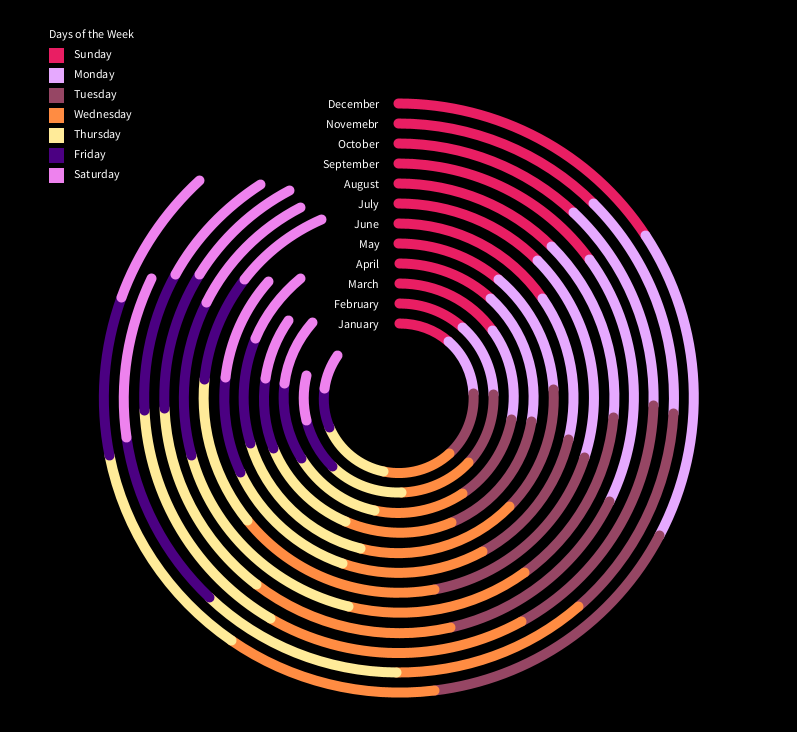
It was an interesting project where uncovering insights took place. To be able to draw this arc graph, I had to do some processing on the data in Excel to create a pivot table that shows each month's total births along with the day's total births per month.