Transcripts
1. Welcome - Course Introduction: Hey there and welcome to the stock market
investing course. My name is Griffin
and I am super excited to have you
on board and get you started with the full curriculum
so that you can become a well-versed stock
market investor for yourself and reach
your financial goals. I created this investing
course because I2 is once in a position
where I wanted to explore the idea of growing my wealth over time
through the stock market, but really had no concrete
idea of where to start, which is most likely the position that you're
in right now. So even after graduating from
my Bachelor of Commerce, I still didn't have a hands-on
and practical approach to stock market
investing in particular. And so for this reason, over the past four
or five years, I have set out to learn
as much as I can about stock market investing through reading and dozens of books, taking additional courses,
learning from mentors and crafting my very own
stock market portfolios. This is allowed me to gain
invaluable experience that I honestly felt obligated
to share with the world. And that is the reason why
I created a YouTube channel speaking about stock market
investing in the first place. However, I really wanted
to take it one step further with this
investing course for individuals who wanted
to learn how to properly analyze
a company and see whether or not it fits with their overall financial plan
and stock market portfolio. Over the past 56 months, I've been creating and refining
this course it down to a curriculum that's
going to provide any individual aspiring
to be an investor, whether an obvious
or intermediate, with the proper tools
necessary in order to create your very own US stock
market portfolio for future success. So if you're watching
this right now, I applaud your
initiative to better your finances through
this investing course. And by the end of the course, I guarantee that
you're going to be in a better position to
approach stock market investing with an eye of expertise in order
to better determine which financial securities are best for your goals
as an investor. In this course, we'll be
exploring and dozens of relevant concepts divided up into seven individual modules, starting with a basic
investing principles to build up your foundation of knowledge about
the stock market. And then once you
feel comfortable with your level
of understanding, we're going to be
diving into creating your very own stock
market portfolio based on a series of
relevant questions about your investor profile
and risk tolerance. This way, you'll
feel confident that your investment
portfolio perfectly suit your specific
needs and goals. By the way, it take
your time going through all the curriculum of this
course and make sure to re-watch any individual
lectures that you might feel you lack
proper comprehension. After all, there's over 55 individual lectures
in this course. So don't rush your learning
if you don't have to. Once again, I really
can't wait to get you through all the
curriculum of this course. So let's get right into
the first lecture.
2. Why Invest?: Hey there and
welcome to the first official lecture of this course. We're currently
still in module one, which is going to cover
some basic concepts and ideas around stock
market investing, as well as covering
some preliminary steps that you're going
to want to take as an individual before you actually start investing
in the stock market. So even though these
might be topics and concepts that
you've heard of before, I highly recommend that
you watch through all of these lectures in the
first module to make you a better rounded investor
and really understand why it's so important to invest in the stock market
in the first place. And the whole goal here
is really just a spark up some critical analysis about
your own finances and goals. This first lecture is all
about why you should be investing in the stock
market over the long term, which after all, is the
entire goal of this course. Alright, so the primary
reason why people invest in the stock market in the first
place or any other form of investment for that matter is in order to allow their
money to work for them while they can work on other activities such as
growing their income. And two, then it
reinvest back into their investments or
spend time with family, basically anything else
that doesn't require the individual to actively
trade their time for income. This is really the primary t as to why investing exists
in the first place, which is putting your
money to work for you in order to grow
your wealth over time without always having to
actively trade your time for income or engage in other
income generating activities. The main goal of all investors is to place their capital into an investment
vehicle and then how that investment worked for
them around the clock, thus growing the initial capital into a larger investment. This is why the growth of the
capital invested over time, as well as the income
generated from the investment is what's
known as portfolio income, which you're gonna
be learning all about throughout this
course and how you can go ahead and generate
portfolio income so that over time
you're able to grow the value of your
investment as well as the amount income coming
in from your investments, which is called
portfolio income. In order to read multiple
streams of income and not strictly rely on one single
form of active income, such as, for example, your job. With everything that we
learned in this course about technical analysis of
companies and funds. Always remember though, that the main primary objective of an investor is to
place their capital into an investment vehicle habit worked around the clock
for them and then grow the value of the investment
over a period of time as well as
generating income. This quickly sums
up the main reason as to why investing in
the stock market is so beneficial and it's
going to help you achieve financial success
over the long run. The second main reason
why many individuals choose to invest in the
stock market is typically to save towards retirement at a quicker rate than
what can be achieved by simply working your job and then saving a portion of your
income each and every month. Ultimately, this
comes back to the first that we just spoke about. However, when investing
in the stock market, you automatically unlock
something called compound interest on the funds that
you invest in your portfolio. If you aren't too
familiar with a concept known as compound interests
and not to worry, we're gonna be
learning all about this concept in the second
module of this course. But if you're
looking to save for retirement or any
goal for that matter, investing in the stock market
is going to allow you to exponentially grow the value of your investments
in your portfolio. If you're able to choose
appropriate funds and specific companies that are solid and are going to be
able to grow over time. Now obviously in this
course we're gonna be learning all about
how to properly analyze a company or a fine from a financial standpoint to make sure that it is a
winning position that over the long term
should be able to provide your portfolio with steady
and appreciation and income, which really is the definition of passive portfolio income, where you can just reap the rewards of your
investment and not have to actively manage the
investments in question. This is also the
reason why sticking to a long-term plan of investing
in the stock market can create massive levels
of wealth over time relative to strictly
saving your income. This is because
when investing in solid companies and funds
that create income for your portfolio as well as
appreciate over time because they're great companies that are actually growing their revenues. This is what's known
as a productive asset. And with compound interest, the growth of your portfolio
is going to follow an exponential pattern
instead of a linear pattern, such as width, just saving your income each
and every month. Again, though, we're
gonna be covering compound interests in its
entirety in module two. Moving on to the third reason why investing in
the stock market is beneficial to
practically everyone is because by doing so, you're not only growing your net worth and
wealth over time, but you're also creating multiple streams of income
for yourself over time. One of the main goals
that all investors should strive for
is to really create multiple income streams
because this is going to not only exponentially grow
your income over time, but it's also going to
hedge against the risk of potentially losing one of your income streams
down the road. For example, if
you're currently in a situation where
your job is you're only income stream while
the moment where you lose your job or that
job is in jeopardy, your unfortunately,
you're going to be any tough financial situation. If someone who is looking to
invest in the stock market, it's really important that you always remember that there's two primary reasons for investing in the market
in the first place. Number one, being a growing the value of your investments
and wealth over time. And number two. To create a stream of income for yourself so that you're
able to multiply your income streams and a hedge against the risk of losing
one at down the road. Now, even though it can take
years or even decades to create a substantial income
stream from your portfolio. It's still a goal
that all investors should really strive for. Now at the topic of creating
multiple income streams, really should be a whole course in itself where we speak about various business
opportunities and ways that you can go ahead
and multiply your income. This course is not
about that, however, do keep in mind
that that creating a stock market portfolio that
creates income for you over time is really one of
the easiest ways to create that passive
income stream or portfolio income stream, I should say, over a period
of time where you're just re-investing your income as well as a contributing
on a monthly basis. This is one of the simplest
ways that you can do so over time with consistency. In fact, I stock market
portfolio that creates monthly income for you as well
as appreciates over time, is what's called a money system. And this is hands down
the easiest form of portfolio and passive income that you can create
in your life. Creating this money
system starts the day that you change
your mindset and decided to open up an investment
account and start contributing to it
on a monthly basis. So this is why I am
super excited to get you through all the
modules of this course so that you can be exposed
to all the curriculum and understand how to properly create your own stock
market portfolio to build your wealth over time. And finally, the
last main reason why investing in the stock market
will be beneficial for you over time is so that you can build your wealth
while retaining its value by beating inflation levels in an era of extremely low interest rates, such as what we're living
through right now, as well as the federal
government's printing more money than we've ever seen
before as never been more critical to invest
your funds into solid assets and investments
that are going to appreciate over time
and create income for you so that you can
achieve a greater rate of return than inflation without going into
technical detail about how inflation
works just quickly here so that you better
understand the concept. We'll ever, since
we decided to leave the gold standard as the
baseline for measuring wealth, instead of opted for a government backed
solution where now central banks are regulating how much money is out in
supply in the economy. Well, this is now exposed
us to a possibility of more and more and more
money being printed and pushed back into the economy in a difficult situation such as during the whole
coronavirus pandemic. And at what this really does is each time a new
money is printed, this D value is
the money that is currently sitting in
your bank account. So really what does
all this mean? Well, simply put, if you're only saving money in a
high-interest savings account, instead of deploying it into productive assets that are
appreciating overtime and creating income for
you while your money is at a high-risk
of devaluation, every single time the
government prints more money, which
causes inflation. And typically inflation is at around 2% per year in
a healthy economy. Now if this seems
complicated at all, I really want you
to understand from this point is the fact
that it's great to save a certain portion of your
income and a high-interest savings account in order to
have some funds saved up, for example, if
something happens and you need to access
cache quite rapidly. However, it's really going to be important
that if you aspire to grow your wealth over time and create income for yourself, if you're going to want to
invest in the stock market, in it, productive
assets, alright, right, so that covers the
four main reasons as to why investing in the stock market
is beneficial for pretty much investors
of all causes. In the next lecture,
we're gonna be taking this one step
further in order to properly demonstrate why saving your money is not
going to be nearly as beneficial as investing
in the stock market of following a long-term
solid investment plan.
3. Long-Term Investing vs Saving: Hey there and welcome to
the second lecture of module one at building
out your foundation. In this lecture, we're
going to be comparing the relative difference
between investing in the stock market
in order to grow the value of your wealth
and investments over time, as opposed to simply
saving your money in a high interest savings
account each and every month. This lecture is
going to be quite quick because I
really just wanted to showcase the primary reason
as to why over the long-term, the compounding of
both capital gains as well as even an income that
you're receiving it from your stock market
portfolio is going to eclipse any sort of income that you can generate
from simply saving your money in a high
interest savings account. And once again, if
you aren't entirely sure what compound interest is, as well as capital gains
and dividend income. And not to worry, we're gonna
be covering all of this in detail in modules
23 of this course. Now first off, it's important to mention that first
and foremost that the appreciation
on an annual basis that you're gonna be
able to achieve from your stock market
portfolio as well as the interest rate that
you're gonna be able to get it from a high
interest savings account will vary greatly over the course of time
that you maintain your investment or
your savings account. So for the sake of this example, we're really just going to
be using some average rate of 2% for the high-interest
savings account and then 7% appreciation on an annual basis of the
stock market portfolio, which are both average
and are gonna be able to highlight the
point that I'm trying to get across in this example
before comparing examples of a high-interest
savings account and the stock market portfolio. It's also important to note that interests that
you're incurring from a high-interest savings
account is going to be taxed at your marginal tax rate. Whereas appreciation
from capital gains as well as the income degenerating from
dividends are going to be taxed at a favorable rate, which is really going
to have an impact on the final value of your investment or your
savings over the long term. With that said, if you hold your investments in a
tax-free savings account, which we're gonna be learning
all about in Module four. Well, this is a
registered account that has a tax
sheltering benefits. So you're able to grow
all your investment over the long term and get this
all on a tax-free basis, which has a major impact on the relative value long-term
of your investments. All right, so with that
said, let's quickly compare two examples of the
growth of $2 thousand in both a high-interest
savings account at a 2% annual interest
rates and then in the other example,
another $2 thousand. However, this is going
to be growing at a 7% interest rate as well as a 3% annual dividend
yield for this comparison. And we're gonna be using a
simple growth calculator in order to just demonstrated
the concept at hand, starting with the example of the high-interest
savings account, Let's start with an
initial account balance of $2 thousand and
you are going to be contributing a $500
to the savings account each and every month
at a yearly interest rate. Let's remember, of 2%, which currently is
going to be among the highest rates in Canada due to the current
state of the economy. And at the underlying
interest rate that the central bank has set well over the course of
a 30-year savings period, this statement account
would have grown to roughly $250 thousand in value. But let's also remember that this yearly interest
income would have been taxable at your
marginal tax rate each and every year
that it is earned. So in reality, this would
actually most likely be closer to the $215
thousand range, which is quite a big difference. And if you were in the highest
tax bracket in Canada, this would be even lower as we just looked
at in this example. If you're simply saving a portion of your income
each and every month in a savings account at a relatively low interest
rate year-over-year, it's gonna be really hard
to significantly grow the value of your savings as well as your net
worth over time. However, it, Let's now look at the second example of a
stock market portfolio with the same initial parameters
of starting with 2000.500 of monthly
contributions. However, with this example, we're gonna have a 7%
annual appreciation rate, any 3% annual dividend yield. For this example, we'll be
using a different calculator that allows us to add a
dividend yield and also reinvest those dividends
back into the value of the portfolio that's growing
it at a much quicker pace. All right, so we're going
to add the $2 thousand to the initial balance and the
monthly contribution is $500. It just like with the previous example, what changes, however, in this example is that
we'll be inputting an average of 7%
annual appreciation, which is relatively standard for equity markets in North America, and the dividend yield is 3%. The dividend is basically a percentage of the share
value that accompany redistributes to shareholders
as cash on a yearly basis will indicate that
the company grows this dividend
distribution by 5%, which is just a standard. And let's remember that this is just an example to
demonstrate my point. And finally, it will indicate
that the drip is on an drip is just an acronym for
dividend reinvestment plan, meaning the dividends
received automatically go and repurchase more shares of the company in question by
taking this box right here, we're just saying that yes, at the dividends
will be reinvested. And finally will the
portfolio will be taxed. And we're gonna put
knowing this example as if this was all in a
tax-free savings account that we're gonna be
speaking about once again in module four when we execute the calculation and
we can see that the portfolio has
grown to a value of $845 thousand over the
same 30 year period. This is roughly $600 thousand more that you've generated by investing in
the stock market, rather than simply saving your money in a high-interest
savings account. This is really the power of compound interest as a result of appreciation of the value of the holdings and dividend
income combined. Now obviously, let's
keep in mind that this is a very cookie
cutter example. But nonetheless, I
hope this gives you a preliminary understanding of why investing is so critical for the long-term
growth of your wealth, as opposed to simply sucking away your money
in a savings account. Another thing to
consider is that if this portfolio was in fact built any tax-free savings account
and none of this income and the appreciation
would ever be taxed, which makes a major
impact on your returns. So this was really just
a quick example of comparing a saving to
stock market investing, where it was stock
market investing, you're able to benefit from compounding of appreciation and dividend income being a reinvested into the
portfolio over time. And hopefully this just
really open your eyes as to the opportunity
cost that you'd be leaving on the table if
you're not investing. Now obviously you've
purchased this course or you're interested in
stock market investing. But nonetheless, I hope
this just really give you a foundation as to understanding at the
relative difference here. In the next lecture,
we're gonna be covering a handful of preliminary
steps that everyone should take before investing
in the stock market in order to really set yourself up for success. So
I'll see you there.
4. Before Investing - Do This...: Hey there and welcome
to the third lecture of module one, building
your foundation. In this lecture, we're gonna
be covering a couple of preliminary steps that
I always recommend that my viewers and students conduct before
starting to invest in the stock market or any other form of
investment for that matter. I know that, Hey,
you're already in this course and it's
really tempting to want to go ahead and jump
into investing right away. However, I'm someone who's trying to teach you how to take hold of your finances from
a global point of view. And before actually jumping into the stock market and purchasing stocks and
other securities, It's really important
that you first follow a couple of preliminary
steps because this is going to lay out your
foundation and set you up for long-term success by avoiding as many pitfalls as possible. Remember that even
though this is a stock market investing specific course
where we're gonna be learning all about how to properly analyze
companies and set up your very own portfolio based on your investor profile and asset allocation later
on in the course, ultimately, the whole goal
here is that I want you to succeed it from a global
financial perspective. And so in order to do
so before investing, you need to properly
set the stage from a personal finance perspective. Otherwise, if you jump
the gun too quick, you could be exposing
yourself to unnecessary risk. So with that said,
there's really only a three
preliminary steps to take before starting to
invest in the market. And they're really simple. We're gonna be covering them in this lecture and then we're gonna be getting
to the investing part of the course shortly. And not to worry, I know
we're speaking about a lot of preliminary
topics beforehand. However, it's really
important that you do follow these three steps. I've seen this many
times in the past where viewers have reached
out to me wondering what to do because
they did go ahead and invest in the market
without proper education, such as the curriculum
that you're gonna be learning
in this course. And then they did this also without following these
three preliminary steps, basically putting them in a really difficult
financial situation, which is the last
thing that I want anyone watching this
right now to fall into. The first step to follow before investing in the market is super simple and I guarantee
you heard about this before. And that is to have a
certain amount of savings put aside in order
to hedge against any unfortunate events that might happen in your
life where you need to dip into savings in order
to cover living expenses. So this is what I call
an emergency fund. And at all times I
like to recommend keeping at a minimum
three months worth of all your
expenses in that savings account that you
never touch personally, I could even go up to
six months or more. However, three months
is the bare minimum. So we're talking
here living expenses in terms of housing, rent or mortgage, as
well as utilities, hydro, water, garbage,
and at food, etc. Anything that is going
to be considered a living expense have
added a minimum of three months in a savings
account that he's put aside in case you ever
need to dip into that. Now, another concept
of an emergency fund and just having savings to cover your living expenses is nothing new and you've most likely
heard of this before. However, this is more
important than ever before, especially considering
what just happened in the global economy with the
whole coronavirus pandemic, people were losing their
jobs left and right, and unemployment skyrocket up to the 15% range in Canada
and the United States. And yes, people were relying
on government subsidies, but also relying on the
emergency funds that they set up in advance in order to foresee this type
of event happening. If you didn't properly set up an emergency fund of
your living expenses, this could very rapidly turned
into a negative situation where you're forced to take on significant amounts of debt, which is the last thing that
you want to do if you're looking to successfully
invest in the stock market. Another thing to consider about the emergency fund is that
I have people all the time that asked me whether
or not they should invest before having
this emergency fund. And to me the
answer is always no because what happens
if you do end up having a certain portfolio
of investments that you're really happy with and
they're going up in value, you're doing great
and something happens in your professional life
where let's say you lose a source of income
and then you have no money coming in in order
to cover your expenses. And your then a forced to go ahead and liquidate
your holdings, even if you're in a
position where you didn't necessarily want to
cash out your holdings. This is something
that could very well happen if you
didn't properly set yourself up or set up a
foundation at before investing. So to summarize the
emergency fund, I know it's really
exciting to want to jump right into investing
as soon as possible, but make sure to
always maintain at a minimum at three months
worth of living expenses. And if you're able to boost
that up to six months, make sure you do that as well because you're
really just going to have peace of mind and
you gonna be able to focus on a growing your
investment portfolio. The second preliminary step
to take before investing in the stock market is paying
off all high-interest debt. Now, I know this is a
concept that you've most likely heard of as well. So we're not going to use
spending a ton of time on it. However, this isn't just as
important as it setting up your emergency fund and
with the paying off of high-interest debt before
investing in the market, this really just comes down to plain math and risk mitigation. In my opinion, any
form of consumer debt, meaning debt that
isn't used in a way to generate more income by
leveraging those funds into a deal that's generating a higher percentage than the interest you're
paying on that debt. That is also going to be above five to 6% interest
rates should be eradicated at all costs before you start investing
in the stock market. And this really comes down
to two primary reasons. The first reason is more from
a psychological standpoint, when you pay off your
high-interest consumer debt, you're essentially lifting off this black cloud
from your shoulder that's weighing you down. And that can be very stressful, leading you to make a
less rational decisions in other aspects of
your financial life, such as basically all the
investing drops that we're about to speak of in at
one of the next lectures. The second reason is from a pure math and risk
mitigation standpoint. So whenever a viewer asks me whether or not they
should start investing before paying off their
high-interest consumer debt on either personal
loans or credit cards. I always tell them this, there's a one-hundred
percent chance that you're going to have to pay the ten to twenty-five
percent interest rate that you're carrying on
your credit cards or your personal loans. But in the stock market, even though we're gonna
be learning how to invest it properly and
analyze companies in order to put more
chances on your side to generate nice interests over
time as you're investing, there's never a 100% guaranteed, no matter what anyone tells you, that you're going to generate
a higher return than, let's say 10% on a yearly
basis that you would 100% have to be paying it to your credit card provider
in the form of interest. Here's an example to
illustrate my point. Let's say you had
a credit card or a personal loan that was at
a 1% annual interest rate. Well, if you went ahead and
purchased a dividend stock that had a 5% dividend
yield then, okay, that could make sense
because essentially this is a productive asset
that's generating you a 5% dividend
yield and you're utilizing money at a
one-percent interest rates. So therefore you have
a 4% spread there. However, if you're jumping
into investing in too quickly before paying off your high-interest
consumer debt at a 510, 20% interest rate on a
credit card, for example, you're setting yourself
up for a very, uh, difficult right ahead. And finally, the third
preliminary steps that you're going to
need to conduct before investing in the
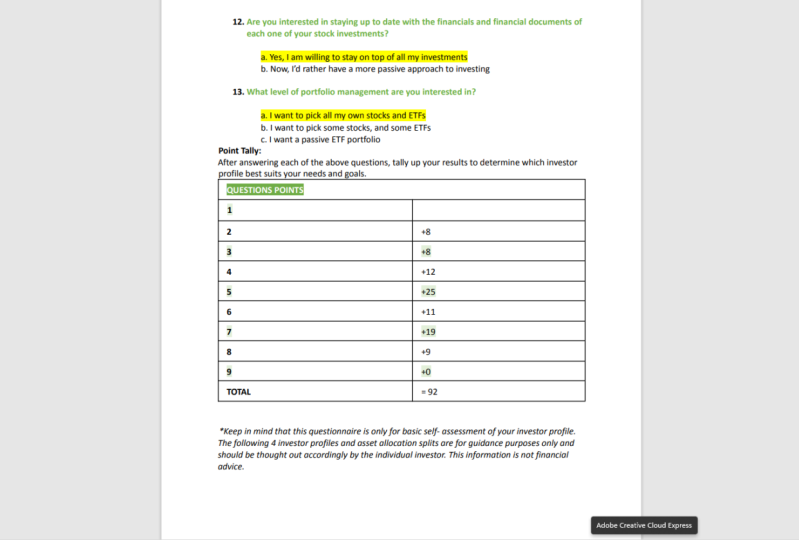
market is to properly identify your investor profile, meaning identifying your goals and limitations as an investor. Because this way you're
going to be able to properly conduct the analysis of companies that
are going to suit your investor profile
and your goals. So not to worry if this is
the first time that you're hearing about the concept
of an investor profile, we're going to be
determining your own profile later on in module
five of this course, you can go ahead and have a proper asset allocation within your stock market portfolio
for future success. Mapping out your investor
profile as well as your strategy and goals
as an investor in compliment to learning how to properly analyze a company
and fund is really what's going to differentiate a proper investor from a
gambler or a speculator. This way you're gonna be able to approach the construction of your portfolio from a
viewpoint and that is going to suit your
needs as an investor. To sum up this lecture,
proper financial literacy is the most important element in
overall financial success, as well as knowing how to properly analyze a
company and really just know what you're looking at when analyzing
financial statements. This course is a great start to becoming a
well-rounded investor. And I can't wait to get you in the actual concrete
technical analysis that we're gonna be
starting in module two. In the next lecture
of module one, we're gonna be learning
about how to properly strengthen your
investor mindset.
5. Investor Mindset: Hey there and welcome
to the fifth lecture of module one that building
your foundation. In this lecture, we're
gonna be learning all about at different elements
for strengthening and the mindset that's
critical for you to adopt as an investor
if you're looking for long-term
success and to avoid as much as possible being emotional with your investments, which always leads to sub-par
performance of a portfolio. If you've watched any
of my YouTube videos, then you've most likely heard
me speaking about keeping emotions of all kinds
out of your investing. That in making
decisions based on emotion and impulsive
decision-making is the number one
way that you can guarantee to lose money
in the stock market. The reason for this
is because if you're a long-term a buy
and hold investors such as myself and
you're investing in companies that you've
properly analyzed. And for this reason that you
believe that it's going to appreciate nicely
over the long-term, well, over this
investment horizon, it's just inevitable
that you will go through periods of economic
prosperity and economic slowdown casing
point at the time of filming this video and this entire course
for that matter, we're living through the
coronavirus pandemic. We just had a major
impact on business and economic slowdown basically
across the globe. And in turn, it
has had an impact on the returns of stock
market investors. However, it's really important
to remember that this is just one period in your
overall investment horizon. So during this period of time, let's say 30 years
until retirement, it's inevitable that you're going to go through more periods of economic slowdown and
economic prosperity. But if you consistently
contribute to your account and continue
investing over time, the value of your
investment will go up on an exponential level as
we're going to learn more about later
on in this course. For example, when looking at a historical graph of
the American S&P 500, which is a broad market index of the 500 largest
American companies. This showcases the
periods in history when the stock market entered a
downturn where as an investor, you're positioned
would have most likely gone down in value. However, this is
really just part of a healthy market because overtime and the market
goes through cycles. And you just need to remember that when you're investing over the long-term and consistently contributing to your account, you will inevitably
experienced periods of time when the value of your investment
temporarily goes down, but over the long-term
and the stock market and basically always
goes up in value. The average bear market, which is a downturn where
the equity markets fall by 20% or more from the pre flash highest for a
prolonged period of time, it typically lasts anywhere
from six months to 2.5 years, with a total market declined by 33% over this period of time. This is apparent here on this chart where
you can see that before the current corona
virus induced crash, there were 11 bear
markets since 1956. On the flip side,
a bull market is a prolonged period of time
or the market in question, and we'll appreciate
by 20% or more, typically lasts around three
years for the S&P 500. And we'll appreciate
by roughly a 151% during that period
of bull market territory. Once again, at this chart demonstrates the
gains in each of the 11 bull markets
between 19562011. So we can really see here that bull market
a typically take up a larger percentage of
stock market timelines. So over the long term, if you're investing into the market consistently
and buying quality companies such
as what we're going to learn in this
investing course, you can basically guarantee that the value of your investment
will grow over time. This chart clearly
demonstrates that when you approach
your investments with the mindset that
you're going to be a long term buy
and hold investor. It is inevitable that
you're gonna go through both market periods of
bear and bull markets. But you really need to
train your mind to be an investor here rather
than a speculator. Because if you get caught up in emotions and end up selling at, during a bear market, you can basically guarantee that all the games that you
accumulated at during your bull market periods
is going to be lost due to the fact that you're not
sticking to your long-term plan. This course is
going to teach you the best strategy to utilize
to buy into the market. If you're a long
term buy and hold investor as such as
myself and why sticking to the financial
plan that you're gonna be developing for yourself throughout this
course is critical for long-term success
and so on that note, let's quickly cover a handful
of characteristics that make up the mindset of
a successful investor. The first important
characteristic of a successful investor mindset
and we already just covered and that is to keep all emotions if your investment
decisions at all times. What I mean by this is letting a non-rational decisions
and thought processes that take over when buying into or off-loading a
certain positions. This is a reoccurring theme that applies to all
forms of investing, whether stock investing
in real estate investing, basically any type of investing
that you can think of. Because when it comes to
making proper investments, it's really important
that emotion and be put to the side
and then you take a step back before buying into are offloading
certain positions. So that it really
just makes sense from an actual rational standpoint in your overall
investing strategy. An example of this
would be putting a substantial amount of
money into a stock that you have not researched
because someone on Facebook or a friend
of yours has said, this talk is about to blow up without doing
proper research. This is a type of situation
where the thought of making a huge returns in
a short period of time, it can lead it to emotion
taking over and not doing a rational decision
at that fits in your overall investing strategy. It's pretty simple, but the
best way to keep emotion out of all your investing
decisions is to, first of all, properly research
all the companies that you're looking
to invest in and then stick it to your overall
investing plan and strategy that you're going to be mapping out in this course. And finally, always
make sure to have an exit strategy for each of the positions that you're
looking to buy into. Another example of a
motion taking over or it could be buying into
a specific stock that you've done proper
research on and you believe that over
time it's going to appreciate nicely and provide your portfolio with
a nice appreciation. And quickly after
making this purchase, let's say a week later the
stock ends up going down at 5, 10% it without actually thinking
about why you purchased the stock in the first
place and how it's going to benefit your
portfolio long-term. You basically decided to cut the loss right there
because emotions took over and it
was too much to see the value of your
portfolio goes down. I know this seems like a pretty
basic concept to master. However, I see this time and
time again with people who messaged me after watching certain videos on
my YouTube channel, we're obviously going to be
learning how to properly analyze a company in a fun
later on in the course, however, I really just want you to remember that for being a proper investor and developing a proper
investor mindset, not only are you going
to have to develop a technical skills for
analyzing companies, but it's also really
important that you develop your mindset as
an investor in order to help you whether
through periods of economic downturn
where the value of your portfolio could go down. And this is a prime period where new investors will
typically lose sight of their end goal and
decided to cut their positions when
in a period of loss. The second most
important element to crafting a proper
investor mindset. Yet so many people
disregard a completely making them a speculators
rather than investors. And then wondering why
their returns are all over the place is
not knowing anything about the companies that
they're investing in or doing the proper research and due diligence about the
financials of the company. If you want to be a
successful investor and gain anything
out of this course. And it says one of the
number one things that you need to remember
at all times when you're looking to buy into new companies and add
them to your portfolio. And that is to always conduct proper research on both the
financials of the company, as well as just the
overall management and qualitative characteristics
of the company. It's critical that you
always take the time to properly look into accompanies
balance sheet financials, historical financials
and leadership, which are all elements that
will make the difference between a successful and not
so successful investment. Something I see so
many new investors often forget is that when
investing in a stock, you're not just
investing in a stock, you're actually investing
in a company that has leaders, workers,
company culture, clients, and so forth, in which all contribute to the overall success
long-term of that company. And then in turn
also the success of your investment for
day traders who are looking at stocks strictly from an analytical point of view and seeing if short-term
price fluctuations can return money for them. This isn't nearly
as important as long term buy and hold
investors such as myself and most likely you if you're
following this course, it's really critical once again, that you just look
at the company from a global standpoint, but with a financial
as well as leadership and everything in-between. Because these are really
the elements that are going to make a
long-term successful company and that's
going to return you a more money long-term and your investment and what you
put into it initially. And finally, for the type
of investing that we conduct on my YouTube
channel and in this investing course at one of the key elements for long-term
success in stock market investing is it really
just patient and resilient to outside
market forces? As we discovered when looking at the historical S&P 500 graph, it's really just normal
and healthy for markets to go through cycles of
prosperity and slowdown, a period of economic
slowdown where the value of your
portfolio temporarily goes down does not
necessarily mean that your overall long-term
strategy is in jeopardy. It really just means that
your portfolio is riding through a period of
potential economic slowdown, which is completely
healthy and natural over the entirety of
your investment horizon. You need to be aware of the
fact that from time to time and you are going to
encourage short-term losses. But if this is accompany
or a fund that you've done your proper research
and due diligence on, then there's typically
going to be no reasoning to materialize a
loss by selling it in the position of when that actual position hasn't
lost temporary value. Instead, this is
typically going to be an opportune time to buy more of this investment that you
believe in long-term awhile it's in a position of being
at a lower price point. The goal of this lecture is not to teach you how
to do this right now we're gonna be learning all about that later
on in this course. But for now, I really just
want you to remember that it's completely normal and healthy
for the stock market. They go through
different cycles of economic slowdown as
well as prosperity. This is something that
you will experience during your investment
horizon when we learn about properly constructing a
stock market portfolio in module five based on your investor profile
and risk tolerance, we're gonna be taking
into account how exposed you're willing to be to
these market fluctuations. So that wraps up this quick
lecture on some elements that keep in mind that for building
a proper investor mindset, if you want to be
successful long-term with your stock
market portfolio. And I know some
of these concepts were actually quite basic, but you'd be surprised at
how many people message me on a weekly basis where
they're investing in companies that they
don't understand have not done proper analysis on and don't really know how it fits in their overall strategy
and long-term plan. This wraps up the first module
of this investing course, and I really hope that
you're able to properly implement all the concepts
that we just learned in each one of these
lectures before actually starting to invest
in the stock market. Now in the next module, we're gonna be
learning all about investing fundamentals from a, what a stock is a real
estate investment trust, how to properly read
a balance sheet, cash flow statement, etc. And put all of this together
in order to learn how to properly analyze a
given stock or fund.
6. What is a Stock?: Welcome to the first lecture of Module two Investing
Fundamentals. In this lecture, we're
gonna be covering one of the most important topics in this entire course
and debated bleed the most important topic of stock market
investing in general, and that is what a stock is, how they work and why stars can be classified
differently. The topics that we'll be
covering in this lecture include what is a stock and what is
their relation to a company? Why do stocks exists in the first place and
how are they issued? And then finally, why stocks can be
classified differently, including the most
traditional types of stocks, which are dividend,
growth and value stocks. The first element
that we should be covering so that you understand the fundamentals here
is what A-star even is. Quite simply the
word stock is sort of like a fancy name
used to refer to partial ownership in a
publicly traded company that issues shares
out to the public. Other terms used in
the investing world to refer to stalks
include shares. So shares in a publicly
traded company which represents the amount
of stock that you own, as well as equity, which is the amount
of shares for that given company that you own, which altogether represent your equity stake
in that company. Public corporations or companies that have
decided to make themselves available for
trade on a stock exchange. And for this reason, these
companies issue shares out to the general public which
investors such as UNI, as well as large institutions, can buy and sell these partial ownership
stakes in the company, also known as stock. So the next time they
hear someone say, Hey, I just bought some stocks
of Apple computers or I purchased some
shares of IBM. Well, what this individual
really means is they purchased individual ownership
stake in that company. This entitles that
shareholder to their relative portion of the company's earnings and
assets moving forward, let me give you an
example by comparing two scenarios so that
it's very clear for you. So let's say you
decided to start a company with a friend and you are both equal partners
at 50% ownership each. Well, this essentially
means that you own a 50% of the company, and therefore you're entitled to half of all these
companies earnings as well as assets moving forward with the development
of this company. The same is true with
publicly traded companies. However, with these types of corporations that
because they are much larger ownership
stake in the company are referred to as shares or
stock in the company. And typically there are
millions of shares issued out to the public that investors
can buy and trade. For example, though, to
make things really simple, let's say accompany had at 10 million shares issued out to the public and you
went ahead and purchased 30% of
all those shares, representing a 3 million shares. Well, in this
particular scenario, you essentially
are a third owner of that publicly
traded company and are entitled to 30% of the company's earnings and
assets moving forward, it's really as simple as that. And being a shareholder
in accompany, it gives you the
right to vote in shareholder meetings
as well as receive dividend payments when
the company decides to distribute dividends
out to shareholders. However, we're going to be
speaking about dividends more specifically in Chapter four. And finally, being a stockholder allows you to trade
the shares that you own for that company on an exchange to other investors, which is basically
the main goal of owning shares of
accompany anyways, with the hopes of buying
them at a lower price than what you're going
to sell them for later on in the future. Now in the old days when you purchase shares of accompany, you quite literally
received a piece of paper representing the
amount of shares that you own in that
public company. However, these days
it's quite a bit simpler as shares of
these companies are traded between
investors as well as institutions on what is
known as a stock exchange, which is basically
a marketplace for trading shares of
companies in Canada. For example, we have the Toronto Stock
Exchange as well as the Canadian
Securities Exchange. And in the United States, the two main stock exchanges are the New York Stock Exchange, also known as the
NYSE and the nasdaq, which is an online
only marketplace in order for investors to
trade shares of companies. And nowadays we use what's
known as an online brokerage, which is basically the
modern equivalent of a physical stock broker that you see on trading floors
in movies such as, for example, The
Wolf of Wall Street, these online stock
brokerages allow investors to have a
lot more autonomy, flexibility and
reducing costs on the trades at the execute for their stock
market portfolio. In module six, we'll be
discussing at two of the main discount online
stock mortgages that I personally recommend for all
retail investors in Canada. And we're going to
be speaking about all the details for each
one so that you can know exactly which one is suitable for your needs and
goals as an investor. Moving on now, I'd like to mention that there are typically two types of stocks that companies will issue
out to the public. The first one being what's
known as a common stock. And 99% of the time
when you're buying and selling shares of
companies on an exchange, you're going to be dealing
with common stock. However, there's
also what's known as a preferred stock and each
one has their pros and cons. We're going to be diving
into that right now, starting with comments dollar, because this is the
form of stock you'll be dealing with most in
your own portfolio, the shareholder who owned common stock is entitled
to three main elements. The first one being
a voting rights. So as we spoke about earlier, someone who owns 10% of all the common stock
in a company is going to have a much
higher voting power than someone who only owns, for example, a 0.05% of the
common stock and accompany. The second main element
is dividend distribution. So as a common stockholder, you're entitled to
your relative value of dividend distributions when the public
company does decide to distribute dividends
out to shareholders. And the third main element is
the equity of the company. So as the value of the company grows and the shares
appreciate over time, if you own, for example, 10% of all the common
stock in the company, as those shares would go
up in value over time. So it is your equity
stake in the company. The second form of thought
is called preferred stock, and this very slightly
from common stock in that preferred shareholders do
not have any voting power. However, they are first in line to receive
dividend payments, as well as the fact
that they're first in line to receive it their share of the company if and when
the company does go bankrupt, it's important to
note that preferred shares typically do not appreciate over time nearly
as much as common stock. And so for this reason, we're gonna be focusing
on common stock or preferred stock in
this investing course. I didn't want to provide
you with a distinction between both preferred
and common stock. However, keep in mind that
for most retail investors, including myself and yourself, 99% of the time that we're going to be dealing with
common stock because it's the most widely
used and will benefit your portfolio most in terms
of long-term appreciation. Now that we have a better
idea of what is thought even is and how they can be
traded between investors. Let's now dive into
the question of why a company might decide to go
public in the first place. Therefore, issuing shares of their company to the general
public were investors such as you and I can go
ahead and purchase these individual ownership
stakes in the company. The main reason why a
company would decide to open themselves
up to the public and issue shares of their company
for purchase is to raise capital to scale up the
operations of their business. So for example, if a company
is looking to acquire new assets or expand
into a new territory, or if the company, let's say, is looking to further their
research and development, well, by issuing shares
out to the public, financial institutions
will first have the opportunity to
purchase those shares, which basically raises additional capital
for the company. Going public also has the added advantage of
providing shareholders with a much higher level of liquidity in regards to their
ownership in the company. So let's say someone
owns, for example, 10% of all the common
stock in a public company. Well, they could
decide to easily liquidates a one-percent or even the entirety of
their position in a matter of seconds
on a public exchange. Whereas with a private company, this is much harder to
achieve because as setting up the sale of your ownership
is a much lengthier process. And finally, for this lecture, let's go over a
preliminary coverage of the main types of stocks. So even though at its core, a stock remains the same
from company to company being a partial ownership
stake in that company. Well, investors, it typically tend to categorize stocks into three main categories based on their underlying characteristics
being the growth stock, the dividends stock,
and the value stock. The first and most
popular type of stock is what's known as
the growth stock. And this is thought
from a company that is characterized by rapid
growth of operations. And so for this reason, investors tend to believe
that a gross stock is going to allow
them to outperform the overall appreciation of the general market during a
shorter term period of time. The reason why growth
stocks tend to provide a greater
opportunity for investors to outperform
the market in a shorter period of
time then, for example, larger and more established companies is because
these companies are in a rapid expansion and are reinvesting all
of their earnings back into the operations of the company and are often even taking on higher
levels of debt in order to fuel
this rapid growth and expansion of revenues. For this reason,
companies that are characterized as being
a growth stock and do not typically pay
out dividends to shareholders because
their efforts are concentrated
elsewhere and paying out a portion of
their earnings to shareholders as a
form of dividend would be a gain to the
overall goal of the company. Popular and well-known examples of true gross stocks would be, for example, a Shopify, Uber, Lightspeed, and Tesla. One thing to mention, however, with gross stocks is
that generally speaking, accompany that still in full-on growth and
expansion mode and that still has not yet established themselves
in their industry, does come with a higher level of potential appreciation and their share price for investors. However, it also comes
with a higher level of risk because the
stalk is much more volatile and the actual price of the stock is highly
determined on whether or not the company is able to maintain investor expectations of the
earnings for their company, as you've most
likely heard before, or higher returns typically comes with higher
levels of risk. The second type of stock
that we'll be covering is what's known as
the dividend stock. And this happens to be one
of my favorite types of stocks because a dividend
stock is a company that pays out a portion
of their earnings to shareholders for doing nothing more than simply
holding the stock, which is the most
passive form of investment and that
someone can achieve. Typically speaking, a
dividend stocks are going to be blue-chip
companies that are well established in their industries and are in a position
where they can redistribute a portion of their earnings back to shareholders because
they don't need to reinvest all of
their earnings back into the growth and
expansion of their company. Well-known examples of dividend
stocks that you've most likely heard of before
include Coca Cola, TD Bank, Royal Bank of Canada for dessert
incorporated, or IBM. Having a mixture of both
growth and dividend stocks in your portfolio can
be a great way to diversify your investments. And we're gonna
be speaking about portfolio construction
in module six. So don't worry about
that right now. Finally, the last
type of stock will be covering is what's known
as the value stock, which was popularized by famous investors at Charlie
Munger and Warren Buffett, if he, you've most
likely heard of before. So the value stock is a
stock that is considered to be trading at an
undervalued price point relative to its true
value in relation to the company's balance sheet
and financial statements. So the goal here is that
you're able to get in on a position at an
undervalued price point and you'll be able to benefit from greater appreciation once the stock inevitably goes
back up to its true value. Now typically a value
stock is going to be a larger and more
established company instead of being a growth stock. And the price of the
stock can be trading at an undervalued price point
for a variety of reasons. Typically, this will be from a short-term negative outlook for a given company or industry. However, if the
actual financials of the stock a steel,
strong and solid, this can be a great
price point and time for a value investor to get in on the position for future growth and
appreciation of the stock. So to wrap up this first
lecture on stocks, I really hope that you now have a better understanding
of what stocks are, why they exist, and why they
are categorized differently. In the next lecture,
we're gonna be covering the topic of what bonds
are and once again, why they exist and how they can be categorized
differently. Also keep in mind that in
this module we're learning the fundamentals of
stock market investing and the different concepts. But later on in the course, we're actually going to be
tying everything together and constructing your
very own portfolio.
7. What is a Bond?: Hey there and welcome to
the second lecture of Module two Investing
Fundamentals. In this lecture, we're
gonna be speaking about the second most common type
of financial security that is typically held in a stock
market portfolio for proper asset allocation
and that is the bond. The topics we'll be
covering in this lecture include what is a bond
and why do they exist? Bond yields and coupon rate
different types of bond, including corporate government
and municipal bonds. And then finally, how bonds are impacted by interest rates. Before speaking about
the different types of bonds and how bonds can provide your
portfolio with fixed income. It's important that
we first understand what a bond even is and what the relationship is between a bond issuer and the
purchaser of the bond. Quite simply, a bond is a debt obligation
between two parties, the first party being the bond issuer known as
the borrower in this case, and then the investor who
is picking up the bond in return for predetermined
interest payments, which is the reason
why you may have heard the term fixed income before. Investors referred to bonds as fixed income securities
because they provide your portfolio was steady and predictable
interests payments from the issuers of the bonds. Think of a bond as sort of the opposite of when
you owe to the bank for a loan because
you are in need of money for financing a project. Well, in this
particular situation, the issuer of the fund,
which is the bank, is going to lend you
money and in return, the borrower who is u, in this particular situation, is going to have to pay
interest payments with a bond. It's the opposite
of the example we just looked at were
in this scenario, it's the government or
corporate entity that's in need of raising capital
for financing projects. So the government
or a corporation will issue bonds
out to the public. Investors as well as financial
institutions can purchase these bonds and in return receive interest payments
on their land and money. Inversely, as we saw in the
previous lecture on stocks, companies can also
issue out shares of the company in order
to raise new capital. And they can do so pretty
much whenever they so desire. However, by issuing
out more shares, there's a dilute current
shareholder equity. And so for this reason
that many shareholders do not typically like
it when accompany will continue issuing
out more shares because it dilutes their
stake in the company. Issuing the bonds can be a nice alternative for raising capital when financing projects, just like when issuing more
stocks into the market, does a variety of reasons why a corporation or
government would issue bonds in order to raise capital with a
corporation, for example, they might issue bonds in order to raise capital
for research and development or expanding into a new market and with
a government entity, the reason why they might issue bonds is to pay for hospitals, roads, infrastructures,
and the list goes on. Basically anything
that accompany or government can want
to raise money for. They can do so by issuing bonds. And the reason why bonds
come into play here is because the issuing
party is not always able to obtain the required
amount of financing from traditional lenders such as
banks and credit unions. So in this particular case, the government or
corporation can look to the general public in order for them to pick up their
debt obligations. It's also important to
understand that bonds are initially issued out to the
public at set price points, which can vary depending
on the issuer of the bond. For example, a
company could decide to issue 10 thousand bonds out to the public at a face
value of $1000 per bond, raising $10 thousand
in capital for the company for which they
can do whatever they please. However, once these bonds are initially issued
out to the public, they then fall into the general market
where the price can fluctuate based on
what the market thinks is a fair price for them, based on a variety of
different factors, including the underlying
interest rate of the economy, as well as the
credit worthiness of the issuer and a variety
of other factors. Because just like
stocks bonds trade on exchanges and their price
point is in constant flux. Now when bonds are issued, there's certain information
that's required to be disclosed in relation to
the terms of the bond, including the face value, which is the amount to be paid back at the end of the term, the length of the loan known
as the term of the loan, as well as the interest
payments to be made to the lenders known
as the coupon rate. And finally, the date at
which the principal capital fronted to buy the bonds
must be paid back in full, which is known as the
maturity date of the bonds. Let's actually take a moment
here to go over each one of these individual characteristics
so that you fully understand all the elements
related to how bonds work, starting with the
face value of a bond, this is the amount of
money that the bond is worth at the end
of the bond term. And he's also the
amount of money that the bond holder will receive from the issuer at the end
of the term for this bond. This is also the value on which the coupon payments
are based off of. Let's look at a
quick example here. So let's say a bond that had a face value of
$100 is circulating in the market and to
different individuals picked up this bond at a
different price points. The first one at $60
for the bond and the other one at $140 for the bond. Well, once this bond
reaches maturity, regardless of what the
individuals paid for them, they will receive
$100 from the issuer. The maturity date of a bond is the date at which
the face value of the bond will be paid back to the bond holder by
the bond issuer. And note that a bond can have a variety of different
term lengths, ranging from one to three
years for a short-term bond, three to five years, or even ten years for
a medium-term bond, and then five to even 30
years for a long-term bond. Typically speaking,
a bond that has a longer-term is also going to have a higher coupon rate because during this
longer period of time, the bond holder is more
exposed to fluctuations. Relative to the coupon rate, as well as fluctuations of
the price of the bond itself as the underlying
interest rate of the economy fluctuate over time, the coupon rate is essentially
the dollar value in interest payment
that the bond issuer is going to be paying
out to the bond holder. So if, for example, a bond has a predetermined coupon rate of $3 on a $100 face value bond. Well, this translates over into a 3% coupon yield
on an annual basis. It's important to note, however, that the coupon yield, so the percentage that
you're receiving in fixed income varies
in relation to the fluctuating price
point of the bond and not the actual value
that you're receiving. What I mean by this is
that the coupon rate is predetermined by the
issuer of the bond. In this case, let's say $3. However, the coupon yield
will fluctuate over time as the actual price
of the bond fluctuates. In the open market, a bond will guarantee
a certain coupon rate, which is a dollar figure set
by the issuer of the bond. And then the bond
yield is determined by a fluctuating price point of
the bond in the open market, this is the same thing for a
dividend yield for a stalk, which we're gonna be learning
about in module four. The coupon dates are
the specific dates that a bond holder will receive
their interest payments. No one here as the
coupon payments from the issuer of the bond. Typically with bonds,
this is done on a semi-annual basis in contrast to a quarterly
basis typically with stocks. However, ultimately this doesn't really matter
because you're receiving the same amount
on an annual basis. Now that we understand
the foundation of what a bond is and
how they work, let's speak about what factors come into play
when a bond issuer sets the coupon
rate for the bond because not all bonds are equal. And this has a major impact on the coupon rate
that investors require in order to take on a certain level of risk
associated with the bond. Just like with pretty
much all investments, the level of return that a bond can provide
your portfolio is in relation to the level of risk associated with the bond. The higher the risk, but generally the higher potential return
for an investment. So in the case of a bond, There's primarily two factors
that come into play here. The first one being the credit worthiness
of the bond issuer, and the second one
being the term to maturity of the bond term, starting with the
credit worthiness of the issuer of the bonds. This is basically
the same thing as if you go to the bank
and request a loan. If you have a poor credit rating and the bank will typically require a higher interest rate in order to lend you funds. Well, in the case of bonds
and the issuer of bonds, if they have a poor
credit rating, as well as carrying
a riskier profile. Generally speaking,
the coupon rate of these bonds will need to
be higher in order for investors to feel
comfortable it taking on a higher level of risk in regards to corporate
and government bonds, the credit worthiness
of the issuer's is predetermined by a
credit rating agencies. So you don't need to
worry about requesting a higher coupon rate from
the issuer of the bonds. The screening of credit
worthiness typically categorizes bonds into either investment
grade bonds which are issued by reliable
government or municipal entities or from
large, stable cab companies. For this reason, these
types of bonds have a much lower coupon rate because they're more stable
and predictable. Now on the other hand, bonds that do not fit this investment grade category are categorized as junk
bonds because they're issued by corporations or
government entities that have a riskier credit profile and a higher chance of potentially going bankrupt and
not paying out the coupon payments or
repaying and the face value of the bonds less than
speaking about how bonds fluctuate in price during
the term of the loan, as well as what outside
influences that have an impact on the
pricing of bonds. Because let's remember here that bonds are publicly traded, financial securities that are traded every day on exchanges. It just like stocks, the value of bonds
are determined by the ebb and flow
of the market. The most important factor that comes into play in regards to the price of a bond fluctuating
in the open market, is it the actual underlying
interest rate of the economy? So let's say for example, a bond has a face value of $100 and the coupon yield
at a current moment is 3%, which would mean that the
bond holder would receive $3 annually for
holding that bond. Now if the interest
rate offered on a bond issued by the
government, for example, on a short-term one-year
$100 face value bond was safe 5% annually. Well, this does not make
the corporate bond at a 3% annual yield nearly as attractive as
the new government bond. And so for this reason, in the open market and the
corporate bond at a 3% yield, which in this example, let's say it was a
$100 face value bond at a $3 coupon rate. Well, this would not
make it nearly as attractive as that
government bond. And so in the open market, typically that
corporate bond will fluctuate down to a price where it equalizes the underlying
interest rate of the economy, which in this case is 5%. In this particular example, the corporate bond at a $3
coupon for yield would most likely lower in value down
to around $60 for that bond. That the coupon yield
would then be 5%, which equalizes the
government yield. With this in mind, the main
factor contributing to the fluctuating price
points of bonds in the open market is the
interest rate environment. And you can keep
in mind here that when interest rates go up, bond prices go down. When interest rates
go down bond prices, it will tend to go up. It's really for this
reason I strategic to hold both fixed income
instruments as well as equity positions in your
stock market portfolio so that you have a
well-diversified mixture of financial assets in your
portfolio in order to avoid being overly exposed
to certain asset classes at, during economic
cycles, depending on your goals as an investor as well as your
investor profile, you might want to hold
a higher percentage of equity positions or a higher position of fixed income positions in
your stock market portfolio. However, we're going to
be determining all of this later on in the course so that you have a portfolio that perfectly suits your
needs as an investor. All right, so that
pretty well wraps up this lecture on bonds. Hopefully you now have
a better understanding of what bonds are
and how they work. And then we're also going to
be exploring how you can fit bond ETFs into your portfolio later on in the
course in module six, the next lecture is
going to be on ETFs, also known as exchange traded funds. So
I'll see you there.
8. Exchange-Traded Funds (ETFs): Hey everyone, welcome
to the third lecture of module two, the
Investing Fundamentals. In this lecture, we're
gonna be speaking about an increasingly
popular type of financial security that
is quickly becoming a go-to instrument for
well-diversified portfolios. And it is the
exchange traded fund, also known as the ETF in
the investing community. The topics we'll be covering in this lecture include what is an exchange traded fund and how do they relate to
a market index? What are the different types
of ETFs available and y are ETFs beneficial assets to hold any stock market portfolio. In the last two lectures,
we covered what individual stocks and bonds are, which makes up a grade base
fundamental understanding of stock markets securities. However, for many individuals,
especially new investors, it can make sense to hold
exchange traded funds in your portfolio for
multiple added benefits. I've actually spoken about ETFs quite a bit on my
YouTube channel before, due to the fact that they offer investors a variety of benefits, all with one single holding. In the last few
lectures we covered what individual stocks and bonds are giving you a
base understanding of financial securities. However, for many individuals, it can be strategic to also hold a variety of
exchange traded funds in their
portfolio in order to gain the benefits of
diversified exposure, all with one single
holding its core. An exchange traded
fund is basically a basket of financial
securities, which can be either stocks,
bonds, commodities, or other financial
securities that are all grouped together
into one single fund that is then traded on a
stock has changed throughout the training day as you
would a common stock, typically when presenting
the concept of an ETF for the first
time to a new investor, it can be beneficial
to think of the ETF as a basket of carefully selected
financial securities that are all grouped together
in order to try and replicate or mimic an
underlying market index. So let's actually
take a second here to speak about what
a market indexes. That you can know the
relationship between the market index
and the exchange traded fund in the
financial world, a market index is a
theoretical portfolio of holdings that represents a
certain facet of the market and is used by investors in
order to get a snapshot in time of the performance of a
certain facet of the market. If that sounded complicated
and not to worry, let me explain here. In the financial world, there are thousands of financial securities that
investors can invest in, and each one has
individual characteristics that represented, for example, they could operate in
various industries, be of different sizes, have various trading volumes
and dividend yields, et cetera, et cetera. There's so many different
characteristics that financial securities can have In a market index is used
to group together a certain financial securities
based on common criteria. For example, the S&P
500 groups together, the 500 largest companies
in the United States. Snp stands for
Standard and Poor's. And quite simply,
this is accompany that creates these
market indexes. Now it's really
important to remember here that a market
index is price will fluctuate throughout
the trading day as the price of the
underlying assets in the market index fluctuate themselves in the case of
the S&P 500 market index. And this allows investors
to basically follow the valuation of the 500
largest companies in the United States over
a period of time and essentially see the health of
the American stock market. Of the most popular market
indexes in North America include the S&P 500
or the Russell 10000, the Dow Jones Industrial, the nasdaq Composite, and
the TSX 6D in Canada. However, these are all market
indexes that track equities and there are
market indexes that track other financial
securities, such as bonds, oil, precious metals, and
other commodities. This now brings us
back to the exchange traded fund or ETF for short, which is the topic
of this lecture. So the reason why we
briefly spoke about market indexes is because a financial management
company that creates an exchange traded fund is going to group together certain financial securities in the same ratios as
a market index. For example, earlier
we were speaking about the S&P 500 Index, which is a market
index created by the Standard and Poor's agency. However, a financial institution such as say BlackRock
or Vanguard, would it create an
exchange traded fund by basically mimicking the exact as securities
and weights for each securities of
the underlying index. Examples of ETFs
that perfectly mimic the S&P 500 market
index would be SPY and VOO in the United
States and V at V in Canada. The chart that's
overlaid right now is comparing the market index of the S&P 500 to the VSV
exchange traded fund, which is basically mimicking the exact same securities
as the market index. So as we can see, they basically are following the exact same trend and pattern due to the fact that the ETF is based off of the market index. Now the reason why
these are called exchange traded funds
is quite simple. First of all, they are a fun, so a basket of
financial securities that are all grouped together. However, the reason why they
are called exchange traded funds is because these trade
on a stock market exchange, just like you would
a common stock. And for this reason,
the value of one share of an ETF fluctuate
throughout the trading day, as opposed to say, a mutual fund, which
is also a fund. However, they only
trade onetime per day at the end of
the trading day, so the value does not
fluctuate throughout the day. Financial management
companies such as Vanguard horizons and black
rock, just to name a few, create these exchange
traded funds and then issue shares out to the public
for trade on exchanges. One of the main reasons why
so many investors choose to use exchange traded funds in
their stock market portfolio is because ETFs allow
you to gain exposure to a variety of different
financial securities in a various different
industries or markets without having to do the extensive research for each individual
position that you hold in your
portfolio as such as, for example, reading through financial statements,
balance sheets, and basically just
sitting on top of all the news irrelevant to the
individual positions, which is necessary
practice if you want to be a great investor who is well
aware of their investments, investing using an ETF can allow you to gain
exposure to hundreds, if not thousands of
financial securities and therefore diversifying
your risk accordingly. For this reason, you can also
utilize an ETF in order to minimize the volatility and risk level of your
overall portfolio. Now that we properly
understand what an ETF even is and
why they are created. Let's go ahead and
speak about some of the main advantages that ETFs
can provide your portfolio. First and foremost, purchasing an ETF provides investors with instant diversification
to all the holdings held within that one single
fund or one single holding, as we just spoke about, an exchange traded
fund is a basket of financial securities
oftentimes holding hundreds or even thousands of individual positions by holding one single share of an
exchange traded fund, let's say the S&P 500. Well, theoretically
you're owning a portion of every single one
of the holdings held within that fund in the case
of the S&P 500 and individual portion
of every single one of those 500 companies. And so for this reason, you don't actually have to go
out and individually select every single one of the positions that you
want to gain exposure to. And by owning a stake in
multiple different positions instead of one single stock or a variety of
individual stocks, your therefore able to minimize your overall exposure to a handful of individual
stocks and therefore reduce the overall volatility of the portfolio
will be discussing diversification and
it's important to later on in this module as
well as in module five. However, what I want you
to remember right now with an exchange traded fund is
that by purchasing this ETF, you're able to go ahead and get instant diversification
to all the holdings held within that fund. The second main advantage
of ETFs is they're relatively low management
fee for the added level of diversification and
passivity added to your portfolio in contrast
to an actively managed fund, such as say, a mutual fund, due to the nature of
what an ETF even is, the companies that
create them are basically just mimicking
a market index and then providing investors
and easy way to gain exposure to a given market
index of their choice, in contrast to an
actively managed funds such as a mutual fund, which is trying to provide their investors with
above average returns, trying to beat the
market essentially, this also comes with
higher management fees, usually in the one to 3% range depending on the
mutual funding question. However, with ETFs, due
to their passive nature and simply trying to
recreate a market index. This typically comes with a
much lower management fee, usually in the
0.05 to 0.7 range. By investing in an ETF, not only are you gaining
instant diversification to the financial securities within a given industry or market, but you're also getting this at a very low management fee. Let's summarize the advantages
of ETFs in a shortlist. So first of all, they
trade like a stock on an exchange which
provides investors with a much higher level of
liquidity than mutual funds that only trade one time per day at the end of
the trading day. The second is that they offer lower expense ratios
then actively managed funds and offer investors if fewer
brokerage commissions, because you only need to
purchase ETFs and once in awhile instead of actively
trading stocks and bonds, the third element is that they offer investors risk management through proper
diversification because as we just covered, when you purchase an ETF, you're gaining exposure to all the individual positions
held within the fund. Finally, there's
so many ETFs out there that investors
can really go ahead and purchase ETFs that focus on targeted industries or
markets of their choice, which is a huge advantage. As mentioned earlier,
there's a variety of different types of ETFs
available to investors because at their core
and ETF is a basket of financial securities that
are grouped together in order to mimic a
certain market index. For this reason, there
are so many ETFs available to investors because there are many
ETFs that track of various different
industries and markets. For example, there's ETFs
that track equities, bonds, commodities, futures, as
well as precious metals. And there was also
a market indexes that will track certain segments of an industry or segment
of a geographical area. Let's now cover a handful of the most common types of ETFs that you'll encounter
when starting to invest in the stock market. The first type of ETF is
known as a market ETF. And this is an ETF
that's going to track an underlying market index
such as, for example, the S&P 500 or the nasdaq 100, the TSX 60, or the Dow Jones
industrial market index. This type of market ETF
will usually serve as what I call a core holding
in your portfolio. We're an investor can go
ahead and purchase and hold ten to 30% of these broad market index funds in their portfolio
in order to serve as a foundational layer of steady appreciation
for the future. No worries. We're
gonna be speaking in detail about market
ETFs later on in the course when
we're actually crafting your own stock
market portfolio. The second most
common type of ETF is what's known as
an industry ETF. And he says it in the name here. But with this type of ETF, It's actually going
to be tracking a specific companies within a given industry,
in a given market. So for example, the
banking industry, the energy industry, utility
industries and so on. And this allows investors
to specifically target a certain
industry that they're interested in without
having to actually go ahead and individually select
only one or two positions. Next up on the list we
have commodity ETFs. And these types of ETFs will be tracking a certain
commodities such as, for example, oil or
precious metals. However, we're not
going to be focusing on commodity ETFs in this course
because as a new investor, it's much more
strategic to focus on equity positions
as well as fixed income in order to craft a solid portfolio when
just starting out, moving on, we have the
fixed income or bond ETFs. And I personally really liked
bond ETFs in order to gain exposure to fixed
income positions for practically all
retail investors, whether or not you're
a novice intermediary or even advanced investor. Because for many
online brokerages, such as what we're
gonna be using in order to purchase
individual bonds, you need to purchase at a
minimum $5 thousand worth. Whereas with a bond ETF, you can go ahead and purchase one or two shares
if you so wish, at only a dozen or a couple
of $100 here and there. And also with a bond ECF, you're able to gain
exposure to a variety of different types of
bonds at a lower cost. For example, corporate
bonds, short-term bonds, medium bonds, government bonds, and it'll list goes on. And finally, the last main form, an ETF they will
typically encounter as an investor is called
the currency ETF, which is a fund that invest
in foreign currencies. For example, the US dollar, Australian dollar,
or British pound. Basically any foreign currency, you can invest in them, uh, through an ETF and gain
exposure that way. However, just like with
the commodity ETF, we're not going
to be focusing on the currency ETF in this course. Because as a new investor
or just a retail investor, he's looking to gain a long-term appreciation
in the stock market. This is not a necessary ETF
to add to your portfolio. All right, so this wraps
up the third lecture in the module to
investing fundamentals. And I really hope
that you now have a better understanding
of what ETFs are, how they work, and how there are different types of ETFs
available to investors. Now, in the next
lecture we're gonna be speaking about real
estate investment trusts, also known under the
acronym. Read it. I'll see you there.
9. Real Estate Investment Trusts (REITs): Welcome to the fifth lecture of module two Investing
Fundamentals. In this lecture, we're going
to be discussing a type of financial security that is generally less popular
among investors, but that I believe
is a great way to further diversify your portfolio while also gaining income and exposure to a rapidly
growing industry, which is the real
estate industry. And all of this is
achieved through real estate investment trusts
acronym, read for short, the topics we'll be covering
in this lecture include what is a real estate investment trust in
the first place and why are reads beneficial
assets to hold any stock market portfolio followed by the different
types of rates. And then finally, we'll
be speaking about how to evaluate a read because
this is somewhat different. And then evaluating
a typical stalks are real estate investment
trust or reach for short, is a publicly traded company
that happens to purchase and manage real estate as
their primary business model. And they must arrive at a
minimum seventy-five percent of their income from
either the sale of property or more importantly, rental revenue reads our
financial securities that you can trade on stock exchanges it
just as you would a common stock or an
ETF, for example, where you're purchasing
a fractional shares of the company in question, and in this case with a real
estate investment trust, their whole business model
is to own and operate real estate and generate
income from doing so. Instead of a
traditional company, it is a selling of
products and services. And by including a real
estate investment trust into your stock
market portfolio, you're able to easily include a real estate into your
overall portfolio, benefiting from both
appreciation of the actual properties themselves
held within the Trust, as well as benefiting from consistent and
dividend income while avoiding all the typical
hassles that are associated with
physically purchasing a rental properties
yourself that most people just
aren't interested in. This makes RES and
extremely easy way for the average retail investors such as you and I
to gain exposure to the Canadian real
estate market or even international
real estate markets depending on the rates
you choose to invest in, which have benefited from a massive appreciation over
the past decade or so. That said for accompany
to first be considered a read and maintain their
status as a reader, they must follow
certain criteria. First off, the company
must invest at least a 75% of total assets
in real estate cash or US Treasuries second at
the company must earn at a minimum seventy-five percent of their gross
income from rents, interests on mortgages, and that financial real property
or real estate sales. They must also pay
a minimum of 90% of their taxable income
in the form of shareholder dividends each year. Following this, it must be
an entity that's taxable as a corporation and be managed by a board of directors
or trustees. Finally, a real estate
investment trust must have at least 100 shareholders
after its first year of existence and have
no more than 50% of its shares held by five
or fewer individuals. Other benefiting factors of
race that are attractive to stock market investors
are low barrier to entry into real
estate Liquidity, lack of accounting,
and then also diversification of
actual properties that you can invest in, as well as real estate markets. With that said, let's
get a bit more context around why real estate
investment trusts are generally seen as good assets for reoccurring and
dividend income. The thing about reads is that their main business model
is just a buy and hold real estate properties
and then generate a rental income from
these properties. And in Canada, the federal government that
offers at these wreath a nice tax exemption if they
redistribute a high portion of their taxable income back the shareholders in the
form of dividend income, typically in the
85 to 95% range. And the same thing is true
in the United States where real estate investment
trusts redistribute and 90% of their income back the shareholders in
the form of dividends. For this reason it real
estate investment trusts will collect rents from their
tenants and then pay for all their expenses and what's left over are typically will be redistributed and back to shareholders in the form
of dividend payments. So this is the primary reason why Not only real estate
investment trusts typically have a very
high dividend yield in contrast to other
a dividend stocks, but they also tend
to redistribute their dividends on
a monthly schedule. So they have a monthly dividend
distribution schedule. I personally like to
hold a handful of real estate investment
trust that will invest in various different sectors
of the real estate industry in Canada and across
various geographic regions. Specifically Ottawa, Toronto,
Vancouver, and Montreal. And most of the time
I like to invest in a residential real
estate because this is a type of real estate that he's not going anywhere. People needed shelter and will always need a place to live. So this is one of the main
reasons why this type of real estate investment
trusts will often have a very resilient portfolio. And what's best about real
estate investment trusts also is that these types of companies will typically pay a dividend yield from
around five to even 7%. And it's not going to jeopardize at the company's cash flows. In Canada and the United States, there are typically two types of real estate investment
trust causes with the most common one being
equity reads where they're going to actually purchase
physical properties. And then from there, typically most equity reads are
going to go ahead and specialize into one type of
real estate in question. For example, that
could be residential, it could be industrial, office buildings,
retail, et cetera. The other class of
read which is far less common is called
a mortgage rates, also known as Emirates, where the ray will
actually generate loans to other developers or accompanies that secured by real estate, but doesn't actually hold any physical real estate itself, making them more of
a financial company than a traditional reads. And for this reason,
we're going to be focusing on the equity
reads which are significantly more
popular and common in Canada when looking at a specific retired
to your portfolio, it might be tempting to
utilize the same metrics and financial figures
that you would use to analyze a common stock as
such, as, for example, earnings per share,
price to earnings ratio, price to book ratio, and a variety of other
metrics that will be learning all about throughout
the rest of this module. But in reality, what's most important when
evaluating a read is their own set of criteria and financial ratios that we're gonna be looking at right now. The first and most important
figure in order to evaluate a real estate investment
trust is known as the funds from
operations acronym FIFO. The FIFO of a rate is calculated by adding the depreciation and amortization to the
funds earnings and then subtracting any gains
on sale of property. The reason why we
would do this and why the funds from operations, it gives investors
a better picture of a reach operations and their financial
viability is due to the fact that that a
sale of a property, it could generate a
massive influx of cash for the company
in a given period, and this will have an impact on the revenues and net earnings. However, the sale of
property is a onetime event. So even though it's going
to have an impact on the net earnings of the
company in that given period. It will not have a reoccurring
a positive impact on the company's operations and revenue generation
moving forward, such as with rental income, basically the FIFO is a
better metric to evaluate the reads quality and net income that's being derived
from rental income. And this is a metric that
should be used instead of net income when looking at a
retail financial viability, the same is true for
the earnings per share. In the case of a reach, the FIFO per share is a more accurate depiction of
the company's performance. And you can find
both the FIFO figure as well as the FIFO per share figure in a real estate
investment trust quarterly and annual
earnings reports. Now what I'd like
to see though, is a growing FIFO figure
year over year. Because with this tells me as a potential investor is that
this fund is focused on acquiring more rental
properties and a generating more
high-quality rental income. I'll also optimizing the rents in the properties
they also have, instead of selling off
their property assets, which skews in that income. Now for a real estate
investment trusts due to the fact that
their funds from operation is sort of their
own version of net income. While in regards
to their dividend, a more useful metric for assessing the
dividend viability is the FIFO pale ratio instead
of the dividend payout ratio. This is basically a calculation of the dividends paid out by the fund that divided by their overall funds
from operations. I typically like to see an FIFO payout ratio for a
reader that is below 80%. If I, II, III, we're
going to be revisiting the dividend pale ratio
in the next module, which is dedicated entirely
to dividend investing. Once you watch that lecture
on the dividend payout ratio, you may want to revisit
this lecture on race to fully comprehend the
FIFO payout ratio. The third important
thing that I look at when assessing
the viability of a rete is the resilience of their portfolio and the
quality of their tenants, depending on the type of real estate that
the fund invest in. Specifically, they're
going to have a various types of tenants and tenants that operate in a different facets of
business altogether, most real estate
investment trust that will have a section within their earnings reports
and that is dedicated to their tenants and
their tenant mixture. And depending on the economic cycle that
we're living through, the type of tenants
that have Rita's can have a major impact on
the rent collection. For example, during this whole corona
virus pandemic period at retail real estate has
somewhat taking the turn for the worst because it retail
tenants are shutting down their doors and are having difficulties at
paying their rents, which obviously is going
to have an impact on the revenue collection of real estate investment
trust that, that focus on
retail real estate. In this example, rio can, which is a popular Canadian
read that owns and operates retail real estate could
be in jeopardy, however, by looking closer into
their tenant mixture, they have focused
around a 75% or more of their tenants on
staple businesses like grocery stores
and pharmacies. So regardless of
the economic cycle, they are able to maintain
their rent collection. This is really just
something that I wanted to mention
when you're going ahead and looking at real estate investment
trust for yourself, keep this in mind that it's an important factor to know what the tenant mixture is at for the real estate investment
trust in question. And finally, the
last figure that I typically look at to
assess the health and growth of a real
estate investment trust is called the net
operating income, commonly known as the NOI. The net operating income is
a figure which subtracts all the operating expenses of a piece of
property in question, or in this case, an
entire portfolio from the actual income of the property or
portfolio as a whole. And operating expenses can be anything from
property maintenance, janitorial services,
insurance premiums, utilities, legal fees,
and the list goes on. This tells investors how profitable the read
operations are before taking into account of financing activities such
as mortgage payments. Basically, how much is the reeds portfolio
generating before taking into account
and mortgage payments as well as tax payments. What I like to see
is a growing and net operating income
figure year-over-year. Because what this
tells me is that the real estate
investment trust is able The generate more revenue
at a lower operating costs. This wraps up the lecture on real estate
investment trusts and completes the initial lectures defining a stocks and bonds, ETFs and real estate
investment trusts, which are the four main types of financial securities that you'll be investing in in
your portfolio. In the next lecture, we're
going to be speaking about why the price
of stocks and other financial
securities fluctuates in the open market
during a training day.
10. Why Stocks Move in the Market: Hey there and welcome
to the fifth lecture of module two Investing
Fundamentals. In this lecture, we're gonna
be discussing why stocks and financial securities
fluctuate in value over time in
the first place. And although this
might seem like a basic or odd topic to cover, it is very important
that as an investor, you properly understand
what factors contribute to the fluctuation of price points for stocks and
financial securities. So that you can
better assess which financial securities
are going to be more viable for your portfolio. The topics we'll be
covering in this lecture include what impacts
the price of a stock as well as
the market price versus the actual
value of a stock. If you aren't familiar with the concept of supply and demand, let me quickly explain it so that we're all on
the same page here. On one side is supply
is the amount of a given product that's available for trade
in an open market, this applies to goods that you buy at the store just as much as it applies to stocks and
other financial securities. However, in the case of stocks, a company will only issue a certain amount
of shares out into the open market
that investors and traders are able
to buy and sell. On the flip side, demand is how much investors and
traders are wanting to purchase a given stock or financial security and given the fact that there's
a limited supply, supply and demand is a relatively
basic economic concept, but it applies directly
to the reason why the price of stocks
fluctuate over time. If there's more demand for a given stock with the
supply remains the same, the price point will
go up and vice versa. So on a preliminary levels, supply and demand is one of the main reasons
why the price of stocks and other
financial securities fluctuates over time. However, there are some
other specific reasons that we're gonna be
speaking about right now. Now, even though supply
and demand is ultimately behind the price
fluctuations of stocks, it can be difficult to sometimes comprehend why
investors might show more interest to
a given stock at a higher volume
than another stalk. And this ultimately
usually comes down to two factors which are qualitative and
quantitative factors. With that said, even though the market value of a
stock can differ greatly from its true value based on underlying financial
fundamentals, the price movements as well as market value of a stock
is generally going to dictate what investors feel accompanies worth
in a given moment, even though this can
change rapidly in a matter of minutes or even
a couple of hours. From a qualitative standpoint, there are many factors that
can influence the short to medium-term price
fluctuations of a stalk. Some examples would include positive or a negative
news about the company, as well as the competency of board members or
even predictions on future expectation
of earnings or expansion lines
of the company. Basically from a
qualitative standpoint, these groups together
the way investors feel about a given stock in
the short to medium term, because this can
have an impact on the revenues or other financial
figures for the company, which is a quantitative element that we're gonna be
speaking about shortly. This is the reason why generally when negative
news comes out about accompany the stock price will plummet in the short
to medium term. However, naturally over time, once investors and the
general public forget about this negative news and new information comes
out about the company. The stock has the
opportunity to creep back up to the price point
that it was before. For example, with
Delta Airlines, this is exactly what happen when a viral video came out of someone being
assaulted in one of their planes in the
short to medium term. And this had a negative impact on the price fluctuations
of the stock. However, this was before
basically the crash that we just experienced where all airlines basically crashed
over the board. But this is an example
of a qualitative factor that can have an impact on the price point of a
stalk in the short-term. Another qualitative element
to consider here is that typically the current
market price of a stock is going to price in
future positive or a negative expectations
for the earnings of a company in any
given moment right now, for this reason that let's
say some negative news about one specific
industry came out. And for this reason,
a given stock in that industry went down in
value in the short-term. Because investors think that
this will have an impact on the quarterly revenue figures
in the upcoming quarters. Well, in the short-term, investors might price in this negative
expectation into the, a current market price, however, fast-forward to when the quarterly earnings
report actually comes out. Let's say, for example, the revenue figures
were not nearly as negative as anticipated well, because the negative
news was already priced into the market value, this could then result in not having a negative
impact once again, on the market price of the stock because the negative news
was already priced in. And for this reason, the price could actually creep back up to a positive level in once again, the
short-term, medium-term. Moving on now to the
quantitative factors that have an impact on price
fluctuations of a stock. Obviously this also has an
impact because now we're speaking about the actual
numbers of the company. This can include, for example, the actual revenue figures, net income, the amount of debt
that accompanies holding, as well as their
operating costs. Basically, everything that has
to do with the numbers for the company is considered to
be a quantitative element, which absolutely will
have an impact on the price point of stocks in the short, medium, and long-term. Now there are many factors
that come into play from a quantitative
standpoint that investors use when
they're analyzing the viability of a stock
for their portfolio. And we're gonna
be speaking about this in more detail later on in this module when
speaking about the cash flow, income statement and
balance sheet of a company. However, right now
for this lecture, we're first going to be speaking about the revenue figures. Generally speaking,
the most important quantitative factors
that come into play for the stock price is going to be the revenues and net earnings
figures of a company. The net earnings figures are basically the profits
that a company is generating after paying
all the other expenses. And the reason why
this is so important over the long term is
because a company is simply cannot survive long-term without a generating profits. It's for this reason that
many investors who are looking for a long-term
position like to invest in companies that have a
nice proven track record of increasing earnings
year-over-year, as well as increasing revenues
and lowering expenses. Because after all
over the long term, a company that's going to be viable is going to
need to show profits. Public corporations
are required to report their earnings of four times per year in their income statement, as well as a variety of other information related
to their finances in their balance sheet and cash flow statement that all
investors have access to. The reason why
public companies are required to report their
earnings and figures four times per year is so that financial analysts can create projections on the
future value of the company as well as how
it's valued right now. And so that basically anyone who's looking to invest
in the company can get a clear picture of
what's going on behind the scenes in this company from a financial standpoint in mind, however, that the
earnings figure is only one quantitative element that comes into play in terms of the market value of
a given company. And this can have the
impact of raising or diminishing the current
market price of a stock. With that said, in the
opening stock market, It's not uncommon to see
some stock prices surging, even though they have some counter-intuitive
quantitative elements, that generally speaking, are important factors for the
viability of a company. For example, with the tech
company Shopify Incorporated, which is located in Canada. Well, their net
earnings deficit grows larger every single
calendar year, which technically or
theoretically speaking, it would have a negative
impact on the stock price. However, year-over-year,
the stock price is surging to all-time highs. This example of Shopify stock price surging
year over year. Even though the earnings deficit grows larger every single year, it brings us back to the
qualitative elements that we spoke about earlier, because in this particular case, investors are very bullish on the future industry and future earnings of this
company for this reason, they are pricing in
future expectations of very positive earnings into the price of the
stock right now, which is reflected in the
current market price. This is a clear example of how both qualitative and
quantitative elements come into play when the market determines a fair price
point for a given stock. And also demonstrates
the complexity of this matter where there are so many factors that
come into play. And for this reason, investors have developed ratios as well as metrics in order
to help determine it more information
about the company. So to summarize
everything that we just spoke about
in this lecture, the qualitative elements are basically everything that
has to do with the company. From an investor speculation and emotional standpoint about how they feel about the company. And then on the flip side, the quantitative elements are actual raw financial data related to how the
company is doing. Both qualitative and
quantitative elements can be just as important in the current market
price of a stock and depending on the
company in question. All right, So that wraps
things up for this lecture. Hopefully now you have a
better understanding of how both qualitative and
quantitative elements can have an impact on the market price
fluctuations of stocks. We're going to be speaking about more quantitative factors
in lectures and 91011, when we dive into reading
the balance sheet, income statement and
cashflow statements of a given companies.
11. Wealth Building Fundamentals of the Stock Market: Hey there and welcome
to the sixth lecture of module two Investing
Fundamentals. In this lecture, we're
gonna be learning all about the two primary wealth
building fundamentals of financial securities that you're going
to be buying and holding and how they can impact the long-term growth and success of your stock
market portfolio. The topics we'll be covering in this lecture include,
first of all, what asset appreciation is, followed by what
dividend income is. And then following
this, we're going to end the lecture by going through an example of how asset
appreciation and dividend income, it can work together
to really work wonders and grow your portfolio over time when investing for the long term to grow your
wealth in the stock market, there are typically two
factors that come into play. The first one being
the appreciation of the actual market value of the stocks and
assets in question. And the second one being
a dividend income, which is income that
you're receiving simply for holding
those positions, which can then be
reinvested back into the portfolio that's
buying more shares of the companies and
funds are invested in asset appreciation through
buying hold stock investing is generally going to
be the main way that investors create
wealth long-term through investing in
the stock market and asset depreciation
is very simple. It is the overall
appreciation in the value of the stocks and other
financial securities that you hold in your
investment portfolio, which over the period
of time and that you hold these investments
can greatly appreciate if the companies or funds that you're
investing in Excel, thus creating a very nice
financial cushion for you in retirement or any other financial goal that
you might have. Now, although the
appreciation can greatly vary from one
stock to another, depending on the company's
you choose to invest in. Historically speaking, large and well established american companies
that are part of the S&P 500 will
typically grow at an annualized rate of
around 8% per year. So if you decide to invest in an S&P 500 ETF or examples such as what we spoke
about in the ETF lecture. This will typically grow that investment at
around 8% per year. If we look at this
chart, we can see the S&P 500s historical
annual returns where over a substantial
period of time, most years that show
a positive return. And this is the reason why investing in the
stock market can tremendously build
your wealth through the appreciation
of your holdings. In module one, we covered
the typical length of time for a bull and bear
market that once again, and we can see on this particular
chart where if you stay invested in quality companies and funds for the long-term, asset appreciation can
really take effect and your portfolio will start benefiting from
compound interest, which we're gonna be speaking
about in more detail in lecture 14 of this module. Now I do want to
mention that this is the historical
annualized returns of companies in the S&P 500. If you were to invest
in an S&P 500 ETF. And these companies are larger and more established
in their industry, meaning their revenues
are more steady and therefore they have more
consistent growth rates than smaller cap companies that can have explosive revenue grows and therefore
explosive appreciation of their share price. On the flip side,
when investing in a smaller size to grow
stock, for example, an investor can typically expect a higher level of return in the 8% annually that you can
expect with an S&P 500 index. But this inherently comes
with a higher level of risk. Now when projecting
the long-term growth of a well-balanced portfolio, typically we expect a six to around 11% annualized
growth rate depending on your level of risk. And for this reason, the
percentage of your portfolio that is allocated to
equity positions, we're gonna be
learning all about proper asset and makes it as an asset allocations based on your investor profile
later on in this course. So if these are new
concepts to you and not to worry in comparison to the S&P 500 historical
annualized growth rates for the nasdaq Composite Index, which tends to hold a
higher concentration of stocks that are in
the technology sector. It has been around 25% over the last five years as of 2020, which is quite impressive
and demonstrate how different industries can really appreciate at different rates. At the end of this lecture,
we're gonna be going over a concrete example of how asset appreciation
and dividend income, which is the second and wealth
building fundamental of stock market investing
can work together with compound interests
to really create a, some massive returns over
time for your own portfolio. But first, let's
quickly cover what dividend income is if this
is a new concept for you. By the way, if you had a
chance to browse through the different modules of
this investing course, you may have noticed
that the third module is dedicated entirely to
dividend investing, where we're gonna
cover everything that has to do in dividends. They're used where they come
from and how they work. But quickly in this lecture, I wanted to cover what
dividends are so that you can have a better
idea of how they work in combination with
the appreciation to really grow your
portfolio over time, dividend income is quite simply a redistribution of
a company's earnings back to shareholders
as a way to thank the shareholders for holding
shares of the stock. Keeping in mind
that companies are never obligated to redistribute a portion of their
earnings back to here holders in the
form of dividends. But this is just a
nice way to entice potential investors to buy and hold it shares
of this company. Typically, companies
that redistribute dividends out to their
shareholders are well established in their
industry and are large companies that have
a reoccurring revenue. And therefore, they don't
necessarily need to reinvest all their earnings back into the growth of their operations. This is the main reason why smaller companies or companies
that are really focused on rapid growth and expansion are not going to be
redistributed a dividend out to their shareholders
because they're really utilizing all of their income. Back into funding their
operations and really focusing on exponential
growth of their top line. In return for this though, individuals that invest in smaller companies or companies that don't pay out a dividend, it will typically expect a
higher level of appreciation, which comes back to the
first and wealth building fundamental of investing
in the stock market. For example, the company
Coca-Cola has been paying out dividends for nearly
60 consecutive years. And I've been raising those
dividend distributions of practically every
single year since then, this has beneficial
for stock investors because it can provide
your portfolio with steady and re-occurring income
while also helping grow the value of your portfolio over the course of
your investing career. If you decide to reinvest those dividends back into
purchasing more shares, once again, will be speaking
in more detail about why dividends are
beneficial in module three. But I really hope this
quick explanation of dividends help you better understand what they are and how they work
in combination, appreciation and dividend income being reinvested back into the portfolio can create some massive exponential
gains over time. Finally, let's look at a
concrete example of how asset appreciation and
reinvesting of dividend income back into purchasing
more shares can impact the long-term growth of your portfolio with
accompany at TD Bank. So let's say you
had purchased at $550 worth of TD Bank shares in 1989 at which in
today's value as of 2020 is equivalent to around at one hundred,
ten hundred dollars. Now at this calculator
right here allows you to track the value
of your investments, any specific stock with
the reinvestment of dividends back into purchasing more shares of the company. In this particular case, we're looking at TD Bank on the New York Stock Exchange at an initial value
of $550 invested. And for the sake of a
long-term investment, let's assume that
each month you added $100 of your own money into the portfolio to
purchase more td stock exclusively when executing
this calculation. And we can see here
that the final value of your $550 initial investment, it would be $221,721 at an
annual return of 14.26%. Let's also consider that your $100 monthly contribution would equate to a
total contributions of only $37,200 over
the 372 month period, meaning appreciation
and reinvestment of dividend income
for this stock over this 30-year period
would have grown your capital invested
by $184,466. This is quite
impressive and really showcase his firsthand
the power of these wealth building
fundamentals when investing in the stock
market for the long-term. So to summarize this lecture, the two main a wealth building fundamentals of investing
in the stock market. Our appreciation of the
actual market value of your shares over time, as well as dividend income, which if you reinvest
it back into the portfolio that's buying
more and more shares over time of this specific
companies and finds your invested in these together can create an exponential
growth effect. And through what's known
as compound interest, which we're gonna
be learning all about later on in this module.
12. Understanding Stock Quotes: Hey there and welcome to
the seventh lecture of module two, Investing
Fundamentals. In this lecture, we're
gonna be learning about a very important element
about stock market investing. And that is how to properly interpret a current
market view of a given stock by understanding how to read a stock, quote, the topics we'll be covering
in this lecture include, what is a stock
quote a followed by all the elements held
within a stock quote. And then following that,
we're going to be doing a real-time view of reading
a stock quote together, starting off with what
a stock quote Even is, it's important that we first think back to what we learned in previous lectures about how stocks are priced in the market. Every day of the
week, investors and traders will buy
and sell millions of shares of publicly
traded companies in stock exchanges. And what we need to really
understand here is that the stock exchanges
are sort of like instant auction
houses for stocks. However, unlike in the eighties, when you had to call up your
stockbroker in order to gain information about
a certain company or stock that you're
interested in. We can now learn irrelevant
information about the stalk and question
related to their financials as well as
preliminary context of other stock in what's
known as a stock quote. This is exactly what
a stock quote is. It's a current display of relevant financial
information about each and every stock to give buyers and sellers a timely portrait of relevant
data about the company. Now initially when
you're a new investor or the idea of reading
a stock quote and interpreting all this data can be quite intimidating
and confusing. However, I guarantee you that
at the end of this lecture, you're going to
understand how to properly read
everything that has to do with a stock quote and be able to use it to
your advantage. Now also something important
to note here is that every single different
trading platform is going to have a different
version of a stock quote. So even though it might
look different 99% of the time all the information is going to be relatively the same. And this is all the information that we're about to look at. The following data
points are what most A-star quotes contain and what we're gonna
be diving into, starting with the market
price and currency, the movement of the stalk, the ticker and exchange the bid, the ask, the open previous
close days range, 52-week range of volume, average volume, market
cap and the line chart. For the sake of this lecture, we're gonna be
learning about the stock vote on Yahoo Finance, which is a stock quote that I personally use all the
time in order to get preliminary context
about companies that I'm interested
in and before doing further research on a specific platform
like Western aid. Alright, so here we are on
Yahoo Finance as mentioned. And for this lecture
we're gonna be looking at the stock quote of the
Toronto Dominion bank, which is a large Canadian bank. And Canada it happens
to be in the top five, and it also has a certain
branches in the US and is also listed on American
stock exchanges. The reason why I like
Yahoo Finance as a preliminary source for information about
stocks that I'm interested in is
because they have a very simple version of a stock quote with
information that is laid out very nicely with all the relevant
information that is typically held
in a stock quote. Now I do want to mention that certain ratios and metrics
we're actually going to be diving into on a
much larger scale in specific lectures
dedicated to each one. For example, the earnings
per share or the price to earnings ratio and the
Beta, just to name a few, but we're still going to
look at a preliminary view of a stock quote here so
that you can get a better, a picture of what you're
looking at when first going on a trading platform
and seeing a stock quote. So let's start at the top. Obviously we have
the actual name of the company in question, which is the Toronto
Dominion bank. Now the ticker is going to
be right beside the taker, is essentially a three
or four digit code associated with each
individual company that is publicly traded on a
stock exchange so that investors can quickly
reference a given company. Now in the case
of Yahoo Finance, it just below the name of the company and the
ticker we actually have the stock is changed for which this stock is traded on. In this particular case, it is the American
version of the TD stock, meaning it is trading on the
New York Stock Exchange. Now if we were looking at the Canadian version of TD Bank, This would say TSC for Toronto Stock Exchange
to the right of this, we have the currency in which
the stock is trading in, and in this case it
is American dollars. Once again at the
Canadian version of TD Bank trade in
Canadian dollars. All right, so moving on below the name as well
as the currency, we have the actual
market price at the current moment for
this specific stock. In the case of Toronto
Dominion bank, it is $48.25 at
close at four PM. This is the current
price at which the equity is trading
at in the market. And this value is going to vary every single second as traders are buying and selling shares of the company just to the
right of the market price. We have the variant during
the single trading days. In this trading day,
I'm filming this after the market has
closed at 04:00 PM. So during the trading day
it has gone up by $0.78, which translates over to
1.64% in this trading day. And that's the reason
why it is in green. Now if it had gone down
during the training day, this would be in red and it would most
likely be, let's say, negative at $0.78 or negative 1.64% to the right of the market price
and the variance during the single trading day, we have the after
hours price points. So after hours, once the
markets actually closed, because let's remember
here that stocks only trade at during weekdays. During business hours or
trading hours in this case. So after hours, however, there is a certain
trading that happens. And this is going to
essentially mean that the stock will open at a given
price point the next day. So as of right now for TD, we see that it is
still at $48.25. So after hours, there has
not been any movement. However, we will typically
see movement during weekends and it typically
in periods of high volume, whereas stock can
open the next day at significantly different
price than where it has closed in the
previous trading day. Moving on now we have
the previous closes. The previous close in
this case is $47.47. And this is the price
point at which this stalk close that in
yesterday's trading day. So in this case, I'm filming
right now on a Wednesday, meaning that this was the
price point that they stock close that on Tuesday
evening at 04:00 PM. The next piece of
information below the previous close is the open. The open in this case was $48, meaning that after hours there was some price
movements for TD Bank, meaning that it
closed at $47.47, but it then opened at $48 because after hours there
was some bullish trading going on at where essentially
the price was driven up after hours and
opened at $48. I want to remind you
here that the open can be below the previous close, meaning it could have opened, for example, at
$47 instead of 48 depending on how the market
was reacting after hours. The next piece of
data that we have on Yahoo Finance is called the bid. The bid is the highest
price that buyers are willing to pay in the moment
for a specific stock. So let me explain
a bit more here. The market price
of a stock being $48.25 that we're seeing here is essentially the market price of that current equity
in any given moment. However, like I
mentioned earlier, a stock exchange is essentially
like an auction house for equities such as stocks or other things
such as bonds, etc. But regardless, it's like
a little auction house. So we have both bid
and ask prices. The bid is the price
that buyers are willing to pay and
the ask is what a sellers are asking
for in terms of price point for this
specific stalk. In this particular case, the bid is $48.24 and
the OS is $48.25, which is $0.01 above the bid. Now the difference here
between the ask and the bid is what's known as the
spread of a stock. In this case, $0.01 is
a very small spread, meaning that if you initiate a market buy of this
particular stock, it will most likely be filled
instantly because there is a very high volume
of stocks being traded and the bid ask
spread is very small. Now on a stock that has a much less volume
in a trading day, the bid and ask prices
can vary greatly, meaning there's a
much higher spread between the bid and ask price. And this is when it can
become very difficult. Yet a certain price
point that you're after if the bid ask spread
is very large, the next piece of
information that we have access to is called
the days range, which is very self-explanatory, is the range in which this specific stock traded
at during the trading day. In this particular case, the lowest price
that it went to was $48 and the highest price
it went to was $48.60. Moving on, we have
the 52-week range, which is essentially the
same thing as the days range except on a much larger
scale of 52 weeks, which is a year. The 52-week range
is going to show you the highest price
point that they stock reached during
the year and the lowest price point that
it reached in the year. In the case of TD Bank, it was $33.74 at the lowest, and the highest being $58.51. Sense the reason why this is such a large difference here is because we just experienced, as I'm filming this, the
market downturn in March 2020, which is the reason why
it went so low here. Okay. So the next piece of information I have already referenced previously and that is
the volume of a stock. In this case, the
volume is 1,366,820. But what is the
volume of a stock? The volume is quite simply the amount of
shares that had been treated during one
single trading day being this training
day right now. So this basically means that
during the training they, there have been 1.3 million
shares that have traded hands between different traders
that are buying and selling TD Bank during this day, typically speaking, the
higher volume of the stock, the more popular it is. And for this reason,
there will be a much smaller bid
and ask spread. Large cap stocks like
most bank stocks, Disney, Coca-Cola, etc, are going
to have a very high volume. And for this reason,
this puts a lot of liquidity into these
companies where you can quickly buy and sell shares whenever you please add
a favorable price point, because at the bid and asks red is going to be relatively small. Now the average volume of a stock which is right
below the volume, is also quite self-explanatory, where this is the average
amount of shares that trade investors hands during
a typical trading day. In this case right here we
can see that today there was a much lower volume for TD
Bank then on an average day, we've already made
it through the first a left column here of information contained
in the stock quote for TD Bank on Yahoo Finance. I hope you're starting
to understand why this isn't necessarily all
that complicated. We just needed to
understand each data point. So what we're going to move
on to the next one here, which is the market cap at $86.757 billion for
Toronto Dominion bank. And I do want to say here
that the market cap, we're actually going to
have a full lecture on specifically coming
up in this module. But we'll quickly showcase
here what this is. The market cap is basically the current market price of
each individual share being $48.25 multiplied by
the outstanding number of shares for this
publicly traded company. In this particular case, it is millions and
millions of shares, which means that this is the actual value or
the market value, I should say, of this
publicly traded company. That's all I'm
gonna say right now for the market cap,
because again, we're going to have
a full lecture on it where we're going to learn all the different
market cap sizes and essentially how you can calculate the market
cap for yourself. Moving on to the next
piece of information contained in the Yahoo Finance
stock quote for TD Bank, we have the beta. Now, I'm actually
going to skip over the beta for right now
because this is actually a more complex topic that
I want to actually really focus on in a full lecture
later on in this course, we're going to skip over it
for now and then revisit it in much more detail
later on in the course so that right now you can
understand how to properly analyze the basic information
contained in a stock quote. The next one is the PE ratio
in parentheses at TTM. What is this? Well, first of all, the PE ratio stands for price to earnings ratio and TTM stands for
trailing 12 months in finance. And when you're
interpreting stalks, TTM essentially
means all the data over the last 12 months
for this specific stock. In this particular case, it is the price of the stock divided by the
earnings of the stalk. And this is showcased as a ratio over the last
trailing 12 months. Now just like the Beta, which is essentially the
variant of a stock, we're going to have a specific stand-alone lectures for the
price to earnings ratio, the earnings per share and
a couple other metrics, the price to book ratio
later on in this module. So I'm not gonna spend
too much time right now explaining what
each one of these are. Because once you actually learn them in their specific lectures, you'll be able to revisit this
lecture and then properly understand what we're looking
at with the PE and the EPS. We're almost done here. We have a couple more
data elements to cover. And then it will be done for the stock quote of TD
Bank on Yahoo Finance. So the forward dividend
and yield of TD Bank is $2.36 in parentheses, 4.96%. What does this mean? Well, the forward
dividend is essentially the cash distributions
that a company is going to be paying
out shareholders strictly for just holding
shares of this company. In this case, $2.36 is
the cash distribution that each shareholder
is going to receive for each stock that
they hold of this company. In order to understand more about dividends
and why companies issue dividends and how you can use them to your advantage. I've dedicated an
entire module to dividend investing
in dividend stocks later on in this course. But just so that you
quickly understand right now I'm moving
on in the course. The dividend yield is going
to be the actual value of the cash dividend divided
by the current market price. In this case, $2.36 divided by $48.25 represents a
4.96% dividend yield, meaning the percentage of the market value that
you're receiving for every single share
that you hold of this company in one
given calendar year. And finally, the last piece of information that I want to
cover for the stock quote actually is not contained in the stock quote
on Yahoo Finance, however, it's in most
other stock quotes, and that is the
outstanding number of shares of a company. As we learned earlier
on in this course, each company is going
to issue out, uh, portions of ownership of
their company called shares. And this is typically in the millions and
millions of units. So I actually like to see the actual outstanding number of shares in the stock quote, but you can find this on other stock quotes
such as for example, on it, TMS money, we can see it right here
for Toronto Dominion bank, they have 1.8 billion shares
outstanding at currently circulating in the
market that investors can buy and sell
each and every day. And obviously I have
saved the best for last, which is the actual chart
for the stock price of each individual company that is going to be contained
in the stock quote. In this particular case, we can see on Yahoo Finance, you can see various
different timeframes. So one day, five days
a month, six months, all the way up to
the maximum amount, which goes back below 1996. Now Yahoo Finance
allows you to see the stock price chart in
various different formats. In this case, we have
the red green area, wear it when the actual
variant in the day is green, the chart will be green
and when it is read, the chart will be red. They also have a line graph
that you can see right here, as well as other variations
like an area graph, which is going to be the same
thing as the red and green. However, it's just always
at one single color or candlestick chart that we're not going to be speaking
about right now. But in all honesty, I like to
look at the stock chart of specific companies I'm
interested in on Google Finance. So let's look at that right now. All right, so as
you can see here, this is another version of a stock quote
because Google also has their own variation
of the finance section. So in this case, it is the stock quote of Toronto
Dominion bank once again, and he's on the
New York stock has changed with a ticker TD. I'm not going to run
through everything once again because it
is very similar, but the information, as you can see is basically the same. We have the open, the high, the low, the market cap, the price to earnings ratio, dividend yield, as well as
this information right here. But the reason why
I like there were actual chart better is because you can actually click on a specific data point
or a data should say, and then drag it over and
you can see the variance in a percentage format
that appears in real-time. Same thing goes for
a downward trend. So we can see that in
this particular case, in February all the way down
to the peak lows in March, it went down by 40,
40%, 0.97% actually. Then it recovered up 42.62%. This is just something
that I personally like more about the stock
chart on Google Finance. But again, I use various different
stock charts and stock quotes to gain
information about accompany this pretty much wraps up the quick
lecture on how to properly read and interpret the information
in a stock quote, like I said earlier,
we're gonna be diving into some
of these metrics, such as the price to earnings ratio of the variance, the beta, and the price to book ratio in their very own
standalone lectures, I really hope that you
enjoyed this one and let's move on to
the next lecture.
13. Market Capitalizations: Hey there and welcome to
the eighth lecture of Module two Investing
Fundamentals. In this lecture, we're
gonna be learning all about market capitalization or
market cap for short, what it is and how
different companies are categorized differently based on the size of their market cap. In this lecture, we're gonna be covering the following topics, starting with what is market cap and how
is it calculated, followed by the
characteristics of large-cap, mid-cap,
small-cap companies. In the previous
lecture, we spoke about reading and interpreting
a stock quote as well as all the various data
elements that are contained within a stock
quote so that you can properly understand and what
you're looking at it from a quick snapshot
point of view when assessing a company
for the first time, one of the primary and
most important elements that you can find in
his thought quote is the company's
market capitalization at that investor is
called market cap. The market cap quite simply
is a total dollar value of all the outstanding shares of this publicly traded company. Quite simply, this equates to the total current market value of this company as a whole. Because earlier
on in the course, we learned that stocks are essentially a portion of
ownership of a company. So if you add all the value of those individual portions
of ownership together, you get the current market
value of the company. It's important to note, however, that even though the
market capitalization does provide investors with a snapshot in time of the current market
value of the company. This doesn't necessarily reflect the true underlying value
of the company's worth. This is because as we learned
earlier in the course, the shares of accompany
can be either overvalued or
undervalued relative to economic market environment or the actual financial fundamentals
of the company itself. So just keep in mind that
a market capitalization, although it's a
great snapshot in time of the company's
market value. This doesn't
necessarily mean that it's truly worth this value. In order to calculate a market capitalization of a company, the equation is very simple. All you need to do is multiply the current market price of one individual share by all the outstanding shares
of a given company, typically in the millions
of outstanding shares. Keep in mind that the
market capitalization of a company is
used by investors really only to determine the current market value
at any given moment. And due to the fact
that a single share can greatly fluctuate in price even throughout one
single trading day, the relative market value of a company can greatly
fluctuate throughout a short period of time due to the volatile nature
of certain stocks. With that said at the market, cap is typically used as
a preliminary measure to categorize certain
companies into various groups being large cap, medium cap and small
cap companies. There are also micro
cap companies, but we're gonna be focusing on the 3 first ones with
a large cap company being a more of a stable and a well-known company that is
established in its industry. So let's actually
first dive into the characteristics of
a large cap company, followed by medium
and small cap, starting off with the
large-cap companies, these are generally companies
that have a market cap exceeding $10
billion or more and are typically going to be more stable companies that
also pay out dividends because their revenues
are more constant and expansion of the
company is slower. These are also going to be typically well
established companies in their industry that
are well-recognized that by the overall population, large-cap companies
will also typically provide a slow and steady
returns for investors. But over the long run, these companies
reward investors with consistent increases in share value and
dividend payments. Examples of large-cap
companies, for example, would be the Royal
Bank of Canada, IBM, Disney, and so forth. Moving onto mid-cap companies, these are going to be
companies that typically range between two billion and
ten billion dollars in market capitalization. These are companies that
are generally going to be in the process of expanding, even though they're still
not at the beginning of their whole expansion projects
and aren't really going to be a start-up status
anymore and they can provide a quicker returns
then a larger cap stocks, generally speaking, now
some mid-cap companies, it might pay out a
dividend depending on their overall
expansion strategy. Because let's remember here that even though accompany might be between 2 $10
billion in market cap, It doesn't necessarily
mean that it's a younger company that is still focused on a rapid expansion because accompany
could at plateau at, let's say five to $10 billion in market cap and still be an
older company that's well established and is
in a position to redistribute a portion of their earnings back
to shareholders. Now, for many portfolios
and mid-cap companies can be a happy medium between a small cap growth stocks
that we're going to provide a higher returns but
higher-risk and a larger, well established companies
that are going to provide more stability
and dividend income. And finally, the
last category of market cap companies that
we're gonna be speaking about here is small cap companies
which typically range between three hundred million
and two billion dollars in outstanding market cap. So quite a bit smaller than a medium and even
large cap company. And these are companies
that are focused primarily on reinvesting as
much of their income as possible into expansion of their operations in order to grow the overall size and reach of the company
at a more rapid pace. So this is one of
the reasons why small cap companies
are typically seen as being gross stocks depending on the
company in question. These smaller cap
companies can provide investors with higher
levels of return, but also inherently come with higher risk because they
aren't as well established in their industry and they don't necessarily have as much of a solid foothold in their
overall client-based as, let's say, a large cap company. Small-cap companies
are also more sensitive to economic
slowdowns due to the smaller balance sheet and a smaller revenue figures
it generally speaking, I really hope this gives you
a clearer picture of what the market capitalization
of a company is and how it can be used as a
preliminary way to assess a company's size
as well as risk level. There are however, many different metrics that are much more important than you need to take into
account when analyzing a company that we're gonna be learning later on in this video. These include income
statements and balance sheets,
cashflow statement, as well as a variety of other metrics and
ratios that are used by investors who are looking
to invest in companies which you're gonna
be learning all about throughout this course. So let's move on to the next
lecture in this module.
14. How to read an income statement: Hey there and welcome
to the ninth lecture of Module two Investing
Fundamentals. In this lecture, we're
actually going to get into the nitty-gritty
of how I go about analyzing a stalk from
a technical standpoint as starting with how to
properly read and interpret an income statement. An income statement is one of three main financial documents that publicly traded companies
are required to create and release out to the public on both a quarterly
and annual basis that investors can get
a behind the scenes look at how the company
is fairing from a financial standpoint
during that period of time and whether or not the
company is in a position of positive income or in
a position of loss. The income statement also allows investors to determine a variety of other metrics and ratios such as the gross profit margin, operating expenses,
earnings per share, and a variety of others that
we're gonna be looking at in this lecture as an investor
following this course, it's extremely
important that you understand how to
properly read and analyze a balance sheet
and then interpret what you're looking
at that you can get a really good picture of how the company is
fairing and doing. From a financial standpoint, we've personally
like investing in companies that are
financially healthy because this is going
to allow your portfolio to grow over time at a nice, steady pace and also receive some nice dividend
income while doing so, when I first become
interested in a potential stock that I
might want to invest in. The first thing I always look
at is the stock quote that we learned about
previously in this module. But then following
the stock quote, the first thing I
always look at is the income statement for
the most recent quarter, as well as the annual
income statements for the past five to even ten years to see how the company
is growing from a revenue and net
income standpoint and determine whether
or not this is accompany that I'm
personally interested in investing in relating to
my current portfolio. So in this lecture, we're
gonna be learning about all the different elements held within an income statement. And while we're doing this, we're gonna go through
the income statement of a real-life company called
Fordist incorporated so that you can get some
hands-on experience on how I go and read through an income statement and what my thought processes are
throughout this document. Now, just like with iStockphoto, different platforms are going to showcase the information, maybe in a different format
or a different structure. But 99% at a time, all the information held within an income statement
for a given company, regardless of the platform
you're consuming it on, is going to be the exact
same information because ultimately this
financial information is released by the
company in question. So I typically like to look at the income statement
on one of two sources. The first one being
Yahoo Finance, because it's really easy, simple to use and you can easily jump through
the income statement, balance sheet and cash flow statements for various
different periods of time. The second source of
information where I retrieve all these financial documents is actually from the
company itself. So we're gonna be looking
at how you can go about getting these
financial documents from the companies in
question that you're interested in it right on
their website they accompany, we're going to be
using for analysis throughout this
lecture as well as the balance sheet and cash flow statement lecture is
Fordist Incorporated, which is a defensive Canadian at utilities
company that is a great stock for both appreciation overtime,
and dividend income. Let's start off by first
looking at how you can get this financial information from any company you're interested
in on their website. And then following that,
we're gonna be doing the analysis on Yahoo Finance. Alright, so if you
want to access the income statement from basically any publicly traded
company, it's very simple. All you have to do is type in
the name of the company in Google and follow that
with investor relations. All public Israeli
companies have an Investor Relations
section to their website that contains relevant
information for investors, such as conference date and the earnings reports in regards
to Fordist incorporated, their Investor Relations
section is very nice. It has some preliminary
context about the financials of their company and their growth initiatives. But down here we have all of the financial
statements that you can access in PDF format. So let's look at four indices
at Q2 2020 earnings report, I typically dive into the extended earnings report
from the company itself after doing a quick overview of the financials
on Yahoo Finance, if I'm interested in wanting, gain additional details about what I'm looking
at with that said, any company that I do
currently hold and invest in, I take the time each
quarter to read through the earnings
document because it's here that you really learn
what the company has been up to and whether or
not I want to buy, hold, or sell shares. The main difference is
that on Yahoo Finance, you really just get
the raw data from an actual quantitative
standpoint versus in the extended earnings documented but released by the company. You typically get
added contexts by management for each
company here so that you can really understand the rationale and logic
of the company behind it. They're quantitative
and qualitative moves. Now that we understand how to retrieve this information
from the website, which is definitely the most thorough source of information. Let's move to Yahoo
Finance and go through the income statement for
Fordist incorporated, that last quarterly report, as well as a trailing
12 month annual View. Let's type in
Fordist Incorporated and then select EDI
Canadian option. When you click on the company, you are then brought to the
stock quote automatically. And then following that,
you're going to want to click on the financials tab
at which brings you directly to the
income statement on an annual View for
your information, all the numbers showcased in this income statement are actually in thousands
of dollars, meaning everything you see here, you're going to want to add on an extra three zeros for the true number generated
by the company. And this can differ based
on the company in question, depending on the
size of the company and their revenues by
companies do this in order to shave down the
numbers and make things just more condensed and easily
readable for viewers. Another thing to mention is
that as you can see here, the first column
is titled at TTM, which stands for
trailing 12 months. And in regards to
financial reporting, this figure represent
the total figures for the four last quarters. Instead of a full calendar year, this gives a more
accurate depiction of the company's financials
over the last four quarters. For example, I'm filming
this in August right now, and Fordist has released
their Q2 earnings for 2020. So the trailing 12
months would equal to the figures for Q3
and Q4 of 2019, as well as Q1 and Q2 of 2020. Basically, this is the
four last quarters as of the time that you're
looking at the information. I hope this makes sense to you. All right. So with that out of
the way, let's now dive into the income statement. So the first line is
called the total revenues, and this is the first
line that we're presented with that
investors will call the top line because they quite literally is the top line
of the income statement. This is money that
the company has generated from selling
goods and services before paying for any
expenses are taking into account the cost of
producing these revenues. In the case of Ford
is incorporated. The product that they're
selling and therefore generating revenue from
is their utilities. But for other companies, it could be software
selling tickets, flights, whatever the company is selling, this is the gross
amount of revenues. The next line below
being the cost of revenue is the total
cost associated with manufacturing the goods and services that were sold during the designated period
at which contributed to the total revenue figures
that we see above. This also takes into account transportation
and any other form of costs that are associated with creating and selling the
products of the company. It's important to realize
that all businesses will have completely different costs associated with
generating revenue. And some industries have a significantly higher or lower
relative costs to others. Generally speaking,
as revenues for accompany increase
the cost of revenues will also increase
because the company is scaling up the size
of their operation. Now the following line is
called the gross profit, which is quite simply
the cost of revenues being subtracted from the
total revenue figures. This figure is called gross
profit because it doesn't take into account other
expenses such as income taxes, rent, employee benefits,
and the list goes on it. So it's basically a bare-bones
profit figure of if the company is
strictly had cost of revenues as their
total expenses, the gross profit can also
be seen as a percentage called the gross profit margin that you've
most likely heard of, where the gross profit figure is divided by the total revenues. Overtime, It's nice to see the gross profit margin
of accompany increase because this means that
they are able to produce more revenue at a
lower relative cost. Sales are going up at a quicker pace than
the cost of the sales, meaning the company is becoming
increasingly profitable. In the case of Ford
is incorporated that we're looking at right now, we can calculate the
gross profit margin of the company over the trailing
12 months by taking 6.39 billion and dividing
that by 8.845 billion for a gross
profit margin of 72.3%, which is actually very nice. In contrast to this, let's calculate the gross
profit margin of the 2016 calendar year
where gross profit was 4.497 billion and revenues were 6.838 billion for a gross
profit margin of 65.7%. As we can now see, the
gross profit margin has increased over
this period of time, meaning they are streamlining
their business operations. Let's get back to the income statement with the next line, it being operating expenses. In the case of Fordist ink, the operating expenses are all grouped into one
single category, but depending on the
company in question, this is sometimes broken
down into subcategories, such as selling general and
administration expenses, as well as research and
development expenses, which all will roll up to the total operating
expenses though now operating expenses as a whole or all the other expenses
that accompany encouraged to run and
grow the business, but that aren't
directly related to the production of the
goods and services sold, which remember, are known
as the cost of revenues. For example, research and
development is very typical in pharmaceutical and tech
companies because they are constantly trying to innovate and create new product lines. In general, though
operating expenses will include things
such as marketing, advertising, branding, employee
salaries and benefits, rent payment and so forth. In the case of Fordist ink, their operating expenses in the trailing 12 months
totaled $3.859 billion. Again, if you want more
detailed information about the breakdown of each of the operating
expenses that accompany is spending
their money on. This will be held in
the company released earnings report found
on their website. But for a quick overview, Yahoo Finance does the
trick in my opinion, where they just add them altogether as one
operating expense. Moving on down the
income statement, the next figure is the
operating income or operating loss of the company
during the given period. If you haven't noticed
at this point, the income statement
is very much an accounting
document where values are added and subtracted
from each other. And for the operating
income or loss, this is derived from subtracting the total operating expenses
from the gross profit. In this case, when
subtracting 3.859 billion from 6.390 billion, we're left with an operating
income of $2.531 billion. This basically takes it one step further than he gross
profit because it now takes into account all
the other expenses associated with
operating the business. If, for example, the
operating expenses happen to be greater
than the gross profit, this would then be
an operating loss and there would be a negative
sign in front of it. Now finally, for the
operating income or loss rho, this figure is also what
investors use in order to determine the operating margin of the company in question, where the operating income divided by the total
amount of revenue. In the case of Ford is for the trailing 12
months, it is 28.6%. And this is another
margin that we want to see growing
each year because it's a sign of a
company that is able to become more and
more profitable. The operating income of 40 is incorporated in 2016 was 21.7%. So once again, we're
seeing accompany, that is showing it
growing margins when analyzing an income
statement for yourself, you should always be looking at the gross profit margin and
operating margin growth for the past five to ten years of the company to see what
type of trend it's in. Now keep in mind that just like with the gross profit margin, all industries have
average operating margins. But in general, an
operating margin that is considered to be healthy and average across
the board is around 15%. So anything higher than
that is very good, along with a nice trend in
growing operating expenses. The reason for this is because as an investor in a company, you want the company to be as profitable and
growingly profitable as possible as this
means the company is able to continue
growing and creating a nice return on
your investment if a company is expanding and growing the top and bottom line, this is generally accompanied
with growing share prices. To summarize, always
make sure to look at the growth of the
operating margin over time and try to invest in companies that have
growing operating margins. If you're analyzing a company
that's showing increasing net losses or net operating
losses at each calendar year. This is a red flag
showcasing that the company is
spending a lot more on their overall operating
expenses and their cost of goods than what they're able to generate in total revenues. Moving down the
income statement, the next line is the
interest expenses. And quite simply,
this is the amount of interests that the company has paid over the given period. This could be interest paid on short and long-term
loans and credit lines, the ventures or even mortgages. If the company invest
in real estate as such as with real estate
investment trusts. As a side note, it's
normal for a read to pay much higher interest
expenses because its main business is owning
and operating real estate, which by nature carries much higher levels
of mortgage debt. But let's get back
to the lesson. In the case of Fordist,
their interests paid in the trailing 12 months
was 1 to $2 billion, which in contrast to
their operating income, is actually relatively
quite high. This could be used though
for the financing of their equipment or
the construction of new infrastructure, all of which contribute
to total revenue growth. Again, if you want to get more
detailed information about these specific breakdown of
all the interest expenses. You can find this information in the earnings statement if
found on the company website. If I personally find that the interest expenses
are a bit too high, I'll dive into the earnings documented to get more context about the situation and see how the company
is justifying it. With that said, it's
quite normal to see companies pay interest
expenses because most companies take on
debt in order to finance projects and the growth of their operations by
leveraging their money. So don't inherently be wary of if you see a
company pay interests. Just make sure to
gain more context if you get the sense that
it's a bit too high. The next line in the
income statement is the total other income
slash expenses net, which in the case of Fordist
over the last 12 months is positive and $97 million
had this being an expense, this figure would
have shown it with a negative symbol
in front of it. What the total other
income and expenses represents is all
income or expenses that the company
has generated are lost from other
sources that are not directly related to
either operating expenses or cost of revenues. This could include things as the company's selling off some of their assets or some of
their marketable securities, or in the case of expenses, it could be incurring
fees of any sort. Following this row,
we're met with the income before taxes row, which is placed here in
the income statement because it following
this particular row, we have income tax expenses
and for corporations, they pay taxes on there
after expense dollars. Unlike individuals
such as you and I that pay taxes
on gross income, accompany will generate revenue, then pay for all
of their expenses and pay taxes on West leftover. So in this case, the
income before taxes is 1.408 billion for, for this, because we're subtracting
1 to 2 billion and adding 97 million from the operating
expenses of $2.531 billion, resulting in 1.6 to 2 billion
in income before taxes. Now if you're doing
the math at home, this doesn't 100% equate up. However, this is due
to the fact that in the truncated view
on Yahoo finance, there's a couple
of things that are left out and you'd be able to get all the detailed
information in the actual earnings
report provided by the company on their
website following this is when the company reports how much income tax it had
to pay over the period, which is completely different
from company to company, depending on the
country and province or state that it
operates in four days, Incorporated, paid
$214 million in taxes. And then what is
leftover from this is the income from
continuing operations. The difference between this
and the net income is that the income from continuing
operations only takes into account the
revenues generated from regular and ongoing
business activities while the net income includes income from continuing
operations as well as the unusual and irregular
income and that could also be derived from
discontinued operations. So the net income figure is typically what you
want to look at for the global view of
the bottom line of the company for
the given period. It's also from the
net income figure that we can calculate the net income margin
of the company by dividing the net income
by the total revenues. In the case of
Fordist, we'd divide a 1.276 billion by 8.84, or 5 billion for a net
profit margin of 14.5%, which is very nice
in contrast to their net income margin
of 9.6% in 2016. This is once again a green
flag for the company, demonstrating that
across the board they're growing and streamlining
their operations. And finally, the last
figures that you'll see on an income statement
are the EPS, meaning the earnings per share, which is a concept that we're actually going to be
unpacking and its very own stand-alone lecture
later on in this module. However, the earnings
per share is basically the net income divided by the amount of outstanding shares
of the company, which you can see below being the basic average
shares of the company. The basic average shares are
once again at the amount of outstanding shares that
are available from the company in the open markets, if you see the number of shares increasing each year
or each quarter, this means that the company
is issuing out more shares, thus raising more capital. And if you see this number decreasing each year or period, it means that the company
is buying back shares, thus reducing the overall
amount of shares that are available out in
the public market for investors to trade. Now that we've had the
chance to look over each element of the income
statement for Fordist, which applies to 99%
income statements for public companies. Let's now go back and
speak about some of the key elements and
growth trends to look for any healthy company that I would personally invest in from
a quantitative standpoint, the first thing that
I always look for is total revenue and
total operating income growing at a nice pace
because this means that as the company is
generating more income, their expenses are also
growing at a relative pace, meaning the company is
essentially making more money. What's even better is a
situation like with Ford is here when the operating margin
is increasingly growing, meaning the company is
generating revenue at a quicker pace and they need
growth of their expenses. The same thing applies
for the net income, which is the bottom
line of the company. For most healthy companies, investors want to
see it generating increasing net income
figures because this means the company is increasing
the money left over after paying
all the expenses. Keep in mind that for a larger
company that is stable, these are things that
you want to look for it, but you'll see very quickly
once you start taking this knowledge and analyzing
companies for yourself, that for smaller cap
growth companies, it's not uncommon to see
their stock prices soaring, even if they are unprofitable
companies year-over-year, if their revenues are
exploding and investors are very bullish on the
future of the company. A prime example of
this is with Shopify, where the stock has grown up by hundreds of percent
over the last year, but their net income and operating loss
figures are growing. This is simply because investors are bullish on the future of this company and the industry at operates in as a whole. We'll be speaking more
about this logic later on in the course
with all that said, if you're looking
to invest in solid, stable companies
that will provide consistent growth
and dividend income. It's critical that the company
is growing their revenue operating margin and net
income margin year-over-year. What I personally
like to do in order to see historical
performance and growth figures is to look at the five-years available
on Yahoo Finance first, because numbers only go back
to 2016 on this platform. But then it for
further research, I looked at the 10-year
historical information of the company that is
provided by Morningstar, available with all
clustered accounts. Quest rate is one
of the discount stock brokerages
that I recommend all Canadians use n will be
creating your own portfolio. Inquest, read it later
on in this course, you will have access to all of this detailed information for doing your very own
stock research.
15. How To Read A Balance Sheet: Welcome to the tenth lecture of Module two Investing
Fundamentals. In this lecture, we're
going to be learning about one of the most important
skills that you need to possess as an investor if you want to learn how
to properly analyze a stalk and assess the underlying
financial health of the company that you're
looking to invest in. I'm speaking about
how to properly read and interpret
a balance sheet, which once again is one of three main financial documents that publicly traded companies
are required to create and submit on both a quarterly
and annual basis so that investors can get a
behind the scenes look at what's going on from a
financial standpoint within the company for
this reason that as a potential investor
in any given stock, it is absolutely critical
that you properly understand how to
read through and interpret an income statement, a balance sheet, and a
cash flow statement. Because otherwise
you're basically just taking a shot in the
dark with this company, which is absolutely not what
we're about in this course. Let's first cover
what a balance sheet even is in the first place. A balance sheet is a
financial document that gives investors
information about the financial strength
and health of a company in relation
to their assets, liabilities, and the
shareholder equity. And it's very important
that all three of these elements held within the balance sheet
and balance out. Thus the reason that why it
is called a balance sheet, and this follows the equation of assets equals liabilities plus shareholder equity
assets or with a company uses in order
to operate its business, including cash, inventory, receivables, property,
equipment, etc. While liabilities are
financial obligations that the company owes, it's important to note
that when we go ahead and analyze a balance
sheet shortly, you're going to notice that
there are both short-term and long-term assets
and liabilities. The main difference here is
that short-term assets and liabilities also known
as current assets and current liabilities
have a lifespan of 12 months or less from
the point in time that the balance sheet in
question was issued versus long-term assets
and liabilities, also known as non-current
asset and liabilities, have a lifespan of more than 12 months from the point in time that
the balance sheet was issued or that cannot be easily liquidated
back into cash. As we spoke about in the
last lecture covering how to properly read and interpret
an income statement. Well, when I first
become interested in a potential stock after going over the stock quote and
the income statement, the next thing I
always look at is the balance sheet
of the company, because this is a
tell-tale sign of the financial
health and strength of the company that
I'm looking at. Numbers definitely don't lie. And in regards to
a balance sheet, you can clearly see whether
or not the company has significant assets or
liabilities on their books. And when you utilize
a balance sheet in compliments to the analysis
of an income statement, you can really see
whether or not a company is in trouble or not. So in this lecture, we're
going to be learning all about every single row, any balance sheets
so that you properly understand exactly what
you're looking at. And we're going to
be applying this to a real-life example of a
company so that you can really properly understand
what my thought processes are when reading a balance sheet and how I go through things. For this example, we're
going to be reading through and analyzing
the balance sheet, google because first of all, this is accompany that
everyone recognizes and they also happen to have a
fantastic balance sheet, just like with the
income statement. I personally like to look at the balance sheet from
two main sources. The first one being Yahoo
Finance, because it's simple, easy to use and you can
quickly jump in-between the income statement
and balance sheet and cash flow statement. The second and most
thorough source is once again at directly
from the company in their earnings statement
where there's going to be significant information
about each element, the balance sheet in question, so that you can get
some more detail about what you're looking at. And again, you can
find each one of these three main
financial document within the earnings
statement and that is released by all publicly
traded companies on a quarterly and
annual basis directly on their website in the
Investor Relations tab. All right, so let's
actually dive into the balance sheet of Google on Yahoo Finance to
first go through each element and learn what
we're looking at as we go. Just like with Fordist and their income statement that we looked at in the last lecture. All the numbers here
are in thousands and there is the TTM column, which stands for
trailing 12 months. You can also select
an annual and a quarterly view
where things are broken down even
further by quarter. But we'll start with
the annual review for our learning lesson. So let's start at the top, which is the assets section, and there's a
little arrow beside at the title so that
you can collapse everything and roll up all the sub-asset categories
into the total assets. But obviously we'll be digging into each element as
so we'll leave it expanded quickly to recap what assets are in case this
is a new concept to you. Assets are things that the
company owns, possesses, or has equity in that actually has market
value and that can be liquidated in order to fund
operations or pay creditors. For example, the
most common assets are cash buildings, machinery, marketable securities,
other investments, inventory, and receivables. In the case of Google, we can see that as of the
latest reported quarter, which is Q2 2020, at the time of
filming this lecture, their cash and cash
equivalent position is 17, is seven for $2 billion. Because remember that everything
here is in thousands. Now this goes
without saying that $17 billion in cash
is quite impressive. And I chose Google because their balance sheet
is top notch. Moving on, the
next row is called the other short-term
investments. And this group together
all marketable securities. That the company
could relatively easily liquidate and
turn back to cash. Examples of short-term
investment would be stocks, bonds, and treasury bills. In Google's case,
they currently have $103.338 billion in
short-term assets, which is absolutely
staggering and has increased since
their last quarter. The short-term assets and cash
and cash equivalents rows are always combined
together to give us the total cash row
right here that is at 121.080 billion for Google, this is a tremendous amount
of cash and explain to why Google is such a powerhouse
in the tech industry. If you haven't noticed
the cash position is held within the
current asset section, which can also be collapsed
for a rolled-up amount, in this case, 149.069 billion. But we'll get back to the
short-term assets after unpacking each
additional subcategory, the next element is
called net receivables. Net receivables are
money that is owed to the company in question from
other companies or entities. For example, if Google has
already performed a service in advance for another company
and has yet to be paid. This would count towards
the net receivables, just like everything else, Google has a lot of net
receivables at $21.201 billion. Just imagine being owed
that amount of money. It's quite crazy even for
a large public company. Moving on, we have
the inventory row, and this can differ quite a bit depending on the company
that you're looking at. But generally speaking,
this is product that the company owns
and has for sale, which can include raw materials, work-in-process goods, and completely finished
goods of a company. For example, a car
company that has, let's say 10 thousand cars
in their inventory ready for sale would all count towards
the inventory amount. In Google's case,
they currently have $815 million of
products in inventory. Finally, for the
current asset section, some companies will have a row titled other current assets, which is anything else
at the company owns. And that is a value
which doesn't fall into any of the previous
categories for current assets, and that can be
quickly turned into cash within one business cycle, this pretty much
means turned into cash over the next 12 months. And as we can see from
Google's balance sheet, they had $5.579 billion tied
up in other current assets. Now, the following row is a summary row titled
total current assets, which groups together
a cash receivables, inventory, and other
current assets. This is why the title is bolded. And if we sum up
all these values, we would see that Google had a $149.069 billion in
total current assets, which is a lot. Let's remember that
current assets are assets of the company owns
which are expected to be used or can be
used to convert into cash within a
short timeframe, typically within one year. And these are very important to maintain because they
can be used to fund day-to-day business
operations aimed to cover ongoing operating expenses
in the short-term, this covers the entire total current asset section
of the balance sheet. And while we're
going to continue on in the asset section, we're now venturing on into
the non-current assets, which are once again, assets the company owns or has equity in and used within
the next 12 months, such as, for example, property equity and
businesses and so forth. This is the reason why they are called non-current assets. And as you may have guessed, the current assets and
non-current assets are later combined together
to form the total assets. But we'll get back to
that shortly after covering each sub
non-current asset. The first row in this section
is the gross property, plant and equipment category, which is quite self-explanatory, but essentially combined
to the value of the company's owned property
and manufacturing facilities along with the value
of their equipment. Some companies, like say, a manufacturing company
might have significantly more in this asset category
than say a tech company. With that said at
Google has $125.859 billion in gross
property and equipment, which is once again
at quite a lot. The next row being
accumulated depreciation is also included in
this subsection because depreciation is subtracted from the total value of the
company's gross property value. If you aren't entirely
sure what depreciation is, let me explain when a property or piece
of equipment is used, the asset in question depreciates in value
due to the fact that there isn't a
value of the asset over time as a result of
just wear and tear. This is the exact same
thing as when you buy a brand new car over the
next couple of years, the value significantly
depreciates because it is being used. With that said, though companies can apply the same principle to their equipment
and property from an accounting standpoint
on their balance sheet. In Google's case, there were accumulated depreciation
being reported for the quarter is
30 F5.6, 1 billion. When we subtract this value
from the gross property, we're left with a net
property, plant and equipment. Of $90.315 billion
that Google owns. Let's now continue on
down the list where we have equity and
other investments. This row differs from
short-term investments that we looked at in the
current asset section in that equity and other
investments that are non-current or equity positions the company owns in private companies, infrastructure and other
types of investments that cannot be easily
liquidated on a public market, such as say with
stocks and bonds, as we learned earlier
on in the course, equity is a position in another company or asset
that has marketable value. So non-current equity is simply not convertible into
cash within a year. I hope this difference
makes sense to you. And if you want to get
more profound detail about the specifics of this for
each individual company, you can find this in their
official earnings statement. Google has at $12.961 billion in equity and
other investments. The next row that appears on this balance sheet is a
concept that many investors don't fully understand and comprehend what role it
plays on a balance sheet. And that is goodwill. So what exactly is this? Goodwill is what's known in
the investing community as an intangible asset
that accompany acquires when purchasing
another company. And it's an asset that
can't be liquidated into cash because it has no
real-world marketable value. Goodwill represents the access between the purchase price of the company and what it is
actually worth in the market. Meaning it's basically a
theoretical premium value above the fair value of
the company that is added to the balance sheet
for things such as say, brand name and loyalty, fantastic customer relations and other qualitative elements
that do have value, but that can't be
liquidated to cash. Let me give you an example
to make this very clear. If Google buys a company, which it does a lot of, and the company has an
actual market value of say, $1 billion, but they
are growing very fast and Google thinks that the acquisition would be
a solid win for them. Well, they may go ahead and pay, let's say $2 billion
for the company, which would then mean
that $1 billion would be added to the goodwill
section on their balance sheet. But the fact that this
goodwill figure is a premium paid by the company
to buy another company out and that it can't be
converted into cash is the reason why it's considered
to be an intangible asset. In Google's case, they have a
lot of goodwill at $20.8204 billion because they buy up a considerable amount of companies in order
to expand further. Now for Google, since this is a huge company and they have great income and
balance sheet figures, 20 billion in goodwill
isn't the end of the world. But when analyzing
other companies, The mindful of the fact that goodwill isn't really
an asset per se. So if a company
has a goodwill to total assets ratio of say, above 20%, meaning
goodwill represents more than 20% of the
company's actual assets. I would be skeptical of the
company's actual asset size and try to look further into the company's
justification for this. Otherwise, it just tells me that the company is recklessly spending and overpaying for other companies because
let's remember, goodwill is basically
useless and can't be used by the
company in any way. The next row is called
intangible assets, which we just touched upon when speaking about what goodwill is. The main difference here
is that even though goodwill is an intangible asset, It's divided up in the
balance sheet for more detail about the company's
total intangible assets. With that said,
intangible assets remain assets that
are not physical, property, stocks, etc, that can be converted into
cash in the market. These include things like brand recognition,
patents, trademarks, copyrights, trade names,
and the list goes on, but you can see
the pattern of y. These are not physical assets. Google, for example, has a tremendous amount of
trademarks, patents, and amazing brand recognition, including within all of its subsidiary companies
such as say YouTube. This brings their intangible
assets to $1.697 billion. And just like with goodwill, keep a close eye on intangible
assets because they are essentially not really worth anything in the real-world
if the company, let's say, went bankrupt and was liquidating all of their assets. Finally, for the
non-current asset section, before rolling them
up into total assets, we have the last row, which is other long-held
state short-term that hasn't already been accounted for
in any of the other rows. So with that said, all of these non-current assets get rolled up into this
row right here, for a total of
non-current assets of $129.423 billion in
Google's total assets, meaning a current and
non-current assets being added together are $278.492 billion. This is absolutely
staggering and honestly there aren't
many other companies that you'll ever
be analyzing that have this many assets
on their balance sheet. But I thought it would be
pertinent to use Google as the example here because their balance sheet
is very strong. All right, so we've now covered the entire assets section
on this balance sheet, and I hope that
you now understand each and every row
so that you can properly interpret
what you're looking at when analyzing
companies for yourself. With that said, what
would a balance sheet be without a liability section? Because remember, a
balance sheet gives us information about the assets
and debts of the company. And liabilities are
essentially Det, keep in mind that while
debt is typically seen as being bad for consumers, such as width consumer
credit card debt, like we spoke about
in module one. Well, in the case of
company's debt is used all the time in order to maintain rapid growth
and expansion. So it's completely normal for accompany to use
and carried debt. The difference here is that debt to help advance the growth of a businesses operation is
called productive debt. With that said, it's
still important that you monitor how
much debt a company is taking on and where
it's being used to see if the company remains it financially
responsible and sound. So let's now speak about
Google's liabilities as we're learning what
each row represents, just like with the
assets section, the liabilities section has both current and
non-current liabilities, which follows the
same reasoning of falling in the
current section if the financial obligations
are due within the next 12 months and following in the non-current section, if they are due in a longer
time-frame than the NextGen, it can be collapsed if you want to view the
balance sheet this way. But the first row is
called accounts payable. This is money that
the company you're analyzing owes to creditors, suppliers and other companies for goods or services
already received. For example, if a restaurant
already bought fish from a supplier and
still needs to pay the supplier within
the next six months, that amount owed would fall
into accounts payable. In Google's case,
they have 4 is 06, $4 billion in accounts
payable to their creditors, meaning they 0.0644 billion
within the next 12 months. Now, the next row being taxes payable is quite
straightforward. This is an amount
that the company is required to pay in taxes over the next 12 months that
haven't already been paid. Following this, we have accrued liabilities
and what this is is an expense at the business has incurred but hasn't
yet paid off, meaning it's being
carried over and the company will need to deal
with it within the year. This, for example, could include employee wages that
haven't been paid, interests that hasn't been paid, certain taxes or even fees. This is absolutely
considered another form of debt and therefore falls
in the liability section. Google has $18.505 billion
in accrued liabilities. Moving on, we're met
with deferred revenues. And interestingly,
deferred revenues aren't really a true liability
in my opinion, the reason for this is because deferred revenues are money the company has already received from customers before
the company has actually delivered on the
products and services. I say that this
isn't the same type of liability in my opinion, even though it is considered to be one on the balance sheet, because it's cash that the
company has received for their products just before
actually delivering on it. For example, let's
say Tesla Motors, they take on a lot of money from customers who have already
ordered their vehicles, months and months, even years
in advance before delivery. So all this cash being received that hasn't
been delivered on yet is considered to
be deferred revenues. The reason why this falls into the liabilities section
is because if issues were to arise and the company becomes unable to then deliver
on their promises, it must then repay
back this money collected to the
actual customers. This is what happened
to the cruise lines and airlines during the
coronavirus pandemic. In Google's case,
they only have a 2.061 billion in
deferred revenues, which is only a
very small amount of their current liabilities. That's something
that I like to see because they aren't that
liable to customers. And finally, the next section is other current liabilities which Yahoo Finance rolls
up into one category, grouping all liabilities
needing to be paid over the next 12 months that don't
fall into another section. If you really want
to see the details of what these other
liabilities are, you'll need to dig into the
company's earnings document, which will break
this down further. So Google has 9.8510 billion in other
current liabilities, making the total of 43.658 billion In total
current liabilities. Remember that these
are liabilities that need to be paid over
the next 12 months, just like the current assets
are assets that need to be converted to cash over
the next 12 months, we're going to be revisiting
the relationships between current assets and
current liabilities later on in this lecture. But for now, let's cover the next section which is
a non-current liabilities. These are liabilities that
the company has taken on for an extended
period of time that needs to be paid back over a longer time-frame
than only 12 months. For example, the first row
is called long-term debt, which can take on
different meanings depending on the
company in question. A real estate company
typically will have a significant long-term debt
in the form of mortgages. But any company can take on credit lines or
issue bonds to be paid back to bondholders at a later date than in
the coming 12 months. These would both fall into
the long-term debt category. And generally, longer-term
debt is used by companies to finance activities at a
relatively low interest rate. You can once again get
all the information about the interest rates in question for accompanies
specific long-term debt in their earnings report. Next up is deferred
taxes, liabilities, and essentially this
is when accompany owes taxes for the
current period, but decides to defer
the payment to the next calendar
year or a later date, which can be for a variety
of different reasons, but this is an amount that
the company owes in taxes. In this case, Google has 1.797
billion in deferred taxes. The following line being deferred revenues is
the exact same thing as deferred revenues in the
short-term liabilities that we spoke about earlier, except this is for products
that are to be delivered at a later date than in the
following 12 months. And finally, other
long-term liabilities are all other debts that company is carrying
that don't fall into any of the
previous categories. The reason why these four
rows do not add up to the total non-current
liabilities value of 27.512 billion during this period is
because Yahoo Finance is leaving out certain
information that you would need to capture from
the actual balance sheet that the company has released in their
earnings statement. In some, Google
currently carries 71.170 billion in liabilities, which might seem
high, but again, companies use debt to
leverage their capital and expand at a quicker
pace will also be revisiting these values at the end of the
lecture when speaking about things I look out for when analyzing a balance sheet. But first, let's speak about the final section that you
will find in a balance sheet, which is the stockholder
equity section. You might be wondering what
stockholder equity is if this is the first time that you're really digging into
a balance sheet. So let me explain. Stockholder equity is
the remaining amount of assets available to shareholders or
stockholders after all the company's liabilities
are accounted for. The reason for this is because if a company goes bankrupt, uh, stockholders are last to be paid after all creditors
and bondholders. The first line is common stock, which is the value in common
shares held by stockholders. And this value is 55.552
billion in Google's case, next up is retained earnings. And this is a value
that's related to the income statement
because retained earnings represents what is leftover from accompanies net earnings after paying out dividends
to shareholders. In Google's case,
it's pretty simple because they don't
pay out a dividend. So this is a value
that continued growing each quarter and as
of last quarter, their retained earnings
were a $151.8681 billion. And finally, the last row
of the balance sheet is called accumulated other
comprehensive income, which sounds quite complicated, but this is simply
the unrealized gains or losses that the company in question is reporting for the period that have
not yet been realized. For example, the fluctuations in market value of accompanies held bonds or other investments that have not yet been redeemed. That would therefore mean
that there have been unrealized gains or losses. Just like with the assets
and liabilities section, the stockholder equity
section also rolls up into an aggregate amount which is at 207.3 to 2 billion for Google. This value is
extremely important to a balance sheet
because it's what allows it to do its job, which is balancing the
assets to liabilities. In fact, the equation to
balance a balance sheet is assets minus liabilities
equals shareholder equity. Let's look at this
example with Google here, they have 278.2492
billion in assets, 71.170 billion in liabilities, and at 20.3 to 2 billion
in shareholder equity. If we subtract the
liabilities from the assets, we're left with the value represented besides
shareholder equity. This is essentially the
difference leftover between assets accompany owns
and their liabilities. Alright, so now that we've had a chance to go through each one of the elements held
within a balance sheet, you should now be
in a position to properly understand
what you're looking at as well as understand and
assess and whether or not a company is in a good
financial position, are not. Reading through
Google's balance sheet was absolutely critical in order for you to understand
what each row represented. However, it's now
going to be really important to speak about
specific elements and ratios that I personally look
for an imbalance sheet to tell me whether or
not the company is in a good financial strength. The first thing that I always
look at it when assessing a balance sheet is a ratio
called the current ratio. And this is essentially
a ratio that divides the current assets of a company by their
current liabilities. This ratio essentially tells us how much liquid cash the
company currently has, as well as will be receiving in the coming 12 months in relation to their liabilities
that will be owing during that
coming 12 month period. Let's go back into Google's
balance sheet to calculate their current ratio with a
total current assets at a 149.069 billion and total current liabilities
at 43.658 billion, there were total
current ratio is 3.4 x, meaning they have a 3-point four times more current assets then at current liabilities. And as you may have guessed, this is very positive
because it means the company has lots of free liquidity
in the coming 12 months. Now, for companies
across the board, a current ratio above one is typically always
recommended it to ensure that company will be able to attend to their
current liabilities without running into issues or having to sell other assets. But I typically look
for companies that have a current ratio above two
for an added safety net. What this means is that let's
say the company runs into significant revenue issues out of the blue in the short-term, such as when all
business thoughts for airlines and cruise lines in Q2, 2020 due to the
coronavirus pandemic. Having a current ratio
above two ensures that even with terrible
revenues and the short-term, the company would have
enough cash reserves to cover all the expenses twice. It's basically just a
safety measure that I like to see in
companies I invest in it because it also shows me that management is prudent
and forward-looking. In Google's case, a
current ratio of 3.4 is absolutely excellent and the higher the better
for this number. Another element that
I'd like to bring up regarding the
balance sheet that I should've brought
up when we're analyzing Google's
balance sheet, is that unlike an
income statement where every single quarter of the numbers are
essentially brand new. And what I mean by
this is, for example, the revenues of one-quarter. I'm not going to be tied to the revenues of a
previous quarter. However, with the balance sheet, all of these figures build off of each other each quarter and each year in terms of when the company is
buying more assets, are selling more assets, taking on more liability, etc, they build
off of each other. So let me explain
what I mean here. As you can see on
Google's balance sheet right now we're looking
at an annual view, meaning each one-year
period is reported here and the values are all
reflected for that one year. But notice how the total
current assets section is growing each quarter. This is because
Google is focusing on bolstering this section
of their balance sheet. What I like to see in a
financially stable company that will be growing and
remaining financially solid for years to come is the assets section and growing each year because this indicates that the company is acquiring more and more assets that have a marketable value
that can be used later on in order to
generate more revenue or be sold off if they need
to regain some liquidity. Now with that said, the
growth of assets typically comes with the growth of
liabilities, which is normal. But what I look for is companies that are
growing their assets at a favorable ratio to
their total liabilities, it's always great to
have growing assets, but if the liabilities are
growing at a quicker pace, this means the debt to
assets ratio is increasing. One way that you can
make sure the company is growing assets
at a quicker pace. And liabilities is by looking at the growth of the
stockholder equity. Remember that the equation for stockholder equity is assets minus liabilities equals
stockholder's equity. This by default means that if the stockholder
equity is growing, the company is growing their relative assets
to debt levels. Basically look for growth in both current and
non-current assets. And then in relation to this, be mindful of how quickly their liabilities are building up moving forward
as an investor, you're going to be
reading through dozens of income
statements, balance sheets, cashflow statements,
and analyzing a hundreds of companies before
taking positions in them. So it's going to be
really important that you started building up
your own judgment and interpreting for
yourself what seems reasonable for you as an
investor and as an investment. But as a rule of thumb here, if you're able to stick
with companies that have a total and current ratio of minimum one and
typically above two, you should be fine here. Now, this might sound
complicated and intimidating right now however, once you really started
reading through and analyzing the balance sheets
and financials of hundreds of companies, you're going to become
an expert in no time. In conclusion, the
overall information that you're trying to
get out of reading a balance sheet is
determining whether or not the company is risky
and over leveraged. It's also really important
that you always analyze a balance sheet
in compliments to the analysis of an
income statement, which is the main financial
statement of a company. Because let's say, for example, accompany is slowing down
the growth of their assets. And then you're also seeing on the income statement
that they're kind of stagnating and the growth of their revenues or revenues
or even going down. This could indicate
that the company in question is a less financially stable than
it was a year or two ago. With that said,
obviously there's an unlimited amount of
combinations that come into play for the analysis of
an income statement and a balance sheet because
every single company is going to be different. But I really hope
that this lecture on balance sheets allow you to properly understand
every single element held within a balance sheet. And what I personally look for when I'm reading through
one in the next lecture, we're going to be speaking
about the third and last of the main
financial document, which is the cashflow statement.
16. How To Read A Cash Flow Statement: Welcome to the 11th lecture of Module two Investing
Fundamentals. In this lecture, we're
going to be speaking about the third and last and
main financial document that publicly traded
companies are required to submit on a quarterly
and annual basis, which is the cashflow statement, just like with the two last financial documents
that we spoke about, which were the income statement
and the balance sheet. It is extremely important as an investor that you properly understand how to
read through and analyze a cashflow statement. Because this particular
document is going to give you some further
insight and do how a company is managing
their inflows and outflows of cash
within the company. The cashflow statement,
it gives investors some additional insight into how the company's
operations are running, where they're spending
their money and where they're generating
their money from. The main purpose of a cashflow
statement is to provide investors with additional
details about how a company is managing their
money in regards to funding their operating expenses and
the paying off their debts. Unlike with the income
statement where all the revenues for
accompany are lumped together into the top line
of the income statement being total revenues will
any cashflow statement, it is divided into three sub categories being the net cash flows from
operating activities, the cash flows from
financing activities, and the cash flows from investing activities will be further breaking down each one of these subcategories of cashflows throughout this
lecture so that you can understand how to
properly analyze the cash flow statement and compliment with the
income statement and at the balance
sheet so that you can have a well-rounded analysis of the financials of accompany
before we dive into the walk-through and analysis of
Google's cashflow statement. And let's first speak about
the three main subcategories of cashflows that we're going to encounter the first subsection. And now you'll see on a cash
flow statement is called the cashflows from
operating activities. This includes all the sources of cash that are derived from the ongoing business activities of the company in question, in which essentially means
it's the cash that's being derived from selling the
products and services. The second main
subcategory is called the cash flows from
investing activities. And this is all the cash
that is coming in or out of the company as a result of
their investing activities. The same thing would be true
if the company were to sell a portion of their
marketable securities on the open market at a profit, well, this incoming
cash would appear in the cash flows from
investing activities. And finally, the third
sub category is called the cash flows from
financing activities. This includes all cash
services that are derived from investors or banks, as well as all the
cash coming in and out of the company used for
repurchasing stock, paying out dividends
or buying back stock. So with that said it just
like with the last lecture, we're gonna be going through
every single element of the cashless statement and applying that to the
cashflow statement of Google. So just like in the
previous lecture, we are going to be analyzing
the cashflow statement of Google on Yahoo Finance because it's simple
and free to use. If you do want more detail about the elements held within
this cashflow statement, I'd suggest using
Morningstar's data that's available for free with
all quest trade accounts, which again will
be setting up for you later on in this course. Once you've entered the name of the company you're
looking for, in our case, Google for this example, you'll find the
cashflow statement is the third option under
the financials tab. And once again, you can see both an annual and
quarterly view of this document because
it public companies are required to submit these each quarter as
well as each year. All these numbers are also
once again in thousands. So for example, this
row is actually 31.5 billion and not 31.5 million. You'll also notice
right away that the rows are categorized into the three sub categories
that we spoke about earlier being the cash
from operating activities, the cash from
investing activities, and the cash from
financing activities. Now, there is also
another section at the bottom that I hadn't
previously mentioned, and that is the free
cashflow section that we'll be unpacking and defining once we get to this section in
our explanations, just like with the balance
sheet on Yahoo Finance, you can collapse each of these subcategories to make
things more concise and legible if you
aren't interested in the detailed breakdown each. Alright, so what
we're going through this cashflow
statement from top to bottom in order to have a clear understanding
of each element, starting with the cash flows
from operating activities. Keep in mind throughout this
cash flow statement and that positive numbers mean a positive cashflow
element for the company, meaning that money is coming
in while a negative number, it means that cash is
flowing out of the company. This is really important
to always remember as we go through each
one of these rows. So the first thing that
you're presented with when reading a cashflow
statement is actually a value that's derived from the income statement
being the net income. This is why we covered the
income statement first, and this also
further explains why these documents work in
parallel with one another. We've already learned
what net income is from the lecture on how to
read an income statement. But just to summarize
once again, this is the income that
accompany has left over after paying for
their cost of goods, operating expenses,
and tax liabilities. The next row that we're
presented with is called depreciation
and amortization, which we already
somewhat touched upon in the last lecture
on balance sheets. The reason why it
appears once again on the cashflow statement as a positive value
in this example is because depreciation
is not actually a true cash liability for the company that is coming
out of their pockets. Even though from an
accounting standpoint, it depreciation is subtracted from the value of their assets. That cash isn't physically
exiting the company. This is why companies
reapply the value of their depreciation to
their operating at cashflows on the
cashflow statement, I really hope this makes sense. In this case, Google reapplied
at 12.8 to 7 billion in depreciation back
into their cash flows over the trailing 12 months, which would be the same
value as what they depreciated on the balance
sheet over the same period. The same thing is true
with the next line, which is the deferred
income taxes. In this case, Google has a negative value for their
deferred income taxes, meaning that they actually
paid out $863 million of owed income taxes during the trailing 12 months if this value would
have been positive, however, it would've
been because of Google continued deferring
their income taxes, meaning that the amount did
not come out of their pockets yet and would therefore be added back to their
cash position. Next up in this
category is a role called a stock-based
compensation. And this happens to be
a very common way for companies to pay some of their
employees and executives, other than simply with cash. Stock-based compensation
is when a company will reward or pay their employees
with shares of the company, which can be very motivating
if you're working for a successful company that
you actually believe in. As a bonus, for example, the company might pay
an employee a couple of shares of their stock
as compensation. And all of this
combined rolls up into stock-based compensation
that we see right here. By the way, this dollar value is calculated by multiplying
the number of shares issued by the
current market price at the date of issuing
out those shares. In this particular case, we can see that Google
has paid out $11.842 billion out in
stock-based compensation over the past 12 months, which is definitely
a lot moving on. And we're met with
what's called a change in working capital. In Google's case, they
reported at negative $168 million in change
in working capital. First and foremost, working
capital is the difference between a current assets
and current liabilities. So change in working capital is going to represent the
fact that the company has either acquired
more assets or acquired more debts in order
to generate more money. We've already learned
in the last lecture on balance sheets
that companies take on debt and by assets in order to continue
generating more income. The next row is also familiar
being accounts receivable. And we already learned in the last lecture that
receivables represents money that the company is owed from other companies or debtors. In Google's case, they
posted accounts receivable of negative 1.844 billion. When you see a
negative value for accounts receivable on
the cashflow statement, this actually means
that the company is increasing the amount of
money that is owed to them, but that has not yet
being collected in cash. If you think of this, since the company is owed money, well, this money has not yet touched their bank accounts
in the form of cash. This is the reason
why an increase in accounts receivable
is reported on the cashflow statement as a decrease in cash flows,
which is negative. On the flip side, if you
see a positive value for the accounts receivable on accompanies cashflow statement, such as in Q1 2020 for Google. Well, this means that the
accounts receivable are actually being paid
off at a quicker pace, then they are growing. Always remember that on
a cashflow statement, a positive value
means cashflow to into the company's account
during that period. The next row being accounts
payable is money that the company owes to
suppliers and creditors. In this case, it's essentially the exact opposite of
accounts receivable. Let's now move on
to the next row, which is called the
other working capital. And Google reported at 31.157 billion in other working capital over the trailing 12 months. Working capital
is the difference between a company's
current assets such as cash marketable
securities and accounts receivable and then their
current liabilities. With this in mind, a positive working
capital means the company has increased their current assets to
current liabilities. And we saw from
Google's balance sheet in the last lecture that they have significantly
more current assets and current liabilities. I personally like to
see an increase in positive other working
capital because this means the company is
once again and growing the amount of current
capital to work with. If you want to gain
more information about the details
surrounding everything that falls into other for working capital and
non-cash items, I would recommend that you
consult the company released earnings statement that you
can find on their website. This happens to
be the exact same document that I've spoken about for the detailed balance
sheet and income statements. Finally, for this subcategory, all the above mentioned
rose roll up into this row right here called the net cash provided by operating
activities. By adding them altogether, Google has reported 55.337 billion in net cash provided
by operating activities. What this means is that Google's business operations
generated positive cashflow, which is always essential for a financially viable company. Because if the company isn't generating cash from
their operations, This would mean that
whatever they're selling isn't making
them positive income accompany can
generate cash from financing and
investing activities as we're about to see right now. But if they aren't
able to generate positive cash flows from their actual
business operations. Unfortunately, they won't be able to last all that long as accompany and won't be a good
investment for an investor, a negative value here would quite literally mean
that the company is losing money from the sale of their products and services. All right, so we've
made it through the first section of the
cash flow statement and let's now dive into the cash flows from
investing activities. We learned earlier on that
this section for teens to cashflows that the company is generating from their
various investments. The first row is called
investments in property, plant, and equipment, which
is pretty straightforward. This row is reserved
for cash that the company is
spending on buying new properties or equipment for themselves which appear
on the balance sheet. A negative value
means that they have indeed spend money
on these assets. So cashflow two out of the company's reserves
in order to buy them. Over the trailing 12 months
at Google has spent at $24.18 billion is buying a more
property, plants, and equipment. This also happens
to be visible on the balance sheet where 12
months ago they had roughly a $101.1 billion in property and now as of the latest
reported quarter, they have a 125.8
billion in property. This is where you can see
how the amount reported on the cashflow statement is
visible on the balance sheet. The next line is
called acquisitions, and this is also money that is flowing out of the
company's reserves. But in order to buy
up other companies, as you start reading through many cashflow statements of
various different companies, you'll quickly see that
most large tech firms do quite a bit of this. And in the case of Google, they have spent 2.6 to 3 billion on buying other businesses
over the past year. Generally speaking,
money spent on buying other businesses is seen as
a positive thing because it means that the
company is expanding and looking to further increase the revenue after analysis of the company that
they're buying out. With. That said, you'll
definitely want to keep an eye on the
amount of money that a company is spending on acquisitions in relation
to their own size. And all this info can be found
in the earnings document. Next up is a row called a
purchase of investments. And again, this is quite straightforward in that
it represents money flowing out of the company's cash reserves in order to buy investments such as stocks in the open market,
bonds, notes, etc. Keep in mind that a
public company is an entity that can buy property,
cars, and investments. And just like you and I am, IT companies invest in the
stock market and bond market themselves also in order
to create more income, just like we do
in Google's case, we can see that they
have purchased a $121.85 billion worth of investments
in the last 12 months, which is pretty insane. Keep in mind that most of
these investments over the past year were made during
the Corona virus crash, where the price of
stocks were down significantly and
Google purchased $121 billion worth at this
discounted price point, which is going to
be unbelievably rewarding for them
in the future. With that said, if a
company is spending significantly more money on purchasing other investments
rather than say, property or just re-investing back into the company itself. This can often raise a red flag for me because the
company is investing outside of their business more than on their
internal growth. Google though, has
a so much cash and assets are ready that
this doesn't worry me. But for say, a smaller
growth company, if they aren't
reinvesting most of their cash back
into the company, but rather into
other investments. This is something that
I don't really like to see because it means
the company is more bullish on essentially
other companies rather than themselves
on the next line, and we're faced with sales, maturities of
investments at which is the exact opposite
of the above line. This value is positive because
it's money that company generated from selling
their stocks, bonds, etc. Instead, I'm buying them. In this case, they
had a $123.679 billion coming in from the
sale of their investments. And finally, the last row is other investing activities
that groups together everything else that
doesn't fall into one of the other
categories of investing. I know I've mentioned
this many times already, but more information
relating to what these other investing activities are for each individual
company based on the current period you're
looking at can be found on the company's earnings
statement and that they're releasing every quarter
and every year. The above five rows
all roll up to the net cash used for
investing activities. In this case, negative at 23.943 billion for Google over
the trailing 12 months, It's completely normal for this value to be
negative because this means that the company
is indeed buying investments, acquiring other companies
and buying property. So don't necessarily be alarmed at that this
value is negative. If the cash used for
investing activities was either very small or
let's say just under 0. This would mean
that the company is not out buying investments or is actually cashing in a large chunk of
their investments. For the most part,
though a company that is growing and looking to invest in themselves will post a negative cash flows from
investing activities. With the 2 first category
is out of the way. We're now about to dive into the third category
of cash flows, which is the net cash provided
by financing activities. As we spoke about at the
beginning of this lecture, this category of cashflows
at groups together, inflows and outflows of
cash that the company is generating from financing
through either equity or debt. Companies will use
equity and debt in order to finance
their operations. The first line is called
a debt repayment, and this accounts for all the
money that the company has spent during the period
to repay their debts. This can be either short-term
debt or long-term debt, mortgage debt, and basically
any other type of debt. Obviously it is a negative value because cash is flowing
away from the company. In this case, Google
has spent at 2.174 billion over the past 12
months repaying their debts, which is completely
normal to see, especially for a
company of this size, the next row is
common stock issued, and this is the first row that accounts for money
the company would be generating through issuing out new shares of the company
to the open market. Remember in the first
lecture on stocks, we spoke about how companies
can choose to issue out additional shares
in order to raise more capital to fund
their activities? Well, this is exactly where
this would be accounted for, where companies can issue a
Chairs and raise capital. In Google's case, they
have not issued out any common stock to raise
capital in the last 12 months, but they have been
repurchasing common stock, which we can see on
the following row. Let's first just
remember that when a company issues out
additional stock, they're diluting shareholder
value because there are more stocks out in circulation,
meaning more supply. If you see a company that is constantly issuing out
shares to raise capital, just keep in mind that this
is not advantageous at all as a shareholder because
the relative value of your shares will decrease. With that said, you'll often see small cap companies
that are in need of lots of financing issue oh, chairs quite often
because this is an easy way for the company
to raise more capital. However, accompany
that constantly issues out significant
common stock to finance their operations is
what's called an OPM company, meaning other people's money. This is because they are not generating enough cash
flows to grow and sustain their business through the selling of their
products and services. So they are relying on
equity capital to survive. This ends up becoming a problem
long-term if they aren't able to generate more cashflows
from their operations, which is the most important form of cashflows for accompany to accomplish because it
means that they're successfully selling their
products and services. On the flip side, the
next row is the exact opposite being common
stock repurchased. This is when a company
buys back shares of their own company to lower the amount of shares that
are out in circulation. Companies will do
this all the time. But the only real benefit is to lower supply of shares
out in the market, and therefore the market
price typically goes up. This is really the
only benefit of buying back shares for
accompany because it has no real major impact on actually growing and
expanding the business. So here's the thing accompanies buy-back shares all the time to have an impact on the
market value of their shares. But it's important
that they only do this if they are
financially able to support it and
aren't being foolish with his spending on
buying back shares. Always remember that
buying back shares doesn't have any productive
use for the company. If a company is cashflow isn't able to support
this buying back of shares or if the company's
financial position is already somewhat rocky, but they're focused on
buying back shares. This is when it
becomes an issue. For example, during the
corona virus pandemic, there were huge
controversies around the federal government
bailing out airlines. And one of the main
reasons for this is because the airlines
were buying back of billions of dollars
worth of shares in the year preceding the
actual coronavirus crash. But they didn't even
have enough cash in reserves to maintain that
their operations for more than two quarters once the coronavirus hit and
their revenues were halted and they didn't have enough
cash in reserves in order to maintain their operations
for an extended period. And this is why
the general public was outraged under
the pretext that these companies were
mismanaging their money and shouldn't be able to be
bailed out by the government. Anyways, I've digressed a bit, but this row is where
the cash spent on buying back shares appears on
the cashflow statement. Google has spent at $27.142 billion in the last 12 months buying back shares
of the company. However, even though this
is a massive figure and the capital might've
been able to be used in a more constructive way. Google is a massive and well-established company
that already has a bulletproof balance
sheet and ample amounts of revenues and cash flow to
cover buying back the shares. Basically, what I'm saying
here is that you'll need to take a global view
and perspective of the company's entire
financials to determine for yourself if they're buying
back of shares is reasonable. In Google's case, I don't
have an issue here. Okay. So moving on at
typically right here, there would be a row
called at dividends paid. And this is a row that I look at all the time when
analyzing a stock because it shows us how
much the company is paying out in dividends
to shareholders. As a total amount, Google happens to not
pay out a dividend. So this is why the row is non-existent in this
cashflow statement. But for any company
that has a dividend, there would be an
extra row right here. The reason why I look
at this value of dividends paid out to
shareholders is because from this value we can calculate what's known as the
dividend payout ratio, which divides the
dividends paid over a calendar year by the net
income of the company. We're going to be
learning all about the dividend payout
ratio in module three, which is dedicated to dividends
and dividend investing. But for now, just remember
that for dividend stocks, there would be an
added row right here. Finally, for this section, we have the other
financing activities row, which accounts for
all of the other cash that the company has raised
through debt financing. In this case, Google
raised at $2.5 billion in other
financing sources. As with the other sections, these values roll
up to the net cash provided by financing activities
as subtotal right here. Over the trailing 12 months, Google span at 29.964 billion
in financing activities, most of which are being for
repurchasing common stock, the value is obviously
negative because once again, the cash flow is flowing out of the company to purchase
back these stocks. How did they not
repurchased any stalk and instead issued out
stock and debt. This value could have
been positive grades. So we've now made it through the three main sections of
the cash flow statement. And I really hope that you have a better understanding
of each one of these sections as well as what each element is n represents. If we now move on
to the next row, we have the net change in cash, which will represent the
value of additional or decreased cash
reserves the company experienced during the period. This value is a calculation of the three subcategories of cashflows that we just covered. In this case,
Google added $1.155 billion of cash to
their balance sheet, which remember, would fall under the current asset section. This is because at Google had a higher net cash from
operating activities, then they're investing
and financing activities, which is a good thing because considering that the
repurchase so much stalk, it would not have made
sense for them to spend more than what they're generating
from their operations. It's also good to see companies increasing their cash
position because cash is always good to have on hand if this value
happens to be negative, I always like to go and look at where the source is
and try to determine for myself if I'm comfortable with why the company
spent more cash, then it produced, for example, they may have made a significant
property acquisitions, reinvested cash back
into their growth, or bought out other
companies with the goal of a further expanding
and increasing revenues. However, if they are constantly losing cash in order
to buy back shares, this isn't something
that I like to see. The next two rows are
quite straightforward. The first one is cash at
beginning of period representing how much cash the company had at the start of the period
you're currently looking at. And then the second one
is the change in cash added to this row for the
cash at the end of period. Finally, we have made it to the last set of rows on
the cashflow statement, which is the free
cashflow section. This section starts off with the operating cash flow and
that we've defined above in the cashflow statement
at 55.3307 billion. And then the row below that
is the capital expenditure, also known as CapEx. The capital expenditures
of accompany are all the cash-flows used
to purchase property, plant, and equipment,
meaning it has already appeared on the cashflow
statement right here. In Google's case,
it is 24.18 billion used to buy capital expenditures over the trailing 12 months. This leaves us with the
free cashflow figure of 31.157 billion, which subtracts the CapEx
from the operating cashflows. What free cash flow is? Cash that the company
in question can use at their own discretion for
basically whatever they please. In this case, mostly
buying back stock, but they could have
decided to buy more investments or
purchased more companies. It's really up to
their own decision. Now, the free cashflow figure is important to consider
when looking at the cashflow statement of accompany because
it tells investors how much money the company is generating from
their operations. Specifically, after
spending money on property and equipment, which ultimately has the goal of increasing their revenue
long-term anyways. So with that in mind, free cashflow gives us a good picture of whether
or not the company has enough cash to fund what they have
decided to spend money on. For example, if Google had
a free cashflow of say, $15 billion, but they spend 27.142 billion
buying back stock. This would be a red flag for
me because the cash from their operations wouldn't be covering their stock buybacks. All right, so that covers
the last elements of a cash flow statement
and I know this was a lot of
information to take in. So make sure to
re-watch this lecture a couple of times so
that you properly understand everything
that we just covered before finishing
off the lecture though, let's quickly cover
a couple of things that I personally
look for when I'm reading through a
cashflow statement in order to tell me
whether or not this is accompany that I'm
comfortable investing in After quickly browsing through the entire cashflow statement, the first thing
that I look for is the net income value increasing
each and every year. Now? Yes. This is
something that can be determined from the
income statement also. But I like looking at this
on the cashflow statement because it's the top line
figure for the company's cash. Increasing that
income each year. It tells me that the company is focusing on their bottom line, which is beneficial for the
company and its investors. Because remember that the cash
flows from operations are the most important factor contributing to a
company's free cash flow. Basically, more net income means the company
is more profitable, which is always a good thing. As a side note, you may see tech companies or
smaller cap stocks with increasing net losses each year at the
beginning of their life. This is relatively
common as the company isn't looking to post
profits just yet. Rather they are in growth and expansion mode for
the time being. But when you see
accompany like this, it's critical that
you dig further into the company's earnings
statement to get a sense of their game plan and reason for such aggressive expansion
because at the end of the day, accompany that isn't
generating profits for years on end will need
financing from other sources, which can also be a red
flag for investors. The next thing that I
look for is similar to increasing net
income and that is increasing net cash from operating activities
year-over-year. The reason why this
is important is because the cash
from operations is the cash that the company
is generating from selling their goods
and services. Any long-term successful
company will be generating cash from
their operations rather than their investments
and financing activities because that's the whole goal of accompany in the first place. Essentially this means the
company is increasingly selling their products and
that's the best form of cash. If a company is
consistently posting negative cash flows
from operations, well, this means that they're surviving
from other sources such as issuing out more debt or
more shares of the company. This is what's called
an OPM company, which stands for other
people's money company because they aren't surviving off of their own operations. Rather they're simply
surviving off of cash from investors after continentally
issuing out more shares, you can determine
whether a company is an OPM company by looking at
the cashflow statement and determining whether or not
the common stock issued is much higher than their
actual operating income. The next thing I look for is the amount of common stock that the company is repurchasing in relation to their
free cashflow. Repurchasing stock doesn't
necessarily bother me if the company is
established and in a good financial
position to do so after cash is allocated to
irrelevant growth practices. Just remember that stock
buybacks don't really have any real productive value
for the company in question. Finally, the last thing
that I look for is how much debt the
company is taking on. Because remember
that even though companies leverage debt all the time to fund operations
and grow their top line, that is still debt that has interest and will
need to be paid back. So I just like to quickly
see if the debt that they're taking on
seems ordinarily high. And if it is, I dig into this deeper in their
earnings document. So this wraps up at
the main elements that I look for in a
cash flow statement. And remember that
as an investor, it is absolutely
critical that you properly understand how to read through and analyze
the income statement and balance sheet and cash flow statements and to utilize your analysis all in
one nice whole package. Because this is really
what's going to tell you whether
or not accompany, is it worth your investment? I know the information held in these last three
lectures was dry. However, investing
isn't always glamorous. It's really important that
you properly understand how to read through these
numbers and financials. Because ultimately
the success in investing long-term
is going to come from investing in companies
that are financially solid and that are growing it. Learning how to read all
these three documents is absolutely critical. In the next lectures
of module two, we are going to be covering
a couple of t ratio is that all investors absolutely need
to understand and master.
17. The Price to Earnings Ratio (PE Ratio): Welcome to the 12th lecture of Module two, Investing
Fundamentals. In this lecture, we're
going to be covering and learning about the price
to earnings ratio, commonly known as the PE ratio in the investing community. And this is one of the most commonly used
financial indicators are ratios, I should say, that is used by investors
in order to quickly assess the overall
value of a stock in the market in relation to other companies and stocks
that are trading in that same industry to see
whether or not this is a stock that is being overvalued
or undervalued. The topics we'll be covering in this lecture include,
first of all, what is the price to earnings
ratio followed by the price to earnings ratio formula
and the calculation. Then we'll be speaking about both the forward and a
trailing price to earnings. And finally, we'll be ending
this lecture in speaking about why the price
to earnings ratio is important and what it tells us as investors before we actually jump into some calculations of the price to earnings ratio
for some real-world stocks. Let's first speak about
what the PE even is in the first place
before we go about calculating anything,
simply put, the price to earnings ratio is a current relative value between the market price that
a stock is trading for and its underlying
earnings per share. So essentially what this
financial ratio is telling us as investors is how expensive is this stalking question
that trading at in the open market in relation to the actual earnings
that this company is generating a for each outstanding
share of the company. Let's actually take
a step back here and a first define
what the earnings per share or EPS even is because this is going
to allow us to better understand and what the
price to earnings ratio is and how it's calculated. The EPS, which is an acronym
for earnings per share, is once again a financial
metric used for a company where the actual net earnings
or profit of the company, which we learned all
about in the lecture on reading an income
statement or a divided by the current
outstanding number of shares of that company. Now remember in the
lecture on stocks, we learned that public
companies can issue shares to the market in order to raise more capital to fund
their operations. And they can also
buy back shares. So every time they either
issued shares or buy them back, this actually has an
impact on the amount of common shares that is
circulating out in public. And for this reason, and this
will also have an impact on the earnings per
share because at the amount of shares
is fluctuating, this gives investors
a nice indication of how valuable each share of the company is with a higher earnings per share
of being more desirable. Because at this means that
the company is generating more money for each outstanding
share of the company. For example, if you were
wanting to purchase, let's say 25% of a restaurant. And let's say for the
sake of this example, this company or
restaurant, I should say, had it for outstanding shares
and you were going to buy one share for a total of
25% of this restaurant. Now in this example, let's
say the first restaurant was earning a $200 thousand in net earnings per year and
the other was earning a $400 thousand in net
earnings per year. While a generally speaking, the second restaurant would
be much more desirable. And for this reason that twenty-five
percent stake would probably cost quite a bit more. So bottom line here, a higher earnings per share indicates to investors
that each one of the outstanding shares
of a given company is more valuable in
the open market, bringing this now
back to the PE ratio, while the earnings per share is extremely important
because it happens to be the denominator in the equation for calculating the PE ratio. The equation for
calculating the price to earnings ratio
is very simple. So you're going to be dividing the market value per
share of the company, which you can find on
their stock quote by the earnings per share of that
company, which once again, you can also find on the
stock quote, if we divide it, the current market
price of a stock by the underlying earnings of each one of the outstanding
shares of that company were essentially calculating
a ratio that's going to tell us how
relatively expensive or cheap the market is pricing a given stock in relation to the underlying
earnings of the company, which essentially is
its profitability. For this reason, a higher
price to earnings ratio indicates to investors that the market
is willing to pay a premium for each underlying, earn a dollar that this
company is generating. Example, let's say
we compare to, to technology
companies that each had the exact same
earnings per share, but one of them had a PE ratio that was
doubled the other, well, this would mean that in
the case of the company that has doubled the
price to earnings ratio, investors are willing
to pay double for each dollar earned
by the company. This can be as a result of a variety of different factors, both internal and external
related to the company. For example, excitement and anticipation of earnings
growth, or for example, a leadership and the
actual industry that the company operates
in, among other things, with that said, at
the price to earnings ratio can be used
by investors to quickly determine whether or not a given stock is trading
at a premium or at a discount relative to other companies that operate
in that same industry. Comparing the price
to earnings ratios of companies that operate
in different industries. It really isn't all
that relevant to an investor because
each industry is going to have its own set of acceptable expenses
and other metrics. What you'd essentially
be comparing apples to oranges, for example, it's absolutely
normal and common to see a company that
operates in, say, the text-based to
have a price to earnings ratio
that is very high, even reaching 30 or
40 times earnings, in contrast, is a accompany that operates in the utilities. Or energy sector that will have a much lower price to earnings
ratio because these are industries that are
established with steady and recurring
revenues versus the text-based
investors are often a very bullish on a future growth of the earnings
and then revenues. Another important
element to mention here is that you might notice
that for some stocks, especially technology
and a growth stocks, there might not be any PII or
earnings per share at all. This simply means that
the company hasn't actually posted
any net earnings. So you wouldn't be
able to calculate the price earnings ratio
because remember that the equation for
price to earnings is dividing the market price
by the earnings per share. If there is no earnings at all, you wouldn't be able to
divide something by 0. Now that we understand what the price to earnings ratio
is and what it's used for. Let's speak about the
two different forms of price to earnings
ratios that you will encounter as
an investor when assessing and analyzing stocks. The first and most commonly
seen form of price to earnings ratio is called the trailing 12 months
price to earnings, also known as the TTM,
price to earnings. And this is essentially
calculating the price of the human stalk in relation to the earnings over the trailing 12 months of
that company's operations, meaning the last four quarters. Now the trailing 12 months
for us to earnings ratio is an indicator of the company's
most recent performance regarding earnings relating to the current market price is the most commonly used
PE ratio for assessing a company because it is rooted
in actual concrete data, unlike the forward price to earnings and that will be
speaking about shortly. Keep in mind that
since the market price of stocks is fluctuating every single second and
while the markets are open and traders are buying and selling shares of
these companies. Well, this will have an impact on the earnings per share of the company because while the market price is fluctuating
every single second, the denominator being the
earnings of the company, the net earnings is going
to remain the same. And due to the fact that it's
based on a concrete data, it is reported for
the last 12 months. In the case of the
trailing 12 months price to earnings ratio, this is the reason why
every time you go back to a stock quote for the same
company during a training day, the price to earnings
ratio will be different. If you're wondering
what a typical and healthy trailing 12 months
price to earnings ratio is for a company. Well, this is going
to vary greatly depending on the industry
that you're looking at. As mentioned earlier,
companies that operate in the text-based
tend to have price to earnings ratios that are
significantly higher than companies that operate
in say the industrials, energy or utility spaces. It simply based on the nature of the products that these
companies offer and how bullish investors are on
future earnings potential. However, historically the
price to earnings ratio of the S&P 500 has been
right around 15 x, which means that historically, stocks that have been in
the S&P 500 will trade at evaluation of 12
times their earnings. The second form of price
earnings ratio is what's known as the forward
looking price to earnings. And this differs from the last one in that
instead of using the past 12 months
of earnings to calculate the PE, in this case, we're going to be using the forward-looking
estimates of earnings, which is known as the
future earnings guidance of the company for the
upcoming 12 months. The forward-looking price to
earnings ratio can be used in parallel to the trailing
12 months price to earnings ratio in order
to give us investors some additional insight
into how the market is evaluating the company based on the last 12
months of earnings and based on what the
earnings are going to be in the coming 12 months. For example, if the
forward-looking price to earnings ratio is higher than the trailing
12 months price to earnings. Well, this means that based on the current earnings estimates
in the coming 12 months, the price point over
the coming 12 months will be relatively higher than the price point
right now based on the earnings of the
previous 12 months. Now, both forms of price to earnings ratios are
extremely useful in order to quickly assess the overall relative
value of a stock. But I typically tend to use the trailing 12 months
price to earnings ratio first because this
is based off of concrete real data that
the company has posted. Then to bolster my research, I'll look at the forward-looking
price to earnings ratio. So in conclusion,
in both price to earnings ratios are extremely
useful to investors in order to indicate whether
or not a given stock or company is overvalued or undervalued in relation to other companies that operate
in that same industry. In addition to this, I think is the price to earnings ratio as an earnings multiple of what an investor is willing
to buy a share at. Always remember that when
you're buying stock, you're essentially
buying shares of that company and
you're entitled as an investor to your portion
of that company's earnings. From a theoretical standpoint, if you buy a company that has a price to earnings
ratio of 20 x, you're essentially
willing to pay $20 to receive a $1 back in
that company's earnings. It's not that simple, but
that's basically what it means. Always remember that in general, a higher price to
earnings ratio for a stock means that
investors are expecting a higher earnings growth for
that company in relation to a company that has a lower
price to earnings ratio. On the flip side,
a company that has a low price to earnings
ratio could indicate that the stock is undervalued
or the h doing it very well in contrast
to its past trends. In conclusion, a price
earnings ratios can be very useful tools in
order to quickly assess the overall value of a stock in relation to other companies that operate in that industry. However, just like everything else that we're learning here, it's important that you properly
understand what this is, is that you can apply
this knowledge to your own stock analysis
and determine for yourself whether or not you're
comfortable paying for a stock at a given price
to earnings ratio. In the next lecture, we're
going to be learning about another financial metric at that appears on the stock quote, which is the price
to book ratio, also known as the PB ratio.
18. The Price to Book Ratio (PB Ratio): Welcome to the 14th lecture of Module two Investing
Fundamentals. In this lecture,
we're going to be learning about the
price to book ratio, also known as the PB ratio. And this is one of the most commonly
used financial ratios you used by value investors in order to quickly
assess how expensive accompany is in relation
to its book value. The PB ratio also happens
to be one of the most commonly found at ratios
on a stock quote, this is why we're dedicating
an entire lecture to it. Generally speaking, a value investors will tend to lean
towards dogs that have a price to book
ratio anywhere from in-between one up
to around three. With price-to-book
ratio is below one being most favorable
because at this indicates that this
dog is currently undervalued in relation to the company's
underlying book value. With that said,
it just like with the price to earnings ratio, it's quite difficult
to pinpoint what a good price to book
ratio is because this can vary greatly depending on the actual company
in question and the industry that operates in, and a variety of other factors. So it would just like with
the price to earnings ratio using the PB ratio should be one element in a global overall
assessment of a stock. The topics we'll be
covering in this lecture include what is the
price to book ratio in the first place followed by the PB ratio formula
and calculation. And then finally, we'll
be ending with why the price-to-book
ratio is important and what it tells
us as investors, let's first speak about what
the price to book ratio even is in the first place, followed by how it's calculated. Simply put the
price to book ratio takes the market
capitalization of a company, which we learned all about
in a previous lecture. So you should know what a
market capitalisation is, but we take the market cap of accompany and divide
it by its book value. The book value, however, is calculated by taking the
company's assets and then subtracting from them
the intangible assets as well as the liabilities, and we're left with
the book value. All of these figures
can be found in the balance sheet as we spoke about in the previous lecture. It, so we now know what the price to book ratio even is and how it's calculated. But what does this ratio really
telling us as investors? Because it's great to
understand that the PB of a certain company
is either high or low. But in practice, what
is this telling us as investors and how
should we interpret this? First off, the book value
which we just learned takes the assets of accompany
and subtracts from that. The liabilities as well
as the intangible assets, essentially gives us a value representing what the
company would have leftover if it were to liquidate all of its assets and
pay off its debts. So in a way, the price-to-book
ratio is telling us as investors whether
or not we're overpaying, underpaying for what
the company would have leftover in terms of assets
if it were to go bankrupt, liquidate everything,
pay off their debts. This is the value that
we would have leftover. For example, let's
say a company that had a price to book ratio of 30. This basically means that
you'd be willing to pay 30 times the actual value of the company's
underlying net assets, which is the book value. For this reason though,
the price to book ratio is a very useful tool for an
investor to quickly assess how expensive a company
is trading at in relation to its
underlying net assets. Keep in mind that
generally speaking, a financially healthy company is looking to increase
the amount of assets year-over-year that they have on their balance sheet. And in contrast to this, are looking to either
limit or even decrease the amount of liabilities that they have on
their balance sheet. For this reason, a
financially healthy company would have a price to book ratio that is either staying stagnant or even
decreasing over time. As mentioned
previously, it's very difficult to provide a
specific price to book ratio that is favorable
for all companies because an overvalued or
undervalued price to book ratio can vary by industry
and specific company, just like with the price
to earnings ratio. For this reason, what
I like to do is set a specific price to book
ratio range that I personally feel comfortable with in
making an entry point for a specific company
or a given industry, depending on the
company in question and the industry
that it operates in, I typically try to invest
in companies that will have a price-to-book ratio below three and even more
favorably below to, especially for more
traditional companies like banking and hydro,
utilities, industrials, etc. Indicating that it has
a healthy price to book ratio for a stock that has a price to book ratio below one. This indicates that this
dog is actually trading at an undervalued level in relation to the company's
actual net assets. With that said, it's important
to keep in mind that for specific companies
and industries, for example, the tech industry, it's not uncommon to see price-to-book ratios that
are significantly higher, going from five-sixths,
ten even up to 15 or more. And personally, I
might even invest in a company that has a
relatively high price to book ratio if after my
full assessment of the income statement
balance sheet as well as cashflow statement and
other qualitative factors. I believe that there's
significant growth ahead for the company wouldn't
really bother me as much. However, for more
traditional companies, I really like to see price-to-book ratios that are below three and under this can actually also even
be a quick way to assess accompany that
doesn't have earnings yet. And for this reason it
wouldn't have a price to earnings ratio in some of
the price-to-book ratio is a very commonly used tool by value investors in order to quickly assess whether
or not they are under. I'm overpaying for a
company's assets in relation to the current market
price of that security, I pretty much always look at the trailing 12 months price-to-book ratio
of a company and then compare it to its
historical price to book ratio in
order to see how the market is currently
evaluating it in relation to its
underlying assets. However, this really is just one single data point
that'll take in an overall global assessment
of a stock after looking through all of the
financial documents and statements also, if you really want to become a well-versed on how
to properly analyze the financial health
and worthiness of a company that I
highly recommend. And you re-watch the lectures speaking about the stock quote, that price to earnings ratio and this one being the
price to book ratio, as well as the three main
financial documents, which are the income
statement, balance sheet and cash flow statement. All of those lectures combined if you're able to re-watch them and really master all of the information
held within them. You'll be able to properly
analyze a company for what it is at a
financial fundamental level, and this is really the basis
of successful investing. In the next lecture, we're
going to be covering the topic of compound
interests and seeing how this ties into your investment horizon
as an investor.
19. Compound Interest & Investment Horizons: Welcome to the 14th lecture of Module two Investing
Fundamentals. In this lecture,
we're going to be learning about
compound interests, what it is, how it works, and why it's one of the
most important tools in building your wealth that
through the stock market, you may already be familiar
with compound interests, but this lecture is going
to refresh your mind on its power and why
it's so important. The topics we'll be covering in this lecture include what is compound interest followed by how is compound
interests calculated? And then following this,
we'll be looking at the frequency of compounding the time value of money and why starting to invest
young is so important. And then finally,
we'll be ending this lecture with speaking about where compound
interest works best. If you're even the slightest
bit interested in investing, then chances are you've heard of the term at compound
interests before, which is arguably the
most powerful concept that an investor can utilize in order to grow the value of their
portfolio over time. It consistently contributing to your stock market portfolio
and staying invested during your investment horizon in case you may have forgotten exactly what compound
interest is and how it works. And let's quickly
do a refresher on it at its most basic definition, compound interest is
essentially interests that you're incurring on top of your initial principal
invested it combined with interests that you've already incurred in a previous periods. You can think of it as interests gained on top of interest. And the reason why
compound interest is such a powerful tool in order to grow the value
of your portfolio over time is because compound interests grows the
value of your investment at an exponential rate instead
of at a linear rate is such as if you were just contributing consistently into
a savings account. Now things do get a little
bit more complicated when calculating compound interests
as we're about to see. But let's quickly look at
an example in order to showcase how compound interest works at a fundamental level. For example, if you started with an investment of $1000 and this investment generated you a 10% annual interest
rate in your first year. Well, at the end of the year, you would have a $1100. Now say this same capital, which is now $1100, made you another 10% interests in the second calendar year. You would then have $1210
at the end of the year. So the 10% you made
it this year was more than the 10% that
you made last year, since the 10% from year one, which was $100, was added to
your $1000 initial capital. This is the basic concept of compound interest
and when combined with continuous contributions on your part to the
investment account. And this has a
tremendous effect on the speed of growth
of your investments. Now that we have a
better understanding of what compound
interests even is, Let's take a look
at an example of an investment
portfolio growing over time with recurring
contributions to it, taking advantage of
compound interests. So for this quick example, we're going to be using a free online compound
interest calculator. You can find one very
easy on Google just by typing at compound
interest calculator. All right, so let's say
you're starting off with $10 thousand in initial capital and this investment
is growing at a 7% annual interest rate. And for the sake
of this example, we're going to put a ten
year compounding period. The reason we chose annually is because it
generally speaking, in the stock market, you can expect to see an
average annual return of anywhere from four to
around 15% on the high-end, depending on these thoughts and funds that you're invested in, this particular calculation
would result in a $9,671.51 in a
compounded interest over that 10-year period without any additional
contributions, that interest would
then be added back to the initial principle of $10 thousand for a
total end value of $19,671 without even adding
any additional funds to the portfolio over a
long enough period of reinvestment contributions
and compounding. This results in an
exponential growth pattern as such as what we're seeing
right here on this graph. If you notice from
this example of compound interests also
takes into account the number of
compounding periods during the period of time
that you're invested. This can actually have
a significant impact on the end balance of your investments with
more compounding periods, this actually has the
impact of growing your investments
at a quicker pace, even though in the stock market, interest is typically spoken about on an annual
basis, such as, for example, a 7% annual
interest rate in the S&P 500. Well, let's actually
look at an example of more frequent compounding
periods to see how this impacts the growth of
your investment portfolio, just so that you're
aware of this reality. If we take the exact
same previous example but only changed the amount of
compounding periods from annually to say monthly. This would represent
120 compounding periods instead of only ten
compounding periods. If we only compounded on
an annual basis during that ten-year period when calculating this example
of compound interests, we're left with $10,096 in compound interest
over that same period, which is roughly $450 more than compounded
on a yearly basis. Now, obviously, this is
not that significant with a relatively small amount like only $10 thousand
to start out with. And this is also
without actually continuously contributing
to the account, but I wanted to provide you with as much information as possible. Unrelated to compound interests and what factors come into play that will have an impact on the compounding of
your portfolio. With that said, with
your own portfolio and during your
investment horizon, you're typically only
going to take into account the annual
compound interests. However, I really
just wanted to speak about the different
possibilities that are out there for
compound interest and what factors come into play. All right, so at this
point we understand why compound interest is how it works for the
overall growth of your portfolio and why the number of
compounding periods will have a positive long-term impact on the growth of
your investments. However, from that, we can therefore understand
that that's starting to invest the younger is more beneficial
because you can take advantage of more
compounding periods during your investment horizon. Let's actually take a
look at two examples of one portfolio where
the individual started to invest at a younger age compared to the exact
same portfolio and contributions where
the individuals started to invest
at a later age. However, I do want you
to keep in mind that even if you are a
little bit older, say in your 30s, 40s, or 50s. Well, at least
you're starting to invest right now where
you'll be able to take advantage of
compound interest at for the rest of your
investment horizon. So it's definitely better
to start now than ever. In the first scenario, the individual will start
investing at 20 years old. And in the second scenario, the individual will
start investing at 30 years old and both will be investing up to the age of 65 when they're
looking to retire. In both cases, each
we'll start with an initial investment of $10 thousand annual,
contribute one hundred, ten hundred dollars to
their investment account on a monthly basis at an annual interest rate of 7% over the course of
their investment period, the individual having started
to invest at 20 years old, will have grown their
investment portfolio to roughly $3,197,658 by the time they
retire at 65 years old, if the market's yielded an
average 7% return each year. On the flip side, at
the individual who started to invest at
the age of 30 with the exact same
parameters would have grown to their portfolio to only $1,388,179 by the
time they were 65. This is a difference of
roughly $1.8 million, even though the years
of compounding we're only diminished by ten years. The reason for
this is because by the nature of compound interests being on an exponential growth
curve as years progress, the chunks of compound
interest earned become larger and larger
each and every year. This becomes very clear
when we take a look at the table version of the compounded growth of
our previous scenario. One example, as we can see, the interests gained from
year ten to 11 was $13,730. However, the interest
gained from year 40 to 41 was 183,870. This is why you
may have heard of the concept known as the
time value of money, which is going to be very
important when you assess your own investor profile later on in this course in Module six, the goal of this lecture
was really just to quickly recap of what
compound interest is and how it's going to
positively impact the overall long-term growth of the value investments held
within your portfolio. Now, as we just learned
at compound interest is the most powerful
when you can stay invested for a long
period of time and take advantage of that annual
compounded interest rate, anywhere from five to around 15% annually depending on the investment
that you select, that based on your
investor profile. With that said, it consistently achieving a certain baseline of annual interest
in your portfolio for an extended period of time. It can prove to be quite
difficult if you're looking to actively manage
in your portfolio. And what I mean by this
is picking and choosing your own stocks and trying
to beat the market. What I recommend most
retail investors do, including myself, is to construct the
portfolio that is called a hybrid at core satellite
portfolio where essentially you're going to have a passively managed exchange traded funds acting as a
baseline for your portfolio. And then from there you
can reserve a portion of your portfolio to actively
pick into stocks. The reason why I recommend
this strategy is because ETFs that track is solid
abroad market indexes such as, for example, the S&P 500 and
the nasdaq 100, the TSX 60, are going to have the
highest chances of producing a consistent annualized
returns that you can count on more than picking and choosing individual stocks, which inherently comes with quite a bit more
volatility and risk associated with trying to
actively beat the market. It's for this reason
that I typically consider ETFs to be more advantageous for
taking advantage of consistent
compound interests. However, obviously I love to pick and choose
my own stalks. And obviously you want to
learn how to do this as well since you're taking
this course with that said, a hybrid course
Adelaide portfolio is perfect for the
best of both worlds. And we're gonna be
learning about this later on in module six.
20. Understanding Diversification: Welcome to the 15th lecture of Module two Investing
Fundamentals. In this lecture, we're
going to be learning all about
diversification and why diversifying your holdings
held within your portfolio is critical for maximum
long-term success. This lecture is going to focus more on the actual
theoretical is behind efforts of
vacation so that you can understand the
ins and outs of it. And then later on in the course, we're going to be
applying what we're about to learn in this lecture to actually constructing
your very own portfolio based on your own
investor profile and a diversification mix. The topic we'll be covering in this lecture is very
straightforward, which is, what is diversification
and why is it important in a stock
market portfolio, starting with what
diversification even is, it's actually a relatively simple concept to understand it. So diversification is a strategy where you're going
to be spreading out your investments across
multiple different assets and asset classes in order to minimize your risk by
limiting your exposure to one single asset
or asset costs. There are multiple
different reasons as to why an investor would
look to diversify their holdings with
the most common reason being that by limiting
your exposure to one or just a handful of individual positions
over the long term. And on average, you're
able to produce consistently higher returns
and limit your risk. We spoke about this briefly when covering ETFs and by nature, one of the attractive
elements of exchange traded funds
is that they hold a variety of
different investments all within one single holding. And therefore,
this automatically diversifies your
portfolio through that one single holding. In a nutshell, that's what diversification is and it can be accomplished a variety of different ways by
buying multiple stocks, ETFs, bonds, real estate,
and the list goes on. It's really just the idea of spreading out your investments into multiple
different investments and investment categories. This creates the effect
of smoothing out portfolio returns
where negative results for one position will be counterbalanced by
positive results another. And the overall goal
here is to achieve a higher upside
over the long-term. Now what diversification is
a bit more complex though, than just buying a variety of stocks and calling it a day, because there are other
elements that you're going to want to keep in the
overall equation here. One of the main
point being that for proper diversification and you want to pick a
variety of stocks, ETFs, or other
financial securities that are uncorrelated. What I mean by this is selecting stocks that aren't
all in, for example, the same industry or that have the same market calves because
it typically speaking, similar stocks will
be influenced by the same micro and
macro economic events. For example, if all
the stocks held within your portfolio or let's
say utility stocks. And for some reason
the utility sector took a turn for the worse, while your portfolio
would be highly exposed to that one,
a single industry. And for this reason that your portfolio would be
negatively impacted. On the other hand, if your
portfolio is constructed of stocks in various industries
such as utilities, energy, consumer staples, and let's say the tech industry. And that not all your eggs
are in one single basket. Well, in this case, if
the utilities industry did take a turn for the worst, this would only
impact a portion of your portfolio instead
of the entire thing. I really hold that this makes diversification quite
clear for you because honestly it's not a very
difficult concept to understand. Just keep in mind that
later on in the course when we're going to be constructing
your own portfolio. Whether or not you
choose to focus on ETFs or individual stocks or
even a combination of both, you're going to be diversifying your holdings for now though, just remember what
diversification is as a concept and later
on in this course, we're actually going
to be applying this knowledge to
the construction of your own portfolio based on your investor profile that
you're going to be defining. All right, So that
pretty well wraps up the quick lecture
on diversification. And once again, that
later on in module six, we're actually going
to be applying this information
into constructing your very own stock
market portfolio based on your investor profile and
proper asset allocation.
21. What is Stock Volatility & Beta: Welcome to the 16th lecture of Module two Investing
Fundamentals. In this lecture, we're
going to be learning about what volatility is in regards to stock investing and how you
can assess at the volatility of your individual positions
using the beta coefficient. In addition to this,
we'll be learning about some strategies that
you can utilize in your own stock market
portfolio to lower the overall volatility and
risk of your portfolio. The topics that
we'll be covering in this lecture include a, what is volatility
followed with how to measure volatility with
the beta coefficient. And then finally, we'll be
ending this lecture with how to reduce volatility
in your portfolio, some tips and
strategies to utilize. All right, so starting
off this lecture, Have you ever heard of the
saying, a higher risk, higher reward in regards to investing chances are you
have heard about this before. And in regards to
the stock market investing in generally speaking, a higher-risk position means that it has a higher
volatility level. The volatility of a stock
is basically a measure of the expected size of the price swings from that
stocks and mean and price. Think of it as sort
of like a level of uncertainty or risk related to the size of the price
fluctuations for a given stock. With this in mind,
as stock that has a higher level of
volatility by nature, comes with more uncertainty
and risk than a stock with a lower level of volatility if a stock's volatility
level is high, well, this tells investors
that the future value of this security in
question could fluctuate more intensely over a
shorter period of time in a larger range of values. On the flip side,
a stock that has a lower level of volatility
tells investors at the future expected market value for this given security is expected to range in a much smaller range
of price fluctuations, essentially meaning that it's
steadier and less risky. Honestly get a lot more
technical and in-depth about how volatility is
actually calculated from a mathematical standpoint. But for the likes of
your investing here, this would be more confusing
and then valuable. So we'll just stick to this. What we will be
speaking about though, is how you can get
a quick snapshot of a stock or ETFs volatility
with what's known as the beta coefficient that you can find it directly
on the stock quote before speaking about how to use the beta coefficient to
assess a stock's volatility. Let's first speak
about what it even is in the first place
and how it works. The Beta coefficient is one of the most commonly
used measures to assess a stock's volatility in relation to the
entire market. Essentially, the beta value of a given position is going
to tell you how relatively volatile this position is in relation to the entire
stock market as a whole in a given moment by looking at the beta value
when you're assessing a stalk and determining
whether or not you want to include it
into your portfolio. This value can give
you some insight on how much additional
level of risk are you bringing
into your portfolio. For example, if your
average beta value within your portfolio
is say one, and we're going to be
speaking about what all that means later on
in this lecture. But let's say it's one and
you bring a new stock in your portfolio that has
a beta value of 1.5. Well, you're bringing
additional risk into the portfolio, however, you're also raising
the chances of higher returns due to
the fact that there is more risk associated
with that one position. Always keep this in mind that a higher level of volatility means that there's
higher chances for dramatic price fluctuations, both high and low. Let's now actually
speak about what the different values for
the beta coefficient mean in regards to assessing the volatility of
a specific stock. First off, the baseline
value for Beta is one, and this is essentially the
baseline volatility level of the overall market as a
whole in the current moment, this means that if
you see a stock that has a beta value of one, well, it essentially has the
same level of risk and volatility than the overall
general stock market. And what this means from
a practical standpoint is that this particular
position is expected to return a roughly
the same amount of returns as the overall
general market. And he's not going
to necessarily provide you with excess returns above what the market
it could generate you following the 1 beta value, we have the beta value
that is below 1, meaning that this particular
financial position is going to provide it less risk
than the overall market. Adding a stock or other
financial security that has a Beta below one is essentially
going to bring a less risk to your portfolio, but also reduces the
chance of providing excess returns above what
the market to provide. You. Typically speaking, a stock that has a beta value below 1 is going to move quite
slowly and it's not going to have any
dramatic price wings. For example, a generally
speaking, in Canada, utility and bank stocks tend to have a low Beta
coefficient values because their price movements
are very slow and significantly less dramatic
than other sectors as say, the tech and cannabis industry. Finally, we have the beta
values that are above 1. And you can probably guess at this point and what this means. It means that the actual
position itself is going to be more volatile than the
overall market as a whole. And for this reason, has a higher chance of producing excess returns above what the
market could provide you. But this is also a position
that is more volatile. And at risky in nature,
generally speaking, companies that operate in the
pharmaceuticals cannabis, or let's say tech
industries will have a Beta values above 1
because it by nature, they are much more volatile
than the overall market. If, for example,
we were to compare this to the overall S&P 500. Let's take a look at an example of a stalk in the real-world in order to better
understand and what this beta value is telling us. For example, if we look at the beta value of a
free a cannabis and their five-year monthly
beta value is 2 to, essentially meaning that
the stalk is theoretically 102% more volatile than
the current market. In contrast to this
at TD Bank has a current beta value of right around a
zero-point seventy, meaning it is theoretically 30% less volatile than
the total market. How do we tie this
all together though? Because at this point
of volatility can seem relatively confusing
in the big picture. The issue is that when
you're looking at the beta value of a
given stock or ETF, add your only data point. Well, this doesn't give
us enough information as an investor in order to make a clear decision and
thesis around the position, as we've spoken
about tremendously throughout this entire module, assessing a stock requires a
lot of digging and research, including looking through the balance sheet,
income statement, cash flow statement,
stock chart, as well as other ratios
such as the historic P, the beta value, and the
price to book ratio. For this reason, even if you're looking to include
a specific stock that let's say high as a higher or lower level of volatility, it's still critical
that you conduct a full proper analysis of the position in
question to see how it fits in your overall
investment strategy. For example, if a stock has a relatively low
beta value, well, this doesn't necessarily mean
that it's going to provide a lower level of volatility brought to your
portfolio because, for example, the beta value does not take into account
other factors such as slowing down of revenues and increasingly lowered
stock price over time. So a proper analysis is required for any position you
are looking to invest in. The point I'm really
trying to get across here is that once again, at the beta value is only one single data point that you need to include in your overall
proper assessment of what constitutes a good
financial position for your overall investment
strategy and how it fits in your
overall portfolio. Personally, I only look at the beta value extremely
briefly when doing my first overall
analysis of a stalk and going through the stock
quote because overall, if you're looking to invest
long-term into a position, the beta value isn't really
going to come into effect and have a long-term impact
on your overall position. Because depending on internal
and external factors related to the company, the beta value can change quite rapidly from
one year to the next. So once again, I really
just looked at this quite briefly when first assessing a stalk and looking
at the stock quotes. And depending on
your own investor profile and risk tolerance, which we're going to
be determining and speaking about in Module six, and accepted level
of volatility for your portfolio can
vary greatly from someone else's
portfolio based on all the factors related to
their investor profile. So the goal of this
lecture was really just to give you some preliminary
context around what volatility is and
how you can quickly assess it using the
Beta coefficient. For example, due to my
own investor profile, age, and time horizon, I'm personally okay with
having a portfolio that has a little bit higher
level of volatility due to the fact that I'm
looking to invest in long-term in the positions that I choose to include in my portfolio. However, it's someone
who is saved 40 or 50 years old who's looking to retire in the next
ten to 20 years, having a high level of
volatility and risk, it might not be the best
option for them because this could lead to higher
price fluctuations and swings, which could be detrimental
depending on how quickly they want to utilize the funds
in their portfolio. So basically everything here is a full global assessment
of your own situation. And then you need to determine at what you're comfortable with. But once again, and we're
going to be speaking about this later on in module six. And with that said, a
relatively easy way to regulate the overall
volatility and beta of your portfolio in
order to avoid having an extremely high or
extremely low Beta is two, once again, a purchase
exchange traded funds, which is going to expose you to hundreds of different positions, all with one single holding. For this reason it, since your investments
are more spread out, the overall volatility of
those positions is going to be relatively lower than one single position
in, let's say, a high-growth, high volatility market like the tech industry, that pretty well wraps
up this lecture on the volatility and
beta coefficient. I really hope that you better
understand these concepts.
22. What Is A Dividend Stock And Why Do They Exist?: You've now made it through
the entire second module of this investing course and welcome to the first lecture of Module three,
dividend investing. In this first lecture
of the module, we're going to be learning
about what dividends are in the first place
and why they exist, and why certain companies
might choose to pay out dividends while others do
not pay out dividends. These are questions
that we're going to be answering in this lecture. The topics we'll be
covering are what is a dividend and
why do they exist a followed by a why
do some companies pay dividends and others don't? I'm assuming you've enrolled in this investing course after following my content on YouTube. So most likely you're aware
of what dividends are. However, what would an
investor in course B without first speaking
about the fundamentals, including dividends and their
relationship with stocks. In fact, as we covered in the sixth lecture of module two, we spoke about the wealth
building fundamentals of stock market investing
with dividends being one of the two main
attractive factors in investing in stocks
in the first place. And dividend is quite simply a distribution to
shareholders of a portion of the company's earnings
as a way to thank these individuals for buying
and holding the stock. Dividend distributions, meaning the actual dollar amount that is paid out to shareholders can vary drastically
from stock to stalk or even from quarter to
quarter phrase same company. Because it's important to understand that that
accompany doesn't actually have an obligation to pay
out dividends at all. And the company can decide to distribute to any
amount that they see fit in relation to the company's occur in
financial position. Dividends are really just a
way to encourage investors to actually hold shares of the company and inmates
the stalking question, more attractive as the
price it goes up over time. With that said, uh, paying out dividends to shareholders is typically a practice that
a company will take on a, once they're
well-established and have a reoccurring revenues that are steady and they don't need to re-invest older
income back into the growth and expansion
of the company. This is because accompanies use their earnings in order to pay for the growth of their
operations by new assets, perform research and
development, etc. And all of these count towards the retained earnings
of a company. The balance of
accompanies net earnings minus the retained earnings, meaning the money that
they're utilizing for growth and expansion can
then be utilized in order to distribute
dividends out to shareholders if the management of the company chooses to do so. It's also important to note
that dividend distributions can fluctuate over time
for a given company. If, for example,
they are looking to shift their focus
towards new ventures, or if they find themselves in a difficult financial situation. At this point, the
Board of Directors can choose to either maintain
the dividend distribution, raised the dividend
distribution, and lower the distribution or even cut the
distribution entirely. Just keep this in mind.
And when you're looking to invest in certain
dividend stocks, that it's very
important to understand the overall financials of the company to see if there were any good position
to maintain and continue raising the
dividend over time. For example, during the
whole coronavirus pandemic, multiple companies that
had a significant and dividend distributions
decided to cut their dividend
distributions entirely in order to retain those
earnings and just reinvest them back into the
overall operations and expenses and that they were incurring The most common
form of dividends. And typically what a
dividend investor is going to be after it's called
a cash dividend, where a company will pay
out a certain amount of cash for each share
of the company. If, for example, a specific
company were to pay out a $4 in cash distributions for each share of the company on an annual basis and you held at 20 shares
of this company. Well, during this period,
you would receive $80 in cash dividend
distributions for doing absolutely nothing more than holding the shares
of the company. Now in some rare cases, if there is the possibility
that a company might choose to pay out a
dividend and not in cash, but rather in more shares of the company by cash
dividends are by far the most common and
what we're personally interested in as
dividend investors. I just wanted to mention this so that you are aware
of this reality. However, for the
rest of this course, whenever we're speaking
about dividends, we're talking about cash
dividends, as mentioned earlier, accompanies that are
well-established and have a proven track record of positive earnings tend to be dividend distributing
companies For this reason, a certain industries are
more commonly associated with a dividend
distributions in Canada, the banking industry
is well-known for their consistent and increasing dividend payments over time, as well as the
utilities, oil and gas, energy and industrials
industries. These industries
typically contain companies that consistently
pay out dividends and that also have a
dividend yields in the three to around 5%
a dividend yield range. And we're going to be learning
the difference between a dividend distribution and the dividend yield in
the upcoming lecture. In contrast to this,
industry is like technology, marijuana and other
high-growth industries tend to not pay out a dividend distribution
because they are focused on rapid
expansion and growth. And for this reason that
they're not in a position to pay dividends
to shareholders. Rather, they are
really utilizing all the earnings back into the growth of their operations. With that in mind
that what are some of the primary reasons that companies would
pay out dividends? The first reason that we
touched upon a bit earlier is that for some stocks
known as dividend stocks, in this particular case, investors have come to expect
that they will receive a dividend compensation
for holding this stalk. And due to the fact that the
company has maintained and raise their dividend
distributions for a certain period of time. Some companies have an
extremely long track record of paying out and raising their dividend
distributions over time for several years,
such as, for example, four days Incorporated, which is a utilities company here in Canada that has a dividend
distribution streak of over 40 plus years. So investors in Ford
is incorporated, have come to expect that
they're going to receive a dividend distribution
for holding this stalk. And certain investors known
as dividend investors will look to invest in
specific companies that have that proven track record of paying out and raising
those dividends over time because this creates an
additional source of income for them known
as dividend income, which also happens to be taxed
at a more favorable rate, and then personal
income here in Canada. So if the company in
question decides to either cut or eliminate their
dividend altogether, this can have a major impact on the investor outlook towards
that specific stalk. And for this reason, the stock price could
be negatively impacted. So it can very well be in the company's best interests
who at a minimum and maintain the dividend
distributions over time and keeping
investors happy. The point being here that
dividend distributions are a way for
companies to offload a certain portion of their
unused earnings and at the same time reward shareholders
for holding the stock. But many factors will come
into play when management decides to either cut or raise
a dividend distribution, we'll be diving into
a concept known as dividend aristocrats in a
lecture four of this module, which is basically accompany that is consistently maintained, raised and distributed
their dividend over a period of
five years minimum here in Canada and at 25 years at down in
the United States. Now that we understand and
what dividends are and why certain companies choose to pay out dividends in
the first place. How do you actually receive your dividend payments as
an investor, first-off, companies typically
choose to pay with their dividend distributions
on a quarterly schedule, meaning four times per year. However, note that
accompany can choose to do so on any schedule
that they like, either annually, semi-annually, or even on a monthly basis. In the next lecture, we're
going to be learning all about important dates related
to a dividend investing. With that said, as
a shareholder of a company that pays o
dividend distributions, you really don't
need to worry about collecting these dividends
yourself because in this course we're going to be walking you through
is setting up your very own online
brokerage account where if you do invest
in dividend stocks, you're going to be
receiving these dividends as cash payments automatically directly into your cash balance of your investment account, where you can then utilize
these funds in order to buy more stocks or simply
take them out as cash. So this wraps up the quick
lecture on what dividends are. Hopefully you have a better
understanding now of how they work and why companies
choose to pay them out. In the upcoming lectures, we're going to be learning about other relevant concepts related
to a dividend investing.
23. Dividend Distribution vs Dividend Yield: Welcome to the second lecture of module three, dividends
stock investing. In this lecture
we're going to be speaking about the
difference between a dividend distribution
and a dividend yield of both of which are elements
held within a stock quote, which we spoke about in the
ninth lecture In module two. The topics we'll be covering
in this video include what is a dividend
distribution followed by how is a dividend
distribution translated over into
a dividend yield? And then finally, why do dividend yields fluctuate
throughout the trading day, the dividend distribution, it doesn't need all that
much explanation. It is literally the portion of a company's profits that is
paid out to shareholders. This dividend distribution is a cash amount that's expressed in the native
currency for which the stock in question
trades in and is referred to on a per
share annual basis, depending on the actual
dividend distribution schedule of the company you are
looking to invest in, the shareholder will
receive a fraction of the total annual dividend
distribution for each one of the payment
date of this company. For example, let's say
a company that has a quarterly dividend
distribution schedule and they pay out an annual $1
dividend per share. Well, this means that for
every share that you hold of this company on a
quarterly basis, you're going to receive
at twenty-five cents for a total annual twenty-five
cents times for meaning $1 annually as the total
dividend distribution. Just a quick additional
example here. Let's say a real estate
investment trust that has a total annual dividend
distribution of a $1.20 and they pay out their dividend
each and every month. Well, this means that
a shareholder for each month that they hold
the stock will receive 1 12th of this overall annual $1.20 dividend
distribution, meaning it $0.10 per share held of the company for
this reason though, and based on this logic and the dividend
distribution frequency ultimately does not matter whether or not
it's on a monthly, quarterly, biannual, or
annual basis because the total dividend distribution per share remains the same, whether or not you're
getting your portion of it on a monthly or annual
basis, For example, the reason why I'm
mentioning this is because I have had multiple
individuals reach out to me wondering which stocks paid out or their dividend
on a monthly schedule. And I could understand
the appeal to this, getting your monthly dividend. However, ultimately, it does not matter because
you're just getting a relatively smaller fraction of the overall annual dividend distribution with
all this in mind, how does the dividend
distribution actually translate over though, to a dividend yield? As you know by now,
the market price of a given stock will
fluctuate every second that the markets
are open because investors and traders are
buying and selling shares, which has an impact on the market value of
the given stock. Now I accompany will typically
announced modifications to their dividend
distributions within their quarterly
earnings reports, whether or not they're
going to cut to maintain or raise the dividend
distribution in question, the current dividend
distribution per share, meaning the actual
dollar amount that he shareholder is
receiving for holding the stock on an annual
basis is then going to be projected over the
upcoming 12 months. And this value in relation to the current market
price per share of stock is what ultimately dictate the dividend yield
of that stock. So for example, if a stock has a dividend distribution
of $4 per share, well that $4 annually is what the dividend
yield is based off of. If the dividend distribution
is then raised up to, let's say $6 per share. Well then that's
$6 value is what's utilized to calculate
the dividend yield. For this reason, a dividend
yield of accompany is a percentage between the
current market price per share of stock in relation to the annual dividend at distribution per
share of the stock. In order to calculate the dividend yield of a
stock, it's extremely simple. All you have to do is take the current annual dividend
distribution per share of a stock and divide that by the current market
price per share. For example, a company
that's currently trading in the market at $40 per share and that has an
annual dividend per share of $4 would have a
dividend yield Of 10% because we're taking
that $4 annual dividend per share and dividing it by
$40 market price per share. And that is the reason
why the dividend yield of a stock will fluctuate every
single trading day because the market value is
fluctuating every second as traders are buying and
selling shares of the stock. On the flip side, at
generally speaking, it changes to the
dividend distribution per share only happen on a quarterly basis and often
even on an annual basis. In the same example as earlier, where the dividend distribution
went up to $6 per share. Let's look at three
separate scenarios. So in scenario one,
if the share price remain the same
at $40 per share, the dividend yield would
then be 15% based on it, that $6 per share
dividend distribution. In the second scenario, if the share price
went up to say $60 and the dividend remained
at $6 per share, the yield would remain
the same at 10%. Finally, in the last scenario, if the dividend
distribution remain the same at $4 per share, but the stock price went up to, let's say, $60 per share. The yield would then
drop down to 6.67%. In a real life example here at the time of
filming this video, the share price of TD Bank and Candida is trading at $62.90 per share and their annual
dividend distribution per share is at $3.60, I think, which translates over
into 4.98% dividend yield. As you can see, this
is an equation here. So we can determine
either the market price or the dividend distribution or even the dividend yield
of a stock based on two of the elements of these
three elements equation. It's basic algebra, but
honestly not to worry, you're not ever really
going to have to calculate this for yourself. I really just wanted to show
you how dividend yield is calculated based on
the market price and the dividend distribution. And now you understand how
it works as an equation. The dividend yield
is a tool that you can use to quickly compare a different a
dividend stocks and then the dividend distribution. And you can utilize in order to determine how much
you can expect in dividend distributions on a yearly basis from
a given stock, both of which are available on the stock quote
on Yahoo Finance. One thing to be
mindful of, however, is that for a healthy
dividend yield, it's typically going to range
anywhere from around 2.5% annually to maybe six or
even 7% on the high side, this is going to be a
typical healthy dividend. Yield it. With that said, if you come across a stock that has, let's say, a 1015, 20% dividend yield, which will happen when you're going and
analyzing different stocks, just make sure to conduct proper analysis to determine why the dividend yield is so
high and whether or not this is going to be sustainable
over the long term. So in an upcoming lecture
within this module, we're going to be speaking
about different things to consider when investing in
a viable dividends stock. All right, So that wraps
up this lecture on a dividend distributions versus a dividend yields and how
they play off of each other. In the next lecture, we're
going to be speaking about very important dates related
it to dividend investing.
24. Important Dividend Dates To Understand: Welcome to the third lecture of the third module,
dividend investing. In this lecture, we're
going to be speaking about a variety of
important dates and timelines related to
dividend investing so that you can better
understand when dividends are paid
out to investors and how you can secure
a dividend payment. The topics we'll be covering
in this lecture started with why are there different dates
associated with dividends, stocks in the first place, followed with the
declaration date, the ex-dividend date,
the record date, and finally the payment
date before actually covering the specific dates associated with
dividend investing. Let's first speak about why
there were specific dates associated with the lifecycle of a dividend in
the first place, a company that
distributes a dividend, it needs to have a
systematic approach to declaring, recording, and paying out the proper
amount of dividend out to the shareholders
in question due to the fact that in modern
stock market investing, investors trade stocks
online all day, every day on these
online stock brokerages, meaning stocks will trade hands a thousands of times per day. So for this reason, companies that pay
out a dividend, it needs to have specific dates associated with the life
of a dividend in order to determine at which
shareholders receive a dividend compensation and in what amount as a
dividend investor, it's really important
that you probably understand all of these
dates associated with a dividends in the first place so that you're well
aware of when you'll be receiving a
dividend and if you're going to receive one at all, Let's jump into the first date, which is the declaration date. The declaration date
is when the board of directors of a
company is going to announce that they
had the intention of distributing out a dividend in the upcoming quarter or on whatever timeline
they will choose. The declaration date is
also the date on which the company is going
to announce the terms of this dividend distribution in regards to when the
dividend will be paid out specifically and the amount of
dividend per share. Just think of the declaration
date as an announcement of the upcoming dividend
and as an investor, how much you can
expect to receive. And note that the
declaration date has no impact whatsoever on
whether or not you will be receiving a dividend or not as an investor in the company
or if you're looking to buy into this company in a specific timeline and before the dividend
is actually paid out, other dates relate to that. So you can actually buy
a dividend stock before, on or after the
declaration date. And this will have no impact on whether or not you
receive the dividend. The next important
date related to dividend investing is arguably the most important of them all, and this is the one that you
will see it most commonly when you're researching and
dividend stocks to invest in. And this is what's known
as the ex, dividend date. The x they've been
indeed is essentially the date by which you
must be a shareholder in a company in order to receive the upcoming dividend
distribution. The reason why the
ex-dividend date exists in the first place is because when you purchase a
stock in a given company, it'll usually take around one to two business
days in order for your name as a shareholder to settle in the company
in questions books, as a valid shareholder that's eligible to receive a dividend. Now, depending on
the stock exchange that this dog is going
to be trading on it. Typically speaking,
the ex-dividend date is going to be
anywhere from one to two to three days before the actual record
date of the dividend. That will be
speaking of shortly. All this to say though,
that if you purchase a dividend stock after
the ex-dividend date, you will not appear in
the company's books. And for this reason, you
will not be receiving the upcoming announced that
dividend distribution. All you really need
to remember here is that if you want
to be eligible for accompanies upcoming dividend
distribution and you need to have purchased
the stock priority, the ex-dividend date in order
to receive your dividend. The next important
date related to dividend investing is
called the date of record. And technically we actually spoken about the date
of record before the ex-dividend date because the ex-dividend date is based
off of the date of record. The date of record is the official date on
which you must be a valid shareholder in
the company's books in order to qualify for their
upcoming dividend payment. When a company
declares a dividend, they also set a date of record. And then from this
date of record at the ex-dividend date is determinant depending
on the stock exchange and that the stock trades on. And as a shareholder, you must purchase
stocks and before the ex-dividend date
and not on or after. With that said, if
you've already been a shareholder of this dog
and question that you're looking to receive a
dividend from all you need to do is hold that stock until after the activity
end date and you will still receive
the dividend payment even if you go ahead and sell your shares after the
ex-dividend date. Finally, the last
important date related to dividend investing is
called the date of payment. And this is pretty
straightforward, just based on the name. This is going to be the
date on which the company issues out the dividend
distributions to shareholders. And if you are indeed a
valid shareholder who purchased the shares
of the company prior to the ex-dividend date, you will receive your
dividend distributions a couple of business days
after the payment date. So this wraps up the lecture on important dates associated
to dividend investing. This was not really a complex
or long lecture, however, it's really just
important that you understand each
one of these days properly so that you know what's going on with
your dividend payments. If you so choose to purchase a dividend stocks
in your portfolio. In the next lecture, we'll be speaking about what
criteria makes a good dividend stock and
what you should be looking out for for a good a
dividend stock investment.
25. Assessing A Dividend Stock's Worthiness: Welcome to the fourth
lecture of module three, dividend stock investing. In this lecture,
we're going to be speaking about what
you should be looking for in order to properly assess the worthiness of
a dividend stock to add it or not
to your portfolio. Because not all
dividends stocks, I shouldn't be treated the same. And it, depending on your
dividend investing strategy, there are various at
different data elements that you'll want to consider in your overall assessment and analysis of the
stock in question. The reality is that selecting a good dividend paying
companies to add to your portfolio can be somewhat confusing and even a challenge. But this lecture is
going to give you the tools to properly identify the key elements that you
need to be looking out for when you're selecting
and dividend stocks to add to your portfolio. The topics we'll be covering in this lecture include
the following. Dividend yield, dividend payout ratio with consistent
profitability to maintain the dividend strong at cashflow dividend
distributions over time. And then finally, we'll be speaking about
dividend aristocrats. First and foremost, we've
already spoken about the dividend yield and the
second lecture of this module. And the reason why we spoke
about the yield is so early in this module is due to the fact that the
dividend yield. Is it typically the first thing that dividend
investors look at when assessing whether or not they're interested in the dividend
stock in question. And the reason why the
yield is often the first of data that
investors look at when assessing a dividend
stock is because it's easily and readily available
on the stock quote. It's also a quick and easy
way for investors to estimate what type of return on
investment they can expect from this dividend
stock in question, excluding the actual
appreciation of the sock. At this point, you should know all about what the
dividend yield is because we had a full
separate lecture on it. However, just to recap, let's say a stock
that's trading at $100 per share with a
5% dividend yield. Well, this would yield
the investor of $5 in dividend distributions per year for a stock that they
hold of that company. Now a mistake that
new investors often make when just getting
into dividend investing is looking for companies that have the highest possible dividend
yield and only using this one piece of information to make their overall investment
decision on the company. While the dividend yield is definitely something that
you are going to want to take into consideration for the assessment of a dividend
stock makes sure to only use the dividend yield as a
preliminary data point for surface level assessment of the dividend stock in question. Before going ahead
and looking at other elements that
we're about to speak of. The absolute last thing that you would want to do as
a dividend investor is go out and buy shares of a company that has a
dividend yield of say, 10%, which AT service level
looks at very attractive. However, upon a further
research into the company, you would see that
it has, let's say, a struggling revenues and
net income, poor management. And ultimately in
the short-term, a dividend is most likely
going to be caught anyways, as a result of poor
financial performance. And that's not to say
that all dividends thoughts with a
high yield of say, 10% are in fact going
to be financially unstable and we'll be cutting their dividend in
the short-term. It's just that if you want to be a proper dividend
investor who does the adequate research
before making a position and accompany utilizing the dividend
yield exclusively as your only data point does
not give us enough contexts around the reasoning of why the dividend yield is so high. So you're just going
to want to look at more data elements in
your overall assessment. With this in mind
though, what is a healthy dividend yield that you should be targeting anyways, although this indefinitely
vary from company to company and even
industry to industry, typically a healthy
dividend yield that I personally look out for is
between three and at 6%. And the reason for this
is because between 3, 6%, this is usually healthy and
manageable for a company that has a good cash flows
and net income figures. Now obviously a dividend
yield can venture out of this three to 6% a
dividend yield range and still be healthy and sustainable for the
company in question, based on their own
financial fundamentals. This is just kind of a rule
of thumb that I set out for myself for first assessment
of a dividend yield. And with that said
accompany that does in fact have a
dividend yield between this three to 6% range
could actually not be healthy for their own financial
fundamentals as well. So I once again,
it's just really important that you do an
overall assessment of the company's income
statement and balance sheet and cash flow
figures in relation to their yield to
see whether or not this is going to be
sustainable for this company. In summary, it's completely normal that the
dividend yield is going to be the first
thing that you look at on a company's stock quote, when assessing it as
a dividend position. And you might be wanting
to add to your portfolio. This is definitely the first
thing that I looked at, but you're going
to want to utilize the dividend yield
in combination. The other elements that
we're about to speak of at, such as the dividend
payout ratio, as discussed earlier
on in this course, companies will typically
start paying out a dividend once they
are well established in their industry and are
profitable enough to actually justify a redistributing a
portion of their earnings, uh, back to shareholders as a way of rewarding
them for simply a holding the stalk and also potentially attracting
new investors. Now it's important
to understand that I said at profitable companies, because dividends
are paid out to shareholders after
the company utilizes its retained earnings for growth and expansion of
their operations. For this reason that accompany that is in a full growth mode, it typically will not be paying out a dividend distribution to their shareholders
because they're retaining all of their earnings. In order to reinvest
it back into the growth and expansion
of their operations. This is really
important to keep in mind because for a company to consistently maintain
and continue raising their dividend
distributions over time, it also needs to be
increasingly profitable because otherwise
it just does not make physical sense
for the company, at least companies
that we want to be investing in to
actually let us say you borrow money in order to maintain their high
dividend yield for the distributions
to actually may fiscal sense from the
company standpoint, you want these
dividends to be from an organic source of earnings
with enough buffer for the company to
actually utilize at some of these
earnings for research and development and
just further expansion of the company's operations. This is where the dividend
payout ratio comes into play. And this is quite simply
a quick calculation. It taking the dividend
distributions paid out Bay Company over a calendar year and
then dividing that by the net earnings
of the company. The reason why the
dividend payout ratio is important in determining
the sustainability and health of a dividend
distribution for accompany is because this is essentially telling
us how much of the net earnings accompany
is retaining for growth and expansion and how much
of the net earnings it is paying out to shareholders in
at dividend distributions. For example, if a company has a dividend payout ratio of 50%, well this means that
from its net earnings it is paying out 50% of them, it to shareholders in the form of dividend
distributions and then keeping 50% in retained earnings for whatever they so choose. On the flip side, accompany
that would have say, a dividend payout ratio of 150%, which does actually happen, would mean that the
company is paying out dividend distributions
in the realm of a 150% of their net
earnings for that period. For a company to
actually do this and maintain this very high
dividend payout ratio, they would have to do one of many things such
as, for example, utilizing their cash position, selling off some
of their assets, borrowing money from
other institutions, or even issuing out more shares or bonds in
order to raise capital. All of which are not ideal and sustainable
practices over the long-term. And ultimately, this
typically leads to cut dividend distributions in
the short to medium term, which is not advantageous
for a dividend investors. I do want to mention
that depending on the nature of the company
that you're looking at or even in the industry
that it operates in a healthy dividend pale ratio
range can vary somewhat, but as a general rule of thumb, a healthy dividend
payout ratio is usually between 35 and it 50%, maybe 60% if we're pushing it, depending on the actual industry that the company operates in. And as we spoke about in the previous module with real
estate investment trust, this thing typically go up to about 80% and it's
still remain healthy. Irregular companies
though anything above 60% pale ratio and
going up to 95%, means that the
company is paying out a very high percentage of
their net earnings back to shareholders and doesn't
really leave them with much capital for re-investing
back into growth. I really hope that you now have a better understanding of what the dividend
payout ratio is, how it is calculated, and then how it is utilized for assessing the worthiness
of a dividend stock. I now want to look at two
quick real-world examples of stocks that have a differing
and dividend payout ratios. The first company
is Canadian Tire, and as we can see here
on market beat.com, which is a website
that allows you to see a company's
dividend payout ratio, while, uh, based on their
trailing 12 months of earnings. This is a company that has
a dividend payout ratio of 49.45%, which is healthy. And it's a preliminary
indicator that this is a company that can financially sustained this
dividend distribution. Now, do keep in mind that the dividend payout
ratio is also one of many factors to consider in your overall assessment of a
dividend stock worthiness. In contrast that Canadian Tire, the second company
will be comparing is the Laurentian
Bank of Canada, which is one of Canada's
mid-sized banks. And their dividend
payout ratio based on the trailing 12 months
of earnings is 107.74%, which obviously is too
high and is unsustainable. In fact, in this bank
and did even cut their dividend by 40% during the coronavirus crash because their net earnings were unable
to sustain the dividend. So with all that said, I
definitely always look at a dividend stocks
pale ratio as one of the many data
elements that comes into play for the
overall assessment. Moving on to the next factor to consider with a dividend
stock selection, you want to make sure
that the company you're looking to invest in
for their dividend has been increasingly profitable for at least the past five years. The reason for this
is because as we just covered in the last
point for accompany to maintain their dividend
distributions and maintain a healthy
dividend payout ratio, it needs to be increasingly
profitable if it's looking at to increase their dividend
distributions over time. So that on a relative basis, the dividend payout
ratio is not increasing each year as they're raising their dividend distributions. If a company is increasing their dividend distributions
each and every year, however, they're not also
increasing their profitability. Well, this will
have the result of a dividend payout
ratio increasing each and every year
to a point where it could potentially
become unsustainable. For this reason,
investors who are looking to benefit
from long-term, consistent and increasing
a dividend payouts from a specific companies. It's important that the
company in question. Is increasingly profitable
each calendar year at a rate of what I
personally like to be five to around 15% annually in increases to their
net income figures. This gives the company
enough leeway to increase their dividend
distribution to each year by 5, 215% and while maintaining a steady and healthy
dividend payout ratio. Now in addition to accompanies
increasing profitability, it should go without
saying that when assessing the worthiness
of a dividend stock, you should also be taken into consideration everything related
to the income statement, balance sheet, and
cash flow statements that we learned
about in module two. Always remember here that you're investing in a company
that needs to be financially viable and somewhat stable depending on the
investing style that you're going for in order
for the company to yield positive results
for the investor. Always remember that
or it's another, we've covered some ratios
and percentages to keep in mind and when assessing the viability of
a dividend stock, the next thing that you're
going to want to look at is the track record of
dividend distributions over time of this company
to see whether or not over the past
five to ten years, this is accompany that has at a minimum maintain their
dividend distributions. And more importantly,
whether or not they've been raising their dividend
distributions each calendar year. This is going to be very
important when you're investing in a dividend
stock for the long-term, if you're looking to increase the value of your portfolio at an exponential rate and at the very minimum beat
inflation levels. For example, if a
company is only paid out a dividend and increased
over the past few years. Well, this doesn't
really instill confidence that this
is a company that will maintain their dividend
and he continue increasing it over time
for the long-term. Personally, when I'm looking to add a new dividend stocks in my portfolio in combination with everything we
just spoke about. I also like to invest in companies that have
been at paying out and increasing their dividend
at year over year for a minimum of five
years specifically, and even more if possible, to check this data,
it's very simple. You can typically
actually find it on the company and
questions website, or you can also visit
a TM X money for Canadian stocks in this
section right here, where you'll have access to information related
to the dividend, the dividend growth,
and dividend history. With that said, there's also
a variety of other websites online where you can find a historic information
about accompanies dividend. This now leads me
into the next topic, which is something that
I've spoken about quite extensively actually
on my YouTube channel regarding companies that have a proven track record
of consistently maintaining and raising
their dividend distributions over a certain period of time, which are considered to be
a dividend aristocrats. A dividend aristocrat
is a company that has maintained their dividend
and continuously raised it year-over-year
for a minimum of five years in Canada and 25
years in the United States. The reason for this is because in the United States there are significantly more
companies that have actually been paying out and
maintaining their dividend, raising it over time, but for significantly
longer than in Canada. Now the companies
also need to have a market capitalization of
a minimum of 300 million in order to be
considered a dividend aristocrat by the
time that Standard and Poor's conducts the year and review of which
companies are going to be included in the
dividend aristocrat indice. Now even though we're looking
at companies that are considered to be
dividend aristocrats can be a really great
starting point for finding a new dividend
opportunities. It's also really important
to keep in mind that for accompany to
actually maintain, they said dividend
aristocrats status and maintaining the increases of their dividend at
year over year, they can technically
just increase it by a penny per share per year. So with that said, it's
important to look further into the actual historic information related to the
company's dividends. I personally like to see
companies at raising their dividend
distributions by a minimum of 5% annually or
15% on the high end, with around 10% of being
most favorable here. In order to make it this company actually be worthwhile
to include in my dividend portfolio
in relation to all the other elements
that we just spoke about. This pretty well wraps
up the lecture on the most critical elements
that you need to keep in mind that when assessing
the worthiness of a dividend stock to add
it to your portfolio. And I want to stress the
fact that once again, that it's really
important that you take a global holistic view of
everything that we just spoke about in order to
assess whether or not a dividend stock is going to be a right fit for your portfolio. And make sure that you look into accompanies
income statement, balance sheet and cash
flow statement at all times before making an
investment in that company. I'm going to mention
it a couple more times throughout this
course because I cannot stress enough how important
this is if you really want to be an investor
rather than a speculator. In the next lecture,
we're going to be speaking about what
the best use for your dividend income
is in order to grow the value of your
portfolio over time.
26. The Best Use For Your Dividend Income: Welcome to the fifth lecture of module three,
dividend investing. In this lecture, we're
going to be speaking about the most advantageous strategy that a dividend investor can use with their dividend
income in order to grow the value of their portfolio at an exponential pace over time. And for pretty much
everyone watching this and this is going to be the
best course of action. The topics we'll be covering in this lecture include
the following. The best way to use a dividend
income And then finally, a comparison between
a reinvesting dividends versus not
reinvesting dividends. All right, so at this
point it should be quite evident that dividend
income can play a critical role in the overall returns of your investments
over the long-term. Because it dividend income, It creates additional
liquidity within your portfolio that you can rely on in order to
purchase more stocks, ETFs, or other
financial securities, other than only relying on it, the actual appreciation of the value of your
investments over time. However, even though
dividend income is typically received in cash within your portfolio
when you receive a dividend distribution
from a company, the way that an investor
utilizes this dividend income, complete a major role on the long-term exponential growth of the value of their portfolio. Now chances are that if you're following this investing course, you're interested in growing the value of your
stock market portfolio and subsequently your wealth
over the next decade or two. Because this is a
course where we're learning about how to
analyze a company from a fundamental standpoint and invest in them over
the long-term to benefit from dividend income and appreciation of the value
of these investments. Instead of looking
to say day trade or other forms of risky
investments with this in mind, and following a long-term
investing strategy, you're going to be receiving
and dividend income from at least a portion of your
stock market portfolio, whether it be from ETFs, specific dividend stocks or real estate investment trusts. But what is the best way to
utilize this Stephen and income for increasing a
compound interests over time? The answer to this question
is actually very simple, and that is just to reinvest
as dividend income back into purchasing more
of the securities at that you're holding
in your portfolio, which in turn increases
the compound interests of your portfolio over the length
of your investing career. And the reason for this
is that you now have more shares of the companies
or ETFs that you're holding. The shares are themselves and generating more dividend income. So all of this combine creates an exponential
effect over time in combination with
reoccurring contributions by you into your stock
market portfolio, the best use for your
dividend income is quite simply just to
reinvest it back into purchasing more shares
instead of taking that dividend income out and
using it for other purposes, which in the beginning isn't going to be that much anyways. So it's much more beneficial to just reinvest it back into the portfolio and have
that grow over time. So I really don't want
to make this lecture longer than it has to be. So just remember here I've already mentioned
it multiple times, but reinvestment of your
dividend income back into the portfolio
is the best use over the next 101520 years for exponential growth of the
value of your portfolio. But let's actually now compare side-by-side two portfolios that have the exact same
initial balance, monthly contributions,
dividend yields, as well as annual
returns from the stalks. One of them are
reinvesting the dividends and the other not
reinvesting the dividends. Just to see how dramatic
of an impact this actually has on the future
value of the portfolios. In both scenarios,
we're starting off with an initial balance of $5
thousand in the portfolio, which for most
individuals is realistic. But even if you're starting
with less or more, it doesn't really
matter because at this example here is
simply to showcase the difference that
dividend reinvesting makes on the growth
of your portfolio. In the first scenario,
we're starting with $5 thousand
of which we will then add $500 per month that
to our investment account. And it just for the
sake of this example, we will say that the
current price of the shares you're investing in
our $50 per piece. Now from there we'll put a realistic expected increase of stock price at 7% annually, which for most established
dividend stocks, easy, realistic based on
historic information. Next, we're investing for
a 30 year time horizon. However, this calculator
will show us a table of each year leading
up to the 30 years. So we can see how the
account would grow. The current dividend yield
we will input is 5%. And finally, the expected
dividend growth rate, meaning the increases of the dividend distribution
at per year will be at 7%. For this first a
baseline scenario, we will be turning off the drip, which is the dividend
reinvestment. And so this would mean that
you are not reinvesting the dividends back into
purchasing more shares. Rather, you would just be utilizing the dividend income to do something else rather
than growing the account, as we can see here when
calculating this first scenario, while after 30 years, the account will have
grown to $604,825, which isn't bad considering that throughout our entire
investment period, we were only contributing
as $6 thousand per year and never reinvesting
any of the dividends. Let's now look at scenario two with the exact same information, but this time it will be reinvesting the dividends
back into purchasing more shares of the company to see what type
of difference this makes in the long run when changing the drip option to yes, this is telling
the calculator to take all the dividends received and then reinvesting them back into purchasing
more shares. That's not only growing the
actual number of shares, but also increasing the
dividends received, which again are reinvested. Now we can see that this has
made a huge difference in both the dividend column as well as the end balance column. Instead of ending with
only 600 thousand, this portfolio ends with
just shy of $1.5 million. This is really the power of re-investing those
dividends back into the portfolio and
then benefiting even more from compound
interest over it. There was years. Another factor to consider
is that as we can see from the bottom rows
at compound interests, it takes the largest
effect with larger values. So if you're reinvesting
your dividends over the course of your
investment horizon? Well, this is creating a
larger gaps of appreciation In the years 15 to 30
because there is more capital to work with and compounding is more beneficial. What did you make out of all the information that
we just covered? Well, I think it's pretty
evident what I'm about to say. If you're actually serious
about growing the value of your portfolio and your wealth over time in the stock market, then it's going to be
very important that you prioritize what you're looking
for with your investments. I would obviously recommend that you contribute as much as you possibly can per
month into the portfolio. Because overtime this
is going to have a major impact and the
compounding of your portfolio, especially in the later
years of your investing. And then also reinvesting as much of the dividend
income as possible back into the portfolio instead of utilizing it for your
living expenses. In the next lecture,
we'll be speaking about a dividend focus ETFs and how those can be utilized to a passive investors advantage.
27. Dividend ETFs: Welcome to the sixth lecture of module three, dividends
stock investing. In this lecture,
we're going to be speaking about how
you can incorporate the passivity and
diversification of exchange traded funds with
a dividend investing. If you're the type of
investor who's looking to utilize ETFs as your
main investment vehicle. The topics we'll be covering in this lecture include
the following. What is a dividend ETF? A couple of dividend
ETF options. And then finally,
advantages of using a dividend ETFs over picking
and dividend stocks. The first thing we'll need
to make clear is what a dividend focused ETF even is. And then m is actually
quite straightforward in that this is an exchange
traded fund that is focused on including
companies that provide a higher level
of dividend income, as opposed to other exchange traded funds that, for example, track broad market
indices or just have other investment
goals in general, when we covered the
lecture on ETFs, we spoke about how there can be various exchange traded
funds that mimic certain market indices based on a variety of different
criteria, such as, for example, the transaction
volume of the stalks, the actual industry these
companies operate in, the market capitalization
or whether or not the actually distribute a dividend distribution
in the first place. Now obviously we're
not going to recap everything there is to
know about what an ETF is. However, just keep in mind that some exchange traded
funds are going to be focused, including companies that either have a higher than
average dividend yield or a consistency in dividend distributions over
a certain period of time. Now, there are a variety of dividend focus ETF to choose from and ultimately
which ones could potentially be most
beneficial for your portfolio are going
to depend on a variety of different factors that
you need to choose from arranging from the actual
size of the fund itself, how many companies
are in the fund, the actual size of the company, the dividend yield and a
variety of different factors. That said a couple of
dividend focus ETFs here in Canada
include xy, I, VTY, and CDC, which are going to include various
different companies, but are all focused on higher than average and
dividend income for this fund. Let's now quickly cover why some investors may choose
to utilize a dividend focused ETFs instead
of hand selecting specific and dividend
stocks as with most ETFs. And the advantage here really comes down to diversification of your holdings and the
passivity of your investments. Now obviously in this
course we've spoken extensively about
how to actually analyze a specific
company's financial is going through all their
financial documents, as well as specific
ratios and things to take into consideration when
analyzing a stock. However, it also spoken
quite extensively about the use of exchange traded funds in a stock
market portfolio, acting as a foundation for your stock market portfolio for consistent and steady
returns over time. And this is no different
for potentially including a dividend focus
exchange traded fund, as you already know by now, I personally have a
foundational layer of certain core ETFs that I like to add to my portfolio for that consistency and
appreciation over time. And then I cherry-pick is select the stocks that
I think are going to appreciate at a nice pace or provide a certain
upside to my portfolio. In the case of a
dividend focus ETF. And not only does
is provide you with diversification of the stocks held within it, this one fund. It also gives you a
hedged exposure to the dividend at distributions of each one of these companies. When we spoke about why
certain companies will pay out a dividend distribution
in the first place, we mentioned that companies
are not inherently obligated to maintain their dividend
payment moving forward, this is at the discretion
of the actual board of management of the company
that you're invested in. If you invest in a
dividend focused ETF, Well, if one or two of these
companies, for example, cut their dividend, you
still have exposure to high dividend distributions
from these other companies. For example, during the
whole corona virus outbreak, and many companies cut
their dividend from a nice, safe five-six percent
and down to one or 2% or even 0 overnight. So unfortunately, if you
held any of these companies, you'd be out a dividend for
that specific position. If you invest in a
dividend ETF that holds a variety of
different stocks. Well, if one of the dozens of companies ends up
cutting their dividend, you're not as exposed to that one single position
cutting their dividend because all the other ones are
either going to be maintaining or continue
raising them over time. Essentially, it's just
a question of hedging your exposure to one
single position, which is the same rationale
as to why ETFs are great investments
in the first place to diversify your holdings. Alright, so this was a very
shortened to be lecture for you and actually wraps
up Module three, which was all about
dividend stock investing. I think by this point, you will have noticed that even though each module covers
completely different topics, they all build off of each other with module
two being really the main module where
we learned about how to actually properly
analyze a company from a fundamental level. In the next module,
which is module four, we're going to be
learning all about taxation on your investments, as well as the different
fees that you're going to incur while you're investing
in the stock market. And as a student of mine, it is absolutely critical
that you properly understand everything
there is to know about these two topics. I'll see you in
the next lecture.
28. Trading Fees To Be Aware Of: Welcome to the first
lecture of module four, investing fees and
at taxation and this entire module
we're going to be going over the various fees associated with stock market
investing that you're almost undoubtedly going to
experience at 1 or another, because honestly it's just
part of the game and you have to be aware of these
various fees from there, we'll be learning
about how taxation works in regards to
your investment and different strategies
to utilize in order to keep them more
money in your pocket. In this specific lecture, we're going to be taking
things off with speaking about all the various different
types of fees associated with stock market investing in a self-directed account so
that you aren't hit with any unknowns are surprises
went to actually do open up your own
brokerage account and it started trading. The reason why I'm saying a self-directed investing
here is because if, for example, you
were to go ahead and invest with a
financial advisor at, let's say investors
group or any other type of wealth management company,
will typically speaking, they're going to charge you a 12 or even 3% premium for what they call active
management of your portfolio. And over the years,
this can represent a thousands upon thousands
of dollars that you're paying out to these institutions for their active management. However, with a
self-directed account and after taking this course, you're going to be taking
matters into your own hands and building your own stock market
portfolio with ETFs stocks and other financial
securities in order to lower your overall fees
associated with investing and keeping more
money in your pocket, which over the long run with compound interest
is going to equate to thousands of dollars added to the value
of your portfolio. Now I do want to
mention here that while most discount
brokerages are going to have a standard fees associated with their account. Each brokerage is
going to be the same. So for this reason, each
one is going to have a various fees associated with different actions
within their talents. But as you're going to see in this lecture as well
as in this module, we're going to try to reduce as much as possible
the fees as well as taxes that you're
going to have to pay on your
investments afterward, unlearning about self-managing
our investments in order to avoid spending thousands
and a management fees. And we're going to be
specifically focusing on to discount brokerages that I personally use it later
on in the course. With that said,
let's take a look at the various topics that we're gonna be covering
in this lecture. We'll first start
off the lecture speaking about
trading account fees, including annual and
inactivity fees as well as research is subscriptions are followed with a
conversion rate fees. And then finally,
we'll be covering a stock of commissions if you're new to
investing and haven't yet opened your very
own brokerage account, then you're probably not aware
of all the different fees that can be associated with
a stock market investing. The most common fee that
traditionally comes with a brokerage account
is what's known as an annual fee is
simply for maintaining an active a brokerage account
with the institution. And generally this ranges from 25 to around $50 per quarter. Nowadays, this is
more typical with a brokerage account from
a one of the large banks. So if you decide to open a brokerage account with
either TD Bank, Scotia Bank, basically any of the large
banks, and generally speaking, and there will be an annual fee associated with your account. Now usually there are
ways to avoid it. These annual fees by either
setting up, for example, auto deposited directly into your account for a certain
amount each month. Or you can also maintain a certain balance
in your account. And generally this will
wave at the annual fee. However, with the introduction of online discount brokerages, you can typically avoided these altogether without any hassle. So this is why I typically recommend quest trade as well as well simple trade which we're
going to be speaking about in detail later
on in the course. But these are two discount
online brokerages had offer a very low fee
structures in addition to an actual annual fee
charged by the brokerage is some brokerages
are going to also charge what's called
an inactivity fee. This is generally going to be a quarterly fee that's
charged to your account if you do not meet the
minimum requirements for activity in the account. Generally, this is
a number of trades. Once again, inactivity
fees can be easily avoided by simply executing
the minimum amount of trades at during the quarter is setting up an auto deposit or just avoiding it altogether
by utilizing either well, symbol trade, which does
not charge any fees whatsoever in terms of annual or quarterly
inactivity fees and quests rate is only
going to charge you an inactivity fee per quarter of $25 if you don't execute
at a minimum at one trade, or just maintain a
balance of $1000. So again, this is very
easily avoidable. The next fee that some investors might want to take on
is what's called a research and data information package where with some
brokerages and you can subscribe to an
additional package of a live information related
to the stock market, which is going to give you a real-time quotes and a data
down to the split-second. And typically these are
going to range anywhere from 50 to around $150 per month. Now I am mentioning these data packages in today's lecture because I just want
you to be aware of this as a possibility. However, with long term
buy and hold investing, such as what we're
learning in this course. You're not going to
need information down to the split second. And that is typically
something that a day trader is going to
take on for the likes of this type of investing
of long-term buy-and-hold in
quality companies that have solid financials, this is not something that's
going to be necessary, but I really just wanted
you to be aware of it. Next up is by far
the most common fee associated with
stock market trading that you will absolutely be faced with when you
actually start opening up your brokerage account
and then a buying and selling various
financial securities. And that is an actual
Trading Commission where you're charged either a flat or a variable fee associated with the
actual trade itself. And generally this is going
to range anywhere from free to about a $10 portrayed. Depending on the
brokerage that you use and the size of
the transaction. So anytime that you actually buy or sell shares of a company, you're going to be charged
an additional fee on top of the actual total amount
of what you're buying or selling in regards to the
actual financial asset. And note that I did say
that this can range anywhere from free
to around at $10. Portrayed it depending on
the brokerage that you use. And this is the main
reason why I personally recommend either request
rate or well symbol trade because they offer either
a free commissions or a very low commissions
in contrast to the commissions charged by
these big bank brokerages, which typically is
around $10 portrayed. And that's absolutely
unacceptable in my opinion. While symbol trade is
completely free for all buying and selling orders of all
financial securities on it, their platform,
however, it does come with significantly
less functionality. And then on the flip
side, quests rate, which is the second and discount brokerage
that I personally use and recommend to everyone
watching this video, they charge a variable
commission structure. However, typically
it's going to be $4.95 for all buying and
selling orders of a stalks. And then they also have a
free buying orders for ETS, making it very attractive
due to the fact that it has significantly
more functionality, as well as research tools to research at the stocks
that you're interested in. So typically, I
recommend that you open a both accounts
to get the best of both worlds and then as
split up your investments in the well simple
trade as well as a questionnaire to account for
your different investments. Basically, what I'm
saying here is that if you are going to be
a self-directing your investments and at
trying to minimize as much as possible the fees
associated with your trading, which I absolutely
recommend you should do. You should just stay away from the brokerage account offered by the large banks such
as TD, VMO, RBC, etc. Because these typically
will charge you up to $10 per transaction, which over years of
investing can equate up to thousands and thousands of dollars in actual fees and then even tens of
thousands of dollars in a missed opportunity
costs due to the actual appreciation
and compound interests that you would gain on
those reinvested funds. In previous lectures
where we spoke about the power of
compound interests, we showcase the difference
that only a couple of $100 extra added to your account per month can really make
in the long run. So imagine paying $10 every single time you're looking
to buy or sell stocks. This really just does not make any sense in any environment. And finally, the
last common fee that you're most likely
going to encounter a drink and your
investing career is what's known as a
conversion fee. And quite simply what this
is is a fee associated with converting your Canadian dollars into US dollars or vice versa. If you're looking to invest
in American companies, this is the exact same
thing as when you go on vacation and get
your Canadian dollars converted into US
dollars will on top of the actual
baseline conversion rate. Typically there's
going to be a fee associated with doing this. In regards to stock market
investing, however, you're going to incur a
conversion fee if for example, you have Canadian funds
in your Canadian EFSA, but you want to purchase, let's say, an American companies
such as Apple computers, which trades in US dollars. Well, when you go
to buy this stock, you're going to incur
a conversion fee on top of what you're buying power in Canadian dollars is to purchase those US dollars. So with that said, generally the conversion fees are going
to be anywhere from 0.5 to around 1.5% on the total
value of the transaction. And this is added it to the total value of
the transaction and you'll be well aware of it
before you execute the trade. Because typically it's going
to show you and you can choose whether or
not you want to go through with the order. There are a couple
of ways that you can avoid a currency
conversion fees. The first one being
the simplest, which is just that maintain a US dollar Training
account and then a purchase at your US stocks
through that account. However, this doesn't tell
that you would need to already have The US
funds at your disposal. Otherwise we could
do is purchase Canadian exchange
traded funds or ETFs that hold American
position such as for example, an S&P 500 ETF, like if VIV from Vanguard, this is a Canadian position that trades in Canadian dollars. However, you're going
to benefit from these American positions
without having to actually maintain a US
dollars in your account. Now if you're
absolutely dead set on buying and selling
American positions, but you don't want
to pay that 1.5 to roughly 3% at currency
conversion fee that your brokerage is
going to charge you. What you can do is called
a Norbert gambit maneuver. And I've reserved
an entire lecture for this in this module. So make sure to
check that out in the last lecture of this module, this pretty well wraps up the preliminary lecture
on the training fees and maintenance fees that
you're going to incur in a various different
online and brokerages. And in the upcoming lectures
of the next module, we're actually going to be
diving into both Quest, raid, annual symbol trade to go
through all the features and functionalities so that you can choose which one
is right for you. In the next lecture,
we're going to be speaking about the
difference between the management expense
ratios of an exchange traded fund and the expenses
associated with a mutual fund.
29. ETF Fees vs Mutual Fund Fees: Welcome to the second
lecture of module four, training thes and taxation. In this lecture, we're going to be conducting a comparison between the management
expense ratios of ETFs versus the fees associated with mutual funds to see what type
of difference only a couple of percent per
year can have over the long-term of the
growth of your portfolio. The topics we'll be covering in this lecture include what is a management expense ratio
MER per short for ETFs? And then finally, comparing the management expense
ratios of ETFs versus the fees associated with
mutual funds overtime on the value of your
portfolio with an example. All right, so before we actually jump into a comparison between the management expense ratios in ETFs and the fees associated
with mutual funds, which generally speaking, is
where most individuals are going to end up investing their
money in the first place. Because if they're going
to be sold in mutual funds and by their advisor
at their bank. Well, let's actually speak about what management expense ratios are in the first place for ETFs so that you're up to speed, as we discussed in
the second module, a passive exchange traded fund is generally going
to be a basket of financial securities
that is created in order to replicate or mimic a
certain market index. So for this reason, there is not nearly as
much active management of the fund by the company that has created this
exchange traded fund. In contrast to say,
a mutual fund, where there's actually
Account Managers that are trying to actively
beat the market by buying and selling stocks
and other forms of financial securities in order to create excess returns
above the market. Since the management of a passive exchange traded
fund that is mimicking a certain market index requires significantly less work from the actual company that
has created the fund. The management
expense ratio being all the costs associated
with actually managing and operating in the fund are typically going to
be significantly lower than the fees
associated with an active funds such
as a mutual fund. The management expense
ratio takes into account all the costs associated with running and
maintaining the fund, including the fees to the investment
managers and advisors, the legal expenses, the accounting expenses
and bookkeeping, and all other fees that
the fund will incur. Now, you might also
encounter what's known as the management fee on certain
ETF description pages, which will be lower
than the MER, but the MER takes into account the management
fee and then adds on top of that the other costs associated
with managing the fund. So the management
expense ratio figure is really what you want to look at in terms of the total fees
associated with this fund. All you really need
to remember here as an investor is that to the
management expense ratio of a passive ETF is
going to typically be significantly lower
than the fees associated with a mutual fund. For example, the MER
of the ETF, FV, FV, which is an S&P 500 ETF here in Canada is only 0, is 0 8%. And for ETFs that
are more hands-on, the MER can sometimes
hover up to say, 0.8%, but this is nonetheless
a significantly lower than the fees associated
with most mutual funds, which are around a two to 3% annually on your
invested funds. As mentioned before
in the course, I personally use ETFs that track a broad market indexes in order to create a foundational
layer within my portfolio to expose
me to a variety of different securities at a
very low management costs. And then I'll go ahead and hand select certain stocks that
are of interest to me. And this is pretty
much what you are going to be doing as well within your own
self-constructed portfolio. At this point, you
should now have a better idea of the
difference between the fees associated with ETFs and actively managed
mutual funds. But even at that, I've had
many people ask me, well, one to 2% difference, really watch that going
to do over the long run. And my answer to that is
a massive difference, even though it might
not seem like a law at one to 2% difference in
management fee over the long run. And this makes a
massive difference in the end value
of your portfolio. So what I now want to do is compare two portfolio examples, one utilizing ETS and one
utilizing mutual funds at a 2% difference
management fee to really showcase what a difference this can make over
in the long run. All right, so this
right here is an easy to use calculator that I found online it with
a quick Google search. And essentially it's going to showcase the difference
that fees can have over the long-term growth of your investment portfolio. So the way that this
calculator works is that you input your
initial investment and the annual investment
average years for growth and average rate of
return in following this. And you can put a two
different investment fees. So in this case we're going
to have the lower one, it'd be the ETF fees. And then below here
we're going to have the fees associated with mutual funds which are a percent or two higher than the MER, fees of our ETF. We're going to start off
this investment with a reasonable $5 thousand
initial investment, as well as an annual
investment of $6 thousand because
this would equate to a $500 invested per month on
a 25-year growth period. And the rate of return is
going to be a conservative, let's just say 6% at
the end of the day. This is just an example to showcase the difference
that a couple of percent can have on the long-term investment and
growth of your portfolio. With the MER fees of the ETFs, we're going to put a 0.08% as a standard because this is the management expense
ratio of V FV, which is a passively
managed S&P 500 ETF offered by Vanguard is 0.08. And then the average
fees associated with an actively managed mutual
fund are typically going to hover anywhere from a two to around 3% of so let's just
put an average of 2.5%. So if we scroll down here, we can see two columns, the left column being
the lower fee at 0.08 and the right column
being the higher fee at 2.5%, the rate of return annually
is the same at 6%. However, the net rate of return, which is essentially
the difference between a rate of return and
our investment fee, is going to be vastly different. The investment value at
the end of 25 years is 346,560 on average for the 0.08% management fee
with the ETFs and then 245,515 with the actively
managed mutual fund. This is also represented in a bar graph where we
have the ETFs as well as the mutual funds and then the difference is just
over a 100 thousand. Now obviously this is just an example with
rounded numbers, average annual
returns and so forth, and a mutual fund that can potentially yield
higher results. However, the historic
performance of the S&P 500, it typically is going to beat an actively managed mutual
fund on the average year. So this example was
really just to give you a clear picture of
the difference that only a couple
percent can have on the overall returns of your investment in order for you to better understand that, that even if it looks minute
at only a percent or two different over a 25-year
period of growth. This makes a massive difference. I really hope this
example now gives you a clear picture as
to why I personally opt to utilize ETFs instead of mutual
funds in my portfolio. In the next lecture, we're
going to be learning all about the various different
investment account types that are available to
investors in Canada.
30. Investment Accounts & Benefits Of Each: Welcome to the third
lecture of module four, trading fees and taxation. In this lecture, we're
going to be speaking about the most popular and common
Canadian investment accounts that are available
for those who want to start investing in
the stock market. And I'm going to
be going through the pros and cons of each, how they work and
which account I would recommend and new
investors start with, the topics we'll be covering in this lecture include
the following. We'll start off with what the tax-free savings
account acronym at TFS followed with the registered
retirement savings plan, that acronym or RSP. And then finally, we'll
be speaking about the cash and margin accounts, starting with the
tax-free savings account. And this is a newer registered
account and that was introduced in 2009
to o Canadians to invest pre-tax
dollars into the account up to a yearly maximum
contribution limit and then have those funds and grow
over time and completely tax-free in order to be able to withdraw those
funds later on, including the interests
completely tax-free. The trade-off here
is that you're contributed funds are
not going to count as a tax deduction on
your tax return in the year that you actually
contribute it to the EFSA. However, it is all going to
grow completely tax-free, which is a huge advantage if, for example, if you were to
make $50 thousand during this calendar year
and then contribute $5 thousand TO EFSA? Well, you're still
going to need to pay income tax on your entire $50 thousand including that
$5 thousand contribution. However, if in 20 years, let's say that $5 thousand
contribution grew to around, and let's say $25 thousand or
whatever it ends up being, and you withdraw
that entire amount, you're not going to have to
pay any tax whatsoever on it, the entirety of your withdraws. And although this
account is called the tax-free savings account, it isn't a really
a savings account. It is a real investment
account where you can buy and hold all the
financial securities at that we've spoken
about in this course, including stocks, bonds, ETFs reads N and
the list goes on. So hey, does this mean you can go ahead and buy, let's say, a $100 thousand worth of Tesla stock and then
reap the rewards over the next couple of years with all the funds tax-free
and call it a day. Well, actually there are some contribution
limits that you need to respect each and
every calendar year that are set by the government. With that said, the
good news is that the FSA contributions
are commutative for each calendar year
that you are 18 after the year that they
account was introduced in 2009. So if for example, right now
you are 30 years old, well, you would have a large
contribution room available for you to start
investing with This right here is a table with
one row showcasing each yearly contribution
limits set by the government. And then to the right
of that we have all the cumulative amounts
from 2009 to 2012. The yearly contribution
limit was $5 thousand from 2013 to 2018 and the
annual limit was $5,500 in contribution per year except in 2011 where the
limit was $10 thousand. And then finally in 20192020, we have a limit of $6
thousand per year, meaning that if you
had turned 18 before 2009 and have never
contributed to your EFSA, you would have a total
cumulative contribution limit of $69,500, which is a very decent to start investing with the T FSA is an absolutely phenomenal
investment account available for Canadians that I would typically recommend most
investors start with, especially if they're new
to investing and have not yet maxed out their
entire contribution room. However, there are a
couple of elements that we need to cover
regarding the EFSA. First of all, I get
this question asked all the time and that
is whether or not you're allowed to
open multiple T FSAs with a different institutions. And at the answer
to that is yes, you're allowed to
open multiple TFS. A is let's say one
with quests, raid, one width, well
simple trade TD, etc. And the reason why you
would want to do this is so that you can spread
out your investments. I get asked this question
all the time and I actually have
multiple TFS days myself because I
like to split up my investment strategies
in at different accounts. However, all you need
to keep in mind with that is that your cumulative
contribution room, let's say $69,500 if you've never contributed and
you turn 18 before 2009, we'll just take that
as an example here. Well, if you've
never contributed, you'll have that entire
contribution room. But you need to
keep in mind that across all your accounts, your contributions
cannot exceed. You're allowed to
cumulative contribution. So you wouldn't be able
to go and contribute 69 thousand to each
one of these FSAs. You'd have to break it up
and it makes sure that all of them combine the
contributions in each account. It do not exceed you're
allowed at contribution room. This is something that not
too many Canadian investors are actually aware of. However, it can
play a large role in the overall decisions of which financial
securities you decide to hold in Iraq EFSA because yes, if you go ahead and
purchase some higher-risk, higher return positions and you do end up
hitting a home run. You're going to benefit from huge capital gains,
pretty much tax-free. But on the flip side, if your investment don't
really go as planned and you end up losing a significant amount
of during your year, you're not able to go ahead
and claim a capital loss on your tax return for
your loss in the EFSA. Again, though, this isn't really something that you should
worry about if you're going to construct
a solid portfolio with positions that
you've researched. Let's now move on to
the registered at retirement savings
program acronym, our RSP, which was introduced in 1957 by the Canadian
government in order to incentivize Canadians to
save for their retirement. Now remember that the RR SP is also a registered
accounts such as width, the tax-free savings account, meaning that it is
going to come up with some tax sheltering benefits offered by the
Canadian government. And it's also going
to be tracked more accurately by the CRA. The main difference
between the RSP and the T FSA is when your attack. So in the case of an RSP, your contributions in a
calendar year are going to be tax deductible from your
total taxable income. Whereas on the flip
side of the T FSA, as we learned earlier, your contributions
still count towards your total taxable
income for that year. However, later on down the road, once your investment to grow, you can withdraw the entirety of your investment tax-free. Let's illustrate this with an example to make
things clearer. If Mark lives in
Ontario and earns $50 thousand from one source
of income in say, 2018. And just to make
things simple, well, that means that at the end
of the year he owed the government $11 thousand
in income tax. If Mark contributes to his TFS, he'll still be paying the
same amount in income tax. However, if market
attributed $5 thousand to his RSP in his taxable
income would be reduced by $5 thousand down to $45 thousand and he
would only have to pay roughly $9,300 in
income tax with that said, however, in contrast
to the EFSA, when Mark withdraws funds from his RSP later on
during his life, all the withdrawals
will count towards his taxable income for the year that he makes
those withdraws. The goal with the RSP is
that you'll most likely be making more income
during your twenties, thirties, and
forties and then at, during your years of retirement. So this could become advantageous
from a tax perspective. Now just like with its EFSA, there are annual
contribution limit that you must respect
for the RR SP. However, the way this is calculated is
entirely different. Instead of a predefined limits set by the federal government each year that all Canadians are allowed to contribute
to say, the EFSA. Well, with the RSP, this
contribution limit accounts for 18% of your entire taxable
income for the prior year. So if, for example,
Mark made at that $50 thousand in the
2019 calendar year, which was last year in 2020, he would be able to
contribute to his RSP 18% of that $50 thousand
representing a $900 thousand. And just like with NTT FSA, these amounts are commutative for each year that you
did not contribute. So if, for example, you're
already 30 years old and you've been earning income
for the past ten years or so, you will have a somewhat
substantial amount of RSP room that's available
for you if you're interested in discovering
your cumulative at EFSA and our RSP
contribution rooms that you can simply log into your My CRA account and this will all be
available for you. And finally, we're
moving on to what's known as the cash account. And this is the most basic and bare-bones investment
account and that you can open and unfortunately does not come with any tax benefits. This means that all earnings
in your cash account, whether dividends or capital
gains and interests, are going to be fully taxable at their
respective tax rate, which we're going to be
learning all about in the fifth lecture
of this module. The advantage with a
cash account though, is that there were no
contribution limits per year that you
have to respect. So if you want to invest a
$100,000 million, whatever, you can do so in a cash
account without any hiccups. There's also no restrictions within a cash account related to how many trades
you're allowed to make in a given day or a week, for example, whereas
with its EFSA, you're not allowed to do day
trading in a cash account. You can trade as
much as you want, buy and sell a 100 stocks
within a day if you want it. There were no restriction
with that said, the downside to the cash
account is that you're fully taxable on all your gains, whether they are capital gains, dividend income,
or even interest, you're going to be taxed
fully on those amounts at the respected tax rates over 95% of all the students
following this course, the cash account is
not really going to be the first account that you're
going to want to invest in. You're going to want to
start investing in the EFSA followed with the RSP
and attach account. And that's personally
how I would do it and what I would recommend all the students do as well quickly to go over what
a margin account is. This is basically
the exact same thing as a cash account in that it is non-registered and there are no contribution limit that you have to respect in a
given calendar year. It's pretty much a free reign. The difference between the
margin and the cash account, however, is that with
a margin account, you can borrow funds from the brokerage and
essentially leverage your invested funds in order to hopefully reap higher rewards. With that said,
investing board funds as a beginner is
absolutely not something that I would recommend you partake in because
it keep in mind and then you do need to pay interest on these board funds
and this needs to come into play when you're calculating your overall
return on investment. If you're a new beginner
who doesn't 100% know your overall strategy
with your investing. Utilizing a board funds
to invest with inherently puts a lot more risk in
your overall positions. The way I would
recommend you approach a margin account
and board funds to invest with if
you're a beginner or even an intermediary
is first of all, max out your EFSA account and your RSP in order to gain knowledge of how stock
market investing works. And then once you
feel comfortable, if you so choose, then adventure on into
cash accounts and utilize margin in order to
try to read a higher rewards. Now, as mentioned earlier, when we're speaking
about the T FSA with the cash account and you
can claim what's called a capital loss on your
tax return if you do happen to lose money
on your investments, this is sort of an advantage with the non-registered account. However, at the end of the day, losing money is never going
to be beneficial anyways, this is just something to
keep in mind though with the cash account over the
tax-free savings account. Even with this in mind though, losing money and then claiming your capital loss is
never going to be more beneficial than just making money in your
tax-free savings accounts. Or what I would always recommend
is start with the T FSA. Learn how to invest properly, it reap the rewards
of long-term. This pretty much wraps
up the lecture on the three main investment
account available to Canadians. Obviously everyone's situation
is going to be different. However, for around 95%, I'd say, of the people
watching this right now, I would say that starting with its EFSA is going
to be the most tax efficient as the overall value
of your portfolio grows. Because this is
going to severely outweigh any tax savings
that you can incur from a tax deductions with an
RSP and even capital loss potentially if you
do lose money on your investment account
with a cash accounts. So start with the EFSA, move on to the RSP after. And then once you've maxed out all of your
registered accounts, moving on to a cash or margin account can then
make a strategic sense. In the next lecture,
we're going to be speaking about
something called the Foreign withholding taxes
on foreign dividends.
31. Foreign Withholding Tax: Welcome to the fourth
lecture of module four, trading fees and taxation. In this lecture, we're going
to be speaking about what foreign withholding taxes
are and how they can affect the overall returns of your investments in various different investment
accounts of being the three that we covered in
the last lecture will also be speaking about various different
strategies that you can deploy it within each one of your investment
accounts in order to minimize the overall impact of foreign withholding taxes
on in your portfolio. The topics we'll be covering in this lecture include
the following. What are foreign
withholding taxes? Foreign withholding
taxes in the EFSA, foreign withholding
taxes in the RR SP, and then finally, foreign
withholding taxes in the cash account
when you invest into stocks are funds that
hold American positions. As a Canadian investor, you are subject to
what's known as foreign withholding taxes on the dividend income
that you're going to be generating from those American positioned because the IRS, which is the Internal
Revenue Service, basically the exact same thing
as the CRA here in Canada. They want to get their cut of the dividend earnings before it has a chance to
hit your account. With that said as an investor, you don't need to
worry about paying these foreign withholding taxes yourself on your dividend
income because this is already done automatically
and withheld by the IRS and before those dividends actually are deposited into your
investment account. Foreign withholding taxes
is essentially just a tax that is applied it to
the dividend income only derived from American
positions in 99% of the cases of investments
that are going to be held in your account as
a Canadian investor, I wanted to first make
things clear as to what foreign withholding taxes is
in the first place before we actually speak about how foreign
withholding taxes varies depending on the type
of investment account and that you utilize
either the TFS a, the RSP, or the cash account because the foreign
withholding taxes are different depending on
the account that you're investing with for these
American positions. So with that said,
unless first jump into the foreign withholding
taxes of EFSA. Because for most individuals
watching this right now, the T FSA is going to be the first account that
you start investing with, as mentioned in the
previous lecture, the tax-free savings account is a Canadian investment account where individuals are able to contribute up to a yearly limit each calendar year and then have their investments
and grow over time on a tax-free basis where
when they go to with a draw their contributions as well as the appreciation and dividend
income down the road. This is completely tax-free. This is an awesome
investment account, especially for younger
investors who can fully take advantage of the
time value of money. However, in terms of
American positions, there are some technicalities that you need to
keep in mind that regarding a foreign
withholding taxes on dividend income within the EFSA in regards to
dividend income and Canadian securities held
within HTFS or unfortunately treated differently from a taxation standpoint
than American positions. To simplify the concept, but just remember
here that in terms of Canadian positions held within your tax-free savings accounts. So let's say, for example, the company for this, that is a Canadian company, will all the appreciation on the actual share value as
well as dividend income from the Canadian position in your investment
account is going to be entirely tax-free where things get a little bit
more complicated, is it with dividends incurred
from non Canadian sources? For example, an American
position that is paying out a dividend into your Canadian at tax-free
savings account. This 15% at foreign withholding
taxes is applied at two dividend income only
on US stocks as well as the US stocks held within even Canadian ETFs or mutual funds that happened
to hold American positions. Any dividend income
incurred from the Canadian funds that hold American position is still
going to be subject to the 15% withholding taxes on
any of this dividend income. So for example, if you
own shares of v FV, which is a Canadian ETF that
seeks to track the S&P 500. And then for this reason it obviously hold
American companies, there's 15% withholding
tax would be applied on the dividend income incurred
from this V. Fv IETF. Keep in mind that
the withholding tax only applies to dividend
income and is not applied at two capital gains in the EFSA even if the
stocks are Americans. So if your investments triple in value during the time that
they're in the T FSA. You still do not need
to worry about paying any capital gains on them
as expected with its EFSA. I hope this is somewhat unclear, but I do realize that
it could be confusing. So let me try to illustrate
this further with an example. All right, so let's just say in this hypothetical
example here that you own a share of Apple computers in your
tax-free savings account, which is an American company. And let's say
theoretically they had a dividend yield of 1%. However, due to the fact that
it's an American position, you would be subject to
the 15% withholding tax on their dividend if you held the share of Apple in your EFSA. So you wouldn't be leaving a 15% of their dividend
with the IRS and your actual yield would be 0.85% in this
hypothetical example. If all this information
taken into account though, is it even worth it to hold American positions in your tax-free savings
account at all. This is obviously something that you'll need to
consider for yourself. But in my opinion, paying 15% withholding taxes on dividend income only
honestly just isn't really a big deal in
the larger picture of your investment returns
over the long-term. Because remember this 15%
foreign withholding taxes only applies to the actual dividend income and not the overall appreciation of the position itself in
terms of capital gains. And historically speaking, the American markets
tend to outperform the Canadian markets by
anywhere from one to around 3% annually in a 3%, again, on the
overall position of your investment versus at 15% foreign withholding
taxes on dividends only. I think he got the
idea here that in the big picture of your
overall investment return, this is a minimal amount. With that said, I
really just wanted you to be aware as a
new investor that American positions
held within a EFSA are going to be subject to
this withholding taxes. But in the big picture,
and in my opinion, it's not really something that you should be
worrying about. And if you're really interested
in an American physician, the hold in your TF essay
for long-term appreciation, which remember,
would be tax-free, I would say go for it. Alright, so now that
you fully understand the implications of foreign withholding taxes on dividends for positions
within your EFSA. How is this applied
at two candidates as second most popular are
registered account, which is the RR SPE. Unlike for the FSA with the RSP, investors can benefit
from a tax deduction in the full amount of
their contributions to the RSP In order to reduce their overall taxable
income and pay less taxes. Now, however, later
on down the road, once their investments grow
over time, upon withdrawal, this amount will be added to their taxable income in
that year in the future, as mentioned, withdrawals
from the RSP are going to be considered at taxable
income down the line. But what about dividend
income as well as capital appreciation
from American positions held within the RSP. This is actually somewhat
interesting for the RSP. So unlike with the cash account, which we're going to
be speaking about, a write-off through
the RSP here. Any appreciation in the
overall share value or value of your ETFs or other financial
security is held within your RSP is going to
actually count as taxable income if your
marginal tax rate later on down the line, when you decide to
withdraw those funds, even if it is in
fact a capital gain, such as what you would incur in a cash account with
a capital gain. We're gonna be learning
all about this in detail in the next lecture. But essentially for
a capital gain, you're only taxed on 50% of the overall gain at
your marginal tax rate. This would not
apply for the RSP. It's going to count 100% as taxable income at your
personal tax margin. With that said though, one
advantage for the RSP, I guess we could say
here is that there are no foreign withholding taxes
applied to dividends earned in the RSP on
American physicians before jumping into
foreign withholding taxes within a cash account. Let's just quickly summarize
what we've learned up-to-date for both of
these registered accounts. First of all, with a
tax-free savings account, you are going to be paying that 15% withholding taxes on dividends earned from
American physicians. However, as these
dividends grow as well as share appreciation in
the account over time, when you go to
withdraw these funds, it is going to be
completely tax-free. On the flip side, with the RSP, there are no foreign
withholding taxes on american dividends earned
it within your RSP. However, any form of appreciation of the value
of your investments as well as the dividend income compounding over time
later on down the line, when you go to withdraw
any of those funds, it is going to count 100% as a taxable income at your
marginal tax bracket. Alright, so now that
we have both of the most common registered
investment accounts, out of the way it Let's move on to the non-registered account, which are the cache and a margin account is so
that you understand how formed withholding
taxes work with these non-registered accounts
within a cash account, dividends are taxed
completely differently than a regular income
or capital gains. I don't want to get
into full detail about how dividends
are taxed within a non-registered cash or margin account because these
can get quite complicated. What I would recommend
doing once you are at the stage of investing
in a cash account and you're receiving dividends
is that you utilize a CPA to do your taxes
at the end of the year, this is really going to be
your best bet for maximizing your tax strategies with your overall investments
including dividends. Otherwise, an
alternative that you can utilize if you
really want to follow your own taxes
yourself is utilizing something such as a
simple tax or quick tax, which are online
applications where you can input all of your taxable income as well as dividend income. And this is going to estimate how much tax you owe at
the end of the year. Now in terms of capital gains, meaning the overall
appreciation of the value of the investment
within a cash account. This is going to be
subject to what's called a capital gains taxes, where you're only going
to be taxed on 50% of the overall capital gain
at your marginal tax rate. Now in the next lecture, we're actually going
to be diving into the technicalities
of dividend income, capital gains and
personal income. And finally, to cover dividends earned from American positions held within a Canadian at cash and
non-registered account. Obviously, these positions
are going to be subject to 15% foreign withholding taxes on those American foreign dividends that are being earned in
your Canadian account. So I hope this lecture has
helped you better understand what foreign withholding
taxes is and how it is applied it to the
dividends earned in at various different Canadian
investment accounts. And the bottom line here, in my opinion is that
in the big picture, taking this into consideration, it should only be
a small portion of your overall
investment decision. And if you truly believe that an American position is
going to perform well from your overall assessment of the company and
its future potential, I wouldn't really give the
foreign withholding tax all that much attention
because in the big picture, it's not really going to impact the long-term appreciation
and growth of your portfolio. Now in the next
lecture, we're actually going to be digging deeper into dividend income
and capital gains as well as business income, how each one of these are taxed.
32. Capital Gains vs Business Income vs Tax-Free Gains: Welcome to the fifth
lecture of module five at trading
fees and taxation. In this lecture, we're
going to be speaking about the various different types of income that you can derive it from a stock
market investing. The topics we'll be covering in this lecture include
the following. What are capital gains? What is business income? And then finally, how to
benefit from a tax-free gains. All right, so the first form of income that we're going
to be speaking about in this lecture is something
called the capital gains. And this is a type of income that you may
have heard of before. If, for example, you are a homeowner who has
purchased a house and then sold it at a subsequent date for a higher premium than
what you paid for it. Or another scenario
could be if you're a stock market investor who's purchased a
certain position in a company stock and
sold it a couple years down the line for what's
called a capital gain, essentially meaning a price point higher than
what you paid for it. Now, the reason why there's a specific name associated
with this type of income being a capital gains
is because in the tax code, capital gains are going
to be taxed differently than other forms of income,
such as, for example, the income that you
generate from your job or other forms of
income altogether, if you're somewhat
new to taxation in regards to your investments, which chances are you are? Well, this course is
not about going into depth about how the
Canadian tax code works. That's absolutely
something you're going to want to consult a CPA or just your
accountant for in regards to fully
understanding the scope of how taxation works for
your specific investments. What I want you to remember
though in this lecture, is that a personal income and being income derived
from your job in Canada is going to be the highest attached
form of income, well above a dividend as well
as capital gains income, which are both investment
and forms of income. This is why when you
hear the saying, the rich get richer, well, yes it is because
they have more money. You are working for
them in the market at generating more compound
interest over time. But it's also because most of this income is taxed
favorably because it's derived from either
investment income or shelled it through a
corporation of both of which are going to be taxed
favorably in contrast to income that the general public is deriving from their job. Anyways, we're not
going to be diving into how corporate income taxes work. But as an investor is just important that you
understand that different forms of income
are taxed differently. Back to capital gains. This is a form of income
that's generated from the sale of an asset such
as stocks, ETFs, bonds, property, basically any type
of asset that you own or the value has risen during the time that
you own this asset. Now keep in mind that a capital
gain is only going to be realized when you decided to
sell the asset in question. So if for example, you bought a share of a specific
stock at a $100 a share, and you've kept it for 30 years. You're never going to
be paying taxes on it. The appreciation of
that asset over time, even if right now the value of that one share is worth $500, you're only going to
pay capital gains taxes when you decided to sell
the asset in question, capital gains are advantageous from a taxation standpoint, overstay personal
or business income, because only 50% of the capital
gain is going to be added it to your personal
income tax on which you need to pay
your marginal tax rate. For example, if you generate
$5 thousand worth of a capital gain from the sale of some stock in your
non-registered a cash account, meaning it not ATF
essay or an RSP. And you are currently in say, the highest tax bracket, just to make things simpler, while only $2500 of that gain will be added
into your taxable income. And then you'd pay
your marginal tax rate on that of say, 50%, meaning that you
would pay the CRA $2550 in capital gains taxes and you would get
to keep $3,750. Obviously, the amount that you would get the heap
in your pocket would vary based on your
own marginal tax rates. So this is going
to differ greatly depending on the province
that you live in, In your marginal tax rate. So if you were making
say, $30 thousand in a year, full calendar year, but you made that
same $5 thousand capital gain and
what you would pay significantly less
capital gains taxes than someone who was making, say, above a $100
thousand per year. And so for this reason that
their marginal tax rate is significantly above what you would have at 30
thousand a year. To wrap up this section
on capital gains. All you really need
to understand as an investor here that's
looking to invest in the stock market
is that if you're investing in stocks, ETFs, or any other financial asset and that we've spoken
about in this course, outside of a registered account, you're going to be
paying a capital gains taxes on the gain one, you sell those securities later on down the
road for a profit. One last thing to mention
about capital gains is you're not going to be subject
to this type of tax. If you're investing Within a
registered at tax shelter, they count such as, for example, a t FSA or an RSP. But we're going to be speaking
about that in more detail later on in this lecture
following capital gains. And we need to speak about what business income is so that
you have a better picture of how the CRA views different forms of investing
in the stock market. Now, for most individuals who
are following this course and who are going to be
utilizing a long-term, a buy-and-hold investing
strategy in quality companies. You don't really need to
worry about ever paying a business income on
your investments, especially if you're investing
in a T FSA or an RR SP. However, the reason
why I'm mentioning this is because the
CRA does treated day trading as a business
income in a cash account or even in a tax-free
savings account if you're conducting a day
training activities, what is business
income and why are we covering it in this course
That's about investing. Well, business income
is basically just that. It's income that
you're generating from a business system
with the intention of pulling a profit
and business income can take a variety
of different forms, from selling t-shirts to
selling things on Amazon. Basically, any form of
business income that is not generated from either investing or from your job is going to, in the eyes of the CRA, be considered a business income. And you have to be
mindful of this because in the eyes
of the CRA, day, trading in an investment
account is going to be considered business income
instead of capital gains. Now I say business income. And for some of
you, you might be thinking of this as being income that you're generating
from a large business, but essentially any form of income that you're
making outside of your investment or
your primary job is going to be considered
a business income. That's just a terminology
I'm using here, but you're going to
have to add this to your overall taxable income for that year and
it's going to have an impact on your
marginal tax rate, even though you'll
probably never have to worry about business
income in relation to your own stock market investing because you're following
in this course and learning how to properly invest in the stock market
to grow your wealth over time by investing into
solid companies and funds. I really just want
you to be aware as an investor that if
you do invest in a cash account and
you're looking to day trade with the intention
of pulling a profit, they CRA, could deem this activity as being
business income. So just make sure
you're aware of this. If we look at the example
from earlier where there was a capital gain of $5 thousand. Well, if this was treated as business income because
you were a day trading, while this $5 thousand would not be considered a
capital gain, rather, it would be considered
business income that you would have to add to your
personal tax return, which would grow your
overall taxable income for that year and it potentially increase your marginal tax rate. So again, I really
just wanted to make the differences it
clear here between a capital gains and a business income potentially if you're looking to day trade, but I really hope that
you're just looking to invest in the
long-term in order to grow your wealth over time in a solid companies and funds that you've conducted
at proper research in. Let's now dive into the next
form of investment income, which is what I call
a tax-free gains. If you're investing in a
tax-free savings account. Following what we spoke about in the third lecture
of this module, the EFSA is a way
for Canadians to grow the value of their
investments over time, benefiting from tax-free gains
on their dividend income and the appreciations of the securities held
within the account. When you investigate the FSA, you don't need to worry about
paying a capital gains tax or taxes on your dividend
income because again, everything held within the EFSA is going to be tax-free other than a foreign
withholding taxes on dividends earned from
American companies. This pretty well
wraps up the lecture on the various types of income that you
can generate from your investments here in Canada. So just to recap, these are the different
forms of income. So we have a capital gains as well as dividend income
that you're going to be paying taxes on if
you're investing in a cash account and
not in ATF essay, then we also have
a tax-free income and gains within a EFSA. And finally,
potentially business income on your investments if your day trading in a cash
account or even in EFSA, this is not permitted
and the CRA could edema you're trading activities as being a business income. In the next lecture, we'll
be speaking about how the foreign currency
exchange rates can have an impact
on your investments. As a Canadian investor, investing in stocks or ETFs that are located
in the United States. And more specifically.
33. How Foreign Currency Exchange Rates Affect Your Returns: Welcome to the sixth
lecture of module four, trading fees and taxation. In this lecture, we'll
be speaking about how foreign currency
conversion rates affect your investment returns. Has a Canadian investor in
various different scenarios to see how the fluctuation of the Canadian dollar in
relation to foreign currency, specifically American
dollars affects your portfolio over time. The topics we'll be covering in this lecture include
the following. What is currency exposure
for dual listed stocks? How do currency
exchange fees affect my returns in four
separate scenarios, followed with what is the
best option for Canadians. And then finally, what our
currency hedge to ETFs. The first thing we
need to cover when speaking about currency
exchange rates in relation to your
investments is something called the
currency exposure. Because without properly understanding this
concept first, everything else
we're going to be covering in this
lecture isn't really going to make sense when you
invest in foreign equities. It's really important
to understand that your exposure to currency
fluctuations does not come from the currency in which the stock is trading
on a given exchange, but rather the underlying
currency for which that company is
actually treating in on its native exchange. This is primarily important
for stocks that are dual listed on both a Canadian
and an American has changed. Or even for ETFs that track
the same underlying index. For example, the ETF of VOO in the United States and
if the FV and Canada, both of which track the
S&P 500 market index, even though dual listed stocks, it seemed to be trading at
a different price points, this surface level price
difference is going to be reflected in the
currency exchange rate. In addition to this, it's
only the relative success of the underlying currency in which the stock primarily trades in on its native exchange and currency that's going
to have an impact on the currency fluctuation part of your returns for a
foreign investment. For example, if we look at
the Royal Bank of Canada, which trades on both the
New York Stock Exchange and the Toronto Stock Exchange. Well, on the TSC, which is the companies in native currency at the time
of filming this lecture, this company is trading
at $94.32 per share. And on the New York Stock Exchange version
of this company, it's trading at
$70.86 per share, which perfectly matches up to the current currency conversion. And the same would be
true here for any other, a duel listed stock or
whether or not it's a Canadian or an
American physician. And primarily due to this concept known as
currency exposure, if you're a Canadian investor, which most likely you
are if you're watching this video lecture
and you're looking to invest in a foreign
security that is both dual listed in Canada
and the United States? Well, I would always
recommend that you invest in the Canadian version of that stock because he returns will always be the
same on a relative, a one-to-one basis and based on the currency exchange rate between the American
and Canadian dollar, the only risk you are
exposing yourself to is paying a higher
currency conversion fee. If you're a Canadian and
looking to buy a dualist it stalk on the American exchange instead of the
Canadian exchange. With this in mind, it's
important to understand as a Canadian investor
that probably 90% of the time you're most likely
going to be calculating your investment returns
in Canadian dollars, whether or not you
do decide to include some American stocks or ETFs in your portfolio for
the rest of the lecture, just remember that the
currency impact on your investment returns is
only going to be related to the actual currency
fluctuations of the underlying currency for which the stock
primarily trades in, in its native country. So the only time a
currency will have an impact on your
investment in returns is if you're a Canadian
investor and you're looking to invest in
American companies, in US dollars on an
American exchange. This specific scenario of being a Canadian investor actually
buying American positions in American dollars now opens up another can of worms were
currency fluctuation. It does actually have
an impact on it. Your returns as a
Canadian investor, it was looking at calculate your returns in
Canadian dollars, which is most likely the case. It's certainly is for me now that we'd better
understand the fact that the currency exchange
rate only has an impact on your investment
returns based on it, the underlying currency
of the stalking question, Let's now look at four
separate scenarios where a Canadian investor would be buying the shares
of Coca-Cola, which is an American
company that only trades in US dollars on an American Exchange or the actual currency
exchange rate between Canadian and American dollar
is going to be fluctuating, as well as the overall
share price of Coca-Cola will be
fluctuating in order to shed some light on various
different scenarios that you'll most likely encounter During your
investment career as a baseline for
these four scenarios. Let's just say that right
now. And you were able to purchase ten shares of Coca-Cola at $100 a piece for
the sake of this example, this would say you
back 1000 US dollars, which currently equates to
1334 Canadian dollars at the current currency
exchange rate in scenario one that you first purchased attend
shares of Coca-Cola for a total out-of-pocket
cost of one hundred, ten hundred dollars
in this example, or 1334 Canadian dollars, which remember is the
current conversion rate if the share price were to rise to a $150 USD per
share of Coca-Cola. This would mean that
your total value in USD. Would rise to 1500 USD for a $500 gain at which
you might think is equal to 2001 Canadian dollar, which is a $667 gain
in Canadian dollars. However, in this scenario, if the Canadian
dollar continues to lose value relative to
the American dollar, to the point where one
USD is worth $1.50 Canadian will add this
new conversion rates since the time that you
purchase the shares, if you were to sell
your position and go back into Canadian dollars, instead of a gain of
667 Canadian dollars at the conversion rate on
which you purchased it at, if you're Coca-Cola
stock at a value of 1500 USD would actually be worth 2250 Canadian dollars for a total gain of 916
Canadian dollars. So this is a first
prime example of how both the currency
fluctuation can impact your returns as well as just the fluctuation
in share value. Because the underlying
currency of Coca-Cola is USD. Well, as a Canadian, your investment would
actually benefit when they Canadian
dollar falls in value. Even though that's somewhat
counter-intuitive. And you would suffer though
when it appreciates in value relative to the US
dollar in scenario two. Now, once again, your
baseline costs for the ten shares of Coca-Cola
would be one hundred, ten hundred USD
or 1334 Canadian. If the share price
remains the same for each share in this example, your total cost and
investment values would remain the same, meaning that you
would make no returns on the equity pricing. However, if the value
of the Canadian dollar were to continue to
fall down to a level of a $1.50 Canadian for each one US dollar will at
this new conversion rates, if you were to sell your
position and go back into Canadian funds due to the fact that the US dollar
is worth more, then when you made the purchase your
unchanged at one hundred, ten hundred dollars
USD shares would be worth 1500 and
Canadian dollars for a total gain of $166 exclusively based on the
fluctuation of the currencies. Moving on now to
scenario number three, this is where the value of
Coca-Cola would rise to $150 US per share. But the Canadian dollar
gradually gets stronger where it reaches a level of a $1.20
Canadian for each one USD. Once again, your
baseline costs for the ten shares of
Coca-Cola was one hundred, ten hundred USD,
or 1334 Canadian. But with the rise in value
per share of Coca-Cola, your position would now
be worth 1500 USD or 2001 Canadian dollar at the
initial conversion rate. However, due to the fact that the Canadian dollar
went up in value, this is actually detrimental to your gains on the
position because the relative value is worth less than at the
time of purchase. Even though the USD value is
now 1500 USD in canadian, this would now only be equal
to 1800 Canadian dollar, meaning your total
overall gain would only be 466 Canadian, instead of nearly $700, had the Canadian
value not changed. Finally, in scenario
for the value of Coca-Cola goes down
to $90 per share and the Canadian
dollar rises in value to a $1.20 Canadian
per each one USD. This would pretty much be the
worst possible combination of events and would
translate into a huge loss on both currency conversion
and value of equities. Once again, your
baseline costs for the ten shares of Coca-Cola was 1000 USD or 1334 Canadian. But what the value of each share dropping down to $90 a piece, this would mean your
total market value would now be worth 900 USD. When taking into consideration the new conversion rate
at a $1.20 per each USD. This would equal one hundred, ten hundred and eighty
dollars for a total loss of 254 Canadian dollars total. Alright, so what
should you do then as a Canadian investor if
you do want to gain exposure to the American
market and what are some factors that you
should consider here? Well, this really comes down to three main elements which are the future value of the
shares that you are looking to purchase for
this specific company, as well as the future currency
exchange rate between Canadian and US dollar or whatever other currency
you're looking to invest in. And then finally, the potential currency conversion fees at that most brokers are going to charge on your currency conversion. Then from there, all
you can really do is some basic math and a
little bit of speculation. With the first
element here being the future value of the shares for the companies you're
looking to invest in? Well, if you're
looking to invest in solid American companies, based on everything
that you're learning in this course on how
to analyze a company from both a technical as well
as qualitative standpoint for future growth in
value of these positions. Well, most likely these are going to be companies that are going to be appreciating
over the next 51015 years, even by roughly five to
around 15% annually, depending on the
companies in question. The next element to
consider is whether or not the Canadian dollar
is going to gain or lose relative value
in relation to the American dollar
over the period of time that you're holding
these American positions. And this is definitely the most difficult one
to predict here because macro-economic events
that have an impact on currency fluctuation can
really come out of nowhere, such as what we just experienced
in 2020, for example. Finally, the last
element that you need to consider here as
a Canadian buying American positions
trading in USD is the currency
conversion fees that most brokerages are going to charge on this type
of transaction, typically anywhere between 1.52% a currency conversion fee when you're going to
be purchasing and positions in a
foreign currency with your Canadian dollars depending on the size of your transactions and this can potentially
lead to hundreds or even thousands of dollars in fees over your
investment career. So definitely keep
that in mind as a result of the
above-mentioned factors I typically recommend to my students that
they stick with Canadian and listed
stocks and or purchase a variety of Canadian
listed exchange traded funds that happened to buy
and hold American physician. Because this allows you to have exposure to the
American market with a significantly less
fees as well as more diversification and no currency conversion
fees whatsoever. I personally believe
that there are tremendous opportunities
at this side of the border with
Canadian positions. But that's not to
say that I won't steal invest in
American companies, which I do all the time. So after you conduct the analysis of a specific
American company, it really just comes down
to a balance of, okay, how much do I think
this stock is going to appreciate over time? And what relative
impact do I think the currency fluctuation
is going to have with either chipping away at
my returns or having a positive effect on the returns of this
American physician. Every single company is
going to be different, but basically just learned to analyze companies
properly and then look at the overall impact
of based on where the currency conversion
rate is right now and the overall economy. How do I think that is going to impact my position over time? And at the end of the day, investing in American
positions is always going to be
beneficial because at the bottom line is that the American stock market is the best stock
market in the world. If you are really
adamant on wanting to buy a specific
American companies, however, you only have Canadian dollars to
start investing with. I would recommend that you do something called
the Norbert gambit, which we're going to
be speaking about in the next lecture. And this is a maneuver
where you're able to avoid a high conversion
fees associated with converting your Canadian to
US dollars and vice versa. This can all be done
with Quest trade, which is one of the
discount brokerages at that I recommend. And then we're going
to be speaking about in the next module. And last but not least,
and other type of financial security
that you could take advantage of is something called a currency hedged
exchange traded funds. So we already learned about what an ETF is it previously
in this course, but in currency hedge, ETF is essentially a type of ETF where you're able to gain advantage of the
actual price movements of the equities themselves. If, for example,
you're investing, let's say in a currency
hedged S&P 500 ETF. But the returns are not
going to be impacted by the price fluctuations between the Canadian and
American dollar. So essentially a currency has an ETF is going to
eliminate altogether both positive and negative
currency price fluctuations on the value of
your investments. For example, the Vanguard ETF, VSP is exactly this
for an S&P 500 ETF. Now, do keep in mind though
that with hedged ETFs, you're essentially making
a bet that the US dollar will weaken in relation
to the Canadian dollar. Because remember, if
the American dollar does it gain a relative
value right now, this is going to have
a positive impact on your investments in
American positions. And with that said,
the exact opposite has been the case for
most of our history. So unhedged is usually
the way to go with an ETF such as say via
V for the S&P 500. This wraps up the lecture on currency conversion and
how this has an impact on your investment
returns if you're investing in foreign securities. In the next lecture,
we'll be speaking about something called
the Norbert gambit, which is a maneuver where you can essentially convert your Canadian and funds into US
dollars and vice versa, without any conversion
fees associated with the transaction within
a question that account, if you're really serious
about wanting to buy American thoughts without
paying excess conversion fees.
34. Norbert's Gambit: Welcome to the seventh
lecture of module four, trading fees and taxation. In this lecture, we're
going to be speaking about a specific maneuver
that you can use as an investor in order to convert
a Canadian listed ETF in Canadian dollars into
a Canadian listed ETF in US dollars in order to save
yourself from paying a currency conversion fees at when you're looking to invest in a US positions as a Canadian investor who
only has Canadian dollars. And this is a strategy
called Norbert gambit that will be executing
in a separate account. The topics that
we'll be covering in this lecture include
the following. How to do a Norbert
Gambia to save on currency exchange fees followed
with in which account, uh, should you perform
a Norbert gambit? Alright, so first of all, why would someone
want to execute a no-risk gambit anyways, in order to trade
on conversion fees. Well, quite simply, most
awkward packages are going to charge
anywhere from 1.5 to around 3% conversion
fee on top of the baseline conversion
rate just to convert to your funds from canadian to
US dollars or vice versa. For example, if you're
looking to convert a 5 thousand Canadian dollars into American dollars, well, at a 3% conversion fee, this would represent $150 simply for converting
your money. And this is something
that most investors typically wanted to try to avoid because it can severely impact your overall returns
on investment. This strategy called
a Norbert gambit. You're essentially
looking to convert a Canadian listed ETF in
Canadian dollars into a Canadian listed American
ETF that happens to be trading in US dollars at
the exact conversion rate, which is going to allow you to save on it that conversion fee. I personally use quests rate
to execute this strategy because with quests rate
and buying ETFs is free, there is no actual commission associated with buying ETFs. So the only fee you are
going to be paying here is a fee on selling
your American ETFs after the conversion is
actually completed and this is going to be $4.95 USD. It well-worth it in order to save hundreds of dollars
on conversion Vz. Now, before we actually get into the meat of how to
execute this trade, I do want to mention that
in orbit gambit can be executed in a TFS, a and RSP, or even a cash margin
account because all of these accounts can
be held in US dollars. Alright, so with that said,
once you've opened up your account in which
we are going to be doing together in
the sixth module. And you funded your account
with Canadian dollar and go ahead and purchase shares
of the horizons ETF, DLR dot TO in Canadian dollars for the amount that you're looking to convert. For example, if you're
looking to convert, say, 5 thousand Canadian dollars
into American dollars. Well, at the current time that
I'm filming this lecture, One share of DLR Dato is trading
at a rate around $13.49. So at 5 thousand
Canadian dollars that you would
purchase right around 370 shares of this ETF once your order for DLR dot TO has actually settled
in your account, which should take anywhere from a couple of seconds
to a couple of minutes depending on the
order type that you executed. Then the next step is
actually calling up quests, read and requesting that
the convert your shares of DLR dot TO into
shares of DLR.edu.TO, which is the American
dollar equivalent of the DLR dot TO stock. By doing this, you're
essentially converting your DSLR dot TO shares
in Canadian dollars into DLR dot u dot TO shares in American dollars for no
added v. By the way, if you don't feel comfortable
calling up quester AD, you can also do this
through e-mail or through chat within
your client portal. Once you're done asking
question eight to do this, which is actually called
it the journaling process. It'll usually take anywhere from around three to
four business days in order for the
transaction to settle. At which point you
will then have shares of DLR.edu.TO which trades in American
dollars and you can sell the shares for American
dollars in your account. Again, the only
feeling Curie here is an ETF sell order for $4.95, which is extremely minimal
compared to the hundreds, if not thousands of
dollars that you're saving in a currency conversion
fees from this point on, you will now have a liquid at
USD within your account and that you can go ahead and
purchase US listed stocks. Etfs reads whatever
financial securities that you want and you're
not going to incur any additional fees other than the typical commission
fees for trade orders. And by the way, if you
ever want to reconvert your American dollars back
into Canadian dollars, you can do so following
the exact same steps in reverse order of going
ahead and purchasing DLR.edu.TO shares and then
asking questions related to journal them over to DLR dot TO shares in
Canadian dollars. Now, just for your
added information here, the reason why we
wouldn't be using the DLR and a DLR dot you
ETFs in order to execute a Norbert gambit
is because of both of these ETFs are what's
known as currency ETFs. And in this case, these
two perfectly matched the currency conversion
rate between a Canadian and American
dollars casing point. If we look at both prices
of these ETFs and look at the current conversion rate between American and
Canadian dollars, it perfectly matches up. Now theoretically you could use this maneuver with any
dual listed position, but you do run the risk
of the actual equity of the stalk fluctuating in addition to the currency
rate fluctuation. So it's not as risk averse. And this is why we will be using the DLR ETFs for the
Norbert gambit because this only takes into account
currency fluctuation and not any fluctuation of
the actual equity price. We know understand and
what this strategy is, why it's beneficial
and how we can do this in your own
investment account. But let's now speak
about why you should first do this in a
registered account. Before doing so in a
cash margin account, as we learned in the
previous lectures, a registered accounts
such as the EFSA and the RSP here in Canada come with
tax sheltering benefits. And the same is true here
in regards to the gambit. The reason for this is
because during that three to four business
days settling period after you've called up your
brokerage in order for them to actually execute the
journaling process. Theoretically speaking,
there could be a fluctuation between USD and Canadian and thus triggering a capital gain or capital
loss on the investment. So if this maneuver was
done in a cash account, theoretically
speaking, you would have a capital gain
that was triggered. And for this reason
you would have to pay taxes on this difference, even though it's a very
small capital gain. And the same thing would be
true for a capital loss. However, you can avoid this altogether by doing the gambit in a registered accounts
such as the EFSA or the RSP, you wouldn't have to worry about this whatsoever for this reason, I would first recommend
that once again, and you do this in your
registered accounts before venturing on
into cash accounts in any ways based on
everything we just spoke about in a previous
lectures and modules, you're going to want
to start investing in your EFSA anyways, because this always makes more fiscal sense from
a tax perspective. All right, so this wraps up the seventh lecture of this module and actually wraps up the
entire module as a whole. In the next module, we're
actually going to be diving into identifying your very
own investor profile, which is going to
be important for the seventh module where
you're going to be constructing your own portfolio
with ETFs and stalks. And based on this
investor profile and subsequently a proper
asset allocation.
35. Dollar Cost Averaging: Welcome to the second
lecture of the fifth module. In this lecture, we're
going to be speaking about what dollar cost
averaging is and how combined with
patients over time, these factors are going to have a tremendous impact on the
growth of your portfolio. Dollar cost averaging
in combination with compound interests from
recurring deposit into your stock market
portfolio is one of the main critical
factors contributing to the overall long-term
appreciation year-over-year of your portfolio while reducing
risk and volatility levels. So let's speak about
what dollar cost averaging even is
in the first place. The topics we'll be covering in this lecture include
the following. What is dollar cost averaging followed with how to benefit from dollar cost averaging in order to build wealth over time. First of all, dollar
cost averaging is a strategy utilized
by investors who are looking to grow the value of their investments over
time by deploying chunks of capital into a certain assets such as
a stalk of fund and ETF, and basically any type
of financial asset within your portfolio
in order to spread out the cost basis of that
given security and therefore reducing the overall volatility
of this position. This strategy allows
investors to deploy capital at various different price
points for a given security. Instead of trying to
accurately time the market at the best possible
moment in order to deploy a larger
amount of capital, which has proven to
be nearly impossible to accomplish
consistently anyways, dollar cost averaging is quite simple and the strategy
revolves around the idea that by purchasing a given security at various
different price points, you're able to reduce the overall average cost
basis of that position, meaning the average
cost for which you purchased that given security. So you're going
to be bringing it back to an average level instead of having just one
single price point with it, the entirety of your capital deployed for that one position. For example, if you purchased a sixth shares of
the S&P 500 ETF, Vf v2 shares at $9 a piece
or two shares at $10.2, shares at $11 a piece, or your average cost
basis would be $10. Now, the most common
and beneficial use for a dollar cost averaging is through the purchasing
of exchange traded funds in a hands-off
passive ETF portfolio where regardless of the
price per each month, when you contribute
to your portfolio, your purchasing a position within that same ETF in order to average out the
overall cost basis of your purchase price, as spoken about earlier on in this course when
speaking about ETFs. And we're going to be digging
into what core ETFs are further in this course in
the sixth module, however, the idea here is
that spreading out the overall cost basis of
purchasing multiple ETFs at various price points
through dollar cost averaging on a monthly basis when you
contribute to your portfolio. Or it could be on
a bi-weekly basis, whatever contribution of
frequency works for you. Well, this is lowering the
cost basis as well as lowering the volatility and avoiding
massive price movements, both positive and negative
of your overall returns. So this is going to smooth
out your returns to a nice steady appreciation year over year dollar cost averaging
your investment purchases is one of the simplest ways to maintain steady growth
and appreciation of the value of your
holdings and subsequently your portfolio for
the long term, which for everyone
watching this right now, is what you're going
to try to achieve long-term growth of your wealth and your stock market portfolio. With that said, the
general idea here behind this strategy of dollar cost
averaging is that you're going to increase the
overall appreciation of your portfolio and the positions within
your portfolio, rather than if you were
trying to accurately timed the market and get in at the
most opportune price point, which again has been proven
to almost be impossible to do on a consistent
basis time and time again, this is the main
reason why earlier I mentioned that
dollar cost averaging can be utilized with purchasing individual stocks,
individual rates, etc. But it's most beneficial
in my opinion, with broad market ETFs that
are going to really diversify your holdings by purchasing one single security
that holds multiple, if not hundreds, of positions
of quality companies. If you're actually buying a quality broad market
ETFs like a nasdaq 100, S&P 500, it total US
market, TSX, 60, etc. You get the point here
at these types of quality broad market index
ETFs are consistently going to provide
your portfolio with that steady increase in
appreciation year-over-year. Don't get me wrong.
Adult learner cost averaging on
individual stocks or other individual
financial securities can also be highly beneficial. It requires significantly
more research in order to be successful and yield
a nice results for you. Because in contrast to
deploying this strategy on broad market index funds,
that generally speaking, you're going to be buying and holding for anywhere
from 152030, maybe even 40 years and dollar cost averaging over
that period of time. Well, with individual stocks
and generally speaking, you're not going to be holding
onto positions as long as a broad market ETF that serves as the
foundation layer. Of the growth and appreciation
of your portfolio. Let's take a look at an
example of how dollar cost averaging words with a
theoretical position. Say you started
depositing $1000 into your investment
portfolio each and every month and you are
purchasing one hundred, ten hundred dollars
worth of an S&P 500 ETF, which naturally will
go up and down in value each month that
you're investing. Well, let's assume that
over the four month period, the price of this ETF
varies from $10 in month, $150 in month 2, $13 in month three, and then finally
$17 in month four. If you still invested $1000 into the fund
each month while you're buying power would fluctuate as the price
of the stock fluctuates. Also, in month one, you would be able
to buy 100 shares. In month two, you'd
be able to buy roughly 66 shares in
month 376.9 shares, that will round up to 77. And in month 458.8
shares for a total of 302.36 shares purchased with the $4 thousand of contributed
capital invested, $4 thousand would
have also turned into $5,140.12 based on
the latest price of $17 per share and the average price of
the shares purchased, it would be $13.23. Now if you would've
invested all of your $4 thousand in either of
the individual months, this would have resulted in
a higher or lower return, but the volatility and risk level would have
been much higher. So this is the reason why dollar cost averaging is a
great way to reduce risk and create a safer strategy for obtaining a more favorable
average price point, especially if you're
investing for the long term. Alright, so with everything
that we've just covered it, keep in mind moving forward that dollar cost averaging
is best utilized as an investment strategy
for long-term investing with passively managed
exchange traded funds. Luckily, these are two
elements that we focused on tremendously in this
investing course that you should be
utilizing also when constructing your portfolio
for long-term investing, a dollar cost averaging works perfectly with this
overall strategy, regardless of which
individual ETFs you choose to include
in your portfolio. In order to fully benefit
from dollar cost averaging, you're going to need to develop a solid investment strategy and continuously contribute to your portfolio on
a continuous basis and purchase these
investments regardless of the short-term
price fluctuations in the market in order to fully benefit from getting in on these positions at
various price points, lowering your overall cost basis and volatility level with enough consistency and at
time on your side to allow your investments to mature
with your portfolio, the dollar cost
averaging strategy is going to reflect the higher-end, a lower price points that you paid for each one of
your investments.
36. How To Approach Market Corrections: Welcome to the third lecture
of the fifth module. In this lecture, we're
going to be speaking about how different market
cycles can impact your returns as an
investor who's looking to stay invested for a
given period of time. And what the most
opportune moment to get in on a position is when you're looking to invest in long-term for increased
at return on investments. The topics we'll be covering in this lecture include
the following. What is a market cycle
including bear markets versus boom markets are followed with winning investor
psychology and behavior. And then we'll end
this lecture with how this ties back to
your investing. First and foremost, we need
to properly understand what a market cycle even is because over your
investing career, you are going to be experiencing multiple different
market cycles. And so knowing how
to properly approach each one is critical
for long-term success. A market cycle,
which in regards to the stock market
specifically can also be called a stock market cycle is going to be an overall trend in asset prices relating to what's going
on in the market, relating to
macro-economic events as well as a business
environments. Now keep in mind that
there are market cycles in various different asset
classes altogether. For example, a stocks,
real estate, etc, or even specific
industries or sub facets, the assets within larger groups. For example, the tech industry can go through various
different market cycles. And this is one single industry
within stocks as a whole, depending on the stage of the
market cycle in question, a certain asset classes or industries will
react differently to the current market realities is for this reason
that, for example, the stock market
will typically go through an app or
a downmarket at a staggered timeframe than those same market
trends for real estate. Now, what I want to focus
on specifically here is what's called a bull
and a bear market. And these are terms that you're going to be hearing it quite often when interacting in
the investing community. These terms are actually quite
simple to understand and relate directly to
stock market cycle. So let's define each
one of them right now, a bull market is a term
used to refer to a market that is training green in a positive economic environment, meaning that this market in
question is gaining value. For example, the
periods ranging from around a 2009 at the bottom of the 2008 market crash
all the way up to around 2019 was referred to
as a boom market, where the stock
market was trending green for an extended
period of time. You can also deem
individuals thought patterns as being
bullish in that the stock in question
is positively trending or is set
to gain some value. For example, you might
hear an investor say, I'm very bullish
on this thought. This means that they're
expecting that stalking question to gain value over
the upcoming period. Now, typically speaking,
and during a bull market, there's going to be a higher
level of investors who are looking to purchase equities
or other securities. And so for this reason, due to the higher demand and lowered or stabilized supply, this has an impact on raising the market value of these
equities in question. So with that said, keep in mind that an extended period of market appreciation
is referred to as a bull market and as
a long-term investor. And this is really
where you're going to make the bulk of your returns. On the flip side,
a bear market is a market environment where
investor optimism is very low and there's an
extended period of a market decline in meaning
that assets are losing value. Typically a bear
market environment is created when the
stock market loses 20% or more of its value from the peak evaluations
during a market high. With this in mind,
during a bear market, there's a higher
level of supply for securities or other
financial assets and then there is demand. And for this reason, it says the impact of a
lowered asset prices. The most recent
bear market was as a result of the
coronavirus pandemic, where the S&P 500 a shaved off more than 30% of its value in only around
a one-month time, a bear market can create a more volatile investing
environment though, because investor emotions
are all over the place and so trading has less
rational thinking behind it. With this in mind that
during a bear market there's a higher
level of supply for securities and other
financial assets because investors are
offloading their positions, which has the impact
of Lord asset prices. Now, just because a market is
trending downwards though, does not inherently
mean that we're entering a bear
market territory. In fact, it's
completely normal for the market to
fluctuate up and down depending on so many factors relating to economic trends in general or more tailored information about specific
accompanies in industries, like we learned earlier on
in the course relating to qualitative and
quantitative factors for individual companies
and positions. When a market as a whole, an industry or even an
individual position and goes down but less than 20%. And this is referred to in
the investing community as a correction. And it's during these periods
of market corrections or days when the market
is trending downwards, that you should be looking
to take a position on a given stocks or ETFs
that you're interested in for a long-term appreciation because you're
effectively going to be lowering your overall cost
basis on those positions. I hope you know
better understand what both bull and bear markets even are and how this applies
to everyday investing. Chances are, you've
heard the expression and buy low, sell high, and in relation to making
money with investments, this seems pretty evident,
however, in reality, this is rarely achieved with a new retail investors
because emotions are running high and usually what ends up
happening is it relatively new retail investors
are going to be buying high and selling low. The reason for this is
that it's very easy to get caught up in emotions in regards to short-term
fluctuations of the overall value of your portfolio and
your positions as it inevitably rights
through a market cycles, it's completely
normal as an investor to be on a higher when
your investments are rallying and wanting to hold
onto those investments in order to squeeze out every
last little drop of return. And then on the flip side, would be scared or worried
when your portfolio is riding through a correction
or even more severely, a bear market
leading you to maybe considering a
cutting your losses. And this is exactly how novice investors react to various
different market cycles, especially when you haven't
been investing all that long. So it's something I want
you to avoid at all costs, especially if you're
going to be investing long-term as you're
learning in this course. Because the reality
is that for most of these positions that you're
going to be investing in, you've already done
your due diligence and you know that the reason
why you invested in it is because you see
potential in the company long-term for steady
growth and appreciation, It's absolutely inevitable that you will experience
both bear and bull markets as well as short-term rallies and
short-term corrections. And I want you to be ready for both scenarios and know
how to properly react. Because you've taken the
time to actually go through this course and realize
that market corrections, both large and small, are actually opportunities
to lower your cost basis on your investments and create significantly more wealth over the course of your
investing career. And always remember that the true potential upside for a given stock
ETF or whatever other asset you purchase is really going to be
determined on the buy-in price that you have
for that specific assets. What I mean by this
is even though, let's say Tesla will
most likely become a $3 thousand stalk in the coming five to
ten years or so, an investor who bought shares at $500 is going to
generate a return far greater than investor who gets in as say, $1500 per share. And I know this seems pretty obvious now that I'm
saying it, I know, but it's actually not as
obvious as you might think when you're presented with the
situation in front of you, of the position and going
down in value, maybe 1015, 20% In the short-term
and holding on because you have a long-term
strategy with a given stock. Over and over again, I see new investors buying
when a specific stock or the market in general
is really hot out of fear of missing out
on nice returns. And then on the flip side, they sell at a loss when the position or the
market is experiencing a small correction because it's normal human psychology
to be risk averse, however, in regards
to investments, you have to approach it
in the opposite manner. And as a side note,
everything I just mentioned here in
regards to buying in at an optimal price point for long-term appreciation and gains on an asset is going to apply to all different types
of assets as well, including, for
example, your house. If you buy your house in an op market when the
prices are extremely high, we'll long-term the
appreciation you're able to squeeze out
of that investment is typically going to
be significantly lower than someone who bought their house at 20 to
30% under market value. Now, to tie this back
to the stock market, let's look at a 50-year
historical chart of the S&P 500 to see what type of price movements
we've seen in relation to market cycles during
this period of time, we've obviously seen both
bull and bear markets, which again is completely
normal and healthy to experience on a shorter
30 year timeframe though, we can see that regardless of the bear markets
experienced both in two thousand and two
thousand eight staying invested for the long-term
in a broad market ETF, such as this one,
which is the S&P 500, would have produced a
significantly higher returns. And keep in mind
that this chart is just the actual price point of the market and
moving over time. And this does not showcase
compound interests. If you held your investment over this entire 30-year period
due to compound interests, your returns would be
exponentially higher. In addition to this,
a bear markets typically do not last nearly as long as bull markets do as depicted from this
graph right here. The general point that
I'm trying to get you to understand is that when
investing for the long term, you're going to be experiencing both bear and bull markets. We've actually just experienced
the longest boom market in history from 2009
to around 2019, with the quickest bear market in history resulting
from the coronavirus. And this is actually what I want to focus in on to
give you an example of how powerful the concept of investing and during
down markets truly is, even though it can be
difficult to actually put in practice when faced
with the situation. So with that said
in the big picture, keep in mind that in market
corrections are in fact opportunities to lower
the overall cost basis on your positions in your overall portfolio
don't fall victim of thinking that markets
are not going to eventually recover because
they will overtime. Let's now move down
this philosophy to our everyday
investing though, because chances are that
after taking this course, you're going to
be more active in the market and are
looking to invest at more actively and looking
to buy in on positions at different price points and
on different time frames. Just like in the
larger picture here, where a market
corrections are in fact, opportunities to lower
your overall cost basis on a more daily basis. I never purchase stocks on days when the market
is trend in green, I only purchase thoughts, ETS, and other investments when
the market is trending. Read for that given
training day. This is because if
I'm interested in purchasing a given stock or ETF, Well, I've already done my due diligence in
the first place, so I know that over the period of time that I'm looking
to hold this stalk or other position is going to be a winning position
that most likely. So why not try to
shave off a couple of percent on the
buying price by purchasing the stock or ETF on a day at when it's
actually lost some value. This is something that
I've personally been doing for years now
and should also be something yet
you're doing of buying stocks only on days
when the market is red. All right, so this wraps up
the lecture on market cycles. And in this quick
module as a whole, in the upcoming module, we're actually
going to be diving into setting up your
brokerage account, as well as the creation
of your portfolio.
37. Registered vs Non-Registered Accounts: Welcome to the second
lecture of the sixth module. In this lecture, we're going
to actually be selecting the specific account type for
your needs as an investor. And now that you
properly understand what each account type it does
and what they're used for. As we learned in a
previous modules, the topics we'll be covering in this lecture include
the following. Registered versus
non-registered account. Followed with which account is specifically should you open
when you're a new investor? Alright, so we've already
learned all about the different investment
accounts that are available to you as
a Canadian investor, including a registered versus
non-registered account. And the difference between each. But now that we're at the stage where you're
actually going to be opening up your own
a brokerage account and starting to invest. Let's actually recap. Uh, which account would
be best for you to start investing with
as a new investor? First of all, I
always recommend that pretty much all in
new investors as start investing in the
tax-free savings account and mostly attributed to taxation purposes
as well as piece of mine at for the growth
of your investments. First of all, depending
on your current age and the year that you
turn 18 years old, it chances are that
you already have a contribution room
that's waiting for you, ready to start investing
with this contribution room, as we learned early on in
the course, is cumulative. So whatever contribution
room that you have available right now is yours to
start investing with. This is a huge first advantage
of starting to invest in the tax-free savings account because all your
dividend income, as well as the appreciation in value of your
investments is going to grow at a tax-free basis over the course of your
investing in the EFSA. For this reason, I
always recommend that new investors as start
investing in ATF essay. And then once you've kept out your total contribution room, you can then transition over into the other
registered account, which is going to
be a registered or retirement savings program, our RSP for short, if this fits within
your overall taxation and investment strategy. And then from there,
once you've kept out your contribution room for
both registered accounts, you can then
transition over into a cash margin account for your
overall general investing. Now the reason why I
recommend starting to invest in the EFSA over the RSP, even though these are
both registered accounts that have a tax
advantage to them, is because the RSP, even though it's going
to allow you to reduce your overall taxable
income and therefore your marginal tax rate
could be lower, thus, saving you from paying higher income taxes in a given year will
keep in mind that, that you can't actually withdraw from your RSP until retirement. And if you choose to do so, you will incur a
penalty for doing so. So that's the reason why even though in a long-term strategy, investing in an RSP
is very important, I recommend doing so
after capping out your contribution room
in your TFS, personally, what I always do here
is first and foremost, I can attribute it that extra
6 thousand or so dollars in contribution room
to my TFS H here. And then following
that, I'll usually contribute an amount to my RSP, which will lower me from a one marginal tax bracket in order to pay
significantly last tax. What I meant earlier
when referring to peace of mind when investing in its EFSA is that when investing in each
cash margin account, as we learned earlier
on in this course, we'll all your dividend
income as willing to, your capital gains
are obviously going to be taxed at their
respective tax rate. So this is also
something that you need to actively keep track of and submit at the
end of the year that's paying the
proper amount of taxes. Otherwise, this CRA could
come after you if we're not declaring your dividend income and your capital gains income. So basically you went investing in the tax-free savings account. You can pretty much
just invest over time, contribute each and every month, and not worry about
having to pay tax on any of your investments. With that said though,
you're most likely going to quickly max out your
TFS a contribution room so it makes sure
that you properly understand all the taxation
that we spoke about earlier on in this
course in regards to a cash margin account
so that you can make sure to properly pay all the taxes that are due
on your investment income. This, it was a really
quick lecture, but bottom line
here is start with maxing out your TFS,
a contribution room. And then once this
is accomplished, you can venture on
into investing in a cash margin account
or even an RR SP, if this fits within your
overall taxation strategy. And if you're confused
with all of this, I would recommend speaking with your CPA about contributing
to your RSP and lowering your overall
taxable income to maybe lower your income
into a lower tax bracket.
38. Determining Your Investor Profile: Welcome to the first lecture
of the fifth module, where in this module we're
going to be constructing your overall investing
plan and strategy based on your answers to a variety of screening
questions related to your personal finances as well as your personal situation. And then we're also going to be learning about a variety of investing concepts
in order to keep you on track with achieving
your investment goals. This module, along
with the next one, are definitely my
favorite because these modules actually
focus on you as the investor where we're
going to be constructing your very own portfolio based
on your investor profile. Now that you have a
strong understanding and knowledge of how
the stock market works, in this first lecture
of the module, you're going to be running
through a variety of screening questions in a
questionnaire that I've attached it down below to this lecture in
order to determine your overall goals as
an investor and then define your proper
asset allocation. The first thing you'll
need to determine it when looking to craft your own stock market portfolio is going to be your
investor profile, which I've mentioned
throughout this course. Now what I mean by
investor profile is that each individual is going
to need to approach the construction of their
portfolio in differently based on their overall goals
and needs as an investor, as well as a variety of
other criteria that you're going to be identifying in
the overall questionnaire. This is because your
investor profile is going to greatly
influence which stalks and funds
you actually end up putting into your
investment portfolio, as well as the weights associated with each
one of your positions. Generally speaking, what I recommend my
students and viewers focus on when first getting
into stock market investing. Is it creating a
portfolio that will serve as a growing
investment nest egg for the long-term before
venturing out and exploring a higher-risk
stocks and positions. Once you actually have a more experienced
and you feel more comfortable with investing
into higher risk assets. This is a strategy
that I've personally used over the years
and will allow you to build a foundation for the growth of your wealth
over time before you actually venture out and explore higher-risk opportunities
without the proper experience. Thus a jeopardizing
the money that you had to start investing
with in the first place. With that said,
depending on your age, investment horizon
at risk tolerance and a variety of other factors. This is going to determine which stocks and funds
you choose to include in your portfolio and severely impact the weight
associated with each one. The question do we answering in the questionnaire are meant to highlight your current personal
and financial situation, your investment objectives
and risk tolerance, as well as your level of investment experience
and knowledge. This exercise might
seem somewhat basic and the questions aren't
anything very demanding, but these questions are
going to allow you to reflect on various different
aspects in your life, your finances, and what type of securities you're
most interested in. The document we're
looking at right now is attached to this
lecture that you can download and answer
for yourself in either Word or whatever
other platform you use. And I'd recommend that
you actually keep this filled out document to
refer back to it later, because investing is
evergreen and you may want to change your
answers as time goes on. Once this is done,
each question will have a value associated
to it that you will have to add up altogether
in order to determine the investor profile that
best suits your answers. So make sure to try and
respond as accurately as possible based on
the answers that you provided in the
short questionnaire. And you're now able to
more accurately determine which investor profile
best suits your needs. And then subsequently attached
to the investor profiles, which asset allocation is best going to suit your
needs as an investor. I do also want to
mention that the results of this quiz are super evergreen and in no way should
the results be interpreted as
being set in stone. Rather, it's just a
way to get your juices flowing and understand how
different criteria and scenarios can impact
how you're going to allocate your funds
within your portfolio. For this introductory course
to stock market investing, I've split up the different
investor profiles into four main categories
with each one representing a different
asset allocation, meaning the percentage of your portfolio that
you'll be investing into fixed income positions
and the percentage that you'll be investing
into equity positions. The first investor profile
is the aggressive portfolio, which comes with higher risk and a longer time horizon,
Generally speaking, which comes with a 15% of
fixed income position and eighty-five percent
equity position for an average annual
appreciation of around eight to 12% per year. The second investor
profile is what I would call it the moderately
aggressive portfolio, which is best for high
to medium risk as well as long or medium-term
investment horizons. This portfolio allocation is twenty-five percent
fixed income and then 75% equity positions for a typically an average of seven to 10%
appreciation per year. Moving on, we have the
third investor profile, which is called the moderately
conservative portfolio, which is best for
medium-risk and then medium to short-term
investment horizons, which is going to
be comprised of 40% fixed income and then 60% equities with an average of around five to 7%
appreciation per year. And finally, the last
investor profile that I've identified at for this stock market
investing course is the conservative portfolio, which is best for lower
to medium risk as well as medium to short-term
investment horizons. And I've put this at
50% fixed income and then 50% equities with a higher focus on a blue
chip dividend stocks. Generally speaking,
I tend to recommend that younger investor
as being more risk tolerant width at their
investment portfolios at due to a couple of factors. First of all, if you're
a younger investors, say Under Thirty-five years old. While the reality
is that you have a much longer investment horizon ahead of you to stay invested. Therefore, a grow
your nest egg and portfolio value over time
while allowing you to have enough time
to write through inevitable market corrections
and even market crashes. Now that really only applies
though if you do end up staying invested for ID
minimum at ten years, preferably more because
for a portfolio that's more heavily weighted
towards equity positions, the reality is that
it will be more volatile in a shorter timeframe. So just remember here that a higher risk tolerance
in your portfolio, meaning a larger percentage
being allocated to equity positions typically will come with higher
appreciation levels. However, higher risk
tolerance should also be accompanied with a longer
investment horizon. Based on this logic, if
you're someone who's saved 45 years old
and you're looking to invest for retirement
that's in at ten to 15 years,
let's say, Well, even if you have a
higher risk tolerance, you might want to
adjust your portfolio to be a bit less weighted towards equities than at
someone who's 25 years old. And he's really
going to look for a 9010 split on equities
to fixed income due to the fact that
your investment horizon is only like ten to 15 years. Now I want to wrap
up this lecture by explaining that it's
completely normal and expected for your goals
and investor profile to evolve and change over time
as your circumstances change. For example, you might be
30 years old right now. And for this reason
your investment horizon is longer and you have a higher tolerance to risk and volatility within
your portfolio. But 1015 years down the line, this reality might
change where you're looking to allocate a
higher percentage of your portfolio to fixed income or other more secure
asset causes. The final point
I'm trying to make here is that you
should construct your stock market portfolio
throughout this course to fit your needs and
realities right now, however, you should re-evaluate these needs and goals every say, five to ten years in order to make the
appropriate shifts. This type of
investment behavior is ultimately what's
going to allow you to adapt your financial plan over time to best suit your needs.
39. Selecting right broker: Welcome to the sixth module
of the investing course. This module is by far the most exciting because
now that you have the proper knowledge about
how the stock market works and what your
investor profile is. We're actually going to be constructing your
very own portfolio. In this first lecture
of the module, we're going to be going over the features and
functionalities of the two discount brokerages
that I personally recommend. And we're going to be
determining a which one is best for your
needs as an investor. And then following that
in the two next lectures, we'll actually be doing
a full walk-throughs of each of these two
discount brokerages. Once you're all set up with your brand new brokerage account, we're actually going to
be tapping back into all the knowledge
and information that we learned
previously in the course. Specifically your
investor profile and the asset allocation
that you're going to be using in order to create your portfolio with
stocks and ETFs mainly, I'm really excited to get through this module
with you where at the annual actually have
your very own portfolio. So in this lecture, once again, we're going to be determining the right stock brokerage
for your needs. So let's get right into it. The topics we'll be covering in this lecture include
the following. Why choose a discount brokerage in the first place over say, a large bank brokerage followed with features and functionality. And then finally, we'll be going over well, simple trades, features and
functionalities before diving into the features and functionalities of each of the two discount brokerages that we're featuring
in this course, unless actually first
speak about why utilizing a discount brokerage is
beneficial in my opinion, over utilizing a brokerage
account from your bank. If you remember in
the fourth lecture, we spoke about all the fees
associated with maintaining an account as well as a commission fees
on a trade orders. So over time, these fees
can really add up over the 5102030 years that you're investing on each one of
your buy and sell orders. So minimizing fees as much as possible is going to be one of the main reasons why using a discount brokerage
is beneficial. Overusing a brokerage from one of the big
banks, for example, a TD web broker charges a twenty-five dollar
quarterly fee for maintenance of your account
if the account value is below $15 thousand and they
also charge a flat and $9.99 fee for all
buy and sell orders. So this is something
that I want you to minimize as much as possible, avoiding paying access
fees on your investments. Now keep in mind
that every brokers is going to have a
various features, functionalities,
and fee structures. However, in my
personal experience, having used over five
different brokerages online, in my opinion, quests
read and well, simple trade are really
just the best options all around for low fees as well as features
and functionalities, which once again, we'll be
getting into in this lecture. The first discount
brokerage that I personally use and would recommend is most likely one
than you've heard of before, and it is called the quest raid. This is one of Canada's most popular discount
online brokerages because it's simple to use, offers a great pricing and has good stock research
functionality built right into the platform
free of charge. So let's run through
the features of fees, pros and cons and other
relevant information. First off, a question that is a Canadian at discount
online brokerage. So you will be able to open all the account types that we've already mentioned
in this course, as well as a variety of others. They offer the T FSA or
RSP cash margin accounts are ESPs and even corporate accounts
for our needs though the TFS or RSP and margin
accounts are perfect. And just for your information
within a sequestrated, they call atypical cash account a margin account less than that. Take a look at what
you can expect from Quest read in regards
to their fee structure, stock trades work on a per share fee of $0.01
per share at a minimum of $4.95 and go up to
a maximum of $9.95. So you're essentially always
paying a commission in between $4.95 and at $9.95, which is decent pricing
for online brokerages that offer the level of tools
that question does, as we'll be diving into shortly, the next most
popular asset class which will be utilizing in the construction
of our portfolios are ETFs exchange traded funds, which you can actually buy
for free, unquestioned. So there's no commission
of the purchasing of ETS. But be aware that when
going to sell ETFs, you will incur this same
$0.01 per share fee, once again, between 4.959.95, which really isn't all
that bad in my opinion, considering that other
comparable brokerages charge up to $10 flat fee on
all trades regardless of the size and the asset
in question with the basic investor
plan that most of you will be opening when
first starting out. You'll also gain
access to the novice traders market data
package where you can see all the real-time level
one market data coming through for an accurate pricing of securities in real-time, having extremely accurate
and market data and price points is obviously something that's
extremely nice to have, but is more important
for day trading, which for us in this course isn't necessarily
something we're all about. However, the fact
that it's built into history for free is
a very nice feature. What I personally like
about Quest trade is that their platform
is quite complete and offers a good level
of detail about your holdings and the breakdown of your holdings per account. It also has a very detailed research functionalities
offered by Morningstar that we'll
be discussing in the full platform walk-through
in the next lecture. If you think a question
it is right for you, you can either click the
link down below to get $50 in free trades when you
first open up your account, or you can wait to see the
full walk-through before making your decision in
a couple of lectures. Well now we're diving into the second discount brokerage that I personally use and recommend at which is
it Well, simple traded. This is a completely
different type of brokerage platform, but might be of interest to you depending on your preferences. Unlike Western, which is a
desktop first, uh, well, simple trade is currently a mobile only discount
brokerage platform, even though they do
have plans of extending their service into a
desktop application, the best feature of well, simple trade is the fact
that they allow you to trade stocks and ETFs completely
commissioned free, unlike other platforms
such as TD web broker, for example, which charge
you a $9.99 commission fee on buy and sell
orders at this app will not charge you a
penny for doing so. It is extremely similar to the popular American
platforms such as Weibull, Robin Hood, as well
as M1 finance. In terms of fees associated
with wealth symbol trade, there were absolutely no fees
associated with opening and maintaining your account and trades on Canadian securities, both stocks and ETFs is also completely
commissioned free. That said, when you do
purchase American stocks, you will be charged
a conversion fee of 1.5% above the actual
conversion rate. And that is where they make
their money because you can't currently hold a USD in your
wealth simple treat account. Another thing to mention is
that unlike with Quest trade, you can't do a Norbert gambit
to save on exchange fees because you can't hold USD in the account
as of right now. You can buy and
sell common stocks exchange traded funds and a real estate investment
trusts that are listed on the New York
Stock Exchange, nasdaq, TSX and TSX v. Hopefully
in the future they will include other stocks
that trade on exchanges such as the
Canadian Securities Exchange. In addition to this,
only stocks that have an average volume of
above 50 thousand shares daily with a 52-week
high of at least $0.50 will be eligible to
be treated on the platform. So pretty much any
stocks that you could possibly want
to purchase in Canada or the United
States will be available to find on
Wilson book trade. But if you're looking
to buy penny stocks, which I wouldn't recommend at this stage of your
investment in any ways, but that wouldn't be an option. Now the best thing that
is going for, well, symbol trade is that they offer completely commissioned
free trading, which I will concede
is a great advantage. But here are a couple of things that do make well simple trade, less functional than quest read that you'll want
to keep in mind. There is no research
functionality at all. So you'll need to use other platforms to do your research. And for this reason, I actually recommend that my viewers and a student's open, both a quest trade and a well simple treat
account in order to get the best of both worlds, your portfolio is also not well displayed in
regards to say, a pie chart and
account breakdown, you cannot hold USD
in the account. It currently it is mobile only. And finally, another
disadvantage of Wilson will trade is that you don't have that truly
up-to-date market data. So prices are all
15 minutes delayed. This pretty well
wraps up the lectures on the features and fees associated with both sequestrated and well
symbol trade accounts. Now, I don't expect you
to make your decision and just yet on which one
you're leaning towards, it makes sure to wait for the full walk-throughs
that we're going to be doing in the
two next lectures before making your decision. But once again,
I'll reiterate here that I personally
recommend that most of my viewers and students both a well simple trade and sequestered
account in order to really get the best of both
the research functionality of quests rate and the commission free trading of
weld symbol trade.
40. Asset Allocation Based On Investor Profile: Welcome to the fifth
lecture of module six. In this lecture, we're going
to be speaking about what the asset allocation of
your portfolio could look like based on the
investor profile that you are now able to determine
in the fifth module. At this point, you should have a crystal clear picture of what your time horizon is it
your goals as an investor, as well as how risk tolerant you are and
at the answers to all the other questions
that you use in order to determine that
your investor profile, which ultimately is
going to dictate what the portfolio construction
could potentially look like. The reason why this
is so important is because before we
actually go about choosing which
ETFs and stocks to either your portfolio if you want to set things up correctly, which is critical for
long-term success, you need to understand
which percentage of your funds are going to be allocated to each
individual asset class, which is critical for
proper diversification of your investment based on your investment profile
and risk tolerance. This lecture is going to revisit the investor profile that you determined in the
previous module to give you a rough blueprint of
how your portfolio could be constructed from an asset
allocation standpoint. And in the following
three lectures, we're going to be speaking
about how you could go about constructing a portfolio
with a stocks, ETFs or a mix of both, which I personally recommend. However, this is all
going to be extremely relevant to your
asset allocation, which we're going to be
speaking about ray now, the topics that
we'll be covering in this lecture include
the following. Asset allocation for an
aggressive portfolio, asset allocation for a
moderately aggressive portfolio, asset allocation for a moderately
conservative portfolio. Then finally, the
asset allocation for a conservative portfolio. So before we actually jump into the asset allocation for
each portfolio type, I do want to mention here that
everything we're about to speak of in this
lecture is evergreen, meaning it, nothing is
really set in stone. And at this point in the course, you should have enough knowledge to consume over both to speak of and then tailor it to
your own specific needs. As an investor, these
asset allocations that we're about to cover are really just a blueprint as so, you should just identify which one and you relate
to most and then take it and tailor it to your own needs and
specifications. With that said, if you
feel uncomfortable replicating one of these
asset allocation splits, then that's totally
okay as well. I really just wanted
to put it out there that you should
really mold these to your own liking because there's just so many factors to
take into account here that it's difficult to actually
standardize things for every individual
investor jumping into the asset allocation split
for the first portfolio type. And this is going
to be what's known as the aggressive portfolio. Now, depending on
how you answered the screening
questions in order to determine your own
investor profile. Generally speaking,
someone who ofs for an aggressive portfolio asset
allocation split is going to be an investor who has a longer time horizon
ahead of them. So for this reason,
this tends to be a portfolio that's popular
with younger individuals, say under 3035, because it
by nature of being younger, you have a longer time horizon for your investment
career ahead of you. In addition to this, a
more aggressive portfolio means that there's going to be a heavier weight towards
equities such as stocks and ETFs that hold
stocks for this reason. And this is going to be a
portfolio type that will be more exposed to the
fluctuations of equity markets. So if you're able to hold onto these stocks over a
longer time horizon, this is going to allow you to ride through all these
market cycles and not have to unload some of your positions if you're
short on cash, for example. The reason why this
is so important is because if you are
looking to utilize most of your invested funds in the next five to even a
ten years, for example, this really doesn't give you enough time in order to
potentially write through market cycles where we
could potentially be in a market downturn or
even worse, a recession. And by the time
you're looking to utilize it, these
invested funds. And as we learned in
the previous module, a downturn should
not be a period where you're looking
to sell your position. Rather, it should be a
period where you're loading up on more of your
best stocks as well as ETFs in order to dollar cost average and lower
your average cost basis. Typically speaking, when
you're looking to construct a solid portfolio for
long-term growth of your wealth and the value of your portfolio while the
shorter the investment horizon and that you have for a specific account or
for a specific stock, the lower the equity
position in your portfolio. But once again, this is really going to be something
that you're going to have to assess for yourself
based on your own goals as an investor and everything else related to your
investor profile. For example, as a
side note here, I'm still in my twenties and my time horizon for
my portfolio is 2030 years even at so I'm
definitely a lot more weighted towards
equity positions. Oftentimes in the 90% range, depending on at the
moment in time. Back to the aggressive portfolio asset allocation
is since this is a portfolio that's going
to be significantly more heavy towards
equity positions. I tend to recommend
usually 85 to even 90% in equity positions and then tend
to 15% in a fixed income. This will allow your
portfolio to benefit significantly from the
growth of equity positions, which is going to be
significantly higher than fixed income
on the average year while still benefiting
from the stability it is from a much smaller
fixed income position. Again, personally, this
is how my portfolio is constructed based on my
own investor profile. So I'm a lot more
risk tolerant and I'm looking to invest
for 2030 years. So it was since my time
horizon is much longer, I'm uncomfortable having a
much higher concentration of equities than fixed income. In order to read the reward of the significantly higher
average annualized returns. The equity positions.
Just to summarize here, if the aggressive portfolio
asset allocation is something that you're looking to implement in your own portfolio, then I would typically
recommend an 85, 15% split. By the way, in the
next three lectures, we're going to actually be
learning about how to apply these asset allocations to the construction of your
portfolio based on stocks, ETFs, any mixture of both. Moving on now to the second
portfolio allocation. And we have the moderately
aggressive portfolio, which sort of said
it in the name. What this is going
to be all about, where we're still
trying to maintain a higher level of
equity positions, but ease off a little bit more than with the
aggressive portfolio. This means I will reserve
a higher percentage of the portfolio to fixed
income positions in order to be a little bit
less exposed to the typically more
volatile equity positions. This type of portfolio
construction is beneficial for
individuals who have a slightly less at
risk tolerance to high fluctuations of
their portfolio of value, yet still want to benefit from a higher than average
annual return of equity position to
over fixed income. This can be ideal for pretty
much all age brackets as well as investment horizons
because in my opinion, this still allows your
portfolio to have a nice split between
both fixed income and equity positions while
still maintaining a nice long-term investment
in vision for your portfolio, this asset allocation
breakdown is more in line with around 75%
equities and then around 25% of fixed income to still have more
exposure to stocks and equity ETFs while maintaining a little bit less volatility with a higher fixed
income position. The third portfolio asset
allocation is what I call the moderately
conservative portfolio. This type of portfolio
construction is convenient for medium risk investors and a short to medium
term time horizon. So if this is a type
of investor that you think you are based on
your investor profile. And this could be the type of asset allocation that you would want to base your portfolio on, Building off of the portfolio constructions that
we just looked at. The moderately conservative
portfolio is going to have a significantly higher level
of fixed income in order to stabilize the overall
fluctuations of a portfolio that would have a higher percentage
of equity positions. However, this is still a
portfolio that's going to expose you to some nice
appreciation over time. By the way, I typically
recommend that for this type of portfolio
construction, you utilize a higher level of blue-chip and
dividend stocks. Because in the stock world, these are stocks that are
typically seen as more of the fixed income
variations of stocks because they have a
higher level of stability and generate the
portfolio some income. The asset allocation breakdown
for this portfolio is around 60 to 65% equities and then around 30 to thirty-five
percent in fixed income. And finally, the last
portfolio construction here is that the
conservative portfolio, which is going to have a
significantly higher level of fixed income and blue
chip dividend stocks. Then in the last
three portfolios that we just looked
at with around a 5050 split of fixed income
and equity positions. Or if you want to be even more conservative and
you could opt for a 60% fixed income in 40%
equity position at portfolio. Now personally, I'm
more bullish on equities as a whole
and we just pick a safer funds for the more conservative portfolio
of the equity section. If this is the portfolio
type that you're leading towards a more
conservative portfolio, rather than going
ahead and doing say, 30% equities and
then a 70% fixed income slip because the way the markets are moving
over the past decade, higher exposure to
equities is in my opinion, more favorable to still
take advantage of a moderate appreciation and that will beat inflation rates. In my opinion, if your
portfolio is just to expose to fixed
income positions such as a 70 or even 80%
fixed income position in your asset allocation split? Well, in the current
bond environment, you could run the risk
of having at par returns with inflation or even in
a worst-case scenario, having an inflation rate that is higher than at the appreciation
of your portfolio, which is absolutely
something that we want to avoid with our
portfolio is here. This type of portfolio is going
to be more convenient for older investors who
are looking to utilize the funds invested
in their portfolio, say in the next decade or so. And don't want to run the
risk of higher exposure to equity fluctuations
in a period of time when they would actually be
looking to utilize the funds. All right, so in this
lecture we just covered, uh, for different asset allocations, for different types of
portfolios that are all going to be related in your
own investor profile. I really hope that this
lecture made the concept of asset allocation
clear to you and that now you understand
the significance of why it's so important to have a proper
asset allocation and based on your
goals as an investor. Because ultimately
this is going to have the largest impact on the returns that you can
expect from your portfolio. In the next three lectures, we are going to be
speaking about how to apply the information
that we just learned in this lecture to construct the new
portfolio of stocks, ETFs, or in my opinion, the best option here, a hybrid course
satellite portfolio, which is a mix of
both ETFs and stocks.
42. Building Your ETF Portfolio: Welcome to the
seventh lecture of the seventh module where we're
going to be speaking about how we can construct
your very own portfolio using exchange traded
funds exclusively, ETFs for short, based on your investor profile
and asset allocation makes if you're
truly looking for a passive and hands-off
approach to investing. This is a portfolio
construction strategy that I would recommend for
an investor who really wants a passive approach to investing and isn't necessarily interested in hand selecting
each stock they invest in, which inherently comes with a lot of research
and due diligence, which can take a lot of time utilizing ETFs exclusively
for the construction of your portfolio has
actually become a somewhat popular way of approaching portfolio
construction over the past couple of
years because it'll US investors and
easy approach to diversifying their holdings at a relatively low management
expense ratio or cost. That is, as we learned
earlier on in the course, while also requiring
extremely minimal efforts and rebalancing
of the portfolio. Now once again, just like in
the lecture on constructing a portfolio using a stalks
as the primary vehicle, it's really difficult for me to give you concrete examples of ETFs and that would be suitable for your
portfolio in question, however, we will,
in this lecture, we'll be diving in to some model ETF portfolios
that have created. Then you can then utilize as a model for constructing
your own portfolio. And by the way, these model
portfolio is really are a starting point that you should tweak to your own
investor profile, utilizing and
including the funds that you are most interested in based on everything else
that you learn about yourself as an investor
in this course, this lecture does also come with a downloadable PDF that you
can find below this video in order to have a better
visual representation of the model portfolios
that we're speaking about. The topics that
we'll be covering in this lecture include
the following. We'll start off with
speaking about a handful of the best core ETFs for Canadians that also
happened to be some of my favorite
exchange traded funds. And then following that,
we'll be speaking about model portfolios with examples of ETFs for each
investor profile and asset allocation split. So before we actually dive into these model portfolios
in the downloadable PDF, I'd first like to
speak about a handful of what I call a core ETFs for different asset vehicles
and then also for different types of equities that you might want to include
in your portfolio. So let's speak about
those right now. By the way, these are
really just examples of core ETFs that I
personally like. And some of them I hold in my portfolio and I just
wanted to offer you some possible options as a starting point
for your research. First, starting off
with the S&P 500 and my favorite a low
cost Canadian options are VFB from Vanguard
or x us from iShares. They will track the S&P
500 for a very low cost, expose you to the best
and largest companies in the United States. Now if you're looking to steal, invest in the American market, but you'd also like to include a wider spectrum of companies, from micro cap all the way
up to large cap stocks, you can choose to invest
in what's known as a US total market ETF, which includes
thousands of positions. You really can't get more diversified than this
in the US market. And a great Canadian
options include a BUN from Vanguard and
x UU from iShares. Moving on to some of my
favorite Canadian ETF options that track in the Nasdaq 100's, which contain at the
100 largest companies that are traded on
the nasdaq exchange, we have hx q offered by
horizon investments, which is my favorite. And then we also have x Q, Q, which also tracks the
nasdaq 100 index, but his hedge to the
Canadian dollar. If you need a refresher on
what a currency hedged ETF is, then made sure to go
back and learn about how currency affects
returns in module two. Now venturing onto ETFs that invest into Canadian positions if you so choose to include in this type of investment
in your portfolio, I would recommend
an ETF that tracks the TSX 60 because
this is going to give you exposure to
the 60 largest and most influential
companies in Canada, including large banks, energy
companies, and Shopify. The best ESX 60 ETF option
is x IU offered by iShares. Now if you're more interested in a total Canadian market ETF, then x IC would be
a great option. This is a TSX kept
Composite Index that holds over 250 Canadian equities representing over 95% of
the Canadian equity market. We've spoken quite
a bit throughout this course about
diversification and exposure to various
different assets and asset classes
within your portfolio. Diversification can take
many different forms from diversification in
terms of the equities that you're holding in
different industries that the companies operate
in asset classes or even geographic regions for this reason that since we're now living in a global economy, it can be a good
idea to also invest in other foreign markets
like emerging markets, are basically just
any other market that isn't located
in North America. And it's pretty much easier
than ever to do so through exchange traded funds that are offered on the Toronto
Stock Exchange. When speaking about
foreign stocks, uh, typically this will be
divided into two categories. The first one being foreign
developed countries like Australia and
European countries. And then the second
category will be known as emerging markets such as
India and China, for example. Emerging markets have
been experiencing tremendous growth over the
past decade and are now showing some of the
highest returns for investors in terms of
emerging market ETFs. Two of my favorites are
VBE from Vanguard and x EC from iShares for foreign
developed market ETFs, I would recommend xy f from
iShares and VA from Vanguard and make sure to check
those out further if you're interested in investing
into foreign markets. Now let's remember here though, that I wouldn't necessarily
expect you to include each one of these ETFs
in your portfolio. This is simply a collection of some of my favorite exchange traded funds that target
different facets of the market. Let's now take a
look at some more industry-specific ETFs that are popular among Canadian investors for various different reasons. First off, the
Canadian market is heavily weighted
towards bank stocks, since we have one of the
best banking industries in the entire world, Canadian bank stocks are
relatively stable and offer a great dividend
distributions being one of the main reasons why including a Canadian
bank stock ETF could be beneficial for your portfolio if you're
looking for dividend income. Popular Canadian bank ETFs
include XFN from iShares, an hx f from horizons. And you may also
be interested in real estate investment
trusts for which there are ETFs focused specifically on these
types of companies. Typically read ETFs will provide a high dividend
distributions and exposure to all of
the Canadian reads, or at least a high
percentage of them. Examples include X-RAY from iShares and VRE from
Vanguard investments. These are typically going to be the most irrelevant
Core style equity ETFs that most investors
will choose to include in their portfolios. With that said, we can't forget
a fixed income positions. And for this, there were also some great ETF auctions
regarding a bond ETFs. My favorites include a VAB
and VB EU from Vanguard. The reason why I like
these is because they're just really
easy to include ETFs that will expose you to various different types
of bonds without having to worry too much about the fixed income portion
of your portfolio. Finally, if you're interested in including some gold
in your portfolio, which we haven't really spoken about throughout this course. But Gould can also serve as a hedge against
inflation and equities will great ETF
options would be X gd by iShares for gold mining
companies across the world. Or see EGL, which
literally holds a physical gold on
your behalf and tracks the market value
of gold Boolean array. So that was a rundown of some great Canadian
exchange traded fund options for various
different facets of the market that I
would highly recommend. You look further into for the ones that you are
personally interested in based on your
investor profile and how you want to construct
your portfolio, uh, moving forward at this
point in the lecture, I'd recommend that you
download the PDF sheet containing some examples
of portfolios and use these religious as a guide for your own construction based
on your investor profile. Now you could also choose
to model these perfectly, but I'd recommend that you use your own
experience and now and knowledge to craft your own
width these as a guide. Now in the next
lecture we're going to be speaking
about constructing a core satellite portfolio with both ETFs as well as hand
selecting your own stocks, which is actually the type of portfolio that I personally use. And we'd recommend
for someone who wants the best of
both worlds really.
43. Building An ETF & Stock Portfolio: Welcome to the eighth lecture of the sixth module where
we'll be speaking about strategically combining
both stocks and ETFs into one single portfolio
with what's known as a hybrid course
satellite portfolio, giving you the best of both worlds for wolves,
stocks and ETFs. This is the approach
that I personally use in my own stock market portfolio
because this allows an investor to first
and foremost create a foundational layer of
exchange traded funds for instant diversification
of the portfolio and steady appreciation of the
portfolio's value over time, all of which at a very
low expense ratio. And then from there, the investor can go ahead
and hand select and choose certain individuals
thoughts that may be of interest to
them after having a well-identified or investor
profile and strategy. And these individual
positions are going to act as the satellites through the
core portion of the portfolio. The whole goal of implementing a hybrid course satellite
portfolio over is a strictly using stocks or ETFs to build out a
portfolio is that well, it is designed to lower
costs associated with investing and it also
minimizes volatility. It can also provide
investors who had the proper knowledge to
analyze their own positions. If you go ahead and
explore the idea of investing into individual
stocks or other funds and attempt to somewhat
a beat the returns of the broad market as a
whole if they so choose. So really we can think of this hybrid course
satellite portfolio as a planet with a multiple different
satellites orbiting it, where we're first going
to utilize a variety of these core ETFs
such as say an S&P 500 or a nasdaq 100 ETF, which are going to
track broad markets and contain quality
companies within them for that higher
level of stability and appreciation at a
lower fee structure. And then from there
we can implement multiple different satellite
of accompanies that we think are going to
perform well over time and that compliment
our overall strategy, investor profile and portfolio. Once again, this is
a strategy that I personally use in my
own portfolio because while I'm out actively
searching for new companies to invest in that I think will perform well, uh, based on variety
of different criteria. Well, that core portion
of my portfolio that's comprised of those highly
diversified at core, ETFs are providing my
portfolio with that stability, Lord, volatility and overall
appreciation overtime. The topics that
we'll be covering in this video lecture
include the following. First, we are going
to be speaking about how you can construct your core satellite
portfolio of followed with the breakdown
of each element. And then finally, we'll end this lecture with
speaking about how this fits into your asset allocation
and investor profile. Alright, so just
like with the stock only or ETF only portfolios that we spoke about earlier. There's basically
an unlimited amount of ways that you could choose to build out and construct your hybrid course
satellite portfolio. But among the countless
specific ways that you could build this hybrid
core satellite portfolio, there's pretty
much two blueprint that you're going to
want to lean towards. The first one being
using ETFs only for both the core positions as well as the satellite positions. And then the second blueprint
using ETS and stocks as the satellite positions
will be speaking about both of these strategies at later on in this lecture. But let's first get a
stronger comprehension of what this portfolio
strategy entails. What you need to remember
with this type of portfolio construction
is that you'll have your core positions comprised of low fi, broad market ETFs, acting as the foundation
of the portfolio as we covered in the previous lecture going over exchange
traded funds, I would recommend that this
core portion of the portfolio will be constructed
of an S&P 500 ETF, a nasdaq 100 ETF, and then even potentially
a total US market ETF for the equity portion of
your asset allocation. And then also keeping this
to under or around four, but most likely three ETS is what I would
recommend because that's really all you need for the core portion
of the portfolio. With that said, a core
satellite portfolio can be constructed in
pretty much any way that the investor chooses with the core portion having
the possibility to track, uh, basically any indexes desired to fit a certain
investment styles. For example, one could decide to focus the
core portion of their portfolio into a higher growth
exchange traded funds, or even say, dividend
exchange traded funds, depending on what the goal
of that portfolio is. The same is true for
these satellites. Being up to the investor in question will be
speaking about how these factor into
your investor profile and asset allocation shortly. But keep in mind
that for the core equity portion of the portfolio, you're most likely going to
want to include ETFs such as an S&P 500 and nasdaq 100
and total US market ETFs. But those are just
some examples. You can refer back to the ETF portfolio lecture
that we looked at previously to get
some more examples of ETFs that are a value. Now for that more actively
managed portion of the portfolio at your goal
as an investor is to find stocks as well as other exchange traded funds that have
the opportunity to provide a higher returns to your portfolio that not
more passively managed. Core portion of the portfolio, old branch off with specific growth and
dividends, the ox, as well as industry
specific ETFs as my satellites that
may be of interest based on a global assessment
and proper analysis of each one and how they fit into
my strategy and portfolio. And let's now dive
into how you can actually implement this within your own investor profile and asset allocation
within your portfolio. As mentioned previously, the core satellite
portfolio can be approached several
different ways and with unlimited combinations. But whether or not
you choose to go with stocks or ETFs as
the satellites, the positions and weights associated with each
one still need to fit within your overall investor profile
and asset allocation. We're now going to look at an example of how
you need to approach the breakdown of
your core positions and the satellite positions. The example we're going
to be using is for the moderately aggressive
asset allocation breakdown. But this same
strategic rationale can be applied to
your own situation and asset allocation breakdown with the moderately
aggressive asset allocation. And we have a desired at 75% equity and at twenty-five percent of
fixed income split. Let's start with the equity
side of the portfolio. So if you're looking
to implement a core satellite approach, your core position is
generally going to want to be in the 50% range at a minimum to allow for all the positive benefits that we've spoken about
in this example. If you're starting out with say, $10 thousand and then seventy-five percent of
this is for equities. These would represent
a 7,500 from which 50% of that amount would be
for your core ETFs being say, an S&P 500 ETF or a
total US market ETF. Again, I can't really give you a specific a cookie
cutter breakdown of the exact percentages
that are best for you. But based on what you've identified for your
own investor profile, you should have a good idea at this point of what makes
the best sense for you. Make sure to maintain
your core ETF positioned to lower costs. Broad market indexes such as the S&P 500 at total US market, TSX 60 or nasdaq 100. Instead of going ahead
and using this portion of your portfolio for
higher fee ETFs, You can also choose to
use a combination of these indices to make up your core portion
of the portfolio, but makes sure they
amount to roughly 50%, I would say, of the asset allocation of
that equity portion. Now in regards to the
fixed income portion of the portfolio, I tend to recommend that you use a fixed-income ETF basically
at all times instead of hand selecting
bonds because this really simplifies
the process and investing in fixed
income securities from a diversification and
passivity perspective. Once again, refer back to the previous lecture
on E-test for some specific examples of fixed income exchange
traded funds. So let's now put
this altogether for the moderately
aggressive portfolio. In this case,
twenty-five percent of the portfolio would be comprised of a fixed
income low cost ETF for the core portion and then 50% of the 75% portion for equities would be comprised of
low-cost broad market ETFs. From there, 50% of that 75, which is roughly 37.5%
of the portfolio, would be kept for actively managed and selected
equity positions such as stocks and
ETFs of your choice. This is a strategy that I would most likely recommend
that you take if you're an investor
looking to get the benefits of ETFs and
want to have a portion of your portfolio reserved for active management
on your end from which you can mold it to
your own investor profile and asset allocation. With the goal of this
entire course was to allow you to achieve
a better grasp on your investment and
then be able to look at your portfolio
and investments from a more analytical standpoint for the future success of
your investment plan. In the next lecture,
we're going to be speaking about a concept known as a rebalancing
of the portfolio, where you're essentially
going to realign at the asset allocation
once your portfolio and inevitably grows
and shifts out from your own undesired
asset allocation.
44. Rebalancing lecture: Welcome to the ninth lecture
of the sixth module. In this lecture, we're
going to be speaking about how you can go about rebalancing your portfolio when
and if it varies from your desired asset allocation and what this entails
as a retail investor. This actually happens to be
the last main lecture of this investing course
where you're now going to be in maintenance mode
of the portfolio, keeping an eye on the
asset allocation of each one of your holdings
and asset classes in order to be able to rebalance your portfolio to the proper and desired
asset allocation. And based on your
investor profile, which is a definitely
going to be a reality as the value of your holdings shifts with the ebb and
flow of the market. The topics we'll be covering in this lecture include
the following. The first thing we'll be
speaking about is what is rebalancing your portfolio
in the first place. And then we'll be
finishing this lecture off with how you can go about rebalancing the portfolio back to your desired
asset allocation. The bottom line for
the construction of your stock portfolio is that
throughout the process of actually doing so
and maintaining the portfolio moving
forward after you're actually done in this course
and you're in the process of a growing your
overall investment and portfolio over time, is that you always maintain the proper asset
allocation based on your investor profile that
you've defined in this course, by going ahead and purchasing the proper stocks as well as
exchange traded funds that are going to really
fit and compliment your portfolio now over time and during your
investment horizon, the market value of your stocks as well as your
exchange traded funds, is going to vary either lose
or gain value over time, which is completely normal in a normal market
and environment. In this case, the actual weight associated with each one of
your positions is going to vary and therefore
have an impact on at the asset allocation split
within your portfolio. During this portfolio maintenance
phase and growth phase, it'll be necessary for you to actually rebalance
the portfolio, meaning bringing
those weights back to your desired asset
allocation split based on your investor profile, if you so choose rebalancing a stock portfolio or
basically just means it's strategically
buying or selling one or more of your positions
once it's deviated from your sought after assets
split in order to bring it back to your sought after and desired asset allocation mix. This process of rebalancing your stock portfolio can be
achieved by one of two ways. Either you can buy yourself
positions that are already held within
your portfolio, and then a reallocate
some of those funds in various different asset
classes and positions. Or you can actually input and more outside cash into your portfolio and purchase
and new positions, bringing back that
asset allocation split back to the norm, Let's actually take
a look at an example here in order to
better understand what rebalancing is and why it's important to do so in
a stock portfolio. So let's say that
you've opted for a moderately
aggressive portfolio and for this reason
you want to maintain a 7525 is split between equities and fixed income
positions while overtime, your equity positions may gain more weight in the portfolio
as the position grows relative to the fixed income
position to the point where it's now say
an 8515 split. If over time your
equity position and it grew in value to
eighty-five percent, then the rebalancing process would bring the portfolio back to the original desired asset
allocation split of 7525. With this in mind,
then the process of rebalancing portfolio
is really just to maintain your equity to fixed income level
within your portfolio. The theoretical case of say, a portfolio where you hold a
five individuals thoughts. Well, if one of
these thoughts ends up going up in value by say, 500% in a couple of years. Well, at this point in time, the actual weight
of your portfolio is most likely
going to be heavily weighted towards
that one position that went up so substantially. So for this reason, the future fluctuations
of your portfolio and the risk level
associated with each one of the positions
is going to be severely dependent on
this one single position, which isn't necessarily ideal. I said it time and time again
throughout this course. But maintaining proper
asset allocation is really important if
you want to maintain a nice risk to reward level in your portfolio that's based
on your investor profile. The issue with a
portfolio that's asset allocation
has deviated from your actual desired
asset allocation based on your needs
as an investor, is that the overall
long-term returns are probably going to
be quite different. And what you're comfortable
with as an investor. For example, if
you're looking for a more conservative
portfolio because you're in your fifties and sixties
and you're looking to utilize your portfolio
to find your retirement. Well, you might not
be comfortable with a portfolio that's
crept up to 85% equity over time because one of your equity positions has done very well over the
past couple of years. This could put ear
portfolio in a position of a much higher risk
than what you're comfortable with with that said, keep in mind that it's
completely normal for your asset allocation split and investor profile to shift
over your investment career. So make sure to just reassess
your overall needs as an investor and
what you're looking to have as an asset
allocation split. Every couple of years or so, let's say every
four or five years. And then from here,
a re-evaluating and rebalancing
your portfolio will be much easier because you then know what your goals
are as an investor. Finally, I generally like to rebalance and reassess my
portfolio and the weight associated with each position in pretty much every couple
of quarters or whenever I feel comfortable
doing so based on these stocks and ETFs that
I'm holding at the time. But generally speaking here for the average investor rebalancing your portfolio every year or so is most likely
going to be optimal. The last thing you want
to do is rebalance your portfolio every couple
of days or weeks and incur significant at
trading fees in doing so because ultimately this is not going to be necessary anyways, if you're continuously
adding to your portfolio in terms of contributions from your pocket into your portfolio, which I highly
recommend that you do so every couple of weeks to every month because with new funds flowing
into your portfolio, you can do this rebalancing
process by just buying a new positions in
order to bring back your asset allocation and
back to your desired split. All right, so another,
we understand what rebalancing a portfolio is and why it's important
to do so as an investor, let's actually speak
about how you can go about this process
in your portfolio. The basic idea behind a rebalancing and portfolio
is actually quite simple and that you would sell off some of your
higher performing assets that have shot past
their desired allocation. Typically, these are going
to be equity positions in order to purchase some of
the lower performing assets. Generally speaking, these
will be fixed income. Now this might sound
counter-intuitive that you would sell
off some of your better performing assets
or add more funds to purchase some of the
least performing assets. However, let's remember
our example of earlier, where you would want to maintain a seventy-five
percent split towards equity positions and at twenty-five percent split
towards fixed income positions. If you started
with $10 thousand, this would represent a 7500 of equities and 2500
of fixed income. But let's say that
over a one-year period at the portfolio grew to $11 thousand in equities and
$3 thousand in fixed income. Well, this would now represent a 79% equity and 21%
of fixed income split. If you wanted to rebalance
the portfolio to that original 7525 split, you would need to bring the
equity position back down to 10,500 and bring up the fixed
income position to 3,500. What I would recommend doing if you're just starting out with your portfolio and the balance
is still relatively low, say under $100 thousand than simply adding funds to
your portfolio each month and purchasing new
positions should be enough to maintain proper
asset allocation and you won't be forced to rebalance your portfolio in such a
drastic manner by selling off hundreds or even
thousands of dollars worth of securities in
the rebalancing process. If some of your
positions that do end up doing quite well with that said, don't be afraid to actually offload some
properties that have done it quite well and
materialize some of those gains. This strategy of
rebalancing the portfolio through purchasing
new positions only also allows you to save on
commission fees because instead of incurring a fee on
both a cell and buy order, technically speaking,
here, you would only be incurring a fee on
a new buy orders. Another element dimension and consider is that if you're at the point where you're using a cash account for
your investments, which once again, I
would not recommend. And when just starting
out, you should be using a tax-free
savings account. But if you are using a
cash account only here and you're selling some of your
positions at a nice gain. Well, you would be creating
a capital gain of where you would need to pay
taxes on that gain. So this is definitely
something to keep in mind and you
should always start with the tax-free savings
account when you're just starting to invest
and when rebalancing, purchasing more positions is definitely going to be
the way to go here. And finally, this
strategy of buying a more positions for your rebalancing
process also allows you to somewhat leave your winning
positions alone if you don't want to actually incur that capital gain Jessie yet, and it materialized your
gains if you do think that there is still more
potential upside, however, I really do want to stress
here that if you're in a position of a very
nice gain on a position, taking profits is always a good idea in a
long-term strategy. However, I would like
to reiterate here that based on a
multitude of factors that you're going to
be utilizing during your analysis process of your current positions and
at new future positions. There's nothing wrong
with materializing gains. If you're in a
position where you believe the stalk is
somewhat kept though, let's say it's
rallied significantly over the past couple of months. You're in a nice dean position. There's nothing wrong
with materializing gained because this
will allow you to reinvest at some of those
funds and gained back into new positions
for long-term growth. This wraps up the
lecture on rebalancing your portfolio and you now
have all the proper tools to both create
your portfolio and maintain the proper asset
allocation over time with everything you
need to know about each individual position and how investing in the
stock market works. I really hope that
this course has given you the proper tools and knowledge to create a long-term successful
stock market portfolio.
 Griffin Milks, Business & Investing