Transcripts
1. Course Intro: welcome to stock market fundamentals. Mining is Zachary Hartley, and in this course I'm going to teach you everything you need to know about the stock market, starting with the history of the market, what a stock is and how they trade and finishing with how to find the right companies and build a diversified portfolio to set yourself up for success. We're going to help you set goals, find strategies and methods to meet those goals and knocked them out of the park. And in this course, you're gonna have everything you need to feel confident, making your first trade, taking control of your own financial freedom and setting yourself up for long term financial success. My name is Zak Harley, and I've been day trading and swing trading in the stock market for the last seven years, and my goal here is to share as much knowledge as I possibly can with you. Welcome to stock market fundamentals.
2. History of the Stock Market: What's up, everybody? Zack here again, And today we're talking about the history of the stock market. So I'm really excited about this. There's one of my favorite subjects. Cut is a kind of It's a cool story, and it tells you about how it started and how we got to where we are today. So let's get into it. The history of the stock market is kind of cool. It actually started with ships, and it started in Amsterdam in 16 02 Back then, merchants were trying to send ships overseas to trade for goods and products and bring them back into Europe and sell them to make money. Now, what was kind of tricky about this business model back in the day is about 25% of the ships never made it back. So for a merchant to save up all of his money, send out a ship to go and do this and possibly not have it come back was a big risk. So what they did instead was instead of sending a one ship that send out five ships, but that cost much more money so they will go out and they would raise money from the general population and from businesses, and in return for or for that up front money they would issue shares. Those shares looked like this. So this share here was issued by the Dutch East India company. This was the 1st 1 that's actually ever being recorded in the oldest one. We confined, and this was a share for anybody that invested to get a return of the profit from that ship . Now this was a great system, and it really helped them expand and grow the amount of ships that they could send and receive. Eventually, more and more businesses began to do this, and soon it was common practice to raise money through issuing shares to start your business. This eventually led to lots of companies having shares and trading the shares, and it grew across Europe. So much so that in London there was a coffeehouse where people would meet every single week to trade their shares in exchange and meet up and talk about it. And after a couple of years, the traders that went there every week actually took over that coffeehouse and established it as the world's first stock exchange. That was in 17 73. Fast forward a couple of years, and this premise or this idea had expanded across the globe. In New York, they started Wall Street and the New York Stock Exchange, which was located on Wall Street. And that was in 17 92. That was the first organic kind of stock trade market on on North American soil. So since then, there's also been a lot of different markets opening around the world, and those include the NASDAQ, which is an electronic exchange. Also based in New York. It's actually the second largest exchange in the world. Excuse me. There's also the Toronto Stock Exchange for Canadian companies in North America. There's the Japanese Stock Exchange, the Shanghai Stock Exchange, in the Hong Kong Stock Exchange. All in Europe, you have the Euronext and London Stock Exchange in Europe. Now the advantage here is that you now have stock exchanges on multiple continents around the globe, which allow you to trade almost 24 7 So if you're up in the middle of the night and you want to make a trade, you can do it. On the Asian stock exchanges Monday to Friday. Now it's great because it allows global markets to interact with each other, and it also gives you liquidity and accessibility to the markets, depending on where you are in the world. So it's pretty cool. We started with one single ship. We expanded that premise into multiple businesses and that and then opened a stock exchange at a coffee house in London and that expanded into what we now know as a different exchanges around the world. So pretty cool story. That was the quick version of 300 years. But I'm really a fan of it, and I hope you enjoyed it so onto the next lesson and we'll see you there.
3. What are Stocks and Bonds?: all right with up y'all that Zack here today. We're talking about stocks and bonds. What they are, what you can do with them and how they work. So let's get into it right away here, So stocks is pretty exciting. Another word for them is equity shares per senator ownership. Tell me in the exact same thing, usually in different contexts. But what they are is a means that you own or this stock represents part of a company. It means that if there's 100 shares and you own five, whom you on 5% of the ownership of the shares of the equity in that company you own 5% of that company. And now with that, you get a couple of things. So this is what Apple Computer stock looked like back in the day. This was the original one. This is the paper copy one. You can still get paper copies usually get them. When you incorporate your business, you get a copy of what the paper copy of the stock actually looks like. But nowadays everything's electron ICS. When you buy and sell shares to your banker through training platform, you're not getting any paper copies like this, you're literally just doing everything electronically. This is what the share actually looks like. But everything now when your trading and I'm going through the process is Elektronik. When you do share transfers and actually incorporated business, that's what they look like. And they do keep a document of this still. So what can you do with a stock? Well, there's a couple of different things. Since you own X percent of the company, you are entitled toe X percent of the profits or of the dividend. So if you own 5% you get 5%. That's sort of how it works. So in the corporate world, all of the profits air called your net earnings or retained earnings, and a company can decide now on Lee if they want to. They can issue a dividend that dividend as part of the profits that were generated from that company, usually in the quarter, and that dividend is a chunk of money that then gets paid back to the shareholders. You'll get five cents or $1 or $2 for every share that you own, and that's how your pay out of the profits is determined. Usually they're done in quarterly dividend. Some oil and gas companies do it monthly, but usually it's accordingly thing, and that dividend is an option of the company. They do not have to do that now. Where you see the difference is if it's a large blue chip company or it's a large oil and gas producing company, they'll usually pay a consistent dividend because that's what their investors are looking for. But if it's a small young startup, if it's uber or Apple back in the day or any of these young up and coming cos they're never gonna pay a dividend because they decide to put that money back into the company. So when you're looking at this, you really need to be aware of what you're getting with these companies. And when you buy their stock, what else do you get with a stock? Well, you can vote on certain decisions. So if the company decides to sell emerge, if the company decides to elect a new chairman of the board or new board directors, any type of decision like that, that's not a day to day operation. You actually vote on it. You can also attend the annual shareholders meeting, which is a once a year meeting usually done at the company headquarters, where all the investors from around the world can come in. The most famous one is the Berkshire Hathaway annual general meeting that's run by Warren Buffett, and he actually hosts one day where all the companies come in the exhibit, their products and all of the investors come in to basically here, Warren speak. It's definitely one of the biggest A GM in the world by himself. You could buy and sell your stocks, and you can trade them, hopefully buy them at a lower price, and you sell them at a higher price. And that's definitely one of the options you can do with them now. Another thing that most people don't know is they are considered an asset class. So just like your home is considered an asset. Your cash in the bank is considered an asset, so where your stocks so if you need to borrow money or you need to get a loan for a mortgage, what you can do is you can use these stocks as part of your asset base. That was a good store of money. So if you don't want to sit on cash, you don't want to be subject to inflation. But you want to make a somewhat steady return. You can invest into a diversified portfolio or an index fund. You convert your cash into stocks. It's great way to story and money. So that's the summary of stocks. Next up is gonna be bonds, so a bond is very different than a stock. A stock is ownership in a company, but it bond is pure debt. So if a company needs to go out and let's say you're a ship manufacturer and you need to go out and buy a bunch of inventory for a new type of ship that you want to fund, well, you can do that through issuing bonds. What it is is you issue basically a note that says I owe you $1000 and I'm gonna pay you back $1000 on X Date, and I'm gonna pay you interest in between. So that's what a bond is. A bond is debt and a share or a stock is equity in the company and ownership. Every bond that you buy is gonna have an interest rate. That interest rate is basically what that person or that entity that company in this case is going to pay you to allow you to let them borrow the money and that money is usually board over a certain time period. So let's say it was a $1000 bond over five years at 5%. Well, that 5% is actually considered a coupon, and that bond pays you a coupon rate of 5%. So at the end of each year, you can go in and collect your 5% coupon, and at the end of the bond, you're gonna get all of your money back. So that's the key here with the bun is you're gonna loan them $1000. You get 5% back every single year, and then you're gonna get $1000 back at the end of it. That 5% is what you're using. Eyes what you're gaining to allow that company to bore your money. Bond is not equity, but it can be bought and sold. I got a little spelling air in the in the power point here, but don't mind that what it's saying is, it can be bought and sold it similar to a stock. There are markets for it can be bought or sold, and there is one big difference. You can buy government bonds so their government bonds for one year, two year, three year, five years, 10 years, 20 years, 30 year. And these were generally considered the most safe bombs and generally the most safe assets that you can really invest into. Now they pay you a much lower interest rate, usually between 0.8% and maybe two or 3% depending on the rates at the time. But what's nice is it's a super secure way to do. Do your basically storing your money. You can buy bond that's still gonna pay you an interest rate and the only way that it defaults of the entire US economy crashes. So lots of security there but still completely different than a stock, and you can buy these bonds. Companies can issue them to go out and buy new ships, for instance, or governments can issue them. Teoh put some money into the markets, so a U. S. A. Bond. This is what it looks like. This was actually done by the United States of America. This is a little bit back in the olden days where they still have the coupons actually attached to the bond. So the reason it's called a coupon is because you literally tear it off the bond. All these little blocks here at the bottom are individual coupons that this customer take back into the bank, and they would get a X dollar amount for that coupon. So that's the reason that it's still called a coupon, and the bond is basically that top piece of the top. So when somebody would go in, they give $1000. They'd get this entire sheet back, that taking the coupon every quarter every year to redeem that money. And then at the end they would take back that large bond. And then we get the principal amount back, and that's how bonds work. Basically, all over the world, they all work almost the same way. They do change where the paint mints come in, but that's pretty much the general premise. So just to summarize, how are they different stocks or equity in the company and bonds or company or government debt? They're completely different. There is no time horizon on a stock. You can own it for as long as you live. You can even pass it on to your Children. But there is a set time horizon on a bond. Every bond has a certain period of time, as well as an interest rate in between. That's your coupon rate on stocks is a variable return. You have no idea if that stock's gonna go up or down, or whether or not they're going to continue to pay that dividend. That's right. If a company is currently paying a dividend, that could decide to not pay a dividend at any point. So there's variability, even if they're paying a dividend. A. A bond, on the other hand, has a set time period and given return race, you can pretty much forecast what you're gonna make on it on. The stocks may pay a dividend. They may not, and the bonds that coupon is guaranteed, so it's definitely a lot more secure. There are no government stocks, but you can buy bonds from the government that generally considered the safest type of investments, and they go over long time periods. A stock can also be any price. You've heard the woeful Wall Street talk about penny stocks. You can also buy Berkshire Hathaway, Warren Buffett's company, for about 200 to $300,000 per share right now. So the stock price can be any price basically, in between there and it doesn't really matter what that price is, because it depends more so on how many shares are issued. We'll talk about that a little bit later on in the videos. Bonds, on the other hand, come in multiples of 100 or $1000 they set coupon rate usually between one and 5 to 6%. If you're really lucky s o those, the difference is we're gonna focus primarily on stocks in this course. But you do need to know that bonds air there as basically a slightly safer kind of asset class compared to stocks, they're definitely not quite as exciting, but they are actually bigger market in stocks just because of how much institutional money has gone into them. So that's a summary for stocks and bonds. Next video is about how the stock market actually works and how the price of those stocks are are gathered. So stay with us quick onto the next one will see you soon
4. What is an Index?: What's up, everybody? My name is Zak Hartley, and today we're talking about indexes. Now what is an index and index? Is a group of companies basically what it is. If you're trying to look at the solar industry, for instance, you can look at an index that has 10 or 15 different solar companies in it to give you an idea of what that group is doing, as in general, they usually described in points. So when you look at an index, what it does is it says Okay, here's the 10 companies. Here's what they're worth That means they're worth X amount of points. This is where the index starts, and then it trades from there. Once those companies appreciate or depreciate in value, that's how the S and P 500 works is how the Dow Jones work. And that's how the NASDAQ works as well. So what is an index, or why were they here? While they usually focus on a certain geographic region and they're there to give you a reference of what that region or group of companies is doing as a whole? So what is an index? Well, one example of them is Dow Jones. You've probably seen this on the news. You probably heard of it before, but this is usually the most common one and the one that most people know about. And the Dow Jones is 30 blue chip stocks that are some of the largest and most influential in America. It is the second oldest out there, and it is also one of the most popular these blue chip stocks. What I mean by that is a stock that is not new. That is very large, that is well known, and that is basically an industrial powerhouse in the United States. One that's fairly steady, fairly stable in is done well over the years. Now the Dow Jones is really interesting because it's one of the best reasons to get into the market. The Dow Jones started in the mid 18 eighties at 62.62 point 76 points. It hits 78.38 in 18 96 years later, it felt toe 1/3 of that. Excuse me. It fell all the way down to 28.48 points in 18 96. Now, since then, the Dow Jones has had a phenomenally amazing run. It hit 29,551 points on February 12th of 2020. That was the actual all time high, were trading at about 24 25,000 points right now and the annualized gain, or the annualized return of the Dow Jones over that period of time from inception to today's 9.69%. So what that means is that if you had invested in the Dow Jones you put $100 in, you would have made, on average 9.69% every single year. Now, obviously, some years it went up way more than that in some years that lost money. But on average, over the long time period, you made 9.69%. And that is one of the biggest reasons to get into stocks early. And to start to understand them is because the market and the return that you can get here . If you could make 9.69% on your money every single year, you would do very, very well. You'd be financially stable in a short, short number of years. So this is these are the companies that are in the Dow Jones thes air. The 30 companies, you should be able to recognize a lot of these. You've got apple right here. Johnson. Johnson, You got Walt Disney Coca Cola. So there's a lot of big names in here, and these are the fundamental Dow Jones 30 companies, and this is what the chart looks like right now. So we're doing really well. We had a big kind of drop off here to be getting a march because of Cove it and we're slowly starting to climb back up were 24,242 points today. But as you can see here High was around 29,000 and we started at about 60 points, which is just unbelievable their returns over the long period. So another in next fun that you can look at is the S and P 500. This is 500 of the large companies listed in the United States. This is generally referred to as the best kind of cumulative representative of how the United States is doing. Because you have 500 companies in there, you're very well diversified. You have a broad range of different companies, and you have a lot of different companies in each industry, so it is considered the best representation. It started in 1926 with an annualized return to date of 9.8% so really close to the Dow Jones but 9.8. Instead, it's posted an annual increased 70% of the time. So what that means is seven out of 10 years that this is operating it posted, increase or return or the opening amount is higher or is lower than the closing amount on that year. It made money in that year is what it's saying seven out of 10 times so you can expect if you hold this stock for 10 years, three of those years, you're probably gonna lose money on it, but but with a long term, you're gonna return 9.8%. So the last one I'm gonna look at in kind of depth, here's the TSX Competent Index. This is the Toronto Stock Exchange Composite index. It's basically the same idea, but in Canda it only has 235 companies listed in this index, and it makes up roughly 70% of the market cap on the Toronto Stock Exchange, which has about 1500 companies. So these small to group of 235 make up the majority of the market cap on the Toronto Stock Exchange. So it has a really good broad depth of what the Canadian market looks like because it makes up so much of that Canadian market. It started in 1960 from 1960 to 2018 it had an annualized return of 9.3. So slightly lower than the Dow Jones Industrial and the S and P 500. But still almost in the exact same ballpark is what the TSX looks like right now. So same almost the exact same chart. You can see it doing pretty steady all the way up here. It hits 17,500 points, and then it dropped all the way down to 11,000 here at the beginning of March because of the covert pandemic. Again, we're working up just like we are in the Dow Jones index. So this is the Canadian version of the S and P 500. We don't really have a Canadian version of the Dow Jones but this gives us almost the exact same information in summary indexes or group of companies. They're basically a representation of what that group of companies that industry or that geographic region is doing. It's used to look at larger trends. So when you look at that group of companies or you look at those companies within that country, you can usually get a reference for how that country or industry is doing it. Can those indexes can contain companies from just one country? You can also look at a global index, so you could look at Excuse me, a global index that has countries or companies from countries all over the world. Or you can also focus on just specific industries. You could focus on just solar indexes, just cannabis in back indexes, just energy indexes. There's an index for almost every single industry, and they could be traded through index funds or E. T. F. S. And that's what we're gonna look at it another video. So lots more to come. Please stay tuned
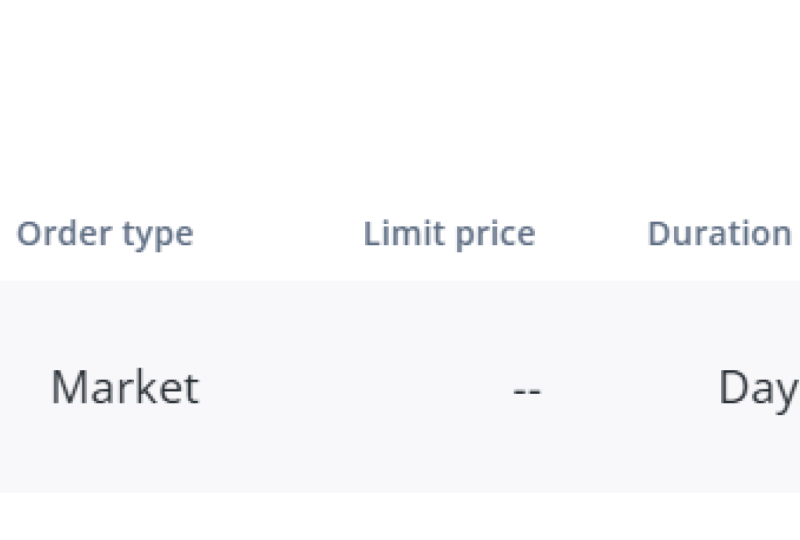
5. How the stock market works: all right. What's up, everybody? Today we're going through how the stock market actually works. What I mean by that is how we the shares traded. And how is the price determined? So, first of all, the first thing we need to talk about is the initial public offering. Now what happens is when you go out and start a company, you can raise money through private means so you can go to your friends family, and you can raise money, go up to investors and raise money. But you need to really raise a large amount of money. 500 $1,000,000,000. The best way to do that is on the public market, so you can have access to everybody around the world through the stock market. And how you do that is you take you your company through an initial public offering, also called an I P O. And, like our slideshow says here, it says it's used to raise money. That's exactly what it is. It's a fundraising metric for a company to raise money through global investors. And then what happens after that is once they go through the i p o their shares air, then traded on a stock exchange. It happens on an exchange like the NASDAQ, the New York Stock Exchange, the Hong Kong Stock Exchange, any of them all do it. Companies issue these shares in return for capital, and the shares have been traded on the exchange exactly Like what? We're gonna be going through trading stocks on the stock market. So all of these trades happen after a company is going through an initial public offering. And when a company goes through the I P O process and the shares can be traded, it means that they're a public company if you can not buy the shares and they have not gone through nine p o means there are private company. And the difference is that AH, public company is open to investors from around the world, and they also have to report their financials and a lot of other metrics on a quarterly basis. So there's a lot of reporting requirements and financial requirements. They call along with being a public company, which is one of the reasons only big companies do it versus private. You don't have to tell anybody anything so you could be a private company don't have to report your financials to anybody. You can basically operate basically in the dark, so it's kind of grateful. The only people you have to worry about the i. R s or the c r A. So this is what the Facebook I feel it looks like when the eye peeled, I field on the NASDAQ and see that logo down in the front there. This is Mark Zuckerberg, the CEO, and he basically goes at the market open on the day that they're gonna aipo and he hits the button for the NASDAQ that says, OK, we're live. This is our I, P o or on the New York Stock Exchange. Isabel. So ringing the opening bell. You've heard that before. That's on the New York Stock Exchange. So the stock price, once a company has gone through their initial public offering and their shares have then traded on a stock exchange, how do you determine the value of those shares over these stock price? Well, the truth is, is that it's completely determined by supply and demand. The market opens at 9 a.m. and it closes at 3:30 p.m. In different areas of the world, and that price can fluctuate between that time. And also after that time, when the market is closed, the prices can also change. The price quote that you see in that we're gonna go through is the last executed trades. So if the price quote is $20 it does not mean that your trade is gonna execute it. $20 means that the last trade happened at $20 years, could execute a $20.1 and five cents whatever the prices at the time now, the big thing here is that we have to start to understand the difference between the types of stock trades. So when you go in to make a stock trader going to buy or sell a stock, we actually doing is placing an order in the market. Now there's two different types of orders the market order and a limit order. A market order means that you're gonna go in and buy and sell, buy or sell your shares at the easiest available transaction price. So the closest transaction price that you can instantly transact with on that stock exchange. So if the stock is $20 you go in with a market order to buy five shares, it is going to basically sell you those shares at the closest price possible to $20 no matter what. Just gonna instantly transact that that basically order that you placed and you're going to get in or out of that position at the market price at the time, usually pretty close to that quoted price. But it might not always be the same. Ah, limit order is a little bit different when you're buying shares and you place a limit order , you're going to say I want to buy 10 shares at $19. So if that share price switches from $20 to 19 then you're trade executes. You can also do it the other way. You can do a cellar where I want to sell my shares at $21 and if the price goes up to $21 and his 21 minute execute your trade so market order will execute your trade instantly at the closest price possible, depending on the last quoted price. And a limit order is placing an order to buy or sell shares at a certain price that is gonna make more sense in the next slide. But this is what the order form actually looks like. So when I buy my shares do RBC Investment Banking Canada here. It's one of the platforms I use. This is the actual screenshot of an order Form off what it looks like. So instead of doing it just kind of walking through here, I'm actually going to show you what it looks like. So we type in Tesla, you test the ink so detailed stock quote right here. Let's see if this comes up. Here we go. So Tesla, 40 or $57.47 dollars USD. It was down 5.63% in the last trade of the day. As of today, April 2nd 2020 was $454.47. Now that price can open up anywhere tomorrow. But this quote here is the last quoted the last executed transaction. That's how they get that price. So now let's say we want to go buy a Tesla stock. It's really simple. It takes us to this page here. We're gonna choose our account. I'm using a practice account for this one just cause it gives me money. So here's that same screen you saw in my power point We're gonna go with buy, buy one share of Tesla. We've got the that take her symbol on their that four digit abbreviation that you see, for every stock is called taker symbol. That's basically what we used to establish that stock. Instead of writing out Tesla Motors, we read out TSL We choose our market, we're gonna go in the U. S. Markets. And then here's what I was talking about. So market price or limit price, there's a couple different things you can do here. So if I go market price, what it's gonna do is it's gonna place in this order. Now it's 8 30 right now PM So if I go market price, what it's gonna do is place in order for the opening price of wherever that stock opens tomorrow. So it was at $454. If it opens at $440 tomorrow, it's gonna execute that trade for me. However, if I go with a market price and I set a limit price, let's say I want to buy this share when it gets to $450 I want to get an at $450. I can place this order and this order will sit in the system until it is executed. So if that stock goes all the way up to 607 100 my order is just going to sit there and nothing's gonna happen to it. And it drops to 4 50 which is the number I put in there than that trade is gonna execute. So that's the big difference here at the market. Price is going to execute. The closest prices came and the limit price is gonna execute at a certain dollar amount. You can also say, if you only want it good for the day or if you want a good through. So that's where you can kind of play with the timeframes there, and then any part or all or none, we're gonna go through that here in a minute. But this is the actual order for for RBC. If you want a place and buy a stock, you if you continue and then you just confirm your but back the slide show. So boom This is the order form that we just went through. Market price and limit price. The next thing is the bid and ask. So this is what's happening in behind the scenes. So let's say that are basically last executed. Price was at $20. Okay, and we have somebody that has a limit order for $10. They want to buy the share at $20 they're willing to buy 10 of them. So that's their order. It was Tesla's 10 shares, $20 limit order, good for however long. That's what the market looks like right now. On the other side of it, we have people that are asking $21 for 10 shares were also people that are asking at $22. They want to show Self five shares $23. They want to sell 10 shares. And so what happens is we have a difference right now. We don't have buyers willing to sell it. 20 and sellers willing to sell a 20. We don't have that right now, So the last quarter prices $20 and the cheapest anybody is willing to sell it out right now is $21 so as of right now, no trades would be executed, however some he puts in a new market order for this, and we have somebody willing to sell at 21 somebody wants to buy right away. If somebody placed a market order, it would close that order at 21 and our new market price would now be 21. If somebody wanted to sell their shares and they put in a market order, the only way they would be to sell their shares is if they sold at $20 they would only be able to sell 10 shares. If they wanted to sell 20 shares, they would have to sell 10 shares at $20.10 shares at $19. Same thing on the other side. So what the market does the New York Stock Exchange? The NASDAQ? They basically hold this system and everybody from around the world can put their orders in . And as soon as two orders match up boom, the trade gets executed, and now you've bought or sold your ships. So market orders always the easiest, quickest, cleanest way to get into the market. Whereas if you pick a limit order and you put a specific number on it. The stock price may or may not execute that order, and that's the real thing here on that you need to monitor. So what's important here is that you understand how this works, because now you can see that's completely influenced by supply and demand. As everybody is trying to sell their shares and trying to sell them at lower and lower prices just to get out, the value of that share is gonna drastically plummet. But if everybody wants to buy into those shares, they're gonna have to spend more and more and more to get into those shares. And that's how the price of a stock goes up and down. All right, So this is the price quote that we saw earlier for Tesla for 53 99 then this is what it also looks like on an iPhone. So same information here for 54. They were taking a different times, but that is the last executed trade on that date. You can also see underneath here. We've got a chart, the shows that basically the action of the price over one month period, that's highlighted there. Underneath you get a little bit of information about the chart itself in some of the financials of the company. So we're gonna go through all of that in a later video. I'm really excited to talk about it, but now you have the basics off. What is the stock? How does it work? How is it priced? And how did the markets actually work? So pretty exciting. Lots more information. Stay tuned for the next videos.
6. Types of Analysis: What's up, everybody? Zack here and today we're talking about stock analysis. Know what I mean by that is how do you figure out which stocks to buy and sell what method of analysis and methodology do you use to decide which stocks to get into or get out of, So let's get right into it. There's two types of analysis you congenitally conduct. The 1st 1 is technical, and the 2nd 1 is fundamental. Technical analysis is using charts to make investment decisions. Now that's my personal definition of it, and that's what I think it is. Google seems to think it's a training discipline employed to evaluate investments and identified trading opportunities by analysing statistical trends gathered from trading activities such as price, movement and volume. All of that information then gets displayed onto a chart, and that's how you make decisions. So I kind of summarized it. But basically what it is is it's taking the price that the stock trades after out a certain time period and overlaying it with the volume of trades during that time period and then extrapolating information from that to gather enough information to make a solid investment choice. Either buy it or don't buy it or sell it. It looks like in practice is taking a chart that looks like this in the middle, you can see the red and white and black dots. That is the price movement over basically a six month time period. The red and black bar chart underneath that is the volume, and then the rest of the information on there is a basically extrapolation of that price movement over time. What technical analysis is is taking all of that information that's in this chart and then deciding when to buy and when to sell? Now there's lots of different patterns and formulas you can use to start to figure that out , and we're going to really deeply explore that in the next couple sections of this course. But the idea here is technical analysis is using a chart like this to make your investment decisions so usually done on a shorter time frame compared to fundamental investing from the metal analysis is using financial statements to make investment decisions. That's the Zach Hartley definition. Again, The Google definition is a method of determining a stocks really fair market value. Fundamental analysis. Search for stock that are currently trading at prices that are higher or lower than their riel value. Now what that means is, all it is is you're trying to go out and your China establish your own value for that stock and then see, with the market prices at at higher or lower and it's higher, you might want a short sod. And if it's lower, you might want to buy it so that you can make some money. So fundamental analysis is the idea of looking at the financial statements. The financial statements include the income statement, balance sheet, statement of cash flows and the conference call. Now, when we're looking at public companies, one of the reporting requirements after their I pose that they have to submit all this information on a quarterly basis, and it's really convenient for us because now we can know exactly how much all these companies make. So if we just go to Google real quick and we type in Tessa investor relations, we can go in and we can see exactly how much money this company made in the last quarter or in the last year or the last three years. It's basically all available since their i p o. And it's one of the basically big reporting requirements and big kind of burdens that a company has once they go public. So quarterly financials Q 4 19 updates So this is their pretty version of it. Basically, here's the highlights and the financial summary So highlights here. Financial summary Boom right here, So financial summary in millions of dollars. Automotive revenues Q. 4 2019 6 billion $368 million. Really cool. We now know exactly how much money this company makes. We also know that their net income or loss afterwards was $105 million. So Tesla made money and looks like the last 2/4. They lost money to quarters before that, and they made money in Q 4 2018 Now what fundamental analysis is taking all of this information that we gather from the financial statements and comparing it against other companies to see which one is the most valuable, or which one is the most underpriced compared to their actual stock value? So that's the financial statements, the other factors that you also need to consider when you're buying anything, and making an actual investment is the global and national economies. For instance, right now we're in the middle of Cove in 19 and the global economy is drastically slowing down. Everything is slowing down, is consumer spending is slowing down and people are staying at home, so you might not want to be in a tourism industry right now. You might not want to be in the airlines right now because nobody's gonna be flying. So when you make your investment decisions, things like that don't come up in the technical with the fundamental analysis. But they come up in the real world, and that's where you need to pull that experience and that knowledge into every decision that you make. After that, you've got the industry in the product. So if you're in oil and gas company and the price of a barrel is drastically falling, you probably don't want to be investing more money into that industry and into that product line. You also have business models, so Google advertising, all they do is consistently run ads online, and it cost him absolutely nothing. Other companies that, like Tesla, they have to sell in produce cars and hopefully sell them at a margin. It's a little bit more of a difficult business model, but still lots of potential. But what you might want to think about is what types of business models do you want to be? A. Do you want to be in recurring revenue ones where cash flows fairly stable? Or do you want to be in consumer products where it's completely safe? Cyclical. Based on how good your product is that year, it really depends. Are the factors you might want to look at our management? Does that team have any actual experience executing a business model like this? Trends and social impact? Are they in line with the trends? Are they finding against them? And how good are they for the environment? Last ones are regulations. If you're in the cannabis industry, for instance, you are completely governed and regulated by the Canadian or U. S government. You need to abide by all those laws which is going to cost money. It's gonna cost labour and it's gonna cost ah, lot of resources to basically just fit within those regulations. The last one's competition, How saturated is this market? Is it easy to rip off. Do you have lots of competitors? And are there substitute products that people can buy a few hours is too expensive or not working? Those are all things that you want to consider because they are factors that will not be shown in the financial statements, and he will not be shown on the charts. All right, value both, and we should put this into slide show mode, the valuable. So this is where things really separate one from the other. When you look a technical analysis, you can look at those charts on any time frame. So this is what day traders use when they trade by the hour. For instance, this is what people use when they trade by the day or the week or the month, for instance. But over the longer term on the technical analysis doesn't help us much because it's more governed by earnings. And that's where the fundamental side of things come in. Now the advantage here is that you can use the technical analysis to find the perfect entry point when you've identified a stock that is basically you want to get into. That is good value right now, so you can wait on hold off on your decision until you find an entry point using technical analysis to get into one. We've identified using fundamental analysis, and that's how you improve your returns by combining them two together, you also need to basically understand both of them. If a company's making money, you need to understand what the ratios are so that you can compare it and use it in comparison between other companies. There's also lots of other factors that you need to consider. And both of these using both of them together as well as your real world experience with what's actually happening is going to give you the best, best, best, best investment results. So stick with us. We're going to dive into technical analysis as well. It's fundamental analysis in the next couple videos, and we're gonna go on a deep dive into what it really means to analyze the stock. So stay tuned
7. Price is King!: What's up, everybody? Zack here and today we're going over technical analysis with a focus on price. So let's get into it. Technical analysis is using charts to make investment decisions. What that means is we're taking the price on the volume data from that trading day. We're putting it onto a chart with the rest of the trading days, and then we're going to extrapolated as much information as we can to make a buy, sell or hold decision. So what does this look like? And how do we get into it? Well, before we start, we need to talk about a couple of definitions. The 1st 2 are bull and bear. Now, these kind of unique terms. You're only gonna hear them on Wall Street or CNBC or Bloomberg, but they're extremely common in their way of defining and describing the market. So when we talk about a bull, we are talking about the animal. That's what it represents. And when we say it, we're talking about a bullish market or a bull market, and what that means is that the market is going up. We're seeing a trend line from low value, toe high value. We're seeing and accelerate. Over time, we talk about bear markets or bearish markets. We mean that the market is going down and means we're losing value. We're going into a recession. We're going into a depression. Something bad is happening, and the value of that stock or those stocks are driving down. Now the only reason and and the only way that I could do some research on this. I typed it into Google to figure out why it's called The Bull and the Bear. The only information I could find us, that the Bulls tops their horns up and the bear swipe their paws down. Kind of unique and interesting. But it goes back a long ways, and everybody uses these terms. And it's also the reason that there's a bull on Wall Street. So that is why that there's a giant bowl sitting in the in the middle of Wall Street. It is there to represent, hopefully a market going up over the long term, and so far it has were definitely in a little rough, rough spot right now with Cove in 19. But that's okay. That's why there's a bull in New York City, and so when you hear somebody say it's a bullish market, It's a bull market. We're doing well. That's a good thing. If something ever says anything about a bear, it's definitely a bad thing when you're talking about stocks. So how do we look at price on the chart? This is a really good point right here, so because it's different, Um, I took a screenshot of my Tesla shares on myself on the other day. Over one month time period. The price was for $54 this is what it looks like. We can see the price chart on the right hand side here, 7 86 down to 4 55 And this red line is representative of the price over that one month time period. Now, how do they plot out this red line throughout that period? Well, they take the closing price at the end of each day, and then they take the closing price of the next day, and they just draw a line in between them. They draw a line to the next one. And that's how you get peace. Basically spiking line that goes all the way through Tesla for the last month that is the price action of the last month. Now, this is really good. But for instance, if we started here and the price went way up and way down and then closed right here, you would never be it to see that kind of information on this chart. So stock traders and investment guys have developed a little bit of a different system and it's called the Candlestick or or the Real Body and Shadow Method. And it looks like this. So it is this funny looking thing on the right hand side here, and every candlestick is willing to call these. Every candlestick represents one period. So if you're looking at a 30 day period, kind of like what we just did A Tessa, you would see 30 of these candles. And instead of it just being one line, you would see this candle here as that one day time period. How it works is your opening price is where the candle starts and you're closing prices where the body of that candle. And so if you start a tent and you finish at eight, it's gonna look like this. If you go the other way, it looks the other way. But what's interesting about this is if that price goes above or below the opener. Close price. Throughout today, it appears as this line on the top or the bottom. So if we start at $10 we go up to 15 we go down to five. When we finish at 12 you're going to see a body of a candle that looks like this. You see a long wick on the top and a long wick on the bottom. And what that does is it shows you the entire price movement throughout the day, but where it opened and closed at so a really good example of this and the bullish and bearish concept is the apple chart. So this is really nice here. We can look at this Apple stock price right here. It started at around $150 it finished at $300. We're looking at a time period of January 2019 to January 2020. So one year time period and the stock has done phenomenally well. It's up almost 100%. We've got a clear trajectory where the stock is going from the bottom left to the upper right, So this is a 100% bullish stock were in a bullish market. When we look at this, this is completely bullish. So we use those terms to just get identify whether the stock is going up or down and talk about the market in general. And this is the perfect example of a bullish stock. We can also see all of the candlesticks inside of here. So when we look at June right here, we can see that it it opened around that 1 70 market closed around the 1 80 mark, and we've got a candlestick on the top in a candlestick on the bottom. So we know that that price went all the way down. I went all the way up and it closed rate in that middle section there somewhere. Now it's great about this charters. It also highlights it between white and red. So when we look at these red little candle bars, what that means is that the closing price of today was lower than the closing price of yesterday. It means that the stock went down on this day. When we look at the white candles right here means that the opening price, this line right here or its story the closing price. This line right here was higher than the closing price of yesterday, which would have been this one here. So we see a white candle. It's usually a little bit better. It means stock went up when we see a red candle. It means the stock went down on that day compared to the day before. Here's a great example of it right here. So the stock opened right here at the 2 10 mark and it closed right here at the almost 200 mark, which was lower than the closing of the day before. Therefore, that candle is red. And so this helps you see that while Apple in 2019 was almost all white, they're in a clear, bullish direction. And this company did phenomenally well this year. So really good to see a really great representation of the candle, the candlesticks as well as a bullish market. So where we go So a couple more things for a technical analysis that I just want to cover a couple things that we just got to say. So technical analysis, It could be used over any time, period, all the way down to one minute. So when we looked at those candlesticks, those were representative of one day each. However, you can change the time period on any of these charts, and you can look at all these stocks all the way down to a one minute time period. So you could be looking at a stock as its live trading, and that candle is gonna be going up and down with the actual price of it. You can also extended out over a long period of time. You could look at Apple over the last 30 years and in turn, every candle in tow. One month, the same rules, patterns and and and everything applies. So it's the exact same techniques. It's the exact same systems, the exact same methodology. However, it just allows you to give a very short time frame. We're very large time frame and still get all of that information between now these rules and these methodologies that I'm going to talk about and all these skills that we're gonna learn over the next couple lessons here. Excuse me in technical analysis can be applied to any stock, any currency parent, any commodity. They can also be applied to a lesser extent, the index funds and large groups of companies. But the idea here is you're looking for trends, you looking for patterns, and you're looking for different things in these charts that you can use to signal their A buy or sell. Now the big thing here is it's never gonna be perfect. There's never one pattern that always works. There is never one strategy that always works. And if your company releases terrible financials, rate is you're setting up for a perfect trade because the charts look good. You're gonna be creeped deeply disappointed. So you need to be aware of all these different situations because anything I teach you hear on the charts is never gonna be perfect. But it is going to be, ah, signal an indicator or a nudge that says, this is a good buyer. This is a good cell. So we got lots more to come. In the next few videos, we're gonna dive into technical analysis pretty deeply. Please stay tuned and we'll see there
8. Trend Lines: everybody. My name is Zak Hartley, and today we're diving into the charts were going into technical analysis and we're looking at trend lines now. What is a trendline? Trendline is connecting the higher low points on a chart to form a line of support or resistance. What I mean by that I mean drawing literally drawing a line on the chart to establish where the price has support and my support. I mean, it's not going to drop below X amount, my resistance. I mean, it's not gonna go above X amount, so let's see what that actually looks like in practice. We're gonna look at the test, the chart. Now, this is just a screenshot of it. I'm going to go into my Internet browsers so we can start to draw on it. So I'm using stock charts dot com. You can go to the website, just type in T S L. A. And we'll pull up a chart where you can start to play with the exact same tools I'm using here. So there's the same chart that we saw in my power point, and now I'm going to do is click on the word and rotate and it's gonna let me draw on this chart. So we're talking about trend lines. We're talking about connecting the high and low points. So all I'm going to do now is start to draw a couple of lines and talking through what's going through my head when I look at this chart. So on the left here, we're coming in. We're seeing a little bit of a bearish pattern. We have one high. The next high is a little bit lower than this, and it looks like we're just basically coming into a bearish pattern. And then we hit a low point right here. Now Thistle's kind of a good sign because the next points after that are higher, a little bit lower and then higher than the previous high. Now, what that means is that it looks like we're probably seeing a trend reversal. We're going from a bearish pattern coming into a bullish pattern going out. So I'm gonna mark This is their low point at a quick glance through the rest of the chart, I can see we also have a low point over here in April, so I'm gonna draw a horizontal line right here And now I can say we have a line of support at about that $180 price level where the price has come down and tested it and it has bounced back and it looks like it comes down and tested again. So first things first I look at this chart, I say, OK, we've got support at 1 80 now what happens? So we've come in here with tested that 1 80 line and now we've got basically an upward pattern here, a bullish pattern where I'd say this stock is trading within a channel off resistance and support, and it looks like it's doing pretty good. So move this a little bit like that a little bit like that and I'd say, OK, we've established a channel here where this prices moving up and down within this channel and all of that looks pretty good. We're in a blues pattern. Even a little bit of change in that stock isn't changing the general trend upwards. That's really good. That's what we want to see here. Now, what we are going to notice here in this month here is that the price crosses back through that line of support it tested it at low. It tested again and two months later and now tested it once it bounced up a little bit. And it has crossed through that line of support and has broken the line of support. And that means that we're seeing a change in the trend. We're no longer within that channel upwards. So we have got a new trend forming. It's time to draw a new trend line. I'm gonna take my little marker. I'm gonna draw a new trend line and connect the tops here. It looks like we've got one high, too high, three high four highs where we're testing out a line of resistance right here and will connect the last low to this low here. And we've also got two more down here, and we've got a new channel forming in this stock here. So what's really great is we had a clear line where it was moving upwards. We've got a clear channel where it's moving downwards, and it's been really easy to map this out literally by connecting the dots of the highs and lows. So 1234 on the top 1234 on the bottom. We've got a clear channel, and that price is now moving in a downward trend through that channel in a bearish trend, just like where we started. Now it's kind of cool is we can see that price come down. It almost test that 1 80 level. It comes back up and it pushes up against the support level twice, and then it comes all the way back down, and it tests that 1 80 level. The price touches that $180 level now and now why this is kind of important is because in the real world, in the real market, what's probably happening is ah, lot of traders. A lot of people in a lot of investors have it set in their systems where if Tesla hits $180 I'm going to buy it just because at $180 I think you can't go wrong with it, and it's a great value company, so I'm gonna buy it, and I'm going to just leave that trade in there, and that could be what's happening. It could also be that people are making that decision that day that it hits one e But what's happening is at 1 80 people feel like it's a great company, and that's why we're seeing support established in the chart. So we're going through March. We're going through April. We test that 1 80 level, we see a little bit of a bounce back, and then we see a big movement up from 1 80 all the way to that 200 mark and then consistently up to that to 10 mark all the way through, breaking through that line of resistance and that is glorious. That is exactly what we want to see, because that indicates a change in trend. Now we're moving upwards in. The charts were out of that bearish pattern, and it is time to possibly make a buying opportunity. So we're breaking through a breaking through and we fall a little bit by a couple of percentage, almost back to 200. But that low here is much higher than our previous high, so we still have confidence. If you wait a couple more days, you're 2 10 to 20 on. The Stark is clearly established a new channel. It is time to buy that stock if you haven't already, and it's time to ride out that wave. Now, this is a really nice chart because it clears those to show clearly shows those two channels and it shows your perfect buying opportunity which is located right there. So if you had this on your chart, if you had this mapped out in your system, if you were watching this Stark every day, you would have known Okay, it just broke through that line of resistance. It even tested it at the end of May. Hear it is time to buy this stock. This is the perfect opportunity. And if you did it, you could have had returns all the way up like that, which would have bean just phenomenal. Not only that, but Tesla later have $400 just this year hit $900. So in the matter of just a couple of years, when in 2015 to 2020 you could have made at least 304 100% on your stock. So great opportunity here. Just one thing that we want to show you. In one great example, I've got one more here. That's a Shopify. This is a really great stock. It's an Internet stock out of Canada. It's basically being our unicorn. So what I'm gonna do is I'm gonna annotated and I'm gonna walk you through the exact same thing. So this one's a little bit different. Were coming in basically on a high, were coming in on a bullish trend. We're looking good. And then all of a sudden, we kind of break through this line of support and our next couple highs here are nowhere. They're nowhere near higher than they were before. So we're now trading and basically ah, horizontal channel that looks something like this. It's the exact same ideas what were in before where it was, a channel that was going vertically like this. But now it's just completely horizontal. It's completely stagnant. Nothing is happening to this price. And you know what? This just happens from time to time in stocks. If no news is coming out, financials aren't due for a while. The industry's a little bit slow. Nothing biggest happening. This is totally normal stock and just trade like this for even sometimes years. So you got to be aware of it, and when you can recognize it, it gives you a great opportunity to trade that stock when it breaks up or down. Excuse me from this channel. So let's look at what it's about to do here. This is really need to see, and it's a really good opportunity. So socks coming in, Okay, it's broken through this line of supporting resistance. We've got one peak here. We've got two peaks here and now we've got one peak, one bottom one low point here and another one right after it. So at this point here, you can clearly say we're trading within a channel. He dropped these two lines, and now you're all set to go. Another couple months goes by, you're still within that channel. And then all of a sudden you get this one big day right here. Where's my Where's my little circle tool? Yet this one big day right here that changes everything. You see, there's one big white day right here, and that is like, holy cow. We have just broken out of this channel. We're just moving up. Something's about to happen. And if you saw this as a buy signal and you're willing to put your money into it, it could have given you some great returns because this stock went from $40 to over $94 in less than a year, less than six months, this stock doubled in price. So you're getting 100% return in less than six months because you were able to identify the training pattern that this stock was in. Gerard. The trend lines on inappropriately recognized the signal when it broke free out of this trend line and then capitalize on the gains above that and you would have done phenomenally well, even if you have got in at $50 here and then it got to $94 he would have made $45 on. You're not on your $50 trade, so pretty close to 100%. Even if you got in ah, week and 1/2 after you saw that after you saw that breakthrough, you could've waited for more and more confidence in you still would have done phenomenally well. So this trend line methodology and these patterns and what you're looking for here, is connecting the highs and lows, trying to establish what channel you're in, whether it's bullish barrister or its horizontal And then as soon as you break that support or resistance, that's when your opportunity to make a trade identifies itself. So to really good charts here. Really exciting things, couple more things just to finish it off. So here's the test. The chart we looked at with the big gains on the right side. The Shopify charge here, where it went from $40 to $94 just by identifying the horizontal trading pattern and the last couple things I want to touch on her that thes trading patterns. And these channels can go in horizontal or directional patterns. You can also just establish horizontal lines of support and resistance based on price levels. Now, the more times that the price tests the supporter resistance, the stronger the supporter. Resistance is what I mean by that is, if your Tesla stock is testing that $180 price level three times and it still hasn't broken down below that 1 80 level, that's probably a very strong 1 80 support level. Now, assuming that the company is still doing well in the strategic, the strategic plan is still operating. Then you should be totally fine now, so I would be looking for an opportunity on the upside in that case. Now I do have to say that not these patterns and these thes indicators, and not always perfect. And they're not always exact. If your company reports bad financials in the middle of your trend, things are going to change. If you're bowing and you have two planes crashed in the matter of six months, things were going to drastically change. So they're not always perfect. They're not always exact, and the price levels are always off by five or 10%. So you never admit to draw the perfect line that connects all the dots. Exactly. So what you're looking for is patterns and channels and trends here, and then China identify the trading opportunities based on when it breaks through those support and resistance signs. So if you have any questions, send me an email. Is that hartley at hotmail dot c A. Otherwise, I'm gonna dive into this, and I'm gonna be using this tool for the rest of the videos throughout the course. So please stay tuned. This is a very important one, and you should try and practise this whenever you can't Thanks
9. Patterns: everybody. My name is Zak Hartley. Today we are going over technical analysis and we're looking at chart patterns. So in the last lesson we looked at trend lines in those trend lines helped us look at what direction the stock is going. If it's in a channel or if we're seeing a trend reversal today, we're looking at specific patterns. They're gonna help us decide whether it's a buy, sell or hold at a specific moment. So patterns using trend lines to identify patterns that could signal future movements were using the same principles we learned about trend lines and we just applying them to specific patterns that we're going to keep an eye out for. So the first pattern highlighted this in one of the last videos, but it is consolidation now. This is a completely different stock with almost the same pattern. Lululemon Athletica In 2018 we looked at it for 12345 months. Where was pretty much in consolidation the entire time, bouncing up and down within a specific price range of about 57.5 to $65. It was going up and down for several months before finally breaking out with 12345 positive days, which for experiencing about 20% to 30% growth over the next 30 trading days. So significant break out. And that was because we spent so much time within consolidation. If you look at this stop with stock, we tested the top of the consolidation pattern. One, almost 2345 six times was the breakout. So we tested multiple times. Same thing with the bottom of it. 1234 times were tested support at the bottom of this consolidation pattern. So we condensed for a very long time. We finally had a breakout, and we had a significant return when it did break out. Very great pattern. Just seeing definitely something you want to keep your eyes out for. However, it does take some monitoring over time to find that right by in spot no triangles is another one. We looked at this one looked at Tesla in a previous video, but this one is pretty big, and it's a really telltale sign that something big is about to happen. So he was just a simple diagram of what we can see. A symmetrical triangle basically means it goes right to the side horizontally ascending me and it kind of points up in descending me. The kind of points down here is an example of one from Tesla Inc in 2015. In 2016 we see a clear trend line going down and we can see two spots on the bottom where the price touched a price target of about 185 to 180 $83 bounce back up. And it did it again in January and did it again in April. So we've clearly established supported that $185 price level, and we're seeing the price slowly trickled down there and it bouncing in between. So we're seeing a descending triangle there. In this case, we saw break out to the bullish side we saw break out over $75 from basically starting point of $185. So really good returns on it. Really good metrics. And all you have to do is keep an eye on this and see what pattern was actually going on. So the next one we're gonna look at is a double peak. This could go up or down. In this case, it's going down. Millikan A. Tesla Inc and we can see the stock price in a completely different example, hit the bottom at around $180.2 different times. So this is in 2014 and then again in 2015 we and see it heading the bottom and then moving up from there, we can see it on the other side where we can see the Dow Jones industrial rising up to 26 50 on two separate occasions before falling almost 20% down to 2150 just in December of 2019. So really drastic fall after double peaking at 26 50 mark twice, and then a huge drastic fall down over 20%. So that was a scary moment. Back in the day, we did recover from that. But we did have a full almost 20% drop in the Dow Jones industrial and the sign that recognition the hey, something's gonna happen here happened just three months earlier when we had a double top a 26 5 mark. So the next time we're gonna look at is called the head and shoulders. Now this one's a little bit trickier to pick out, but what it involves is one peak, a bigger peak and then another peak. That isn't quite as big. Basically, the idea here is this is a sign of a trend reversal. It means that we're no longer seeing higher and higher peaks in the price we're starting to see. Ah, higher peak and then a trend reversal with a lower peak. And if we see another lower peak, it could be confirmation of the head and shoulders pattern. So basically here what we're looking for is ah, stock that's moving up and then lower peak afterwards. If we see that as a head and shoulders, it could be a telltale sign that the stocks about to go down. What does this look like in practice? Well, we found Costco wholesale in 2016. This was a pretty clear head and shoulders. We had a clear trajectory where the stock was moving in a bullish pattern upwards. We have the first shoulder established in November around 23rd and then we can see the peak on December 14th where the stock rose to $155 we could see another basically little smaller peak that didn't quite goes high. What only went to $150. So that was basically the height of the two shoulders, that original high of 150 hive that was the head. And now we can still see the stock starting to trend down all the way down to $130. So if you recognize this pattern and you realize this was a head and shoulders back in the time, this would've been a great, telltale sign that if you own Costco, it was time to get out. So there's lots of patterns that you can learn. Basically what it is, though, is using the trend lines that we learned in one of previous lessons, too, basically, put together these patterns that we can start to identify as soon as they're made. So here's some that are listed here. The rectangle dependent deflate basically different versions off, drawing the trend lines and connecting them to try and decide is a stocking and go up or down lots of different opportunities again. None of them are perfect, but they can't help give you indicators and signs as to which way it's gonna go. So in summary, patted to the specific movements that can indicate a future trend, we identify them using trend lines that we talked about. They're not always perfect or exact. You could you could have the perfect shape lining up the perfect triangle going. And if your company releases the wrong results, has a big instant or the global markets change, Things can change, not in your favor and outside of that trend pretty easily. There's also lots of patterns for you to identify and try and pick up on. There's long powders we've looked at today. There's also indicators and patterns where those candle charts can be on very short time frames and very, very short candle patterns, even two or three candle pattern. So there's lots of different ways to look at it. These are just some of the main ones that I wanted to highlight on in this course so that you're aware of them. You can always deep dive into any other topics that I'm talking about and go a whole lot further, though, so this is just kind of the introduction to all of these major topics so that you have ah, basic understanding of how to invest when you make those first trades. Thanks for joining.
10. Volume: What's up, everybody? My name is Zak. Hardly. Today we're looking at technical analysis, and we're focusing on volume. So what is Void? Farm is the number of shares traded within a given time period, and you can look at it as the shares traded on that time period. Or you can look at it as an average trading volume over the last X number of days those two ways that is commonly represented. And there's two reasons you want might want to consider looking at the volume when you're investing and making traits. Number one is the quantity. Now here's a stock price I pulled from Tesla Inc This is literally off Yahoo Finance today it is April 7th, and they traded 17 million shares today have an average trading volume of 21 million shares . That means 21 million shares are being traded and executed on a daily basis. Now, if we look at another company, this is one of Canada called Mind Met. It's a little biotech pharma companies small little off it here in Canada, and their volume is only 402,000 shares per day. So it's less than 1/30 of what Tessler is, and why this is important is because if you treated Tesla and let's say it's $300 you put in a trade to execute, you're probably gonna execute out of trade within one or two pennies of Tesla. So not really a big deal, because there's that much volume going back and forth so you can execute that trade easily . When you go to treat a small little biotech company or a small though startup that only has a couple 100,000 shares trading per day. What it means is there's less volume. So for you to execute your trade if you want to buy a couple 1000 shares for you to execute that trade and may not execute right at 40 cents where were quoted today and may execute at 41 42 43 cents because there's just not a volume to fill your entire trade at that given price level, so you may have to pay more, you may have to pay for it in chunks, and you may. It may take longer for you to actually execute that trade. Now, the reason this is important is because if you're two or three cents off on Tesla. That's at $300. It doesn't really make much of a difference, but if you're two or three cents off on a stock, that's only 40 cents. That's 2.5%. Excuse me for every percent that that changes, that's a big difference. So it's one thing to keep in mind because it really comes down to liquidity as well. Can you get out at the price that you want? Stock is generally considered very liquid, but you do need a little bit of volume on that trading day in order to get the price that you want. Now what I mean by liquidity is the ability to convert your asset into cash. So if it's a stalking and traded on the market, that exact date pull out that money you converted into cash very easily. It's a very liquid asset and comparison. Real estate is not a very liquid asset for you. To sell your real estate, you have to put it on the market. You have to get people to come Look at it. You have to get a bid. You have to make a contract, you have to close a deal. It takes a while to sell your real estate and hopefully you get the price that you want. There's no quoted market that you can actually go to, so it's considered a very illiquid asset Now. The reason I bring this up is because those larger companies are going to be much more liquid and the ones with higher volumes will be much more liquid, allowing you to get better trades at the exact price that you want in comparison, a couple cents off the best. While you can also help you figure out if a trend is confirmed or if it is a little bit iffy. And what I mean by that is you can look at the volume and the changes in volume each day to say, Is this a strong movement in the stock? So when we look at it, apple, This is taken up to today, April 7th and we could see a clear bullish trend all the way here until February March. And then what we see is the stock absolutely drops off here around April from looters at February 22nd February 24th kind of mark, we see 123456 really strong down days that finishes the stock and around the tuner $50 mark . Now this is really important, because what you want to figure out is, Is this just a dip where I should buy on the weakness? Because I think it's gonna go up? Or is this a fundamental change in the trend of the stock and how we're going to decide that is by looking at the volume. The key here is that when the volume increases period over period, it means that the trend is confirmed and it's strong. If the volume decreases, it means that the trend is not confirmed because it's very weak. What I mean by that is, if the stock goes up by five or 10% and not many people are buying it at the five or 10 percent increase, it could be because they don't actually believe it's actually worth five or 10% more, which means it's never gonna be worth 15 or 20% more. However, if that stock goes up by five or 10% and the volume drastically increases, it means people really believe that it's probably worth that five or 10% more, and it could keep going that way in the future, especially if more people start to believe that. So that's the fundamental principle of what's actually happening in reality here. So when we look at the stock, we see the end of February here, the stock completely drops off and the volume drastically increases from about 30 million to almost 100 million shares per day. We see a direct correlation. The stock plummets, the volume drastically increases. What that means is, I think we have some issues here. I think we're seeing a trend reversal. I think we're starting to go the other way. I think that this stock has fallen, the volumes drastically increasing. That means that we could be seeing a strong downward trend here. So we come all the way down. We had this to 59 mark and then we see 123 positive days off stock actually increasing in price and in correlation, we see three lower and lower and lower days in volume. What that tells me is this probably isn't another trend reversal. This probably isn't the stock drastically changing directions. I think it's going to continue to go down because it just doesn't have the volume and the strength behind it. And that's exactly what happened. So the star continued to go down for the next basically 15 20 days here, and from that point we can see a basically consistent increase in the volume levels out around the kind of $75 million mark here. And then again, right at the end of March, we can see the stock price start to increase, start to increase, and we can see that volume decrease again. We see it drastically decreases. You know, that price starts to Ingres, and it tells me we're probably not seeing another trend reversal here. We're probably gonna be trading horizontally or we're gonna continue downward for at least a little while unless something drastic happens. So we get to the end of the chart here in a kind of bottoms out, and we have a lot of movement on these last two days here. That's mostly because of the Kobe pandemic and how it's ravaging the US right now. Nobody really knows what's gonna happen, especially as China starts come back online and it feels like the U. S. Is falling off the edge with this covert thing. People are really trying to figure it out. What I also want to point out is as soon as there was unsettlement or unease in the market , what we've saw here at the end of February all the way to today the volume has almost doubled. I find this really interesting because it means more and more people are making trades in and out of the market. I think from the point here toe where we're at today, we've clearly seen a lot of red days. That means more people are selling than they are buying. So I think it's gonna be a tough little right here for Apple. We could be seeing a break out of the trendline, the support line that would basically connect from here to the talk. But we'll see. We'll see how this goes. We had the same volume is yesterday and a drastically lower closed in the open today. So not a great sign, but we'll see kind of where we end up. So I'm definitely keeping my eye on this chart. We've got high volume right now, but all of the trends between the price and the value or pointing in a downward direction. So just to summarize you volume to make sure that you have acquitted in your trade and you make sure you can get in and out of your trades that accurate prices and the level that you want. You do that by just either trading stocks with at least a couple 100,000 trick shares traded per day or knowing that you may not get to get the price you want. If it's any lower than that, secondly, an increase in volume signals that it supports the trend that's happening. A decrease in volume does not support the trend that's happening. So if a stock is going up and the volume is increasing those air to good signs, if the stock is going down and the volume is increasing, you probably about to see this stock continue to go down at least over the next little while, so anything can change. Nothing is perfect, but this is the tool. Even used eggs just give you one more signal in your decision off should you buy, sell or hold this stock so lots more to come. Thanks for doing
11. Moving Averages: What's up, everybody? My name is Zak Hartley, and today we're looking at moving averages. So what is the moving average? Well, it is taking the price and then averaging it out over X number of time periods. And it's represented on the charts as a line. And it's a really simple to literally. It is just one line on the chart that either goes up or down, and what it's used for is to identify, buy and sell signals and to show the general direction of a stock and help us identify when stocks are correlated. So what I mean by this? Well, if we look at an Apple chart here, this is over one year time period. We can see a blue in a red line coming in right here. Blue line, red line and what those are is the moving averages. So the blue line is a 50 day moving average, and the red line is a 200 day moving average. So if we take the price right here at 2020 January 1st, it's right around that $300 price mark. Now, if you average that price out over the last 50 time periods, That's the blue line. So what this is saying is that the average price of the last 50 time periods is about $265 the average price of the last 200 time periods is about $220. And all that's doing is showing you the average price over the the last time periods on this chart. It's 50 and 200 days now. How does that help us? Well, it can show us buy and sell signals, the buy signals or when the price crosses above the moving averages, such as what happened in June Here, This is a buy signal. This is the price crossing above the 200 day moving average and then the 50 day moving average. This is our buy signal. We also have another bison here when the moving averages crossover each other. When the faster mover moving average crosses over the slower moving average, that is a buy signal. That is a show that the trend is reversing in the stock is going up, so we have one by signal. Here we have one by signal. When the stock crosses above both of these moving averages, so three signals altogether. Great. Look there. And if you would have executed on this trade, you would have gone from about 192 over $330 at the peak. Now it can also show us cell signals. Those cell signals are the exact same, but in reverse. So when the stock price crosses below the 50 day moving average, that is a cell signal. When the stock my stock price crosses below the 200 day moving average like it did right here, that is a cell signal is Well, we can see that it's bounced back here, but the two moving averages are coming close together, so it's pretty indecisive. But we did get one to sell signals here. However, we did have a great run from June of last year, toe basically February of this year. So depending on which signals you picked up, this would have worked out great for it. But we had by signals in the beginning. We have cell signals right now, and this is upto April 13th of 2020. So pretty exciting chart here. Next one, we've got to the Dow Jones Industrial over the exact same time period with the exact same moving averages so we can see coming across the top here. It is almost consistent and steady the whole way through the prices, mostly above the 50 day moving average. It kind of bounces off the 200 day moving average a little bit. It tips in June here, but it comes right back over and pretty steady, consistent trading all the way through, up until we got to February, March, April here and we can see the price drastically plummet through the 50 day moving average and the 200 day moving average and go all the way down below 19,000 points. It's starting to come up, but we're definitely not there yet. The reason I want to bring this chart up is to show you that these moving averages are great for showing long trends, but they're not great as showing short term drastic changes. What I mean by that is the price cross below the 50 day moving average. If you would have traded on that, we probably would have done phenomenally well. He would have saved yourself a lot of money, But if you didn't trade on these two first by signals here. And instead you waited for the 3rd 1 here, you would have basically sold your stock rate at the bottom. So you have to be careful how you use these indicators and the timing around each one. The moving averages aren't quite as short term, consistent, but they are super long term. As you can see here, one more chart I want to show you is Google. Now, this is kind of a similar chart. We have steady, consistent growth all the way leading up to February, March of 2020 and then we have a drastic plummet. Down below are 50 day and 200 day moving average. Now, excuse me, The reason that I wanted to show this chart is because I want to show you how closely related these three stocks are. So we've got Google. We've got the Dow Jones industrial, which is actually an index of 30 different stocks. And we've got apple now. The reason I bring this up is because all three of these stocks are moving in almost the exact same pattern. When I scroll through them, you can see that it's a bullish pattern all the way to February March, and then it drops off drastically going through the 50 day and 200 day moving averages on all three stocks, including Google, right here. Now, the reason is because the entire market is moving similarly, the entire market is very correlated right now because Off Cove in 19 impacting every company. Now, however, if this was oil and gas and the price of a barrel was skyrocketing and these oil and gas companies, we're gonna make a ton of money, he would expect all of the oil and gas companies to move up. But you won't expect cool move up. So the reason I point this out is because some of these stocks moved very similarly, if you can start to pick up the trends in the Dow Jones, that's probably a very good reference off what the trend is going to be in Google and in Apple, especially if they're highly correlated at the time. So we got one more chart here. We got tested here. This is one is a little bit different. Were coming in from the left side here pretty steady and even trading. And then we see the price break above the 50 day above the 200 day, and we see the cross over where the 50 actually crosses over the 200 day moving average. So we've got one by signal, one by signal, one by signal. We got three giant by signals right here on a great opportunity to buy in in November of 2019. You could have bought in at around 3 25 with all those signals and could have road that out to over $900 on this stock. Pretty amazing just from looking at the moving averages. Now, they took a pretty drastic fall all the way back down to about 3 50 But now the stocks trading at about 6 50 And I think as I filmed this, it's almost 700. So pretty amazing example here. This one looks a little bit different than the three that we looked at earlier, because it's a little bit of a smaller company in comparison to Apple and Google. But a great example of the moving averages where we see the price cross over the 50 day, the 200 we see that crossover of the actual moving averages. Those three strong buy signals, and you kind of rolled that out toe over $950 from 275 maybe 250. So pretty amazing and a great example. Now, somebody for this lesson. The moving averages help us show the general trend there a little bit slower than some of the other indicators. But they're great as just a visual observant for what's happening. They do provide some by itself, signals those by signals. And when the price was moves above the moving averages and when one of the moving I would just crosses above the other one itself, the buy signals of the exact opposite. If the price jobs below any of the moving averages, it means we're seeing a trend reversal now. Some stocks are highly correlated. For instance, Apple and Google and sometimes Amazon. They all trade very similarly to each other and to the Dow Jones. Other companies, like a biotech company, is not going to trade anything like Apple, Google, Microsoft companies like that. So what you want to do is try and find a stock that you're interested in, find two or three that are also correlated to it, so that when you can see you think there's a goodbye opportunity for your company, you can check the other ones as well, and it basically reinforces your assumption in your ideas. Now. Some stocks are highly correlated, but the amount of correlation can change over time. Right now, all of those tech companies that I mentioned Apple, Amazon, Google are all being affected fairly. Similarly by Cove in 19 as soon as Cove in 19 is over, the correlation between those stocks could change. It could lessen, and we could be back to kind of business as usual. So the amount of correlation between these socks changes based on what's going on in the environment, and that's something you need to be aware of as well. But we can use the moving averages toe look at the general trends over the long time periods such as one year to see. Are these stocks moving in sync with each other? And if they are one of the next steps, we want to take so lots more to talk about, stated
12. MACD: What's up, everybody? My name is Zak Hartley, and today we're going over one of my favorite subjects. Technical analysis, using the Mac D indicator. So what is the Mac T? The Mac D is a moving average convergence divergence. That's what the letters mean and is. It is a technical indicator that we use when looking at our charts toe, analyze a stock and decide. Is this a buy, sell or hold? So how does it work? A. Uses two different moving averages and plots them on a chart to determine the trend. A moving averages, taking the closing price of a stock over the last X number of periods and averaging that out. If you take one. That's a short time period, such as Nine days. One. That's a long time period as 24. You're going to see differences in those trends, and that's what the Mac Dia's. It also uses a hist a gram to show the difference between those averages. So from one line changes and the other dozen it shows that difference. And the idea here is we're going to use this tool to try and identify, buy and sell opportunities. So when we look at our first chart here. We've got the Dow Jones industrial average on a daily time period over the last three months Here. What we can see is the price comes in on the left hand side here. It's pretty steady around that 29,000 point level, and then it drastically falls toe just below 19,000 points. A pretty significant downfall here. Pretty drastic movement here. And then it finally comes up back to about that 20 to 22 6 mark. So what we're gonna do is I've added in the Mac D indicator to this chart. I'm first gonna walk through it and then I'm gonna analyze it and see, could this have given us any signals as to what was gonna happen? So as you can see here, we've got a black and a red line. These are are moving averages. The red line is the longer moving average. This one is based on 24 days. The black line is the shorter moving average. This one is based on nine days. So as you can see, that red line is a little bit smoother, a little bit more gradual. Whereas that black line is a little bit more choppy, a little bit bumpy all the way down, especially in this area here. And it moves a little bit faster up and down than the red one does. You can also see the blue hissed a gram. Here, this blue hissed a gram represents the difference between the two. So, for instance, the gap between the red and the black is very large. Here, As you can see, a large blue hissed a gram. Here, thedc app over here is much smaller. You can see a smaller blue bar over here. So what that blue line does is it represents the difference between them and where the buy and sell signals come in is when those two lines cross over each other. So when this black line crosses over the red line, that is a buy signal. When the black line crosses below the red line, that is a cell signal. The reason is because that black line is a faster moving average, so it is Mawr, susceptible and sensitive to the price. When the price drops, that line drops very close to it. Now you can imagine with the red line it's a longer moving average. So when the price starts to drop, that red line still kind of comes along and then slowly starts to trail it. The idea here is you've got that red line. That's kind of your steady trend. And this black line that shows you the very short term trends. And so when those lines cross over and that is your buy and sell opportunity So we're going along this prices super steady here at around 29,000 points, supercedes stupor steady. And then all of a sudden, here we see a break break away on the 24th. Here we can see this basically Candlestick really separate from the rest of them, and it approaches that 28,000 mark. The next one is a very drastic drop and basically breaks all the way down to 27,000 points . If we look at our Mackey indicator, we can clearly see we've got pretty steady, were slightly above the zero line and then we go just below, you'll just blow it. And then we have 12 big days where those blue hissed a grams drastically increased downwards. And that means that the short term moving average. The black line here is pulling away and moving away from the red line, which is our longer moving average. What? That tells us as we're no longer in that consistent pattern anymore, and we're starting to see a trend change. You can tell from the price a little bit. And the Mac daddy is there to basically confirm that now, when we see this and we see the black line completely separate from the red line, basically cross so that it's underneath it and that is our sex cell signal. So if we were to execute on this trade and we saw basically big separation right here, where the black Linus separating from the red line, the hissed a gram is going negative. The history and bars are increasing. Those are all cell signals to us. So if we had sold this, we would have sold on either one of these two days here, and if we held it for two weeks, we would have done extremely well. No, that's our cell signal. That was our indication that this market is about to turn. That's the indication that this market is going down. So we follow that all the way down and we can see that it only gets bigger and bigger and bigger and a red line in our black line both trail all the way down and down and down. And then we get to March 23rd and something magical happens. Something crazy happens where the black line then starts to come closer to the red line. That happens because on the 23rd we stopped falling, and on the next day the price went up. This means we could be seeing a trend reversal. We could be seeing. Something happened here on the next day. We saw the black line increase even closer to the red line and our and our history, Graham, are blue bars here are drastically decreasing. This means we could be seeing a trend reversal. And then all of a sudden, on basically 8 March 25th 26. Here we see the almighty signal where the black line crosses above the red line. That is our buy signal. Ladies and gentlemen, that is the time where the Mac D is saying in all of its glory This is the time to get into the stock. This is the time when the short term moving average has crossed above the long term moving average. This is the absolute best signal you can see from the Mactan, and it means buy the stock. So if we had bought the stock right here, we would have bought it on 123 of these days. I would have done OK going forward. This is actually up to date. So this is the exact what the chart looks like right now. So we'll see kind of where it ends up. But if you bought when it crossed over, you would have done okay right now, if you had bought win, that line had just started to come back towards the red line, you would have done even better. So great tool here. This is just one example because it was a very clear explanation of those lines crossing. I want to show you what else that looks like in the real market. So FedEx right here, This is a really cool indication. We can still see the price coming in a little bit steady for the first kind of a couple of months Here. This is a 2.5 year timeframe I believe the price starts to fall starts to fall, and we can see that Basically, Mac d coming all the way down here. Now we see the black line cross above the red line right here as that start stock price comes, starts to come back up, But again, you can see it. Cross back over right away. Now all of the sun here we get to the low This is our low point here in February of 2016. This is where the stock is just kind of sinking. Now, if we're looking at the Mac D, we can see it clearly cross above here at an even lower point than it did the year before. They crossed above at an even lower point and about February to March of 2016. And this is our indication of a by this is the ultimate Mac D signal saying buy this stock because the short term average has crossed above the long term average, which means we're starting to see a trend reversal because those first couple days are starting to break through the last trend. So if you had bought on this stage, you would have bought in and around the 120 $125 mark at the absolute latest, and it rode the way all the way to $180 before ever really making a significant cross back over. So really great indication. And we saw this come all the way down even lower than the time before, which means that had even more strength. Now, on the opposite side, we're looking at this stock a couple of months ago. You can see that this maki is just drastically coming down and down and down. This probably isn't a stock that you want to be in, but if you've crossed above and it didn't quite make it up, and then you go even lower and you cross above again. That is a very strong sign that this could be a by All right. One more example. We've got Microsoft here. This is a big one. This is the company of the last little while. So pretty exciting. We're looking at it from 15 16 17 and just a little bit of 18. So, on a long term chart here, I'm also looking at it weekly. We had a lot going on here. So the reason I wanted to point this out is because we went through November, December, January, February, March, April, May, June, July of sake, nations. So almost 678 months rating here of stagnation where the price did almost absolutely nothing. It bounced within this channel a couple of times and it didn't really do anything. We could annotate this, and I could put a horizontal line all the way across here and across here and say, We're trading in a channel very easily. This is classic consolidation of the stock over basically a 678 months time period. And then what happens is we see this massive break out right here on this day here in July of 2016. No, it's a great signal shows we broke through trendline. That's absolutely fantastic. That's your first buy signal. His second by signal, though, comes from the Mac D. If we're looking at the Mac D right here, we can see a consistent trend line downwards, which kind of makes sense with the consolidation. Nothing's really happening. So they're basically going back to the zero mark, so it comes all the way down. It comes all the way down. And then we see a very clear breakthrough of the Mac D, where the short term moving averages cross above the long term moving average and we ride that all the way out. Now this crossover right here this was the bite signal. This was the Mac D saying It's time to buy this stock. It's time to get in because you've got a great opportunity here. This happened just in the first week or so July right here. If you have got in, he would have got in around 47 $48 kind of wrote it to 91 super easily as the Mactan basically just consistently drifted all the way up. And if you look at it today, it's still drastically Well, not drastically. It's still a little bit above that long term moving average. So we're still seeing gains. But if you just watch this stock for a couple of months and then you saw okay, Boom, I got a trendline here. This just broke through right now and I've got confirmation through the Mac D. That was a very easy trade for you to say and have confidence in saying, Okay, I'm gonna buy Microsoft. I've got a couple of good signals here. It's time to execute my trade, and you wouldn't road that to 100% profit. So the Mackie is a super strong indicator. It works very well. Andi, there's every trader in the world knows about. It uses it on a daily basis, and it's definitely one of the most popular indicators that you can use. So in summary, the Mac D is used for buy and sell locations. Any time that those lines crossed over each other, that is your buy or sell opportunity. If it is all the way in the negative, the black line crosses over the red line to short term average crosses over the long term average. That is, the clearest buy signal you can possibly get is by far. One of the best indicators is also the most widely used, so it's a very popular months. Professional traders. Now it shows the trend reversals by displaying different moving averages. That's what we've talked about this entire time, and that's the big thing here is you're looking at moving averages over different time periods to identify trend reversals and give you signals for buy and sell, so that instead of just looking at the candlesticks, you can use math and equations to actually figure out. Is this the right opportunity to buy or sell this stock? So lots more information? You can dive into this a little bit more, but lots more to come. This is just one of the tools in your tool about when your stock trading, and this is by far one of those popular, one of the most reliable, and it's definitely my favorite. I use it on every chart I look at, so lots more to come. Stay tuned.
13. RSI: What's up, Everybody exact. Hardly here today. We're looking at technical analysis using the RSC indicator. So what is the RC? Well, it stands for relative strength index, and it is an indicator that we're going to use when trading and looking at our charge to determine whether or not we should by yourself. We use this indicator because it shows momentum and a stock. So if we see a a trend going downwards or we see a trend going upwards, it shows us how much will mentum. Um, how how much support that that trend actually has? It does this by showing whether a stock is overbought or oversold on a scale of 0 to 100. And using that scale, we can determine different buy and sell signals. I've got the formula for the actual calculation up here on the right hand corner, but you don't need to know it when we look at it. In reality, this is what it looks like. So I've got Apple incorporated up to today's date April 8th, and this is the RS I on top here so we can see to horizontal lines at the 70 and at the 30 level this is the scale 0 100 at 70 and 30 we see two lines. The bottom one represents the oversold line, and the top one represents the overbought line. When the line, which is the RS I indicator this squiggly one here, when the RS I indicator goes above into the overbought line, it means that your stock is probably overbought and it's running out a Momenta. When it enters that oversold line, it means that your stock is probably at a discount. It doesn't have much momentum to keep going down, and it could be a good opportunity to buy. So what we're looking for is the movement of this line inside and outside of these two channels, the 30 and the 70 zone. So when we look at Apple here, the stock is rising, stock is rising and the RC indicators showing a pretty consistent kind of inside and outside of this overbought zone. And then we see a sharp drop off right here where the line exits the overbought zone. That is our settle signal that is Theo RC indicating to us that it might be time to get out of Apple. That is the perfect example of it saying, Okay, this is your time to sell this stock. And if we had done that, we would have sold at the end of February Here would have saved ourselves a loss of about 30 to 35%. Now, if we look at another stock, this is testing Incorporated in 2019. We can see a clear, bearish pattern where the stock is trading lower and lower and lower the R s. I is basically in that lower channel of the inside trading range for the RSC on, then dips into that oversold zone rate. Is this stock really just kind of plummet straight here we can see the RS. I indicate that the stock is now oversold. And when that oversold period ends and the RC moves back above that 30 line, that is our buy signal. That is the RS. I saying it is time to get into this stock. The trend has changed. It is no longer oversold. It is going back into the regular range. And the Mo mentum has completely changed. So if we had done that, it happened right here at the beginning of June. Who could have got in in the first day or two here, and we would have made it all the way up from under $200 to 329. So you would have made about a 60 to 70% return just by going off purely the RS I indicator right here. So a great tool for us when we're holding a stock. And when we want to get into a stock to figure out those buying cell points, especially when used in combination with trend lines in the Mac D, the RSC shows us the mo mentum whether or not this stock is overbought, oversold and whether that momentum is changing. So in summary, we used the RC to make our buy and sell decisions. When we want to get in when we want to get out, we buy when it is exits the oversold zones. When the arse I line is down in the bottom, it's below 30 and it crosses above 30. That is our buy signal when they are size trending up and it crosses below the overbought zone and that is our cell signal. That is the RS. I saying Get out of that stock showing the mo mentum in that stock, changing from coin upwards to a downward direction, a bullish to a bearish direction. And that's what the RNC is there to do there to tell us that based on the mo mentum, so lots more to come. This is just one tool that you want to put onto your belt. We're looking at these charts and you want to use it in combination with all the other tools that we're talking about in this course. So stay tuned. There's lots more to come, and we're going to start combining everything here shortly.
14. Using Indicators: What's up, everybody? I'm Zak Hartley, and today we're gonna walk through a trade using all of our indicators. So which ones were going to use today? Well, we're going to use trend lines that we've learned how to draw. We're going to use volume. We're going to use the Mac D, and we're going to use the RSC to basically look at the stock and analyze. Do we want to make a trade? So the stock we're looking at today is Tesla. Now, this is the first chart that we're gonna look at in. This is over the long term on the one thing I want to point out here is right now we're gonna look at 2019 as a year and analyzed if we would have made a trade in there. But I pulled up the long term chart because whenever you make an investment, whenever you look a stock, whenever you look at anything, you want to look at the big picture first you want to look at the last five years and C is this trending up or down and then sort of narrow it and from there, So we're looking at test so we want to get into the car industry. I pulled up a big basically 1234 year chart, and what we've seen here and what we're identifying is a big area of support at that 1 80 level that was established back in 2016. So the chart that we're looking at today that I want to use that as an example was looking at the year 2019 and iodine identifying when was the best time to get in. So we're looking to tests up. We've got our price coming in here, and we can see that the prices coming in from the left side it's a little bit of a bearish pattern, and then it dips drastically. In May 2019 it comes down and it bottoms out right around this point here in June, and just it just so happens remarkably that it's right at that 1 80 level. Now. What's cool about that is we identified it as support only looked at the long term chart. The only way we would have seen that is if we pulled it up on a big multi year chart like we did. So we identified. Support it, that 1 80 level. We're now seeing that price come back down to that 1 80 level. And now we're going to start using our indicators to see. Do we think it's gonna level off here? Do you think it's going to stay at 1 80 is this an opportunity to actually get in? So we start at the top with the RSC, we can see the are size basically trading in this middle channel here around the 30 to 50 mark, it drops below below 30 in May of 2019. That's clearly a oversold signal. And then right as we get into June here, beginning first week of June here we can see that it breaks through that oversold barrier at 30 on day. That is our buy signal. That is the RS. I saying it is time to buy this stock. So now we've got supported the 1 80 we've got confirmation from the RSC that this is coming out of the oversold zone and this is our buy signal from the on our side. Let's take a look at our volume so we can see that the low here was right before June and were trading at that kind of 10 to $15 million range. As soon as we hit that low here, we can see we have two more positive days. You'll have to zoom in here, but two more positive days of trading. And then we have a big, massive positive day of trading here, all compared to our looks. So we had Lo and then we had to hire days and then we had one major higher day. So we had three days of confirmed higher volume trading since the low. So that is a good signal, A swell, that is a buy signal from the volume. And that is the volume saying okay, this trend could be serious. This trend could have some confirmation behind it because the price is going up and we're still seeing a significant volume off trades being executed. That means people are willing to pay more for these stocks, which is a great sign. Lastly, we're going to go down to the Mac D, and we can see here the Mac D, the slower moving average and the longer moving average, or basically crisscrossing back and forth a little bit below Negative. Negative five Negative. 10 kind of in that range here. And then we can see it dips all the way down to this. Almost negative 20 zone. We can see a clear crossover of the black line over the red line. The shorter moving average over the longer moving average and a clear break out upwards. That is a clearly identifiable by signal from the Mac D. When we look at this as a whole, we've got support. At 1 80 we've got increased volume from about 5 to 10 million, up to almost 20 actually, $20 million. Right here, 20 million units. Story on the Mac D. We've got a clear cross over a below the zero line that is the clearest by sight by cell that we could possibly see. And we have confirmation on the top by the RSC. So this is very clearly an excellent, excellent time to get into this. When you extend it out over a longer period, this stock went up to $414 so you would have over doubled your money depending on when you got in here. But pretty easily if you got any, any time before here, you would have doubled your money and the stock eventually made it up to over $900. So pretty exciting. I think it's back down around 56 somewhere in there as I'm filming this today, but quite an amazing run here. And this was really simple. All we used was volume the Mac DVRs I, and looking at a long term chart to establish support. That's all we did. Would have taken something a couple of minutes to identify this and you would have doubled your money right here. If you saw bye bye bye bye. And you executed you trade in this area here, you would have done extremely well in this stock. And these are the opportunities that we're looking for now. As you can see, this type of opportunity only came up basically once this year for such a massive return like this. But thes thes opportunities, air happening all the time. So as we keep going, here's here's the main points using it all together. The more indicators that confirm your buyer cell signal, the more confidence you should have in making that trade. So if all four of those indicators line up and they say you're good to go. You are set. You should buy this stock. Well, you can have a little bit more confidence in your assumption that this stock is going to go up or that it's gonna go well, No, not all the time with these indicators. Line up perfectly or even as nicely as they did in the example that I'm using today. A lot of the time it's a little bit more if it's a little bit more 50 50. And so you have to make the decision of Are you gonna take on the risk you're gonna wait for opportunities that look as good or better than this test opportunity dead. Now being able to identify in that moment is a tricky challenge as well. And you can never be 100% sure. I keep saying this, and this is really the key here. You could have 13 indicators. Lineup. You could have everything point in the right direction. Things can change. Things can change drastically. Quick from Cove in 19 to a tornado affects your supply chain to a riot in your factory. To all of these different all of these different things can have a major impact on it. So never gonna be completely sure. But using these indicators, you can basically get a little bit of a better ideas toe. What's gonna happen with this stock and test? It is a great example of that. We're all four of them lined up almost perfectly. And we clearly had a buy signal on this stock. And if you would have executed on it, you could have easily doubled your money in a matter of months. So very exciting to see a great show confidence and lots more to go. This was just one example. I'm gonna go through several more shoes.
15. Strategy: What's up, everybody? My name is Zak Hartley, and today we're talking about your trading strategy. Now, this is definitely one of the most important lessons from throughout this entire course. So definitely stay with me here. Now, what is your goal? That's where we're going to start. And that's the main objective here. And what I mean by what is your goal? I mean, what is your timeframe? How much work you willing to put into this and how long you actually want to hold the stocks Now an answer of 68 hours. Someone a day. Trade is perfectly fine. Or if you want to hold for 1 to 3 years or even longer, it's totally fine. What really matters is what is the best fit for you. Second on, that is, what kind of return are you looking for? And the other side of that is how much risk are you willing to take? Usually when you can get a higher return, there's a slightly higher risk for that. So being able to balance both of those is something you really need to consider in your mind when you're talking about what you're going, what you're trained trading strategy is after that. How much effort do you want to put into monitoring your trades, Keeping up with the companies and really following the stock market? There's a lot of ways to do it where you don't have to do almost any research, almost any work on it, making cottages take the easy road and not have to do a whole lot or apply a whole lot of effort. And there's also ways where you can get great returns and really track the markets and specialize in a certain industry or company, and really do quite well. So lots of different options there. But you really need to kind of focus on how much you're willing to put into this. And then afterwards, what industries do you want to be in? Do you want to support fossil fuels oil and gas? Or do you want to focus on renewables? Do you want to focus on a certain type of initiative and a certain type of industry where you want to actually apply your money and specialize, or are you just looking for the best return and you're looking for the best trading opportunities? What do you actually going for And where does your heart lie? So these were some of the specifics. I mean, by what is your goal? And now we're gonna dive into it a little bit. So how do you get to your goal? Well, that comes with the plan and routine. So what is your trading plan and what routine are you going to follow to execute that trading plan? Now, the key here is to actually write it out. So what we're gonna do over the next little bit here is we're gonna go through three trading plans so that we can see what they actually look like now, depending on how much time and effort thes trading plans required, then you build a routine toe. Help yourself basically follow through on that. If you're looking for long term, real heavy, steady dividend flow, then you probably only have to analyze once a month, once 1/4. But if you're a day trader, you're going to be on this every single day. So how much effort in time you put into this on what routine you build? It's completely dependent on what your goals are and what your strategy is to get you to that goal. So first things first. Let's look at a couple of trading plans here. We're going to write them out. We're gonna look at our time frame the industries we want to be in the percent of your portfolio. You're gonna make per investment or per stock when you're going to buy when you're going to sell and any strategies you can think of to mitigate your risk. So strategy one. We're going to be a 1 to 4 weeks swing trader. We're looking for changes in the market that we can get into and get out of within a 1 to 4 week time period. To get some quick returns. We're gonna focus on industries like renewable energy, technology, pharmaceuticals and cannabis are only gonna ever invest 5% of our entire holdings into one stock at a time. So we could have lots of stocks out there up to 20 trades alive at a time, all on a 1 to 4 week time period. And we're going to buy when all of our indicators and trend lines show by signals and we're going to sell when two out of four indicators or trend lines show cell signals now. Clearly, this is a very over simplified trading plan. There's a lot more to this with return with in terms of detail into each of these points. But here's the summary is you're gonna be a short term trader that's basically trading off of indicators. You're investing 5% of your returning your focus on 45 different industries. That's a solid training plan. That's a great way to start. And now you have to build a routine that helps you capitalize on that. So that's just one option and one kind of perspective. Second perspective we're gonna look at is a 3 to 5 year dividend investor so that dividends remember, are the profits from the company coming out of the company and being paid back to shareholders based on the percentage of the company that you own. Now, the 3 to 5 year dividend investor is going to basically be buying companies that he thinks they're steady and consistent ongoing, always pay that dividend and hopefully going to increase that dividend over time because he's using that a steady cash flow for himself or herself. They're gonna invest in industries like technology, transportation, energy and consumer packaged goods. They're looking to invest 3% of their entire holdings in each position, so they could have up to basically 30 35 stocks. After that, they're going to buy on any oversold period as long as the dividend is safe. So what that means is that if a company is chugging along, the prices steadily increasing, and then all of a sudden that plummets and it goes into the oversold territory. Even though the fundamentals and the finances of that company haven't changed in that dude and it's still safe and expected to be paid out, they will increase that position up to 3%. That's what that by is saying. And then they're going to sell when the dividend becomes unsafe or the stock is overbought for over 60 days. So if that dividend ever becomes questionable that the company might not be able to afford or pay it or the stock becomes overbought and the actual price of the stock has gone drastically up for over a period of 60 days, they're going to sell those stocks and take the gains. No, this is another strategy. It's a much longer term strategy compared to the 1st 1 there focused on a different goal. They're focused on cash flow and dividend income as compared to capital gains. By getting in and out of stocks at the high end load the swing. They're also only holding 3%. So much smaller portion of their portfolio is going into each stock, so they're much more diversified. That is one of the ways that they're mitigating their risk in this portfolio. They're much more diversified so that if one industry tanks or one cos tanks, they have others that can hopefully hold it up. They're going to continually by until they hit 3% as long as that dividend is safe. And they're only going to buy in the first place if it has a dividend that they think its safe, consistent and is going to grow over the 3 to 5 year time period. And it is in one of the industries that they outlined, and they're going to sell when that stock becomes unsafe. So completely different strategy than the 1st 1 And once again we have another strategy coming up. Strategy Number three. This one's different again. So this is for a 2 to 6 hour day trader. This is something that wants to get in in the morning and out in the afternoon and make money that exact day. They're going into any stock that they confined, that they have some knowledge in that they see a trade developing that they see support on that they want to act on. What did you see a trend in the industry coming or news for the day companies releasing financials? Interest rates are changing for banks. Anything along those sign anything along those lines. So they're looking to invest 10% of their basically entire holding into a stock so much higher investment and as a proportion of their entire portfolio. And they're gonna buy when all technical indicators show by signals. And they're gonna stell when the stock approaches the next resistance level. So what that means is they're looking to get in as much as they can, and they're looking to get out at the first sign of basically resistance so that they can just capture those games and lock it in as a trade that wins them from the day because they're investing 10% of their portfolio, they're gonna be less diversified. So they have more risk, but because they're selling at the first resistance instead of an event or something else happening, they're selling at the first level resistance. They should be able to get out as soon as that stock tries to turn around right away. Strategy three would probably also be trading with a stop loss, which is basically a trailing trade that executes assumes the stock tries to turn around. So we'll be following that in another lesson here. But as you can see, we have three different strategies all written out here with same points but completely different time frames, completely different strategies, different industries and completely just different mindsets for who that investor is. So what you need to do is figure out. Are you going to be a day trader, a swing trader, a long term dividend trader? Or you gonna go with some combination of all three of those? That's the real trick here. And then you can use the technical analysis that we've looked at over the last little while to apply to those trades. So in summary, you need to clearly define your time frame and your objective or your goal. You need to put together strategy before you make your trade. So how long are you gonna get in the trades? How much you putting into each trade? What are you gonna What is going to make you buy? What is going to make you sell? What industries do you want to be in? Those are the key things that you really need to look at. And one thing that you need to always think about is this quote is always stuck with me. I think Warren Buffett said it. And he said, When you buy into a stock and the price goes down, do you buy or sell it? Well, you need to think about it like this. If you go to the grocery store and you are going to buy deodorant and the price goes down, you weren't wrong. That price is now on sale, and so when you buy a stock and you were willing to buy it at $100 it's now 80 but you've already bought it. Is that price now on sale for Were you just wrong? So think about it that way when you're when you buy and get into a stock and the price goes down. Is that stock now on sale, or did you just make the wrong call? And if you made the wrong call, you need to correct that right away. And if the stocks on sale you should probably buy more. So think about that. As as you go into the next lesson here. Thanks. Talk to you soon.
16. Stop Loss: What's up, everybody? My name is Zak Hartley, and today we're looking at stop loss. So what is a stop loss? A stop losses in order to sell when the stock hits a certain price. So let's say you buy Apple at $100 because you think it's gonna go up. But if you're wrong, you could lose that entire $100. What a stock losses is a second order to sell that stock at a slightly lower price so that if you're wrong, and if that stock goes significantly down it, close out your trade, and it limits the amount of loss that you will receive on that trade. It's used to basically mitigate your risk, and it came used over short or the long term, depending on what your goals are. Sometimes you may want to use this, and sometimes you may not want to use. This will cover that more at the end of the video. So what I want to talk through today is we're gonna look at some charts. We're gonna go through some examples of where you may want to use a stop loss. So this is Caterpillar Caterpillar. Caterpillar builds all the big excavators and plows and all the big heavy equipment that we use to actually construct buildings and roadways. So this is the stock that we're looking at. We're basically looking at it on an almost one year time period and we can see that the stock is currently trading at about $104. So if you saw this chart and you were saying Okay, we have resistance here at the 94 95 range, I think we're starting to see a reversal in the trend. We had a really low day here where it almost approached the $90. And then we've had two really strong days right here where I think we're starting to see a trend reversal. And let's say you get in here at 104 The likely target that you'd be trying to hit is up here around this 1 30 mark. We can start to see there's a little bit of supporter resistance established here by the second Green Line. So you're looking for a payoff of about $25.25 percent, 23% on on this trade right here. Now you may want in put a stop loss so that if you're wrong, you don't lose a significant amount of money. So in this trade here, you're buying in at 104 you probably want to put a stop loss somewhere in the 90 to 94 range here, maybe even slightly lower. I put it in here. It says red horizontal line so that as that stock moves once your trade has been executed, if it goes significantly down, it automatically crosses out your trade. It sells the stock that you had bought and you lock in those small amount of losses. The idea here that if you walk in the small amount of losses, you don't have to worry about seeing a big amount of losses now. The downside here is it could execute your trade early or before it actually makes that up up switch. So that's where you want to basically put that stop loss low enough that it's not going to exit your trade too early. But you want to put it high enough that if you're wrong and your entire trading breakdown is just completely wrong and excuse that trade so that you avoid large losses. So let's see what this one resulted in. Well, if we look at it basically a couple trading periods later, we can see we got in at that 104 mark and it went all the way up to this 1 25 mark before it really started to hit the resistance that we're looking at. If you had put in your basically take profit trader, if you had sold when it got into this point, you would've made your basically kind of 1 25 $20 on a on a 94 $95 or on a $104 trade story . So great return good gains and just one example of a stop loss. We're gonna look at another one, a little bit of different scenarios. So this is Apple February 2018. On about a year before that, we can see that the stock comes up here and then it basically trades within this channel for a little while. And then we get here to the beginning of 2018 and we can see this blue line is the top of our channel, and the stock clearly breaks out of this blue line with one break out. Day 234 stronger days above the breakout. And so when you're looking at this and you're seeing this on the chart and you're going Holy cow, this looks like a great opportunity. Were breaking out a consolidation. I should buy this share. This is where you might want to have a stop loss. So I put in the by market the 1 72 mark, and I put in a stop loss at 1 67 And thank God you traded with a stop loss on this account . Because you are now assisting Your trading was wrong. The stock decided to massively tumble going into this period here, all the way down to 1 55 And because of your stop loss, it stopped you out at about 167 $168 here. And it saved you from experiencing that big, massive loss. So your green line here with the input. This is when you broke out of that consolidation period. You put on a stop loss here just within that channel so that if it broke back inside that channel and executed your trade because your analysis was wrong and in this case has saved you from losing about $2025 on each share. So great use of the stop loss here on the other case who didn't even need it on Caterpillar . So in summary, the stop loss is used to manage a downside risk. It is basically a another trade that is made so that if your analysis and your execution is wrong, it basically limits your loss. You can also make it concern software so that it's trailing so that your stock losses always, let's say, 5% below the high, so that if your stock keeps rising and rising and rising, your stop loss just follows and trails in a long that's called a trailing stop loss. Some platforms can do it. Some can't now. The one thing you really want to consider here and whether or not you want to stop loss is if you're value investing and you're looking for dividends, you stretch. You want to think about this, but when you buy a stock and it goes down, is that stock on sale or was your analysis wrong? What I mean by that is, if you buy it at 100 and it's worth it to you at $100 it drops down to 80. Is it still worth it at 80? Or was your just methodology and analysis inaccurate when it was at 100? So think about that. When you're wrong and the stock goes down, were you wrong? Or is the stock on sale? And you should buy more so two different ways to look at it when the stock goes down. It all depends on what your motive and what your goals are. But you can use a stop loss to mitigate some of your wrist, and these were two examples off when they could have been beneficial, thanks.
17. Options: What's up, everybody? My name is Zak Hartley, and today we're talking about options. So what is an option? While an option is a contract between two parties in which the buyer purchases the right but not the obligation to buy or sell a stock at a predetermined price from the option seller within a fixed period of time. So what that means is, I'm allowed. Or if I buy an option, I'm allowed to buy a specific stock at a specific price before certain time period. Now what that's referred to as a contract. So when you buy any type of option, you buy them in contracts and every contract is at least 100 shares. It's always in a multiple of 100. But any time that we're talking about options and I'm talking about, let's say $5 per share, it means that I am always going to have to buy it in a contract that is at least 100 shares . So a $5 purchases, really a $500 purchase. Any time that we're talking about options, they always come in a contract of 100 that's something to be really clear about the predetermined price that we're gonna be talking about is referred to as the strike price. So if I say I want to buy X stock from you in two months at $120 that $120 is referred to as the strike price, and that's how you buy it in whatever platform you use and the period of time. Let's say it was two months like the example I just used that's referred to as the expiry date. That is when you have to buy those stocks before at that given price. So let's dig into it a little bit. The first thing we're gonna dive into is the most common type of auction, and it's called a call option with a call option. Is is when you buy it, hoping that the stock is going to go up. It means that your long on the stock or you're bullish on the stock, and so you buy a call option now, like again there in units of 100 to come with an expiry date, and the great thing about these is that you can buy and sell them just like a stock. So just like you can go in and regularly buy and sell a common share or a stock. You can go in and buy and sell your options up to and including that expiry date. Or you can execute on your trade and buy or sell that share whenever you'd like. So that's really something. To be really important is I can go in and buy an option today and I could sell it tomorrow . I could hold it for one week, or I could hold it all the way out to the expiry date, and the value of it fluctuates just like a stock. We're gonna look at that a little bit closely here in the examples we use the So the first example is, I'm gonna use my mouse here. We've got Apple at today's price of $100. Now I'm making these round numbers so that it's really simple. We'll look at actual Apple contracts here in a minute, but today's price is $100. I'm buying a contract, a call option contract with a strike price of $115. It expires on June 15th. Now doesn't really matter. We're going to say that that's a couple weeks out from now, like this is a fictional example, so it doesn't really matter. But let's just say it's 1 to 2 months out from now. So I think the price is gonna go up from $100. I'm buying at a strike price of $115 and that contract that call contract cost me $5 per share. So I'm paying $5 per share for the right to buy Apple at $115 before June 15th buying that contract in a unit of 100 shares. So this contract is really going to cost me $500. $500 is divided by 100 shares. So for this example, I'm gonna break it down on a per share basis because it's easiest to compare the benefits of buying the option versus buying the shares. And that's probably the main thing you guys want to figure out right now. So just to summarize $100 shares today. Strike price of 1 15 call contract costs me $5 for share, and it expires a couple weeks from now, so fast forward a couple weeks from now, it's now June 14th and we're coming up to your expiry date. You need to decide. Do you want to sell the option? Do you want to execute trade or what do you want to dio? So it's June 14th and now we have a price of $130. Everything looks good. So what I want to point out here is the difference between buying the option and buying the shares on what the return on your investment looks like and what the risk looks like. A. Well, that's what we're going to really dive into here. So in the event that you had bought the option, this is really exciting. It's June 14th and a couple different options, so let's just run through the math on it. You have a sale price here, $130 so you could execute your trade, and you could then turn around and sell those shares in the market at $113. If you did that, you have executed you traded $115 and that contract would have cost you $5 per share. That would have left you with a profit of $10 per share, 130 minus 115 is what you bought it at. And it cost you $5 to get the right to buy it at 115. So you profit first share was $10. Now here's Here's the really crazy thing here is we're just gonna assume that you had some extra money laying around so that if you needed to actually cute that trade, you could otherwise, you just sell your option in the market and you get roughly the same return here. But the math on this is pretty amazing. So you profit was $10 per share. Your up front cost on it, though, really was on Lee that cost of the coal contract, because you're going to buy the share and sell it right away. So all you needed with some liquidity there to execute the contract. But the actual cost of that contract was only $5 per share and you made a profit of $10 for ship. That gives you an up front cost of $5 on a return of $10 that gives you are a wife 200% you spent $5 you made 10 and you did it in a contract worth 100 shares. So realistically made $1000 on a $500 contract purchase. That's an amazing return, like, pretty phenomenal on a couple week change over here. Now, let's look at the math. If instead of buying the option, you have bought the shares Well, the sale price was $130 at the same time, apples today price up here was $100 So you made a profit of $30 on that transaction. Your up front cost on that transaction, though, was $100 because you had to physically buy the shares and outlay that cash and wait on it. You have to await over that period for the value of the shares to go up. So he laid out $100. You made 30 and you are Oh, I was 30%. That makes sense there. So but here's the massive difference is you did the exact same shared the price. Move the exact same amount. But if you had bought the option, you made 200% return on your money. And if you bought the shares you made 30% return on your money on a per share basis, and then you just spend however much money you want. So the option paid off significantly significantly higher here than buying the shares, because the reward on an option is much higher, but so is the risk. And we're gonna look at that here shortly. But I do want to point out if you had bought the option compared to the shares and this is what happened with the price, you would have done phenomenally well and phenomenally better with the option compared to buying the shares. That's not always the case, though. So when we go to our next example here, it's the same math, the exact same system. But now the price on June 14th $120 So we'll run through the option again. Your sale price is $120. Dr. Price was 115 and your call contract was $5. So you sold it for 120. But it also cost you 120. You didn't profit anything, but you also didn't make any. And your r o I was $0 basically executed the trade right at the strike price and made enough money to cover the cost. Your contract? You didn't make any money. And now just remember this price right here on June 14th is only $10 less than 130. We looked at in the last example, and you lost all of your profit. So you went from 200% to 0% on the option. Now, if you had bought the shares, it's a little bit safer and you still made money. So the sale price. We got a little blooper here. The sale price $120. The purchase price was $100. Your profit on that is $20 in your up front. Cost was 100. That means there are Oh, I was 20%. So in the exact same example where the price was only $10 less, your sale price on June 14th was only $10 less. You made absolutely $0 on the option and you made 20% by mind the shares. So the risk return is really offsetting. And if we go one more so this is where the price is. $110. So the price the sale price of that option on June 14th is lower than the strike price of the contract that you had purchased. Well, when we go through the option, things really aren't good. You can't even execute that trade. It's not worth it for you to execute that trade, because you would be buying it at $110 then selling it. The story would be buying it at $115 then selling it on June 14th at $110. You wouldn't make any money, so you wouldn't even execute this option. And unfortunately, you would have paid $500 for this contract. And it would be worth absolutely nothing if that price on June 14th doesn't get above $115 . So unfortunately, it's not worth basically anything, and you've lost your complete $500. So your return on the investment is a negative $500. Whereas if you had bought the shares for $100 on the same price the same day and the price was now $110 you could have sold it for a $10 profit, and he would have made a 10% are alive, so buying the shares was much, much safer. But when you bought the option, you had the upside of making 203 104 100% as long as the shares go up within that certain amount of time. But if they don't go up by very much and they don't hit your specific targets, you have a huge risk of that option being worth absolutely zero. So, in summary, the one thing I really want to touch on with options is risk their super volatile, but they do a very high risk return payout. So, for instance, if that Apple shares kept going and kept climbing before your expiry date, you would have made a significant amount of money. Now they have huge risk them, though, and that's the challenge. The other challenges that they're not always super liquid. You could get a quoted price of $5 because there isn't much volume on it, you may have to sell it for 50 or 4 75 whatever, whatever the real number is based on how much volume is going in. So whenever you trade options. I always recommend doing it with large companies that have lots of liquidity. The one thing that I do want to touch on, though, is they're not always super risky. You can even use them to de risk some of your trades. So, for instance, if you are short on a stock and you are short selling a stock and you were thinking that the price was gonna go down, you could make a big bet on yourself saying that the price is gonna go down and you could short sell that stock to hedge your risk, though you could buy a call option so that if you were wrong on the short sell, you still made a little bit of money on that call option. So these kind of options can be used to de risk some of your trades and had your portfolio , but only when they're used in the right ways. And you have to really know what you're doing. Also, the one thing I really want to emphasize is that if that sale price does not get to your strike price before the expiry date, your basically option is almost worthless. So you really need to be it to manage that and manage the stress, especially if you're gonna be watching this thing every day. It is going to move drastically and not by a couple of percent, but by 20 or 30% sometimes every day. So being able to manage that in your mind and in your head and not panic is something that you really need to be comfortable with. Now, before we go, I do just want to pull up and show you what this actually looks like in the real world. So I've got a stock quote. I'm just gonna refresh this so that it's live. But I got to start quote here for Apple. This is on the NASDAQ, and this is the overview page what it looks like through my bank. And if you go to options, this is kind of what the what the quote looks like right now. So apples trading at $283 USD. Here are the dates you can choose in. Go all the way across here right now, we're going to choose a July 17th expiry. One thing you should know is thes Options usually expire on the third Friday of every single month. So that's usually what the dates are that you'll see here. And if we go down, we can see the strike price in the middle. We can see puts on the right side and calls on the left side. Calls are exactly what I just explained in this video here, put to the exact opposite. So they're the short selling side of cause. So instead of thing, the stock is going to go up and you want to get in on that side, puts in the exact opposite. So we're gonna go and we're gonna look at calls. And right now, the strike price or the value of the stock is $283 here. So we're going to go down 2 to 83 you can see that it's highlighted here. That is basically where the stock is at right now. If we go down, we can see what strike price we want to get in at. So let's say we want to get in at $320 in this July time period. So we're going to buy it for an expiry of July 17th. We're going to buy it at a strike price of $320. And this option right here is going to cost me $6.45 per share. So when I execute this, I'm gonna buy it in a contract of 100 and see down here, the multiplier is 100 units. And when I execute this, it's gonna cost me $645 plus the trading commission. So let's see where this takes us and we'll go from there by this boom. So I choose my account. I say that I want to buy to open it. I want one contractor, 100 shares. I want to buy the call and not the put. I want to buy Apple on the US market expiry date of July 17th. You can choose all the different days right here. Ah, strike price of $330. I'm gonna do it at the market price that it executes. And I want to do it in any part you had continue and submit. And then you will executed your options trade. You can then buy or sell more or less, you can get out of your entire position all the way up to that expiry date. But that price is going to fluctuate all the way up to that expiry date, and hopefully the actual value of that stock is much higher than the quoted strike price on your contract. And then you'll be making some money so lots more to go. You can dive into this really deep in. You can put together a lot of different trading strategies using options. This is just a super high level course and lesson on what a call option is and a basic understanding of how these options work. So please stay tuned. We got a lot more courses to go.
18. Setting up the charts: What's up, everybody? My name is Zak Hartley, and today we're talking about how to set up your chart. So the first thing you want to do when you are about to make a trade and you're looking at your charts is you want to examine the big picture What is happening in the global economy on what is happening in your country's economy? Those are two big things that are going to dictate how well your stock does. Because no matter what, if your encounter here in the US, you're somewhere else in the world, your country is falling apart. Your inflation's going wild. You've got political change or political upheaval. Things are going to go wrong for your stock. So you got to deal with that. You got to know about it by looking at the big picture first. Now, once you okay with the big picture, you know what's going on. Next thing you want to do is look at your industry. So if you are trading in renewables and you're doing solar panels, you might want to look at an index fund of solar companies. If your training in oil and gas, you might want to look at the price of the barrel. If you're trading and something else, you might want to look at what's just happening in that industry and maybe with the major players in that industry. After that, you wanted Neil it down into your company, and that's where we're gonna get into it. So the first thing you want to do is make sure once you've established your company in which one you are really looking at, make sure you're looking at the chart and the currency that is associated with that market . So if you are looking at a company on the NASDAQ, it is going to be basically traded in the U. S. And using US currencies. If you're looking at something on the TSX, the Toronto Stock Exchange, it's going to be using Canadian currencies now. It can be listed on both exchanges at the same time, and that's why it's really important to make sure you're looking at the right chart as well . You could be trading a Canadian company using US dollars on the NASDAQ or the New York Stock Exchange, so there's lots of different examples where that's a very common thing. So making sure that once you have a company, you know what basically currency or trading with and what market, your trading it on. Are you in the ts X ray and the NASDAQ ring in the New York Stock Exchange? Or you in some venture exchange? You need to identify that's you know which country you're actually making the trade in and what currency you're using. After that, you need to look at the chart. Now there's several different places that you can get your charts from. I use stock chart Stockholm a lot. I have one of their paid services. I've been using it for years, and it's actually what I learned on. It's a great service, and it's it's pretty simple to use. You can also get much more complicated platforms, and you can use much more expensive platforms. There's trading view TD Ameritrade, E. Toro, Bloomberg and lots more. E. Toro's really cool because kind of like a social network for stocks, but it's only available in the United States. It's not available in Canada anymore. TD Ameritrade links up directly with your training accounts. There's no need to go between platform like this and your bank account so It really depends on what you're looking for, what your timeframes are, but there's lots of different options out there. I use stock charge dot com, and that's what we're going to go through today. So just to show you what it looks like, this is stock charts dot com. And if we go to my profile here, we can go see my chart lists, and I just have the basic profile. It's a couple dollars a month, and I can log in here. And the nice thing here is Aiken store chart lists, and what a chart list is is. It is a group of companies that I am following. Where is it where we go here? Why isn't this working? But it's a group of companies that I am following, and so what it allows me to do is basically keep track of a group of companies. So if I'm looking at solar companies, I can look up 10 different solar companies to technical analysis on all of them, and then I can basically decide which ones I want to get in and out of. Okay, it is finally worked. So here's the main page of stock charge dot com, and I've got my basically default list at the top here. So this is where I keep track of 33 different charts that are all basically annotated and have nine notes on them. So the 1st 1 that I always look at is the Dow Jones industrial. This is the 30 most influential companies in the United States, and its basically my thorough thermometer for what's happening in the United States out. So look at the Canadian markets and I look at some of the Asian and European markets as well. But this is usually where I start my day just to see what's happening. So you see, we had a big dip here going into March, and we're starting to recover in April. We'll see if this world's up, where if we fall all the way back down or past our previous lows, after that, we can go to basically the next stock. This one I have listed Apple and I. You can clearly see some of my technical analysis here Now, what's kind of cool about this is you have lots of options when you're working with stock charts dot com Number one. You can click on the annotate button here, and you can draw all your lines with whatever fixtures, whatever designs, whatever colors you want so that you can annotate onto the chart. And then it updates each day so that as your chart moves along, iMovie annotations through. So I did these ones a couple of months ago, and now it's kept them basically on the charts screen while the stock keeps on moving so great to see what's really cool and unique. Here's I identified level of resistance here from a couple of peaks, and Apple jumped all the way down to it here at the 2 10 marks, so really cool to see in a really handy tool after that. As you scroll down, you get a little bit more information and control here so you can change the time frame. If you want to look at it on a 10 day period, it's really easy. If you wanted to look at it on a one year period, it's really easy to change all these different specs and figure out what kind of time frame you really want. On this. You can also change the type of charts, so from candlesticks. Two online if you want, I leave it on candlesticks. I think it gives me in the most clear information, and you can also separate the volume. So if it's too cluttered underneath the chart here, you can hit separate, and it basically puts the volume onto a separate chart here, so really great for just setting up that kind of Maine scream with with your price and volume. After that, you get into overlays and indicators. Now, these air really crucial for all of the indicators that we've talked about in this course and in the lessons. So this is where you can actually apply them Now I've talked about six or seven different indicators, maybe a couple more than that. But here is the list of how many indicators you can actually use on your chart boom. So I think there's maybe 50 different, maybe 30 different indicators in here. And there's about 20 different overlays that you can apply to this chart to basically get mawr Information mawr buying cell signals to confirm or deny your assumptions. So these are all different mathematical indicators that you can use and apply into your charts. I've just gone through some of the most popular excuse me and the ones that I use most often. So right now I've got the RS I on the top. I've got my volume separated below. I've got the Mac D in here and I could ADM. Or if I wanted to. So let's say I'm down here and I want to add the Williams Percentage are this one is sort of like the Mac or sort of like the RSC. It gives me a chart that sort of similar to it, but it acts a little bit more volatile and a little bit more sensitive to the fluctuation. So same idea when it comes above this negative 80 line here, that means that it's a buy signal. It's coming out of the oversold zone when it enters the Green Zone. That means it's now into the overbought zone, and when it exits out of that, it could be a great short sell opportunity. So lots of different signals that you can add on to your charts here. This is just one way to do it, but I think starts stock charts dot com does a really good way of portraying everything again you can see Air Canada and now with some of my previous annotations. And this is a create example of the Mac D You can see a clear crossover right here on the stockman from about $12. Now it's 17. So a great return, about 30% just it today. But you can see that this stock fell from almost $50 up here. So just some crazy swings in the markets right now, And that's why I have a good trading platform. And good charts is absolutely crucial to being able to identify what's going on in the market. And now, as you can see in this list, I've got a little bit of everything. I've got pharmaceutical companies. I've got Amazon in here. I've got Google. I've got Ali Baba, like just a little bit of everything. These are all the different companies that I'm following right now, and you can see all of my annotations on basically all of these charts. So stock charts does a good job of giving you all the indicators that you might want to see , as well as allowing you to keep your annotations so that when you do your drawings on the chart, and you establish supporting resistance. That line is still there six months later. So if you have any questions about stock charts dot com or setting it up or any of the questions with Regards to Eat charts themselves, please write me an email. It was in the intro to Ah, in true to this course. So just to finish everything up in summary, we'll skip to the end here. The big thing that you got to do is follow your strategy. Once you've set up your charts, follow your strategy and make sure that all of your boxes were checked for what? It takes me that by a stock and then get ready to sell that stock in case things turn around. Before you buy that stock, though, you need to make sure you are aware of what's happening in the bigger picture. If the Dow Jones is plummeting and you plan on buying a large company in the United States , you might want to at least reconsider buying that company right now, buying a smaller portion of that company or buying that company at all in general. So really take a good look at the big picture, cause that's gonna be the indication of what's gonna happen a couple months down the line. Also, don't spend a ton of money on software. You do not need to spend thousands and thousands of dollars on fancy computers and fancy Softwares before you can at least understand the basics and make a couple of trades. I spend maybe $20 a month on stock charge dot com, and you can get a lot of the software's I listed even there for free. So don't spend a ton of money on it. The importance is getting the information out of it, and you only need so much to make a decision. So get as much information as you need to make that decision from one of these platforms and then execute on your trading strategy to meet your financial goals that we highlighted before. I'm Zak Carly. Thanks for tuning in guns
19. Making the trade: everybody. My name is Zak Hartley, and today we're talking about how to make your stock trade. So when you're making the trade a couple things you want to consider, 1st 1 is always look at the big picture what is happening around the globe and in the country that you are actually going to be trading that stock. Secondly, your trading strategy Does this align with your trading strategy? And does this help you meet your goals, or are you taking an unnecessary risk? Third the size of your trade? Do you want to execute on a full position right away? Do you want to only buy one share maybe right now and build into it? Or do you want to just jump in all the way? You really need to think about that, especially if you're unsure about the trade you're getting into. After that, you won't execute your trade and fully go through with the commitment and place the order to buy or sell the trade. And lastly, you want to try and mitigate your risk as much as you possibly can. So let's get into it. This is the stock that we're looking at right here. this is Google. I'm gonna go into my Web browser, so it's a little bit more clear. So this is the one that we're actually looking at right here. So I like Google. It's great company. I've been wanting to get into it for a while and we're going to go through a theoretical example off when you may have bought this stock. So we look on the left side here, we can see September 2018 the stocks coming in and a bearish pattern. It basically bottoms out around this $1000 mark here at 2019. And then we're trading within a channel. You can see the blue line on the top blue line on the bottom. That is the channel that this stock is trading in. You can see this channel because is identified earlier in 2018 we hit the top of the channel the resistance line, in April of 2019. We almost at the bottom of it again in June of 2019. And then we went on a roaring, basically bullish trend all the way up to $1500. Breaking through that upper barrier of our trading trend and basically peaking at $1500 before a drastic, drastic drop down back to that $1000 mark. And this $1000 mark is the area that we're going to talk about today. So we saw the price job 2000 and bounce off. We saw the price job to about 1000 25 right here and bounce off. We also saw it earlier in 2018 where we first established the support line. The price hit 1000 and it bounced off. So we've got very clear and strong support at the $1000 price mark. And now, as we're watching this stock drastically fall here in early 2020 it comes down to basically the $1,010,015 point. And that should be a red alert saying, Hey, guys, Google is back down to the $1000 mark. It's already bounced off this three times. This is something that we should be watching. This is something that could be a great buying opportunity, considering the last time it happened went to from 1000 25 all the way up to 1500 almost a 50% game. So we're looking at this. We're looking at this. Theo Google hits 1000 10,015 right here, maybe 1000 25 then it bounces up for one or two more. Good days, Thedc, Wes Chin is Do you buy in on those next one or two good days where it's starting to bounce up? Well, let's look at the technicals. First of all, it's broken through. The support right here falls all the way down 2025 it the first day up is higher than 1000 25 by a drastic amount. That's our first good sign. Secondly, we look at the RS on the top here we can see it has gone barely into that over oversold level nearly three times right here and then it's starting to climb its way out of oversold . So it's basically making that trend out of oversold right now. That's a buy signal is, Well, it's not as clear as we would have liked, but it is a buy signal. Next up we look at the volume we can see here that at the very low, the volume was pretty high. We can also see that the next two days where the stock began to go up, we still had consistently high volume of around four million shares. That's a buy signal that is saying that we had a drastic move upwards, and we still have high volume at that price. That is a buy signal from the volume and the most clear signal on this entire chart right here. The one that is just an absolute gold Mine is the Mac D. It drops all the way down to almost negative 100 right here. And then we can see the slower moving average breakthrough. The faster moving average drastically drastically here in March. We can also see on the bar chart here, reversing from negative to positive. So two giant Lee positive signs by signs from the Maki confirmation on the volume. We've got a bounce off at the $1,000,000 price. We've got to hire days of trading. We've got higher volume on it. I've got a positive sign from the RSC that is basically us looking at a chart and saying while I see bye bye bye bye bye signals it's time to execute on this trade. So we're going to imagine that We're two days after the low right here. We're trading at somewhere in the $1100 mark and we want to go and buy Google right now. So all we do is we go to our broker now I'm personally using my bank. I have it set up in a tax free savings account. If you're in the United States, you can use any of the online brokers. And if you're anywhere else in the world, there's at least a couple of different platforms that you can use. They're all fairly similar, but the commissions and the fees are gonna be slightly different. So I'm looking at Google. I go. Okay, I want to go by this. I go to my bank and I pull up the Google stock quote. This is basically the opening page. It's $1280 rain. Now here's a summary of it. If I want to buy it, all I have to do is click on this button. Now we're gonna actually go through and execute this trade through my practice accounts so you can see what the actual process looks like. It's pretty simple, and it's pretty straightforward. So hopefully this loads here in the next minute to but the idea here is always start with the big picture and nail it down to your stock. Make sure you have all the buy signals you need and then execute that trade. So we're gonna choose my practice account here. We're going to buy one share of Google. We're just gonna buy one, because it's $1200 Google. This is the ticker symbol G 00 g. Market. We're gonna buy it on as the NASDAQ's. We're gonna buy it in the United States. We're gonna buy it at the market price because I'm not too concerned about about where we get in or out at we're gonna buy at the market price because it has lots of liquidity, so I should be able to get in very easily. The order is only gonna be good through the day and special instructions that you can execute any part of it. So it's only one share. It doesn't really matter. So we're gonna continue. This is basically going to submit my trade. Now I need to basically confirm it. So we got one trade right here. One stock of Google on the Commission on this. The commission that I pay on every trade into the market and every trade out of the market when I buy individual stocks is $9.95. So the total cost of this trade is gonna cost $1289.45 USD. So I'm gonna execute that. Confirm my trade. Um, and from one more time, it looks like some in my practice count. Boom Order submitted. Order I D rbc Direct investing has received your order. Please print a copy of this page for your reference. So print this out and this basically says your order is active right now we're waiting for your order to fill. Hopefully it does today. And then you own google. So let's see. Let's see what it looks like. Practice investment. There it is. Google is now in my Canadian holdings Google Alphabet in Class C capital stock. I've got one share. This is now displaying in Canadian dollars, but I now own Google stock. So, just like that, we did our analysis on the stock, we executed on it. And now the last thing I want to talk about is risk So we're gonna get back into this show here. So this is the exact side we went through the by page to my broker and then mitigating risks. So this is a really important part. Whenever you make it trade, there's always inherent risk to it. That stock could fall to zero and go bankrupt tomorrow. It could skyrocket with a new product tomorrow as well. So lots of opportunity and lots of risk Any time you make an investment, now we need to try and mitigate that risk as much as we can. So a couple different strategies on how to do that one is a stop loss. So you could execute another trade directly after that trade that we just place that says Sell at $1100. So the stock goes from the 1200 that we bought it out. It falls to $1100 were automatically going to sell that stock at 1100. Now that alleviates us and alleviates the risk of it dropping to 800 us having to get out of 800. It saves us that $300 difference in there. That's one way of doing it. There is risk to a stop loss. It could execute your trade early if you see a small dip in the stock prices. Well, so definitely a good strategy from mitigating the large amount of risk. But it can also be a challenge during your trading strategy. The next option is a protective put option. So we did talk about auctions in one of my other videos. But the idea here is that you are going to buy a share long, and you're also going to buy the put option short so that if the stock goes up, you make money on your long position. But if the stock goes down, you don't lose all of your money because you still have a put option, which is gonna make you money When the stock goes down. This one is a little bit more complicated. You need to be very familiar with options to actually properly execute this, but it is a great way from mitigating your loss. Another one to mitigate your risk is investing opposing industries or competitors. So if you're invested in Coca Cola and you think Coca Cola is going to do great, but you're still a little bit worried that they might not be the superpower of the of the beverage industry. They may want to invest in Pepsi as well, if you think that solar panels air the absolute future, but you're not sure that First Solar Inc is the best company to do it you think they are, but you're not 100% sure it may help to invest in one or two other solar companies as well . Lastly, the best way to minute get your risk is too diverse Fire portfolio now, depending on how many positions you're comfortable on holding at any given time. If you could hold a diversified portfolio with stocks from different industries around the world, it could definitely help you mitigate your downside risk and increase your upside potential . So those are a couple different strategies that you can use. We've now execute our trade, analyzed a chart using our technical indicators, and we've gone through a couple of different strategies to mitigate your risk. You are now time. You are now ready to make your first trade. Thanks. Talk to you soon
20. ETF's and Mutual Funds: everybody. My name is Zak Hartley, and today we're talking about mutual funds and E. T. F s. Now an E. T. F. Is an exchange traded fund and is a group of companies that could be traded just like a stock, and it usually tracks an index. So what I mean by this is it is a group of companies, but together in a portfolio that you can then buy and sell, just like a stock. But that portfolio holds X number of companies, sometimes 10 or 15 sometimes a couple 100. The nice thing here, though, is that you can get instant diversification by buying that E t f. You get the rights and the ability to hold all 500 Let's say of those companies and get the diversification, the benefits that that brings with it Now the nice thing about these is that they typically have low management and transaction fees, so to get in and out of them is extremely inexpensive. And there's usually no management fees for actually being in them and leaving your money there. And the best known E. T. F is the spider s and P 500 E. T F which tracks the S and P 500 in the United States. This is what it looks like on a chart so you can see the ticker in the top left corner. Here is SP. Why, that's how you would look it up is the spider s and P 500 e t f. And as you can see, we're doing really well trading at about $330 then it plummeted at the beginning on March here due to covert 19 we're slowly recovering from it. But if you wanted to buy in, it would now cost you $286 and 64 cents. When you made that purchase and you actually bought this e t f, you would then get the diversification of owning 500 different shares, and this is what it would look like on a chart. Now the other option, if you didn't buy the e t. F. Is to buy something called a mutual fund. A mutual fund is what takes your money and invested in two different types of portfolios. It cannot be traded like a stock, and there are some requirements in order to get your money out. Mutual funds are classified in two different ways. Active and passive active mutual funds are actively traded in and out of on a daily basis, with somebody sitting there just like me to try and get the best returns for that portfolio . A passive portfolio is basically like an E T F. It's a group of companies that are designed to track an index, but it's purchased through the mutual fund with small management fees. Now there's higher management fees for the active portfolios, obviously, because somebody sitting there and managing it and that's what you pay for out of the profits in the returns. Now, BlackRock Funds is currently the largest mutual fund provider. We're gonna check out their website real quick. So this is what it looked like. Looks like blackrock dot com. And if we go to their products, Yeah, we go to the products and we go, let's say equity. We concede all the different things that they have, So here we go. I shares S and P T s X 60 I shares core S and P 500 e t. F. So there's lots of different options in here, and this is kind of what the overall basically black rock looks like. You can come in here and you can buy any e t. F. You can buy any mutual fund you can buy anything you want all through this website. This is one that hosts all E T. ETFs mutual funds and index one cf the option by all three through here. But this is a general idea, and there's lots of different portfolios, so you need to find one that matches your goals and your objectives. Now in summary, mutual funds used have higher management fees and require a broker. You also can't trade them in and out like a stock, and there's usually only certain times that you can basically make your decisions. Usually, it happens once a day. E T s can be traded like a stock and fallen index. Seven usually lower management fees, and there's usually no transaction fees to get in and out of thumb. Now, the advantage to buying any of these options is that you get instant diversity. You get to basically when you buy that index fund, you can make one transaction and owned 10 different shares or 500 different shares. and get the diversity for your portfolio so that you're a little bit more stable in a little bit more safe in your investments.
21. Execution: What's up, everybody? My name is Zak Hartley, and today we're going through technical execution. So what do I mean by that? While I mean, when you sit down at your desk, what are the steps you go through to actually sit down and make your traits? So let's start with it. The 1st 1 is, Look at the big picture before you do anything, look at what's happening in the global market, and we look at what's happening in your country's market that you want to trade in. Secondly, check your list so you should keep track of 10 to 20 different stocks, at least that you want to monitor on a consistent basis and wait for the best opportunities to buy in. That is the reason that we did. This technical analysis was, in the short term, a couple weeks to a couple months, looking for the best opportunities to get into the stock and then ride it out for the largest gains and exit at a profit. That was the entire goal of technical analysis and why we did all that research into short term indicators. Next is check your strategy. Make sure that this trade lines up with your strategy and you know how much you're gonna put into it and what risk you're willing to take with this trade. Fourth, make the trade actually executed properly in the correct market with the correct currency and get in at a price you're happy with. Fifth, mitigate your risk. Put on a stop loss. Put on a covered short do different ways or diverse fire portfolio so that you are mitigated in your risk in case your analysis is wrong and lastly, planned for an exit actually plan to take profits from where do you want to exit, where you willing to exit? And if your trade go sour, where you going to exit no matter what, so let's get into it. Let's start going through it. I'm gonna show you my browser again. I use stock charts dot com I've got the basic plan, and it allows me to keep one list of different stocks. So these are the different ones that I look at. I always start with this one M s world. The reason I start with this is this is a world index. What that means is, it's companies from all over the world, Europe, Australia, China and different places around the world except for the United States. So this index is a global world index. Except for the United States. The reason that pull the United States out is because they're such a large market. I'm going to look at the Dow Jones Industrial to represent the United States because that's also where and make most of my trades. So this is a world index that includes everything except for the United States. So this gives me a very good clear indication off what's going on around the globe. And as you can see, it's similar to what's happening in the United States were very steady, very study. And then beginning off March and February, we had a deep, deep decline in the value here. We significantly came down and we're starting to come back out of it. We'll see if that continues or if we re test those lows. Now when we look at the Dow Jones industrial, this is the focus on the United States. We've looked at the global economy. We have a good idea of what's happening there. Now when we look at the United States economy, we can also see a very similar trend. So very steady growth all the way up until end of February. Beginning of March, we plummet all the way down to 19,000. We start to build up, and we'll see if we continue to build or if we re test those lows. Yesterday was a bad day for us. It looks like we could be on the way back down into a bearish trend. So going back to our checklist, we've now checked the big picture. Now we need to look at our trading strategy and arch artless So my Charlie's are contained up here. I'm looking at about 30 maybe 35 different companies right now. Everything from technology toe energy to consumer product goods to cannabis to what else? I even got zoom Walmart canopy growth Twitter. I got a little bit of everything on here, these companies that I'm interested in in the industries that I want to put my money into. So when we start looking at this, we've now started big. We've identified our chart list. These are the ones that I'm going to monitor and annotate. I'm going to put 5% of my position into one of these companies. When I find the right opportunity and in order to find the right opportunity, I'm going to sit down in my desk every day and I'm going to go through every chart and go through all of my annotations until I find something or an opportunity that I like. So I'm looking at Air Canada. Nothing really here. Not yet. At least I'm looking at Aurora Cannabis. This is still coming down and coming down. I do see a double bottom right here and a clear trend line coming down, so this could be an opportunity for a breakthrough. But the cannabis industry kind of scares me right now because of the last year has just being so terrible. So we're going to keep going here. I'm waiting for Amazon to load. This is an opportunity that I like, especially during Kobe. 19 people are still buying things. However, I did look on prime and it looks like everything is going to take almost a month to be delivered. So I don't know how big of an impact that is gonna have on sales, but we'll see what happens over time. We need this thing to load anyway. So the idea here is Start with the big picture. Now I'm going through my chart lists and I'm seeing Are there any opportunities in the market that I want to get into right now? Are there Is there any stock that significantly undervalued or that is showing a pattern or that is touching a level of supporter resistance that has a specific interest to me that I want to be in right away? Okay, we're just gonna skip to it. This is the one that I've been looking at recently. This is beyond meat, and this is the chart that I want to go through. So imagine you're going through all these charts we ended up at Beyond meat. This is the one that I'm really interested in right now. So on the left, this was actually the I p. O. This is when they started. This is when the company went public and raise their money. They came out at the 35 36 kind of dull dollar ballpoint rate there. That's why I put this red horizontal line at that initial I p O price. After that, we can see that they clearly climbed all the way up to almost $240. So very, very significant and steady increase all the way up. And then we broke through support right in here in August of 2018. They can also see Ijewere red horizontal line here as resistance on that high. This was the highest of stock it ever gone. So I drew a resistance line right there. Now I've got a bottom and top to my channels. Basically, we could see the stock coming down. It kind of touches on this support line at the 1 40 here, and then it drops all the way down to this kind of 70 mark and consolidates for about two or three months. After that, it comes back up and it touches that 1 40 mark again. It consolidates for about two months here. And then here's what was really interesting to me. This stock went from $240 then dropped all the way back down to its I p O price. It came all the way back down to this, like, $50 mark here, right in, right next to this I, p o mark and the reason I was able to easily identify that is because I had a horizontal line of support at that I p O Price. So now it's being almost over a year that price has gone up, and it has now come back down and tested that I p O price. That means they're supported that price, and that could be an opportunity to buy it next. I said, Where is the next level of support? Where's the stock Possibly gonna run out if it runs out right away? And it was at this next level of resistance here that was established in November and December of 2019 where the stock basically traded within a channel and you can see here. In March of 2020 we clearly tested that support line, came back down and then broke right through it. This is almost one of those triangle patterns and ascending triangles. So if I was going to map this out, let's just do it right now. We can see here. We've got 123 peaks and we've got 12 different, basically lows right here. So we've got an ascending triangle right here and now I'm looking at this stock and it looks like it's about to break out of this ascending triangle, and that's when I want to get into it. So accept this chart. I'm gonna zoom into it. Let's look at it on three months. Update that and you can see here. We've got our sending triangle. We've got two different lows here. We've got 123 peaks right here. And now we've got a day above that peak. My assumption now is we've bounced off the all time hope all time low. We broke through the support and resistance line that was here at the 70. We formed an ascending triangle and we just broke through the resistance at the top of that ascending triangle Those air Three super positive technical signs that I really like. On top of that, we had the RC just come out of the oversold area. We had the Mac D crossover So super super positive signs and even better than that is the last two days have mean higher trading volume than the third day before that. So now we've got a breakthrough. Got to hire days of trading volume. Got a positive looking Mac D, we got a positive looking arse. I and I got three gigantic positive signals on the technical indicators just within the price movement in the support line, the breakthrough of the resistance at the 70 mark and then the breakthrough of the ascending triangle. This, as as clear as I can possibly be, is a buy signal that I would now want to get into. So I gone through the big picture. I've looked at the world economy. I've looked at the country's economy. I know that Cove in 19 is going on in people cooking more at home food is more important and especially food that can be produced in a sustainable way. So I like the trend that's happening with beyond meat. I've checked my charts, and this is the one that I like the absolute best and the lines with my strategy, and I'm gonna put 5% of my portfolio into it, and now it's time to make the trade. So I'm going to RBC Holdings, and if you type in the ticker symbol right here, B y nd into the search bar B, Y and D, it comes up right here beyond Meats Inc and I'm gonna go in, and I'm going to buy some of these shares. So shares currently trade right now at $84 I'm gonna buy probably 50 shares. If my Internet would speed up here, that'd be great. But we'll see. We'll see what happens here. So all that's gonna happen is gonna give me the symbol for beyond meat. I'm going to go in. I'm gonna click by. I'm gonna insert my shares. I'm going to do it at a market or because it's currently during the day, the market is open. Right now, I'm gonna execute onto that trade. And then if we go back into the charts here, I'm also gonna put in my stop loss. So we're gonna go in here and we're going to execute this trade of this pulls up and then that stop loss I'm gonna put in right below that 70 sport lines. I'm probably gonna put it in at 55 or 60. Here we go. OK, so beyond me, 84 29. This us what it costs right now. You go in and buy this. Okay? We're gonna use practice counts. I got 97,000 in there. So I'm gonna buy 50 shares at the market price using US dollars. Theo order durations could be for the day special on trucks. Chins are any part of it, and I'm putting it in at market price so that I can execute on it right away. I click Continue. Here is my total. It's $4200 United States, and I'm gonna confirm that I confirm it one more time, and now we have officially executed that trade. So now I am into that trade would done Step four of our training process. Now I want to go back to the chart, and I want to figure out if I can mitigate my risk. How am I going to do it? And I think the best way to do it in here is going to be put in a stop loss. So what I want to do is I'm looking at this chart and I want to figure out At what point am I wrong? At what point is my total assumption just completely incorrect? And I need to get out of this stock at a reasonable price. Well, I'm gonna be fairly cautious on this one. I do think we're in a new bullish trend, so I think it's gonna continue to go up. So right here is the top of my ascending triangle. I'm gonna put it below. That right here is my next support line at 70. I'm gonna put it below that. And my absolute bottom is down here at the 45 mark. I'm gonna put it above that. I'm gonna put it right in the middle here. Kind of at the 60 mark, maybe 55 here. I think 55 said I can come down and test this low rate here, but if we break through that low, I'm getting note. So I'm putting it at 55 right now. And I'm looking for an exit around that 1 2130 up mark. So not too bad of a return here. Definitely on the positive side. But I'm gonna put that stop loss in there just in case. So let's go back into here. I'm going to go back to be on me. So this is us mitigating a risk. This is going in and saying, OK, we're in this trade now. We think it's gonna go up But if it goes down, at what point do I want to get out of it at? And we're gonna preset that so that there's no risk. There's no stubble guessing it. It's There's no second thinking it. There's it's just you committing to a plan. Okay, so we're going to sell our entire 50 shares of beyond meat at a limit. This is the key here instead of them. If you click market price is just gonna get back out of those shares. You need to quick limit price on. We're gonna put it at $50.5 dollars US. We're gonna put it toe all or none so that if this happens, we just completely get out of it. And that's what we want to do. That is the case. And that is the proof that we were wrong on a trade. We need to take that loss. When you learn from it. I just need to move on. So now we've got the buy order in there that should have executed already for one board water, and I'm not gonna be processed with on Oh, okay. It's not Let me do that because it's too small of a trade. That was the problem. So we're gonna get in. We're going to execute the stop loss. Now, this is going to be our risk mitigation to basically help us get out of that trade. In the event that basically, we were wrong on a trade. So here we go. Limit $55 U. S. Any part It costs me 9 95 to make that trade. And if we get out, we'll get 27. 40. So we lose about $1000 But we don't lose the shirt off our back, and that's the goal here. So now we've mitigated our trade. We've got that. And now we're looking for exit points. So we're in at 84 were out at 55. And if we blow up this chart, I'm going to put it back to the one year timeframe because it's a little bit nicer to look at. I definitely need to get some faster Internet, but that's OK. Give tell us a coal. So when we get it back, we're gonna be basically looking for where do we think we can get out now? Obviously, the next big point rate here is this kind of 1 30 mark that will be The real test is when we get to that 1 30 point is, Do we break through that 1 30? Or do we hit that 1 30 come crashing back down? So when you see the stock starting to go up and starting to climb to that 1 30 point, that is the point where you will really want to monitor it and stay on top of it, because that's where we're going to see the quick turnaround. Now it keeps going up 1 40 The ultimate exit would be here a to 40 again, or even own it until it continues. But if you could get out at 1 2130 here right before it approaches our resistance, I think that would be your ideal target to start with now. That was the entire execution and the risk mitigation. The last thing that you want to talk about is planning your exit. That's where you can if you want. Put in that preliminary trade that says Get out at this 1 30 mark and then you can set up your entire trade so you just sit there and see what happens, or you can follow it on a day to day basis. Now the last thing I want to talk about is reviews. I put together a lot of effort into making these videos, and I really enjoy it. I really like helping C C people accelerate and learn new things, but it's taken a lot of effort and a lot of times. So if you've gained anything out of this course, please leave us a review. I would sincerely appreciate it, and it helps me spread the word a little bit more so otherwise, if you have any questions, you can send me an e mails at Hartley H a r T L e y at hotmail dot c a. And this is it for technical analysis. There might be a summary coming up, but the next chapter is gonna be about fundamental analysis. So thank you guys very much tuning in. And I really appreciate all the support
22. Buying ETF's and Index Funds: What's up? You guys in this video, I'm going to show you exactly how to buy and sell E T F s and index funds and we're also going to make a trade. So stay tuned. Let's get right into it. I've got my screen in front of me and this is doctors dot com and the one that I'm gonna buy Real simple. It is sch be so Schwab us broad market TTF This is the one that I want to look at now The reason that I have chosen this one and the reason I'm looking at this one is because it is a broad market e t f. The reason you want to buy an e t f word and we're in the index fund is because you want diversification. You want a home companies in multiple different industries so that if one goes down, it doesn't affect your entire portfolio. This is a great TTF for that because it focuses on the U. S. But it has a broader market, meaning it as companies from tons of different industries and sectors. It has so many companies infected as 2500 of the largest publicly traded you ask companies . So that is the reason I am buying this one. It is a broad range of U S companies. It is focused on the U. S. So it should grow over time. And it is extremely well diversified with extremely low fees. So what I mean by that is the net expense ratio of what it's gonna cost me to own. This is less than 1/3 of a percent, so it's almost zero. I could get in and out of this really easy. It's super liquid. It gives me instant diversification, and it's great to get in for any first time investors, something that wants to get into the market or something that needs to add diversification to their stocks. So let's go back to the actual chart here, and we're just gonna break through it again. It came in pretty steady on the left eye inside here. Fairly bullish Cove. It hit and it started to recover. It is trending fairly similar to the Dow Jones. It is a little bit higher in the recovery compared to the Dow Jones, but that's a good thing. That's a good sign to see. Then one of the really key things that I want to point out here and why you might want to invest in an E. T. F or an index fund is that diversification of owning so many companies rather than giving you exposure to a certain company. Research in industry gives you exposure to the market in general. The U. S. Economy in general in particular, in this case, and the reason that's a good thing is because over time the economy has proven to grow. So I'm gonna show you as far back as I can go here. It shows me 10 years. If you looked at this chart over the last 10 years, you could see that in 2011 this E T. F was about $25. It's now at $71. So over the long term, nisi TFC have proven to generate consistent, steady returns there a safe investment that give you instant diversification on their perfect first time investment. For anybody that's looking to get into the market that isn't ready to pick and choose their stocks, it's also a great option for anybody that just needs to add some diversification to their portfolio over the long term thes mimic the returns of the market and of the economy. And over the long term, that has generated the 7 to 9% return. Now, if you buy in and all of a sudden 2008 hits again or we see a major economic recession or a giant crash, things can change pretty drastically. However, over the long term, you're guaranteed almost guaranteed to make a 79% return on your money. So that's why somebody white might want to buy into an E T. F or an index fund. In this case, I'm choosing Charles Schwab. You can also choose Vanguard. You can choose BlackRock there, plenty of them. You just type in Google Different index country, T E T s based on what your goals are. So I chose Charles threw up over the last 10 years. It's done extremely well over the last one year. It hasn't done quite as well because of the covert impact, but it is recovering fairly well. And as you can see here over the last 10 years, that is being fairly stay so really excited to see really good. I've decided that I'm gonna buy this one to add diversification to my portfolio on you show you exactly how to do it. Now I'm training with RBC. So all I all you do is collect direct investing and then typing in the ticker off the one that you want to purchase right now buying the Schwab US Broad Market index and by on the US market. Right now, it costs me $71.80 per basically share of this. And so I'm going to buy into it. So by $5000 position, let me just find my phone and do a quick math on this. 5000 divided by 71 equals about 70 shares. So I'm gonna buy 70 of these. That's gonna give me a $5000 position. I do it on my US margin account. That's okay. So by 70 Schwab US market price, they're good for the day. Any part. We're getting right into it. And now we have just placed a $5119 trade that has purchased shares into the Charles Schwab Broad Market Index. E T f. Know what that has done. It has taken our $5000 it has dispersed that money amongst 2500 different companies. It has instantly diversified our $5000 investment amongst 2500 different companies and given us exposure to basically the entire market of the United States. So if the market in general goes up, we should do very well off. The market in general does poorly. We're probably gonna do poorly. But over the long term, 79%. That's what we should be expecting. However, I'm not gonna be trading in and out of this. I am not gonna be setting a stop loss this Waas. Ah, long term investment. This would be putting $5000 away in my future. This was me putting away 5000 hoping to get back 789 10 15 20 years from now, knowing that it's safe knowing that it has exposure to the market, I'm gonna make the average return and we're going to be diversified. We're gonna be well balanced, and we're going to be well managed with low expense. Be So I'm not going to see expenses training this account over the years. So overall, I'm really happy with this. You can do this with any in next one any and e t f. You could just find them online. Do you research on them? I pulled it up. Really simple here shows you the objective. It shows you the highlights straight for and low cost fund offering potential tax efficiency. 25 of the largest publicly traded companies. It's really simple to do. All you have to do is your basic research. To find out how you want to diversify, I would recommend maybe a world index sending US index or maybe your country's index and a world index, where an E T f could be great options. But it depends on what your goals are, what your objectives are. And can you handle mentally putting $5000 or X $1000 away and saying, I'm not gonna touch this for a couple of years? And that's the goal here with the index in utf investing as long term investing for consistent and steady gains, just like what we showed you on the 10 year chart on the SCH beach are so lots to learn here. If you have any questions, send me an email and if you get any value out of this video, please remember to show some love. Thank you
23. Chart Lists and Routine: What's up, everybody? My name is Zak Hartley, and welcome to this course in this lesson, I'm going to go through basically my stock market routine what I go through on a day to day basic basics, to get started in the market, to understand what the market's doing and to look at some of stocks that I want to take a close look at or look at on a daily basis. So before we do anything else, let's get right into it and I'm jumping into my screen here, So I'm using stock charts dot com. Super simple, Easy way to do it. And I've got one list down here on this account. It's got 35 stocks in it and for 35 tickers in it, and we're starting with the Dow Jones Industrial. I really like to start with this because it shows me the United States market kind of as a general mostly focused on a certain number of companies not as big as the S and P, but ah, good reference for the market. So when I look at this is really interesting, we had the deep crash here, going down into March 23rd that was due to covert. We've come up here and for the last kind of two weeks we've consolidated. I'm gonna annotate this. You can sort of see what I'm talking about. But if you look here, we've basically gone inside of a channel here, um, and touched either side about two or three times. So we came up, we touched top, the channel here bounced down, bounced up, came down to about halfway, bounced all the way back up, all the way back down. And then today there's 1/3 higher day and we're basically sitting on the upper side of that channel. So it will be really interesting to see if we break through that or if we bounce back down . But what's important to know is that the U. S market, based on the Dow Jones Industrial Index, is in kind of a period of consolidation here. Now the next chart we're gonna look at is the world index. It's sort of the same thing, but it's everything except for the United States. So this is the rest of the world, and you can see it's sort of the same pattern. It's not quite as clearly defined it's almost moving almost on a trend upwards. But you could also say it's sort of consolidating here, so kind of tricky to see what's happening on the world scale. But a similar pattern toe. What's happening on the Dow Jones industrial. So now that we have that in the back of our head, it's really great to see. Now let's start getting into some of the stock. So this is just based on alphabetical order. It's not broken down my industry. It's not broken down by anything else. It's just simply alphabetical. So got Apple pulled up here and this is really interesting. We had a lot of patterns coming up here in early 2019 and about halfway into the year. And then we just saw this big, rapid growth all the way up to that kind of 330 mark and then Cove it hit, and it brought this stock all the way back down to almost 210 were from 3 30 down 2 to 10. And if you will give this chart now, we're back up to about $315. Now, this is absolutely amazing and this is why you want to be a stock trade because we're looking at the largest company, possibly or one of the top five largest companies in the world, moving by over 50% from 2 10 to 315. That's a 50% move in a matter of less than three months. That's how volatile this market is. Right now, we're seeing the largest market cap companies in the world right now, moved by 50% in less than 1/4. That is why you want to be able to read and understand these charts. And that is why you want to play the market because you can pick up on swings like that. In some of the biggest, largest blue chip companies, there's There's no other better way to make a return on your money than this as long as you can analyze it and you could do it properly. So that's why we're in this course. That's why we're doing these lessons, and that's why we want to be here. So when we look at this chart, we're gonna go in and we're gonna annotate this. We can see that there is clearly some resistance coming here, so Now, when I look at this chart, I can see we have almost 3 30 We built some resistance that we came back down to 2 10 and now we're climbing our way back up. We're at 3 15 now. I think we're going to see some resistance at 3 30 If we break above 3 30 and we can prove that trendline, I think this may be a by opportunity. However, I do think we're going to see some resistance at the 3 30 level. I think we're going to see a dip. If that dip is strong, I might play that downwards. Otherwise, I think I want to buy that dip and expected to reach towns the 3 30 or break above it. So what I'm looking for on Apple now is I'm looking for the dip or the clear break above 3 30 Those are the next steps for this stock. That's what I'm looking at. So that's apple down. I don't want to touch this. I don't want to look at it again. I'm gonna wait a couple days until we see what happens here. All right. Next stock. Air Canada. This one is really interesting. Now I know where Canada. They started to make it come back, especially with the Canadian government saying that there might support the airline industry and the wage subsidy and all that. And then yesterday or two days ago, Air Canada now signal lay off another like 2000 and 3000 jobs. So I don't think Air Canada is gonna be doing that. Well, from a news perspective, we can also see here. This is really interesting that they basically I just broke through this channel. So they broke down to that channel. They're almost at $14 which is their low for the last kind of 30 40 days here, back to the beginning of April, and then they've got their low of below $10. Here we will see kind of what happens in there, but I think it's gonna go a little bit lower. I don't see any positive signs that this stock is gonna go higher from the RS I from the Mac D from the moving averages from the price movement or the volume. I don't see any positive signs here, so we're gonna hold off on Air Canada for now. Let's see. Well, the next one into clues. Okay, A war. Cannabis. This one was really interesting. This is the cannabis industry. It has been plummeting for the last kind of year and 1/2 comes all the way. Comes all the way down. I thought we were going to see an ascending triangle happening right here. Turns out that wasn't The case is continued for another five or six days to just continue to trade horizontally. And then a drop drop drop drop drop all the way until May 11th. And then earnings came out and Aurora still lost money. But they brought in more money than expected that higher revenue than expected at a revenue beat. Probably because more people are smoking pot during cove it. And so they had higher revenue than expected, and their stock has jumped by 70% in one day. Absolutely amazing. I don't know exactly where it's gonna be at tomorrow when it opens up, because this is a Canadian company and the markets are closed right now, but pretty unique. The entire industry was up yesterday, so I expect to see a little bit of positive momentum as we go forward. However, we don't really know. There's a couple of companies going through reverse share splits right now so they can get their share price above $1 because their prices have fallen so much that they're almost worthless now to put this in perspective or a cannabis pool by 70% in one day, that another date before that was probably 20 or 30%. And they're still lower than they were in March 3 months ago. Like they were worth mawr three or four months ago than they were now. And they had 100% game basically in two days. So really tricky industry to play, depending on how you want to do it. Tough one to be in. I'm not ready to put my money into this, cause it's just a little too volatile for my blood right now. I don't see the long term earnings potential, or I don't know which company has the best potential yet because of how volatile this industry is yet. So I'm holding off right now. All right, Amazon. I really like this one. This one is possibly the ultimate winner out of Cove. It they did have some worker strikes where they're gonna have some issues there, but overall this company is is a beast. It's a complete and absolute dominators. So when we look at this chart, it's kind of tricky to understand. I'm gonna put this onto a smaller timeframe so that we can get a better understanding of it right here. We're going to go down, Teoh. Zero years and six months. So comes all the way down, comes all the way down and then rallies to a higher high lined up with the Dow Jones that lined up with the Dow Jones chart of the Dow Jones plummeted rate here 16 to 23. And then it started to come up, and now it's consolidating. But the Dow Jones is consolidating about 10 15 20% lower than a type Amazonas, consolidating much higher than its previous high. That, in my opinion, is the winner in Covert. They're going through the exact same trend as the rest of the market, but they're at an all time market high right now, which is absolutely unbelievable. So this is a company that I want to get into long term, absolutely love the fundamentals I love. The business model is a Goliath in online market and it is gonna win e commerce in the long term or it's at least gonna have a chunk of it, and I want a piece of it. So right now we can see a little bit of consolidation Since beginning middle of April here , I'm waiting for this to break above the kind of 24 50 mark rate here where the high was. And then I want to get into a long term. If it doesn't break above here and it drops back down, I'm going to buy the dip when dips. If this company can make it through covert and being an all time high, I think it's got some long term potential. So I'm looking to get into Amazon, but don't want to do it yet. Not until it breaks above this and show some positive signs or it dips down and I'm gonna buy that dip on the next one. So that's Amazon. All right. Ali Baba, another e commerce giant. I was kind of weird Charter gotta change that. So we're gonna look at it on a two year chart, basically get the glance first. So we've got a lot of horizontal support resistance lines here and then we have one big channel. So 123 highs 123 lows. There a little bit off. But that's OK. We're getting a little bit of a channel going here, and you can see that this exponential moving averages are starting toe come apart and back in almost cyclically. It's kind of unique. So we're gonna zoom in a little bit more on this. We're gonna go down toe one year. I'm gonna see if we get a better picture of what's going on here. So this is interesting. I like this pattern here. We're going to zoom in even more because I'm starting to identify something already. So we go down to the last 10 months here. I like this. I like this a lot. Okay. And rotate. If I go here and I start to draw here, we can see a clear line of a triangle forming and we have our first break out. So this is super exciting. This is unique. We have a basically a horizontal triangle here where we have to price coming in, coming in, coming in and coming to a point on, then something has to happen. They desire ascorbic above or it has to break below. And it looks like right now it is breaking above where at the tuning 13 mark is about to test the previous high of April. And if it breaks above that high of April, I think this could be a solid break out in a great opportunity to buy Alibaba. We have a crossover coming in the Mac, dearie. Now the RS eyes slowly moving up. It's approaching the oversold, but it hasn't got there yet, so it looks like it still has some room to run. And we're not even near the ultimate highs of that basically kind of to 30 zone friendly Bab at the beginning of 2020. So we will see what happens here. Cove. It hasn't had as large of an impact on Alabama's. I thought it might have, but we are seeing that basically horizontal triangle. We're seeing a break out right now on Alibaba, and this could be a great opportunity if this continues to buy Alibaba on the long term. I do think it has nearly as much potential as Amazon because it is great. Such a great play going the exact same rope it on the B two B side. So I do think there's opportunity there. We will see what happens, and I'm going to closely watch this over the next little while, so I'm gonna continue going with this. But the video is already starting to get a little length, Lee. So you need to create your own stock, Lis, just like what I'm doing here. And then get into a routine where every morning or every couple days, you start going through that list just hammering and out, trying to identify patterns and identify your training opportunities. And that is how you get into the market. And doing that consistently is how you start to build your portfolio. So if you have any questions, send me an email. But if you got any value out of this, please remember toe like and subscribe. It sincerely helps me out. And don't forget to leave a comment below. If you have any questions, comments, concerns or trade ideas, police send them there and I will check out your trade ideas as well. Thank you so much and I will talk to you soon.
24. Day Trading basics: What's going on, guys, my name is Zach Harley, and in this video we're gonna be talking about day trading and how to set up your account. So before we get into my screen here, we need to talk about one thing real quick, and that is registered and unregistered accounts. It registered BankAccount is an account that's registered with the government. That's who it's registered with. And it means that the government can access the information inside so they can see the transactions really easily. They can search it and they know what's in there. Now the reason you might want to have a registered account is because they have tax advantages. In Canada, you can have a tax free savings account or an RSP, which allow you to get capital gains without having to pay taxes on those capital gains in certain ways. Now in the United States is a little bit different, but there are registered accounts there that give you the same benefits. Now the thing that you need to understand is if you're swing trading or you are long-term trading where you are planning to hold the stocks for the long term and invest them long-term and you're going to receive capital gains from them, those types of accounts are perfectly fine to hold your investments in. However, if you're going to day trade and you are going to be doing this for a living. And the income from the day training is going to be providing you with your income as it would for a job that is going to be considered income and it needs to be taxes income not as capital gains. Therefore, it should not be put into a registered account like a tax free savings account or an RSP. If you are going to be day trading, you need to have your money in a margin or a cash account, and it needs to be taxed and accounted for as income as if it was your day job. So that is something that we need to talk about real quick. If you are unaware of that or you didn't follow that, you don't completely understand it. You need to go and hire an accountant or speak with somebody that knows exactly what they're talking about and can offer you professional advice. I'm not a financial planner, I am not a CPA. I am just a regular investor that has gone through this process before. I am an active day trader and I do not hold my money in a tax free savings account or in an RSP. I have a margin account that I do all of my training through, and that's what I would recommend for you as well if you're going to become a day trader or experiment with day trading. So with that being said, let's get right into it. The platform that I use is called Quest trade. It's based in Canada here they do a really good job. You can also use international brokers. You can use TD thinkorswim, you can use trade ninja. There's also a bunch of other platforms, international brokers, I think I said that, but there are a bunch of them that are really good out there. They pretty much give you all the same thing. The fees do vary a little bit and the data also varies a little bit. So we're gonna talk about that real quick. So I'm on the question website right now and I just going to jump into their pricing here so that you can see what the, what the typical platform sort of looks like. So as you can see, it's a minimum $5 or $10 per to trade a stock plus $0.01 per share. Etfs are usually free and options are about $10. However, with different types of plans, you can get different incentive. So this is where things start with quests right? Now if you're going to be a day trader, I would recommend you getting a data plan with questions. There's a couple options. The first one is your basic And this is going to give you information, but it's going to be 15 minutes delayed. So all of the price information that you have is going to be 15 minutes delayed on the chart, you may be able to click and get a spot price, which is gonna give you the exact price at that exact second, but you won't be able to track it over time. The next level is usually going to be enhanced data. In this instance, it cost $20 a month. This is going to be the basic level that you need to day trade because it's going to give you the live numbers, but it's not going to give you any information on top of that. The next level on top of this is going to be called advanced data. And it's gonna give you what's called Level two data. Before all of this, it was called Level one data. This is what's going to give you level to data here. Now it's not gonna be any faster data. But what it is gonna do is it's going to show you the buildup of orders pine each price level. So if Apple is selling at $75, it will tell you how many people want to buy it at seventy six, seventy seven, seventy eight, and how many people want to sell it going down? So it will give you information so that you can see of Apple's coming up to $80. You can see how many people are lined up to buy and sell it at $81, for instance. So that's the idea behind Level two data. The advantage here with clustering though, is it gives you better pricing on your commissions. So one of the main reasons that I have level two data is because I will actually make up the additional fee by saving money all my per commissions. So if you noticed before, options cost $10, now they're only cost $4.95, so I save $5 and every transaction I make, if you make enough transactions, that additional fee, actually it doesn't cost you anything, it saves you money in the long run. So that is my play with Quest trade. I have the advanced data package, the level two data. I do use that information and I make a little bit extra or I save a little bit extra money by going with that option. So now I'm going to jump into the actual trading platform in this instance is called IQ edge. But I'm going to show you exactly what it looks like. They're almost all the same, but here we go. Okay, so for me this is what my trading window looks like. I've basically got Apple stock here on the left side, I've got Apple options on the right side, I've got an order form right here so I can place all different types of orders at whatever level I want. And on the bottom here I've got a couple of tabs. So I'm also looking at Facebook. I'm looking at the nasdaq and I'm also looking at the S and P 500. So I've got a couple different charts open on a couple of different tabs so that I can monitor the market as well as specific stocks and I'm watching. And the idea here is that you're going to use all of the exact same principles that I talked about in the technical analysis portion of this course. But now you are going to apply it to a shorter timeframe. So when I look at Apple and just open a new chart here, so Apple Inc. an alumina stock and I'm going to maximize this. So this is Apple's chart, but it is on a much shorter timeframe than anything we've looked at so far in this course. This chart is on a one-day M1 minute timeframe. So as you can see on the left side, left hand side here, this blue line indicates where Apple opened the day it was at $464, it came all the way down to $455, is currently at $458 at the very moment. So as you can see here, what we're basically looking at Apple on an extremely, extremely short timeline. And when we start to add in some of our charts and some of our trend lines here, you're able to start to see how you might do to apply the exact same formulas that we were using before though, when I looked at Apple here, you can see, okay, we've got clearly a little bit of a double top here. We've also got a clear trend line right here. It looks like we've just broken through that. We've got some pretty clear resistance here. And oh, it looks like these all lined up on the same level as well. So Apple is currently plummeting right now. It looks like, it looks like we're probably going to see some support around there. So I'm going to draw in a price line right there that's going to give me my Priceline. So if I was looking at this right now, I had to make a trade or now I'd probably short sell Apple expecting it to drop to that for 7457.5 range somewhere in there. If it doesn't, I would expect it to rebound all the way up and basically out apply the same principles and the same techniques that we used in all of the videos previously to this, on the longer timeframe, but I would start to apply it to this chart here at adding the Mac TA'd, adding the RSI, and then I would make my decisions based on that. And so when you get into this, you can start to get set up your trade, setup your platform, and you can even set alerts so I can go okay, right here, Create New Alert order entry when the bid price is below 457.5. And what it's gonna do is it's going to add in a new line right here and it's gonna say, okay, this is my new alert. As soon as the price drops below their ISN Zach and alert. And now he can get into this trait. So lots of different ways to do this, lots of different techniques. I might cover this a little bit more later on and we'll talk to you soon.
25. How Margin Works: All right, You guys, welcome to another lesson. In this video, we're gonna talk about margin. We're going to go over what it is, how to use it, and the risks associated with it. Here's everything you need to know. Let's go. Okay, so let's just start with what is margin? And margin is when you borrow money from your broker. And so when you deposit $1000 into Quest trade or thinkorswim or are interactive brokers, whatever one it is, depending on what you buy, they will be willing to lend you money based on how much you have in your account and how much you have in that position. And so if you look at a specific stock, for instance, Visa incorporated, I pulled this from question. I just clicked on stock view. You can type in any ticker symbol you want. And when you see long MR and short MR. this stands for your long margin required and your short margin required. Margin required means how much money do you have to have in the position and how much money quest trait is willing to lend you. So in this case, long and short just mean when you buy and when you sell. And for a visa Incorporated for you to buy the stock, you have to own at least 30 percent of that position and Quest trade is willing to lend you up to 70 percent in the other case. So for every $30 that you buy, a visa stock question is willing to lend you $70. Now, it does depend on the stock that you invest in. So here's a quick screenshot of my portfolio and ageing and see most of the stocks that I hold are actually 100% margin required. And that means that question is not willing to lend you any money for those particular stocks. The reason is because they're very small cap stocks that are pretty volatile in question. It doesn't actually allow you to borrow money against them. However, Apple, Visa, MasterCard, Microsoft, and he's a big name companies that you're probably familiar with, you can probably moral against those stocks. Now when you use margin, it is going to cost you money because you are boiling that money from questions. So they're going to charge you an interest rate. Now in Canada, it's basically works out to the prime rate plus an extra fee depending on if you're in a margin account or if you're in a registered account. So in Canada, It works out to almost 6 percent. And if you're in the US, it works out to 7%. So depending on which currency you are using and which currency you are borrowing, you will be paying about six or 7% per year for that money and you only pay on that money when it is held over night. So if your day trading and you are using margin to data and you're entering and exiting in the exact same day, it will not cost you anything to use their money. However, as soon as you hold over 90 will be charging overnight holding Phi, borrowing traits money, that's super important to know. Okay, so let's look at an example of margin now. So let's take Apple as an example and say the price is $100 and the margin requirement on the stock is 30%. If you buy five shares of Apple and $100 and you pay 50 and you borrow $50 for each share, that's going to give you an initial investment of $250 in five shares of Apple, and the entire investment is going to be worth $500. Now, let's say that the Apple shares go up to a price of $130 and you sell. That means that you are going to have to pay back the $50 per share, but you are going to profit $80 per share. That means that on the entire trade you're gonna get a net profit of $400 and you're gonna get $80 per share. Your net profit per share times five shares. So a total net profit of $400 and your initial investment was only $250. So you've increased your money, buy a $150 on an initial investment of only $250. So over 50 percent increase by using the margin instead of a 30 percent increase if you had bought the shares. So that's the difference, and that's the advantage is that if you are using margin, you just made over 50 percent because you made a $150 on it, $250 investment. Whereas if you didn't use the margin, you would have made that 30 percent difference on the stock went from 100 dollars. It would have cost you an initial investment of $500 and you would have finished at $650. Now, let's say that the Apple shares go the other way and the Apple shares actually fall to $60. So this is where it starts to get complicated. Now, your position in Apple, the 500 dollar shares, is now only worth $300. And Quest trade has given you $250. So realistically there's only $50 left in that position of your money. And when you do the math on that position, you have $50 in and questioned as $250 in, no longer meet that 30 percent margin requirement. And unfortunately, what happens in that case is you get a margin call. So this is a margin call that I actually received from Quest trade. And the first thing that I want to do here is just point out to you the time that I received this at Quest trade, it was wonderful enough to wake me up in the morning at 654 AM with a wonderful bright smiling margin call. They said I owed them a whopping $86. And now they do give you a couple of options on how to pay this. But basically this is the nice version of the margin call. When you get an email that says please pay your X amount. That's a nice version. The mean version is when you get somebody that actually calls me and says, Hey, you have a couple of options here before I liquidate your account, that's the main version. And then the worst-case scenario of somebody just chooses which stocks to sell. So the idea here is that you no longer meet the margin requirement. You're borrowing too much money from Quest trade, and therefore they have to sell some of your positions in order to bring you back into those requirements. So that's the idea here. So definitely not a fun way to start your morning. And you need to make sure that if you receive one of these e-mails, you handle it right away and you handle it the right way. Because it's really, really important and it's not a nice way to wake up in the morning. It's absolutely just a gut wrenching feeling until, until you realize it's only $86, then it's not a big deal. It's it's like, Well, don't even email me for that, but That's okay. So margin call, There's a couple of different options that you have once you receive one of these, basically you receive it because you no longer meet the margin requirements. And so the options that you have are there to get you back into meeting those margin requirements. Unfortunately, they're not going to change just because you had a bad training day, you have to change and get back into meeting those requirements. And so you have four different options to do that. Number one is deposit money into the account and with Quest trade, they actually writing the email that you have to send them a screenshot of that transfer as proof of famous. So really, really interesting there. They want their money right away and eat transfer or a money transfer might take a couple of days. So they want to know that you've sent it. So really, really interesting. The second option that you have. Close enough physicians to satisfy the margin requirements. So if you have a variety of open positions, it's going to look at your account as a total. However, if you only have one position and that is the margin trade, it will look at liquidating that position or anything else that you might hold. That's the big thing that the third thing is if you have any open orders that basically take your money and say, yeah, I want to buy this at a certain price, and that can affect your buying ability and your margins. So question may just cancel those orders without having to liquidate any of your shares, that would be a good option for you, but it will get you out of those positions. And if that stock decides to run, you may miss out on a big run. Now the fourth option is to connect your other accounts to give you more margin. Now I've seen this done a couple of times or somebody has a margin accounts that they day trader, and they also have a tax-free savings account. You can actually tie your cash in your tax-free savings account to your margin account to give you more margin in your margin account. And so I know that sounds complicated. And unfortunately, you're actually risking some of the assets that you have in your TFS a, you're basically guaranteeing them, but it came give you more margin as long as you use it responsibly, it can be a good thing. Or if you already get that margin call, but you got 50 G's sitting in the EFSA. You can link basically position to your EFSA so that you don't have to liquidate anything. I don't recommend that because then you are tying up your long-term positions. I'm basically holding them as collateral. If that position is already getting a margin call, you may want to re-evaluate just getting out of that position and liquidating right away. Because if it's already at that point, it might be a bad sign to begin. Now things you need to know is that if you do nothing, they will just sell your positions for you. You cannot ignore a margin call. And if they have to sell your positions for you, There's usually a surcharge depending on what broker you used, they will charge you a fee to basically come in and forcibly sell your shares with question about $45. And if you don't have enough money into your account, I believe that you can also be sued and held liable for those losses. Now, a couple of things that you need to know about margin accounts on question number one is they can be used as cash accounts if you do not boil the money and you do not use them margin on that account and a margin account on the couch Tian are almost the same thing on clustering. Just don't use the margin, pretty simple. The second thing is that you must convert your currencies before you trade. Otherwise, you'll be using margin and paying interests. And what I mean by that is if you put $1000 Canadian in there and then you go to buy a couple shares of Apple stock in the United States. If you do not convert your Canadian funds to us funds before you make that trade, you will actually be buying those Apple shares on margin and borrowing that money from questions, the only downside there is that you're gonna be paying interest on it, especially if you hold them long-term. So if you're basically buying any, you're going to hold Apple, are you going to hold whatever stock in the other currency for six months to a year, just know that you can paste six or 7% in interest on that directly to questions. Now if neat held changing that money over all you do is sign into your account online, you go to the web broker in question the at sign and click on requests here, and then exchange funds and then you choose your account, and you can basically choose whatever currency you want to convert it into. It's really, really simple. If you don't want to be borrowing money and paying that interest, I highly recommend you do this. Sorry, What I'm trying to say here is that a margin call as the absolute worst way to start your day. And so you want to do everything you can to avoid that and make sure that you're managing your risk appropriately. Starting with a diversified portfolio, good position sizing, good stocks, do that you're actually holding. And they actually like in the of manage their risks appropriately with a stop-loss or at least an exit point. We, you know, if the stock gets a, you're wrong, you just gotta get out of it. Dropped the losers fast add to the winners, take your profit when you need to, and we will see you guys in the next lesson.
26. Setting Up the Dashboard: What's going on, guys, my name is Zach currently Welcome to another skill share lesson. In this video, I'm going to be talking about how do you set up your training dashboard. So when you sign up for a brokerage account and you're ready to start training, how do you set up your charts, your order entry, do level one and level two data. And if you don't know what that means, don't worry about it. I'm gonna walk you through it right now. Here we go. Alright, you guys. So when you first log into question and what you're gonna see is basically a blank black screen and this is going to be your dashboard. Now, on the top you're going to have a bunch of different options and symbols that you can click on. But first I want to focus your attention on the bottom. On the bottom you have a couple of different tabs. Now, it works the exact same, exact same way as an Excel sheet or a Google Docs, whatever it is, you can pull up different tabs and it will basically reset your dashboard to whatever you had going. So when you get started, you're going to have a blank dashboard that looks like this. I'm going to create a new one right now, and I'm going to rename it to demo, demo video right now. So this is what we are going to use for this exercise right now. But if you mess yours up or yours doesn't look right or you just get tired of it and you want to refresh, all you have to do is go down there, open a new tab, set a name for it, super easy to do, and you can set up different tabs down there. So I have a tab for my watch list. So when I'm going through and I'm looking at 30 different stocks, this is the tab that I use. I'm going to hyperfocus on another stock. This is the town that I use. So that's how I set that up just internally know how you want to set this up is a dashboard that works best for you. So when I'm going to do is I'm going to walk through the different options that you need to know about. I'm going to give you my tips and tricks along the way and then you need to set it up for whatever works best for you. So starting on the top left, this is account is probably the most important screen that you have. This is going to give you the summary of your account at the moment. As you can see, I have $1200 in market value in this account right now, I'm doing a small account challenge where we turn $1000 into a million dollars. So if you want to see that, check out my other videos. But right now I've got $1200 in this account. My open positions, we'd be displayed here and my open profit and loss would be displayed right here. Now, super important because you need to know what your exposure is at any given moment. And then your clothes profit and losses right here. So this is your closed trades, whether you're up or you're down. No, this does not take into account commission commission is not displayed in these numbers, so you need to keep that in mind so you can go over, you can go to your orders at positions, executions. If I go to my last five days, you can see all of the orders that I've made and then the balance is at the back. I usually leave it on the summary page so I can see my open Profit and Loss and my clothes, profit and loss. But I usually keep this as a small little tab just so I can see those numbers. Now, something I want to point out here, super important to things. So this little paperclip link window here, and as a bunch of different colours to it, what you're going to want to do, set that to green. What is going to happen here is every window you open up is going to have that button on there. And if you set it to green in every single window, they are all going to be linked together. If you set them all to different colors, they're all going to be basically uncoordinated and not linked together. I'm going to show you why that's important here in a minute. But I'm going to move this down to the bottom of my screen for right now. So the next thing that I want to show you is level one. Now, level one is basically all the information you can find on Yahoo finance. It gives you the dividend, yield, the price, the bid, the ask and mind gives me real-time information. Now with question IQ edge, I have a link in the description below that will give you $50 and free commission. So definitely check that out. But with the free and basic version, it will give you 15 minute delayed information was spot checks, meaning if you click a button, it will give you the real-time price quote, but it won't give you any information in between there. So it's not great for day trading. You can buy a $20 data packets that will give you real-time data for $20, but it will not give you level two data. So let's jump into level two. Level one is basically the bid ask the current price, all the basic info you can almost get on, on, on Yahoo Finance, but level two is a little bit more in depth. So I'm gonna pull up level to right now it's not going to work for us, but basically the idea here is level two. We'll show you how many orders are stacked up at different price levels. So if Apple is out of a $100 right now, it will show you how many people are willing to buy at ninety nine, ninety eight, ninety seven, ninety six, ninety five. And we'll show you how many people are willing to sell at 101102103104. So what it does is it helps you determine when Apple trades and it comes to an inflection point. Is that stock in a breakthrough or is it going to fall back down? Level two can help you determine that a little bit earlier than some of the indicators. So that is why people use level two. I'm going to close this off right now because we don't really need it. The third option here is options. So if you'd like to trade options and you'd like to just click on your option, get in and out. This is a good option for you. I personally like to trade my options by using the charts, so I don't use this very much. I will show you that a little bit later on though. Order entry, this is probably the window that you need to get the most familiar with and it is the most important, and this is how you place your order. So if we're gonna buy Apple stock, this is where you enter the stock you want to buy. You're going to buy it for 100 units. You are going to place a market order that's good for the day or let's say you want to place a stop order, a 100 and fiv dollars. So if it's currently at a $100, you want to buy it at 105, this is how you would get into it, your route. I always leave this at auto. I don't really understand it, so I just let it do its thing. And then your account, you need to make sure you're trading with the right account. So I have a t FSA and a margin. I'm going to be trading in my margin account. And this is a really cool little tip here. This is what I do on all my trades. I click this little button here and it lets me enter a bracket order would have bracket order is, is it gives you your entry point, which we just placed at 105, but it allows you to take profit at X amount and enter a stop loss at X amount as well. So let's enter that right now. So if we're in at 105, let's say we want a two-to-one risk ratio, risk reward ratio. So I would get out at 115 and I would stop loss at 100. So this is one instance of how you could get in and out of a stock with a take profit and a stop-loss all in one trait. So you're not paying multiple commissions. So really great opportunity here, nice way to do it. I'm going to leave this open and I'm going to move it down here. And we're also going to set it to greed. Notice that these are now both linked to green. So very, very important feature and make sure that you're trading on the exact same thing. So the next thing here is probably the most important. This is the chart or maybe not the most important, but the thing you're going to use most often. So I'm just gonna rearrange this here and I'm gonna put this, we're gonna move this over a little bit. And I'll put that up there. And then I'm going to move the chart here and a little bit wider. So when you set up your Chart, a will have a couple of presets on it. One is it's always going to show you volume. You can move this down and you can shrink this by moving this. And if you want to see a longer timeframe, all you have to do is move the bar on the bottom. And it will stretch out your timeframe for you. Really nice if you want to change the stock, let's say you want to look at Microsoft and Apple, all you have to do is change the ticker right here and you're all set. Now, the key here is I just changed the ticker on my chart, but my order entry is still set for Apple. So the reason that we're setting everything to green is so that everything stays linked up. So I'm going to set my chart now to green. And as you can see, it reverts back to Apple. The idea here is that you don't want to be looking at one chart and then make a trade on a different stock because you were, you were basically had the ticker is wrong. So by linking everything to green here, make sure that your order entry as well as your stock chart are looking at the exact same thing. Super, super important and crucial piece here to make sure that you are trading the right piece. So that is the first thing I want to point out. Second thing is a couple of settings. If you right-click and go down to settings, couple other things that I would suggest are to adjust your margin. I adjust mind to 15. What it does is it gives you space around the top, bottom, and the side so that you have a little bit more room to draw your trend lines, draw your price lines, and figure out where the stock is going to go. So I recommend putting in your margins right here. You can also choose to show or hide your pre-market data rate here as well. So lots of different opportunities there. I would set that as your default and then you can change all your labels, fonts, colors, whatever you want, you can really play with it. There's not a whole lot there, but the buffer around the edge of something that really helps me after that. On the top left, you've got your stock and then you've got your timeframe. So if you want to look at it at six months, one day timeframe, you just click on that if you want to look at it at a ten-year, one week timeframe, super easy, you just click on it like that. So after that, the thing that you might wanna do is add in some studies. So for me I like to add into RSI, I also like to add in, whereas oscillators, the Mac do you with histogram. And I also like to add in the moving average. So these are some of the indicators that I use. As you can see, it's a little bit tough to actually see them. So when I want to look at them, I will expand them like this. I will open them up and I'll actually expand them onto my chart and then shrink everything back down so that price is the main focus. So as you can see here, soon become important. Now, when I type in Microsoft, my order is going to change. So I type in here, you can see the chart has changed to Microsoft, but so how's my order entry? So now I can switch between stocks, really simple, and I know that everything is going to be linked up. So super, super important feature here of linking your charts together. So that is the stalks. Now, the last thing I want to talk about his drawing, so I added in my indicators. Now if I want to draw a trend line, really simple. If I want to add in or Priceline, really easy right here you can see there's a little bit of support and resistance. Here we go. You can draw in all your lines and then you can add in your Fibonacci Archie retrace mints, whatever works best for you and whatever you like to use, it's probably inherent, it's probably easier to use. So that is how you set up your charts to remove a trend line, you just right-click and click on remove. So pretty simple and pretty straightforward. You do need to play with this. To add in the indicators and the lines and the systems that you like to use best. So this is one way that you could set up your system. Again as we go back, like let's just go to square. And as you can see, everything is going to link up my order and she's linked up. And if we pull up the level two, we can put it right here and we turn this to green as well. Let's say we go back to Microsoft and now it changes everything back to Microsoft. So really easy, really nice. The big key here is make sure you have all of your different windows linked up, and that is how you can start to build your dashboard. Now, I'm gonna clear this out a little bit just so we can walk through the rest of the features that are on here. So real quickly, we just did a chart. Let's go to news and insights. If you type in Apple, this is where you would find the different stories on the different companies. Now it's Sunday afternoon, so it's not going to give me anything right now. Event calendar, here's where you can find dividends, earnings if you'd like to trade earnings, E-Trade big gaps. This is the great place for you to figure out when the dividends are being paid, when the earnings are coming out and when the new announcements are being released from the different companies. Again, it's Sunday, so I'm not getting any information, but that's okay. Stock view now this is basically everything that Yahoo Finance is gonna give you your today one year, basically all the basics of that particular stock. So if you're a long-term investor, you just want a quick look at it. It's definitely a good spot for you. Market view is gonna give you the entire market. So as you can see right now, we're looking at the TSX. We had a 103 stocks up in a 104 down on Friday. You can change the different indices and you can basically go through anything you want. So this is the Dow Jones 28. Pretty, pretty easy just to see how the market is doing. After that, we've got stock tweets now this is kinda like Twitter buff requests trade. I haven't used it. I haven't played with them much, but I know I can share my charts in here. I haven't done any of that and I don't really like to take other people's suggestions for what I should buy and sell. So I'm sort of in my own head when I like to do that, and I don't participate in the stark tweets, but it is there if that's something that you like now, screener here is one different way that you can look for different stocks. It's really good for implied volatility. But what I like to do when I'm looking for stocks is go to market movers. I find that this is a little bit simpler to use. And for instance, I can go to the US market, look at top gainers by percentage, and it will give me all of that information now, unfortunately, it's Sunday, so it's not giving it to me right now. But you can go by gainers, losers, active, 52-week high, whatever you wanna do, and we'll give you all of that information. So the basic screens that you wanna do, this will do everything that you need for it. If you want to do something more in depth and do it based off an indicator, based off a market cap or a volume. Then you may want to go into the more in-depth screener and add that in as a functionality. Now your watch list here, this is probably one of the most important things when you're just setting up. So when you click on walks us, it's gonna give you this basic window right here. And it's gonna give you basically all of these different, all the different indices. Now I'm going to pull up a stock chart here just so you can see why linking them up is so important. So we'll link this to blue this time. We'll link this one to blue as well. And as you can see, I can now click on my watch list and I can go through, and I can cycle through everything that's on my watch list now. These are just the indices. Obviously you wanna build your own, so you just click on new watch list and you go Zack's favorites. And then you go apple, you add that in, you go square, you go Microsoft. Let's add Tesla. Let's add Neill. So we've got Zack's favorites in there. And now as you see, I can again go through and click through just like this. And then, and then when you're ready, you add another watch list. All you do is click on the tab again, I have a couple of already built in here. So this is going to be my specialty watch lists. So as you see, I can go through, I can look at these and I can see how terrible damsels Arians company is ignite cannabis. You should watch my video on them because they're absolutely terrible. And I'm going to come up with even more content on them, but their company sucks and their stock charts even worse legged s, It's just bottoming out at $0.60 the whole way through Daniel company sucks. Anyways. That's enough of my venting. So that is that is my watch list. That's basically how you use the watch this. I highly recommend this and what I would recommend is create one of these basically dashboard specifically for your watch this. So that way you've got ten different charts on your monitors. You just bang it through your different watch list and you can see everything come up and then do another dashboard where you're focused super heavy on one stock and you see it at different timeframes. And that's how I set up my dashboard and that's what I would recommend for you. So watch lists, we went through that time and sales. Now this one's really cool, obviously Sunday again, so there's no time in sales happening right now. But what this will do is it will show you every single transaction on a specific stock. So you link this up to green, just like we had before. And when you're on Apple, it will show you every single transaction that comes through for Apple's stock, and it will be green if the price went up, it will be red if the price went down. So if you have this open on your monitor and the whole things read, I sure hope viewed on on the stock. That's basically the idea here. It is a good way to tell is this is this stock flushing right now or is this just a little, a little dip? So good way to tell. After that you've got your profit and loss calculator, you've got your alerts, you've got activity. So you're alerts are basically, hey, these are the price levels that I wanted to be alert at. Activity is basically anytime you've logged into your account and the profit and loss calculators where you can input your different variables and we'll tell you what your breakeven is and how much money you're actually going to make. So lots of different options with those ones, inbox, goto and research. This is basically if somebody sends you a message or if you have a couple of different people trading on the same thing, go to as basically sends you back to their website. And researchers are market intelligence and enter day trader that takes you again back to a website, so not super useful for us. For us, the main thing for that we want to look at is the chart, the order entry, our account level too. If you're actually going to use it, you may want to look at another chart that has an index on it. And basically, this is what you're going to want to trade off of. We're also going to add in time and sales there, and we're going to drop that down as far as we can. So real, real simple. I just clicked on like six buttons there. I've walked through all of them for you. And this is what you could use for your training dashboard. Really easy, real simple. You've got no, let's link all of these up real important. Let's just make sure we're on the same page there. So now when we go to Apple and now let's say we want to Microsoft, everything trades over. If I want to buy into Microsoft real quick, I can get in right there. So really simply use really easy to use. I really hope that this helped you out or at least help to walk you through some of the different things you may need to know.
27. Trading Journal: What's going on, you guys? My name is Zach Hartley and in this video we're gonna talk about trading journals and why you need one, as well as a couple of different options that you can use for your journal. Here we go, okay, so trading journals, let's just start right from the top. So what does a trading journal? Well, it's really simple. It's basically the equivalent of a pilot's flight log of pilots flight log tracks every flight they make. And it's basically a history of what they've done in their career. A trading journal is sort of the same idea. It is a log of your traits, your strategies, and your mindset going into those traits, as well as your entry and exit points that you can then look at and use to determine how you can improve or laminae some negative habits. So, so why do you need a trading journal? Well, the number one reason you need a trading journal is because trading softwares don't provide you with analytics. And so that's where you can pull those analytics from to refine your strategies and become a better trader is through your training journal, not through your trading software. Secondly, it helps you identify winning strategy. So if you notice that you're buying the bounce and you're successful and 90% of the time, but on the breakouts, you're not doing very well at all. You're successful under 50%, your journal is going to help you identify those trends and help you improve your trading strategy. Thirdly, it's gonna measure performance is going to measure your win percentage or average when your average loss and all the different metrics that you were going to want to keep track of in order to improve your trading. Fourthly, it's going to help you identify mistakes if you see that you are feeling FOMO every time you make a mistake or that you are taking a specific action and you are losing a trade very consistently, your journal will help you realize that, and it will also help you reflect on your trading at the end of the day, at the end of the week, you can look back on your training and say how well did I perform it and how can I improve? So let's just touch base on that first once again. So on the right-hand side here you can see a screenshot of literally my trading screen is my orders in the last 90 days, all I did is take a screenshot and this is what quest Trey tells you. No, it's real Great. Lots of details about each order and when you placed it and how it was placed. But it gives you absolutely no information with regards to your analytics such as your trading win percentage, your average gain, average lost, best strategy strategy when rate, best time of day to trade, the traits per day and you're trading calendar. So you can actually visually see red and green how well you're doing. And so quest, trade, thinkorswim, and none of these platforms give you any of that kind of analytics. And so that's why the number one reason that you're going to want to create a trade journal. Now, when you create a journal, there's a couple of different options. And number one is make your own excel sheet. You can basically keep track and import your data from your trading software into an Excel sheet and then analyze it there. Option number two is to use my Excel sheet. It is linked down below. The third option is to sign up for trade or sink. Now trader sink is an online platform that gives you much more analytics and you'll ever be able to get from Excel. However, you do have to pay for it. It is on a monthly or yearly subscription. Do you think it is the best journal that you can create? It is better than any excel sheet you think you'll be able to do. I will walk through it in this video. And then the last one is other online subscriptions. There are plenty of online softwares out there that will be an electronic and online digital journal for you. They're great out there, but I do recommend trait or sink if you're going to look for one of those. Okay, so let's get right into it. Okay guys, so here's the trading journal that I made on Excel. Now it's super-easy. There's nothing complicated about this. It is designed to be a framework that you can build on if you want to add in more KPIs or you want a different feature, all you have to do is plug it into the excel sheet and you can build on to what I have here now, super simple, all you have to do is go in here and fill your trading log. So for us, we're trading on Monday, we're going to trade apple. The strategy for us was to buy on support and we had our target hit. We made a $150 on this trade. Now the next trade was still on Monday, but we traded Microsoft and the plan here was to buy a breakout. However, we put in a trailing stop loss and unfortunately we got stopped out at $50. We played one more trade on Monday. This one was for Tesla. We bought it on the breakout. That was another trailing stop, and we got stopped out with another a $150 profit. Now as you can see, all we did was fill in our three trays there. But you can see my average wind was a $150 or average loss was 50, or risk to reward ratio is 300%. Our largest wind was 15050, or total wins was $300 and total, total loss was 150, and our trading profit was 150. So really nice. All you have to do takes five seconds filling your traits from the day and it will give you some of the main KPIs or you want to look at. And when you're done this month, all you do is copy and duplicate the page and create month two. And then there's a summary page here where you can start to add in all of your profit, your risk reward ratios, and all of the information from the different months on the left here. And it will start to spit out a graph that starts to give you information with regards to trending, how much money you're making each month or losing each month, as well as what is your risk return ratio on HR format? Now, this is really nice. It's a great starting point and it's really good. If you're great with Excel, you want to build on to it. It's here, it's free to use for the next little while. However, if you're looking for something a little bit more professional, what I would recommend is trade sync. Now trade sync is a software platform where as you can see, I can keep track of every single trade I've ever made. It displays it on a calendar like this. And then when we go to the dashboard, you can see all of my trades that we made. So annual return when rate loss rate average return and all my trades here, broken down by the strategy and how I was feeling mentally. Now the nice thing here is we go to reports and you go to overview. You can pull so much more data from tracing than you would ever move to pull from an Excel sheet. Let me show you what I mean by this. So a cumulative return and then you can see every stat you would ever want to look at is down here and laid out. And if you want to, you want to dive in more, you can see it. What is your best trading by the hour? You can see for me is from that ten AM to 11 AM periods. So if you go down, you can go to the weekday, you can go to the mistakes. You can go by different strategies. You can look at whatever works best for you, and you can figure out how to improve your trading based on the analytics in here. So just quickly in summary, let's cover a couple quick points. Okay guys, so in summary, you need to have a training journal, a trading journalists, the equivalent of a pilot's flight log. You can't go without it. You need to have it to keep track of your traits analogic trading and improve your trading over time. Secondly, you can start with an Excel sheet, but I do recommend tracing. They're extremely good at taking in all of your information. All you do is upload it from Quest trade into trade sink or whatever platform you use. It will analyze all that data and give you the dashboard exactly like what you saw in this video. It is extremely helpful in much better than anything. You'll ever get it excel, and you don't ever have to worry about messing up the formula. And lastly, find the strategy with profitable metrics. That is the whole goal of using a trading journalists to improve your trading, find a strategy that works for you and slowly refined and hone in that strategy so that you can improve your training and make more money. That is the entire goal of trading the stock market. That is why you need to have a training journal. I see you guys in the next video. Here we go.
28. Hot Keys: What's up, guys, welcome to another video. In this one we're gonna talk about hotkeys. What are they, how do they work and how can you use them to improve your trading? Here we go. So the reason you're going to want to use hotkeys is because it allows you to enter and exit your orders much, much faster. What I mean by that is when I traded stock, I have to pull up the order entry. I have to set the ticker, I have to set the price that I want to buy it. And I said the quantity, I then have to click on send and I actually have to confirm that trait, meaning it takes 34 or five different clicks for me to actually execute that trait. What hotkeys allow you to do is to put all of that information down into one buttons so that if you want to get into that trade, you click on hotkey number one and you are automatically and you don't have to go through a bunch of different steps. This is great because it allows you to get in and out very, very easily and very, very fast. But you need to be very careful not to bump into those keys as well. So let's get into my keyboard now and the software that comes with it. Okay, so I keep it really simple as you can see, I'm literally just using a block with keyboard. You can buy this at Walmart. And on the left-hand side here you can see there's five buttons there, g1 to G5, and those are my honky. So those are the keys that I can actually program and I can control what to do with them. And then I've got my computer set up here where I can actually get into it and I can make those traits instantly. Now realistically, you can use any trading software, any trading platform you want. But what you will need to do is get a list of the keyboard shortcuts for that trading software. Because what's going to happen? We're going to program a series of these shortcuts into our hotkey. And that is what is going to allow us to actually use the hockey to buy and sell these shares instantly. Now, as you can see, I am using a black web gaming keyboard, but you can use any keyboard you want. It just has to have a couple of hockey zone at that you can program. Now, each one of your keyboards will come with a software. It will either be in the box, there'll be linked in the user manual, or you can find it on Google. They're not hard to find. You just gotta do a little bit of dating, but you will need that software in order to program your keyboard. And that's what we're going to dive into right now. Okay, so this is what the software looks like from my specific keyboard, as you can see, it's black web and the top there. And then you can see G12, G5. So these are the specific buttons that we are going to program. Now it does have a little visual reference here, and as you can see, there's m1, m2, and m3. And so what this allows you to do is kinda create different options. So if I wanted to have six to ten buttons or 11 to 15 buttons, I can then program into m2 and m3, and it will give me more and more buns. I can also create different profiles, I believe up to five of them. So I can actually have like 15 times 575 different hotkeys programmed into this computer, which is super, super good. But for me I keep it simple. So my g1 is buy at market, my G2 is sell at market MIG F5 is cancel all of my orders. But what I wanna do is we're going to program G4 so that I can show you exactly how to get in and out of your positions instantly. So what we're gonna do is we're going to click on G4. And as you can see, we get the Macro Settings page that comes up. You need to go down to the bottom left side and click on new. This is going to bring you back up to the macro name and you are going to hit by two. That's going to be the title for this one. This is going to be my second test version of how to buy it market. And so what we're gonna do is we're going to repeat the macro only once. We don't want it to continuously keep going. Ok, now this section here below is where we're actually going to program what goes into our hockey. And so the idea here is that we're going to click on record. We're going to type in a series of buttons and then we're gonna hit stop recording. And we are going to program our hotkey to perform the action of that series of buttons. And so that is why you needed to get your little keyboard shortcut. Your software. And so what we're gonna do here is programmed this now. But the first thing we need to do is adjust some of the settings. So as you can see here up top, we have the delay. No recorded delay means that if it takes you three seconds to type in three buttons when you click on your hockey, it's gonna take three seconds to actually execute that order. The fixed delay allows you to program a preset delay in between each button and then ignore delay means that it's going to press those buns as fast as computer possible. Now for us, we want to go very fast, but unfortunately, question won't be able to pick up on our button presses if they are back-to-back and we ignore the delay. So what we're gonna do is we're gonna click on fixed delay and we're gonna do 100 milliseconds. And then we're going to hit start recording and we are going to execute our actual trade through the programming software. So for me using question and I'm gonna hit start recording and then I'm gonna go with F4, Enter, Enter. And it's so as you can see, I'll hit stop recording here. And you can see here that it is automatically input 100 milliseconds in between every single keystroke. And that is going to allow quest trade to pick up on the fact that it's actually two different keystrokes instead of one being right back to back. And that is what's going to allow us to program our buns and actually execute these traits. So the last thing we need to do now is hit on, okay, and then we need to apply it to our keyboard. Now it is time to actually pull up our training software and test this out and try and make a trade. So this is what it looks like. As you can see, I've pulled up the Apple stock chart and we are looking at it on, on one minute timeframe you can see the stock actually just bounced off this basically 115 level and it's already over 1 16th. So we want to try and buy this right now. And so what we're gonna do is I'm gonna pull up my order entry and I'm also gonna pull up my account. And the account is gonna show you that we actually get into the Stark. And as you can see up close to a 102 shares today, this is my practice account. So I'm just testing this out and I wanted to do that before I made the video. Now, here we go. I'm going to type in Apple here. So now we're looking at the Apple stock we're going to buy, let's say 200 shares. Analysts said this to a limit. So that way, when we press G4, which we just programmed to buy the shares at market price, it is going to execute whatever quantity we have in here is going to change the order type to market. It is going to click on buy and it is going to click on Enter and confirm that trade. And that should execute us into this trade almost instantly. So that is what we're gonna do right now. All I'm gonna do is click on G4, which is my hockey that we just programmed. And we're gonna see if we can actually get into this trait. Ok, here comes a finger press. Boom. As you can see, we just got into the trade by 200 apple at market. And so that worked out absolutely beautiful. So we have now executed that trade, as you can see when I go into my account here we have got Apple, we've got open quantity of 200. And if I press it again, let's just see what happens. Boom, we've got another 200, so now our open quantities 400. Now here's the tricky thing is now you have these hot keys that are executing orders for you. So you have to be really, really careful with them because if you accidentally tap on that, link it out, I just want another 200 shares of Apple and it took all the was, was a little bump. We currently own 800 shares of Apple right now. And all we did was hit two little buttons. So we gotta be really, really careful with that on your keyboard. I've messed that up before, and I've paid dearly for accidentally bumping my keyboard. So you need to be very careful when you are programming these hotkeys. You need to be very careful when you're trading with hotkeys because things can move very, very quickly. So, so in summary, that is, you program your hotkeys, you gotta find a keyboard that has the buns, you gotta find the software. You've got a program that sequence of events that you want that hockey to represent, and then you've gotta go test it out preferably in a practice account like what I just did. Don't do this in your real account because if you mess it up and you buy too many shares or you short the stock, a can go really badly for you. And lastly, mixture, you do not bump those buttons once you've programmed them. So that is all my advice and we'll see you guys in the next video. I hope you learned something here.
29. Day Trading Order Types: What's going on? You guys welcome to another video. In this one, we're going to break down all of the different order types that you can use when you day trading, swing trading. Here's what you need to know. Okay, so when I talk about order types, I am referring to how your order is placed. You want to get in at the market price. Do you want to get in at a certain price or do you want to stop and get out of your trade at a certain price that is all dictated by your order type and so on quests trade, that's the platform that I use and this is what it looks like here. As you can see, I got a little green box and it's a dropdown menu that basically gives you a bunch of different options. And so in this video we're going to break down all of those options, okay, so the first-order type is probably the most common and the easiest to understand. This is the market order. And so by the way, I've taken all of these definitions directly off the quest trade website. And so this is what it says a market orders, the simplest of all order types that allows you to buy or sell securities at the best available price given in the market at the moment your order is said for execution. So the best use for this is to buy right now. So if you wanted to sit down at your computer and say, I want to buy Apple stock right now, I don't care what the price is. That is when you would place a market order is the easiest to execute. It basically says, OK by one apple and it says, okay, get in and out as quickly as you can at the best price possible. You're basically and, and get it out whatever the stock is trading at as soon as you hit that button. That is the idea behind a market order is probably the simplest to understand and the most commonly used. Now the next order is called a limit order. A limit order allows you to specify the maximum price you'll pay when buying the securities, or the minimum you'll accept when selling them. So the best use for this as buying dips, let's say apple is trading at a 100100100 and you want to place a limit order to buy it and $95. Well, this would be your opportunity to bind to the dip by placing a limit order and $95, as soon as the market price drops to $95, it will execute and it will get you into that stock. It is a great opportunity for buying stocks as they go down. Or when you're buying a dividend producing stock and you can buy in at a lower price. A limit order is a great way to do that, okay, the third order is a stop loss order. Now in my mind, this is probably the most important or that you need to be well aware of N. A stop-loss order is a type of order used to buy or sell securities when the market price reaches a specified value, known as the stock price, stop orders are generally used to limit losses or to protect profits for a security that is being sold short. So the idea here is if you get into Apple at 100, but you know that if Apple jobs to 90, it's probably going lower and lower. What you can do is you can place a stop loss order at $95, and as soon as the price gets to $95, it will execute that trade and it will get you out of that position. So he stop loss order is usually an order that is placed after you're already in the stock and it is placed at a slightly lower price than where you think it's gonna go. And that is to get you out of the position. Ok, now the next order here is a trailing stop loss order. So I'm going to read through this and that explain it. But a trailing stop loss order type of order that triggers a market order to buy or sell a security. What's the market price reaches a specified percentage or dollar trailing amount that is below the peak price for cells or above the lowest price for bys. And so basically what this is is a stop-loss that moves along with your price. So let's say you get into Apple at a 100 and Apple starts to move to 110120, you can put it in a trailing stop loss order at either a percentage or a dollar amount. Let's say it's $10 in this case. And as Apple moves up to one hundred thirty, one hundred forty 150, that trailing stop-loss will always stay $10 behind the highest point that that stock moves. If the stock goes all the way up to 150 and you have a $10 trailing stop-loss on it. And then the star starts to dip a little bit. You will keep a stop-loss at $140. And if the stock falls all the way below 140, it will get you out rate at 140 as long as there's no big gaps up or down overnight. I personally use trailing stop losses to get out of my positions because if the stock continues to go up and moves my stop-loss up with it, and I'm allowed to capture that upside. However, if the price begins to move down a locks in the profits that I have and it gets me out at a reasonable level. Okay. Now the next order here is a stop limit order. I personally don't recommend using this one. It's a little bit more complicated and it doesn't really fit into many trading strategies. I'm going to read this out for you here though. Stop limit order combines a stop order with a limit order with this order type, you entered two price points, a stock price, Andy limit price. If the market value of the security reaches your first stop price, it automatically creates a limit order, which is your second price point. And as long as it happens within the specified duration of time. And so what's happening here is you're basically saying at this first-price point, I want to trigger a new order to appear at this price point. I want that or to execute as long as it fits within this day. Now, there are very, very few situations where this type of orders actually get a benefit you, that is why I do not recommend using it. It's very, very rare that this actually works out. And it's kinda like trying to limit your losses, but it's just a weird situation. So personally, I don't recommend using this one. You don't really need to know about it. And I would just focus on the other ones that have gone through here. Now the next one here is sort of similar. It's called a trailing stop limit order. A trailing stop limit order is a type of order that triggers a limit order to buy or sell a security once the market price reaches a specified dollar trailing amount that is below the peak price for cells and above the lowest price for bys. And so basically what's happening here is you're doing sort of the same thing, but instead of a limit order, it is going to be a trailing limit orders so that hopefully can go up with your price here. This happens a lot when your price dips. I'll drastically after you buy in, this can then be a good opportunity for you. But again, it's pretty rare. It doesn't fit into many strategies. And most of the time you're much better off cutting your losses quickly and getting back in at a better opportunity rather than trying to pull out one of these stop limit orders. Now the last two orders that I want to go through here, I do recommend definitely depending on your trading strategy. So the first one is a limit on open order. So when you place a buy order with a limit on open order, you are setting the maximum price you're willing to pay if the market price at open on the following trading day is at or below the maximum price that you set, your order is processed. If the market price is above the limit you set, your order is cancelled. So this is usually the type of order you would place when you are after hours or you're late at night, or you come home after work, you want to get into, let's say, Apple, if it opens up to moral below a $105, but if it opens out 106 and a gaps up big like that, you don't want to get into it. That is when you would use this type of words. Usually when you late at night, you're after hours and you can't make it to computer. And you'd want to get into moral as long as the stock is below a certain price, and that is when you place a limit on open order. Now the last type of order is a limit on clothes order. And so when you place a buy order with a limit on clothes, you're setting the maximum price you're willing to pay if the market price at close on the current trading day is at or below the maximum price that you set, your order is then processed. If the market price is above the limit, you set, your order is cancelled. And so basically what this is for as buying in at the end of the day. So if Apple has a massive, massive drop and you say, OK, I want to get into Apple, but if it shoots back up, I'm out. That is when you would use the limit on clothes order. This is really good if you're buying into cashflow producing assets such as dividends or reads, that is usually when I would use a limit on clothes order, but most of the time I'm TA training or getting into a quickly while I'm sitting at the computer. So I very rarely use the limit on clothes order or a limit on order open, but they are great. We're working full time or you can't make it to your computer, whatever the case is, these are the type of orders that you may want to use in that scenario. Now in summary, you need to make sure that you understand these different order types. I know that there's a lot there and the best way to practice them and use the different kinds is to use a practice account that way you can make as many traces you want. You can buy in and out of them immediately and right away. It doesn't matter at all on this where you can get familiar with how they work. So if you don't have a practice account, you should definitely sign up for one. I've been trading for seven years and I still have one that I use to play around with and test out different strategies.
30. Order Duration: What's going on, guys, welcome to another video and this one we're gonna talk about order duration. What are the different types and when should you use each one? Here's everything you need to know. Ok, so order duration refers to two different things. The first one is how long your order is open for. So if you place a trade for, let's say, a 100 shares of Apple stock and it doesn't get filled right away, your order duration dictates how long that order is open for. So does it go on until tomorrow or the next week or two, a specific date. And then the second thing is how you trade can be filled, whether it can be filled in part or in whole. So let's say there's only 50 shares of Apple available at a $100, but there's another 50 available at 101. This type of order duration or which one you select will dictate whether or not you will accept that entire package of those two shares or if you'll only accept 50 or if you won't accept anything in this scenario. So your order duration is super important because it dictates how your orders will get filled. And if you mess this up, you may end up owning the stock three days later when you weren't expecting it. And it can definitely way on you a little bit. So you need to be very careful when selecting your order duration. This is definitely an important step, starting with a day order. Now this is probably the most common type of order and probably the most well recognized. It's probably the default setting on most brokerages as well. And basically, this order will remain active until the end of the current trading day. If the order is not filled, it is cancelled. And this is usually used for kinda short-term or medium term trading, even some long-term training. It's basically when you want to get in today. You want to say I want to get into the stock today. And if this order doesn't get filled today, I don't want to have to worry about it overnight or tomorrow, so I want that order to cancel at the end of today if it doesn't get filled. And that's the idea behind this one so that hopefully if it doesn't get filled, you're not worried about it getting filled later on down the run. You don't have to worry about it at all. The traders didn't work up. And so this is probably the most common setting for most brokerages. Now the second type of duration that we're gonna look at today is the good till date. And so this is when your order stays alive until a specified date. So for instance, if you want to buy Apple and $95 and is currently trading at a 100, you can say, hey, question, I want to buy in at $95 aimed keep this order alive for one month or two months or three months, and you set the actual specific day where you want this order to cancel or basically expire. And this is really good if you are going to buy the dibs, if you're gonna average down whatever your strategy is or however you decide to actually work out your trading methodology. This is a great way to do it, especially if it's a business that's paying dividends or generating cash flow. The third order type is the good til canceled order. Now, this one is basically one that will stay alive indefinitely or as long as the training platform will allow it. Now one quest trade, it automatically cancels after 90 days. However, on international brokers and all of the other brokers out there, it is different, so you have to determine so you have to figure out which one it is for your broker on quests trade, it's 90 days, but basically this, we'll try and keep your order alive for as long as possible. So if you just want to buy in to Apple at $90 as soon as it hits there every single time. This is the order for you. So the next one here is the Good Til extended market. Now this one will let you basically keep that order live in pre-market and post markets DO instead of canceling at the end of the day or executing at the end of the day. This one will keep you alive pre and post market, however, if it is not filled by the end of the post-market, so usually around six or seven depending on which market you are trading, a will be cancelled. Now if you are trading and the post-market or in the pre-market sessions, this is usually the order that you will want to use, okay, now the next order is called the fill or kill the FOK. And basically this order will fill immediately and completely or it will not fill it all. So basically what it's saying is it is going to get you in for this exact order at this exact amount and completely or it will not fill the order at all. So if, if we had that scenario with 50 shares of Apple where available at a 150 shells, shares were available at 101, but you wanted to buy a 100 shares in total, this would not execute your trade, so you need to be well aware of that. And these order durations do matter because it will make the difference between executing and not executing your trade. The last one here is the immediate or cancel. Now basically what this one is saying is, here's my trade. Fill as much as you possibly can immediately and cancel everything else. So if I can't get in at a $100, I don't want anything else. So in our example of 50 shares at a 150 shares at 101, if you had used this duration, it would've executed on those 50 shares at 100. It would not have filled the order on the 50 shares at 101. And so that's the difference between these two is that one of them will take partial of that order, whereas the fill or kill will not take any of that partial order. And so these are probably the two most common for very short-term or day trading durations. In summary, you need to make sure that you understand these because it dictates how long your order will exist for and how your order will be filled. And if you're not aware that your order is still alive, you could end up with a whole lot of shares that you weren't expecting at a later date and it could really throw off your portfolio. So you need to be really, really careful with this. And secondly, if you're unfamiliar with this or you want to try it out, or you want to give it a test run, you need to set up a practice account. I've been training for years and I still use my practice account every single week to test different strategies, different order types in different durations. I play with it all the time and I highly recommend you have one to test out these different types of orders with before you actually go out and use your real money.
31. Setting up indicators: What's going on, guys, welcome to another video and this one I'm going to walk you through what indicators I use and how to set them up in quest trade. Here we go. Okay, so this is what it looks like when you open it up, if you click on Charts here, it will basically open up a stock chart for you any usually starts on Apple. But what we're gonna do today is we're going to look at Netflix. So you just typed in the ticker symbol up there and it will pull up the chart for you. Now, when you pull up a stock chart, it will basically auto populate with the volume on here. And right node is in a one-minute timeframe. So I'm gonna change this to a six month one Dave timeframe. So each candle here is one day and we've got the volume down here on the bottom. Now, there's a little bar at the bottom here. And if you move it, you can kind of stretch out the chart or you can shrink it up rate till the end. And you can also change the size of the volume here. So really nice. So as of right now it kind of starts with volume already on your chart. And so to add the Mac D or the RSI, which of the two that I like to use most predominantly, I click on studies right here and then I go down to trend indicators, and I click on the Mac D with histogram and it will auto populate right at the bottom there. And, and then I'm also going to add the RSI. So the relative strength index, when you click on that, a particle is just below the Mac D. And as you can see, I can extend and contract this as much as I want. And so that is how I basically set up the underneath my chart, I have the volume to tell me how popular this stock is right now and how many people are actually trading it. The Mac D helps me determine the direction of it and the RSI helps me confirm whether it is over bought or oversold. And so that is how I settled at the bottom of my chart. And now to set up the basically studies or the overlays on the actual charge. There's a couple of different things. I usually start with my drawings and the two drawings that I use most predominately, or the trend line and the Priceline. And so I'm going to start with the Priceline. I'm going to draw it here at our high, I'm going to draw it here at our low. And I'm also going to draw one here because I think we've got some support there. And so I have my price lines extending all the way to the right. Now if you want to change those settings or you want to put those settings and you click on right-click and then you go Edit Priceline. And you can see this little box here where it says extend price line to the right, you click on OK and we'll extend your price lines. You can also adjust a couple other things in there. And so this is how I set up my Priceline's. I'm also going to add in a trend line. You can see this was sort of coming in from the left-hand side there and a little down, a little up. And that's how you would draw your trend lines, basically connecting the highs and lows wherever you'd like. Okay, so now that we've got our price levels on here as well as our trend lines, it is time to add a moving average. And so that's really simple to do ego trend indicators a ego moving average, and it will auto populate this blue line here, which is a 20-day simple moving average. Now me personally, I like to use an exponential moving average. So all you do is double-click on it at the top here, you come down here and you change it from an SMA to an EMA, you click on apply and then you go, okay? And all of a sudden you now have an exponential moving average. Let's say you wanted to use a volume weighted moving average. It's really simple. You go trend indicators and then you have that option right here, volume weighted moving average. I'm going to leave it right now, but that is how you set that up. So now, based on this chart, we've got a couple of different things we can pull here. If we have increasing or decreasing volume that can give us a buyers sell signal. If we have a crossover of the mech d at any point we can get a buyer sell signal there. If we have the RSI enter or exit the overbroad or oversold zone. We can get our entry or exit there. We can also withdraw that from our price levels in our trend lines as well as the price level crossing above or below are moving average. You can also add in one or two, maybe even three more moving averages or even your Bollinger Bands To get more and more signals. But I do not recommend overload yourself or you overwhelm yourself. Now, the one thing that I do recommend you add to your chart is a little bit of a margin around the sides here, as you can see, my price action does not go all the way to the sides. It does not go all the way to the top or to the bottom. And you can adjust that by right-clicking Here, you go down to your settings and there's a couple of settings in scaling here. I put a 15 bar margin on all of my charts. And what that allows me to do is have a little bit of space here between the end of the chart and the actual price action itself. And it just helps me understand the chart a little bit better and just kind of space it out a little bit more evenly. And then as I'm going through here, I will basically take my trend line indicator and I'll say, okay, the price crossed through the average there, across, through the moving average there. What do the rest of my indicators look like? What did the volume looked like at this point? What did the Mac do you look like? Oh, look at that. The MAC DEA crossover points basically the exact same time. I wonder what the RSI loads like. Oh, as you can see, the RSI left oh, tested, basically left the overbroad zone and then started to come down again over there. It also left the over bought zone right here. So really interesting how you can set this up and how some of the indicators start to align, especially when you say your chart up properly. This is how you get your buying yourself signals. And this is how I look at the chart. I am swing trading or when I'm day trading. So, so the big message that I'm trying to get across here is that you need to combine and use different indicators, but you do not want to overwhelm yourself. I've seen different charts out here where you can barely see the price action on the chart because there's so many different overlays on it and that is not going to help you at all. What you wanna do is find the indicators that have a history of lining up well with that particular stock and use those indicators for that stock is going to change from industry to industry. It may even change from start to stock. But what you wanna do is try to figure out a pattern and when, and we have six out of eight indicators that hit five, maybe that's your strategy when you have seven out of eight, when you have eight out of eight indicators that all heave you by saying those. It depends on your risk tolerance, but you need to figure that out internally. And I do not recommend adding more than maybe six or seven different indicators to a chart. It is not going to give you any good that seventh or eighth or ninth indicator is not going to give you a clear answer that the first six did not. So make sure you do not overwhelm yourself when it comes to these indicators, make sure you understand what the indicator is telling you because most of the time they're telling you different things. Volume Actaeon, RSA, or ultimately need different things. And so you need to understand where each one of those is coming from. And if you have any questions, shoot me an email. I'm happy to help out and we'll see you in the next video.
32. Uber Trade: What's going on, guys, welcome to another video. In this one I'm going to break down and options trade that I've just made on Uber, we're currently up above 500% right now. And so what I wanna do is show you how I found the trade, how I analyzed the trade where we're currently at and why I'm locking in my profits right now. Here you go. Okay, so let's just dive into this chart and I've been watching Uber for a while, they IPO and maybe two years ago, a year and a half ago now. And this is where the IPO that RED around this $4,142 mark. They went up to a high of around $47 before crashing all the way down during the height of Kobe to $13. And since then, the chart has been super interesting from a technical perspective. And now we have just had a huge breakout going right here. And I was able to capitalize on that full break. Oh, so what I wanna do in this video is breakdown for you what technical analysis I was looking at and why I was looking at it. So first of all, when I'm looking at a chart, I'm always starting on the largest scale. I will always expanded out as far as I can. In this case it's only about two years because Uber recently IPO to about two years ago. And so what we're gonna do first thing is just draw the highs and the lows of the chart. So right here just after IPO, it looks like the stock at a high around that $47 mark. They also hit a low of that $13 mark. We also have a little bit of a high kind of set right here around $41 and a little bit of resistance set here, and we also have some support here. So real quick, just nice and simple. All I did was draw up the price level support and resistance lines. And then we can sort of dive into that. So we know our highs around here. We've got some support down here around 1314, some resistance at 38. And it was this section in here that really caught my eye because I always thought that I was starting to pick up on a little bit of a pattern. So when I zoom in on this, you can see a couple of things. Number one is this level right here around 3350 seems to act as resistance and then some support. So what I mean by that is when I draw trend line, you can see the price comes from 38 down to 29 and then it goes from 29, were age here to around 3350 and it gets rejected. It comes back up right here, and it gets rejected again, and it comes back again and it gets rejected. So three times in a row, this 33 AT 3350 level has acted as resistance and it is rejected the price level three times. It kind of did it again right here where the price dropped all the way back down to about $31 and then it broke through. It broke all the way through to $38 right here before coming back down and using that same 3350 level as support. So I found that really interesting. This little acted as resistance and now it is acting as support. And so, and so if I can time this properly and time to bounce off of the support, that could be my trading opportunity and that's what I was looking for. So comes back up to 38, it gets rejected again, it comes all the way back down to 34. It makes us small little push here before getting rejected again and testing this 34 doubt dollar level again. So all of a sudden now we have tested this support level three different times. And then on November second and November third, we actually had to green days that completely wrapped up on each other. And so I thought, well that is a super-strong signal that is a very clear bounce off of 34. This stock is bouncing off 34. It has potential to break through 38. And if it does, I definitely want to capitalize on that. So I actually made my trade right here on November third, I got extremely lucky Johann hit, you could say I did it for technical analysis and I bought in for a reason. However, I was not expecting this octa gap up like 14%. The next day, I was expecting a slow and steady run through 38 and hopefully to 42. However, we are currently at 4962 and I bought in right here, and so it has been an amazing run. I did not buy the stock though, I actually bought the option. So I'll show you that about the options with a January 15th expiry. So let me go all the way out here, January 15th and it was $45. So there's a green arrow on here that you lived to see. This was my entry position. So right here, this is where I got in at $0.93 on November third. And you could see the stock is currently at $6.60, so we're up well over 500%. It's pretty amazing. And I'll just pull up my account here so that you can actually see this. So here are all of my current positions right now. You can see we're at around fifteen hundred, seventeen hundred. So like it's not moving super quake but we're definitely growing, which is nice to see. And then you go over right here it is, January 15th of 20 $2145 call option. I got in at an average price of $0.93 and it's currently trading at $6.20. And so the question that we have to ask ourselves now is, is it time to lock him profits? So when I go back to the stock chart, there's a couple of things. So first of all, we were able to pick up on this and now we've got a nice run. And the interesting thing here is we've actually broken through our all-time highs, so are high that was set at 4715 back in 2019. We have now broken through it. We're now at 4962. And so now the question is, you are looking at this chart and you say, OK, I'm up, I'm up big, I'm up 500%. However, this stock is breaking out right now. Do I lock in my profits or do I let it run? Let me be the guy that says, you're only going to make money when you locking your profits are going to make more money when he sell early, then when you sell late because that stock is going to pull back and you are getting it caught in a pinch. So let me be the guy that says, do you sell your stocks early, trim your position early locking those profits and put it somewhere else and diversify your portfolio, it is going to be well-worth, especially, I know you're gonna miss out on a couple of these ones. You're gonna miss out, especially if Uber goes to $60 tomorrow, I'm going to be really pissed off. However, it drops down to 50 or drops down to 45 and my position goes to 0, or I lose money on my position. Now, I am going to feel ten times worse than if I hadn't locked in that $500. And so it is a game of Risk and Return here. And what you need to know is that when you're big, you need to lock in some of that gains. If not all of those gains and diversify your portfolio more. It unbound says your portfolio when I have such a big position like this and with a large physician like this, I could actually take two or three smaller positions in other companies and still get the exact same risk, but have a little bit better diversification. So for me, I'm going to be locking in Uber, I'm going to be selling and I'm going to be taking my profits. And I'm gonna show you exactly how to do that right now. Okay, so to sell your shares is super simple. All you have to do is pull up your account. It kind of pops up in this little corner here. And it's really simple. So this is all of my holdings right now, as you can see, it's 1500, just under $1600. And to get out of my Uber position, all I have to do is double-click on that. It'll pop up a new order window right here. And I'm going to sell it at market prices. I'm not too worried about it. The spread isn't huge on it right now. And we're going to get out of it and execute this trace of this is going to generate $609 USD for me and it cost me $93 to get into it. So pretty amazing. This is definitely a good trade for us. We're going to send order that is going to execute and now we will have locked in our traits. So when we go to executions here, we gotta fill price of $6.15 and we got into it for $0.93. Okay, sorry, I knew calculator to calculate my profits and make me feel good about myself. So 6.15 divided by 0.93 equals 6.6129. So we basically six times our money. So that was pretty good, 6.602. So I'm pretty happy with that. Definitely a good trade. And now we have a little bit of money that we can put into two or three other positions we can find a different opportunity for. But the summary here is guys, I personally think you need to lock in some of your profits. You need to lock in all of your profits early. It is much better to lock in profits and be up, then be nervous about it. See a dip the next day and kicking yourself saying, why didn't I lock it in? It's much better secure that six hex return or whatever. You can get that 10% return, whatever it is, lock it in when you can feel good about yourself, call it a day and go tell your wife you pay some money, that's the way to do it. So what I'm trying to say here is if you guys take anything out of this video, please consider selling your positions when you are up, lock in a little bit of that profit, locking all of that profit and diversify your portfolio, whatever it is, whatever you decide to do, make sure that when you are up, you capitalize on it. You'd walk in someone that profits. It helps you feel good. It helps you give you more confidence when you're trading. And it's much better to feel good about walking in profits than feeling bad that you didn't do it later on. And trust me, it goes both ways. You're gonna miss out on opportunities and you're also gonna feel really glad you did it in some situations. So there's definitely a toss up at as a risk reward. But when you see big gains, definitely walk a little bit. And that is my personal advice. And I will see you guys in the next video.
33. 1 page trading strategy: What's up, you guys welcome to another video and this one I'm gonna walk you through my one-page trading strategy. So this is just a simple, easy to use template that allows you to think about all these different aspects before you actually sit down at your computer and start executing trades. And so this will help you put a little bit of structure behind your trading. Now you definitely need to put in your own answers here. This is just a template, but I'm gonna give you a little bit of an example and walk you through how to use it right now, okay, so this is what the pdf looks like. It is super-simple here, as you can see at the top, we've got three different aspects. In the middle, we've got our entry and exit, and at the bottom we've got our review sections. So altogether, you got five different sections here. Now let's get started with the morning checklists. So for me, this is actually the one that changed everything for me. I used to just roll out of bed, walked my computer, try and make a couple trades, get really caught up in it and then I'd feel bad because I didn't have breakfast or I didn't get started right. And and it just wasn't a good routine for me. So what I did is I put together a morning checklist. I have to be mentally prepared and be ready for the day and actually be in a good mood to trade. I'm going to be physically prepared and actually have slept enough hours, got some breakfast and being ready to sit down at my computer and I've already gone through the entire morning routines. So that is a big thing for me and that is significantly helped my trading. I also check on my past performance and the market conditions. So my morning checklist is like make sure I'm mentally prepared, make sure I'm physically prepared. Go through my trading journal and make sure I see how I've done over the last little while, what's worked and what didn't work. And then jump into the markets and see what are the index is doing. What is the market direction right now? What is the, how is the market handling the first pre-market or the first ten minutes of the market opening. Those are the things that you need to check before you make any trades, okay, now the next section here is you're trading goals. Now this section is really important because by setting these goals early, you can figure out if you've hit those goals. And what I mean by that is if you have a target profit every single day of a $100 or $1000, you can know when you walk away from that computer of yes, I hit my goal and that is working or no, I didn't hit my goal and that did not work for me. This gives you the good day or bad day indicator. And you have to have this set ahead of time because it gives you something to work towards. Now, number of trades is definitely flexible. You do not need to get out there and say I'm gonna make exactly four traits, but you do need to have an idea of, I'm going to make five to ten trades or I'm gonna make 30 to 40 traits today. You need to have that in your mind so that you don't go crazy and over trade and you actually capitalize on the positions that are presented to. Next is your target when rate and your risk return ratio. So these are basically, what are you looking for? You're looking to win 50% of your traits and a risk return ratio of two to one. Well, that will make you profitable even if you only when 50% of your trade. So setting your target when rate and your risk return ratio will help you figure out what you need to do in order to hit your target profit. And thinking about all of these things together is what helps you set realistic goals that actually fit with your trading strategy, okay, now the next section on this guide here is the risk management. Now this is definitely one of the most important sections on this entire template because this is how you prevent yourself from blowing up your account and losing all of your money. And now risk-management, I have to be very clear about this comes down to two different factors. Primarily, risk-management comes down to position sizing and diversification. What I mean by position sizing is how much money you put into every single position that you've taker, every single stock that you buy. If you own 20 different stocks and they all hold 5% of your portfolio, you have great position sizing. However, if you own 20 different stocks and they are all in the exact same industry, you have terrible diversification and that can be a major risk to you, especially if outside factors impact to that specific industry, your portfolio can take a major hit. And so having good position sizing, as well as having those positions diversified as in different industries, is super, super crucial to your risk management. And those two factors are the absolute largest when it comes to your risk management. And so you need to be on top of especially those two factors. You need to have that well-determined in your head before you make any single trait of what your position sizes or at least, well your maximum position sizes. And if you are swing trading or long-term investing, you need to make sure that they are diversified. Now the last two factors and risk management or making sure that you set a hard stop loss if your short-term trading, if your day trading, swing trading, you must have a stop-loss unless you are buying it for cashflow or you're a long-term investing in, you should have a stop-loss or you should have a point where you are going to get out of that stock because your analysis was wrong, aiming to be at to admit that you're wrong and need to be able to take the hit and you need to go out and do more research, figure out why you are wrong and apply those learnings to fund the next opportunity. The last factor is earnings do not buy a company if you're not aware when the next earnings is, the last thing you wanna do is buy the stock and then the earnings come out to moral and they have terrible earnings. That is the last thing you want because it is going to absolutely trash restock and that comes down a risk-management. Ok, now this middle section here is what people think strategy is all about. They think it is the most important section and I have to be totally honest with you, it is everything else. Anybody can draw out a pattern. Anybody can draw lines on a chart and say this is a good time and this is a bad time. But managing everything else, the trading goals of risk management and reviewing your strategy. That is the most important part. It is not the entry and exit. This is the easy part. And let me show you what I mean. Okay, so for me to get into a stock, this is just an example, but for me to get into a stock I buy in on two different patterns. Number One is a clear bottom and so what we have to see here is clear support. We have to have a very clear indication of support at a specific price level. We want the price to go back up, come back down, hit that price level, or come very close to it, and then see a very, very clear reversal in a good company that is what I am looking for, and that is my bread and butter, that is what I am a major buyer of, and that is what does really well for me. So if I see a major turnaround IC increasing volume and I see the Mac D or the RSI confirm that that is a buying opportunity, that is when I will enter the stock. And so when you think about this, all I am doing is I am looking at a bunch of different companies and I am scanning them almost like an algorithm looking for an opportunity. And when I find that opportunity, I'm going to get into it. Now, the cool thing here is that this is actually the easiest part. The harder part is going through a morning routine and a checklist and being disciplined and only doing exposition size and making sure you're diversified. Those are the hard things, but finding this cool little pattern with some fancy lines on the chart, that is the easy thing, that is the easy part. Let me let me be very crystal clear about this. It is easy to find double bottoms is it is easy to find breakouts, but managing everything else is the hard part and that is the difficulty. Okay, so we've got the double bottom here. I also buy on breakouts. So what I'm looking here is clear resistance. So if we see a double top, a triple top, and then we see a breakout of that resistance. That is what I'm looking for. I'm also looking for that stock to be already trading above. It's moving averages. And I'm also again looking to the Mac D or the RSI for confirmation of that trend. I'm not making my trades based off of indicators, I'm making my traits based off of price action, and I'm confirming my trades with the indicators. That is how you actually make the trade. You do not make your traits based off just the Mac do you're just just off the RSI. You let price action determine the Trajan, then you use the indicators for confirmation. Get out of these trades and to exit them. It's really simple. So I says stop-loss right below support. So if it's a double bottom here, I'm going to set a stop-loss five or 10% below the support level right here. And a gypsy below that, I'm going to get out because I am wrong. I'm going to admit that I am wrong. I'm gonna cut my loss early and I'm going to wait for the stock to continue to fall or I'm going to go find a different opportunity. However, if the stock starts to go up or starts to trade sideways, there's a couple different things I'm going to do. Number one is I'm not going to move that stop-loss any lower. I'm not going to lower that stop-loss and say, okay, maybe the patterns changed here. I'm going to move it down a little bit and take a loss that is not going to happen, that is never going to happen as soon as I get in and I put my stop-loss below support and I'm expecting a pattern, it does not execute. I clear out that trade and I move on to the next one, or I wait for a better opportunity in that stock, I do not move the stop-loss. However, if that stock begins to move up and I'm starting to make some money, I will convert that stop-loss into a trailing stop loss. And what that does is that the stock continues to move up 5-10, 20-30, and I have my trailing stop-loss or let's say $2, what it will do is it will move that trailing stop-loss up with the price so that it always stays five or 10% below the high. And then as soon as the stock turns round, it hits my stop-loss and I'm out of the trade. That way. It protects my downside, but it also gives me the upside in case that stock decides to run, I also only accept a max loss on any stock position of 15%. Options are a little bit different because they are extremely volatile, but I usually won't accept any loss on the stock of more than 15 to 20%. If I lose more than that, I was just wrong about the pattern. I was wrong about the strategy. I would rather cut my losses and get back in at a lower price or find a different opportunity rather than continue to hold and try and catch a falling knife. That is not what I wanna do. Okay, now when you're done for the day, the last thing you need to do is you need to review your traits and you need to upload your trades into a trading journal. You can do this in a notebook, you can do this in an Excel sheet. You can also do this in a software. I highly recommend it. This is an absolute must do Absolutely have to have a trading journal if you are going to be a short-term trader, if you, if you're a day trader, swing trade, you have to have a journal because it will give you your average risk return ratio will give you your win rate. It will give you all of the factors that you need in order to refine your strategy over time and improve as a trader. So if you are not journalling your trades is kinda like a pilot that doesn't document is flights. Would you get in that plane? No, you probably want this thing is the exact same thing. You need to journal your traits so that you can understand what went wrong, what went right, how you can improve over time, and so that you can review for your morning checklists to moral. Now when I review this is what I do. I upload my trace to the journal. I talked to myself and I say, Hey, did you meet your goals for the day when you walk away from that computer, did you hit your target profit and how will your ratios where they in-line with what you wanted, what worked, what didn't not I ask myself that and then I asked myself, how can I refine that strategy and what will I do differently tomorrow? The only way to improve as a trigger for the future is to review your training in the past. You need to understand what went right, what went wrong, and how you can correct that moving forward. That is the idea behind a strategy, that is the idea behind a journal, and that is how you get better and make more money as a trader over time. So I'll see you guys in the next video.
34. Position sizing and diversification : What's up, guys, welcome to another video and this one I'm gonna talk about position sizing and diversification for different styles of trading. Here we go. Alright, so when I talk about position sizing, it is really, really simple. There's no need to complicate this. When I say position size, I'm simply referring to how much money you put into each position. So if you have a portfolio of investments and one of them is your house, one of them is a variety of stocks. One of them is some bonds. What I'm talking about when I say position sizing is how much of your money is in each of those positions, each of those individual stocks, each of those bonds, and each of those individual properties. That is what I'm referring to. Now when I refer to diversification, what I am talking about here is the correlation between those positions. So correlation means how much they're related to each other. So if you have a bunch of stocks, but they're all in the electric vehicle industry. Those stocks are going to be very heavily related to each other. However, if you own five different stocks and five different industries, those stocks are not going to be correlated. They're not going to have a tight relationship and move together. And so that is going to mean that you have some diversification in those five stocks in comparison to the same five stocks that are all in the electric vehicle space. Now, this is super important because what you'll find is that industries often move together. And so these are some screenshots that I've taken from my trading over the last few weeks. This one was actually taken on December 14th, and this was the magic mushroom kind of psychedelic space. And as you can see, almost every single stock in this industry moved by 18 to 6868%, 63%. Absolutely. Amazing movement here and this movement basically encapsulated the entire industry. Now if you look on the other side of it, this is a screenshot taken on a different day of the electric vehicle industry. And as you can see, nobody was saved to your not even testlet. Nobody made it out of this day, basically doing well. Everybody who was in the Red List and that's because the industry got bad news. And so what I'm trying to show you here is that it can go both ways, but usually when it goes strongly in one direction that entire industry moves. And so you have your entire portfolio in an electric vehicle stocks and a day like this comes around, your entire portfolio is going to take a hit. However, if these two photos were on the same day and you had some years stocks in the psychedelic space you would've done okay, and so that is the advantage of diversification. And now when we talk about the advantage of diversification, we can actually put that on a graph. So this is what the graph looks like and it's really cool is so on the bottom here you have the number of stocks are basically number of positions. And so the more positions basically goes further out to the right and on the left-hand side here you have risks. Now this is usually determined by standard deviation or basically the fluctuations in your portfolio. And so as you can see, as you go further along, you actually decrease your risk. And the more stocks that you have, the lower the risk becomes until you get to this level that is called the non-diversifiable market risk. And that is basically if the entire market crashes, it doesn't matter how diversified you are, you're still going to take a hit. However, up to a certain level, you do gain some safety by having a diversified portfolio and that levels kinda right about here. So kind of around the 15 to 20 position level, it's kind of a deteriorating return where adding more positions and diversifying your portfolio more isn't actually going to reduce your risk and you're just adding more commissions and more management to your portfolio. And that kind of golden zone, that 15 to 2025 positions is kinda where you want to be to say that you have a diversified portfolio. And so when we look at a long-term portfolio, somebody that is building up a portfolio for retirement, for long-term savings, for a house, for a long-term investment, maybe they're looking for cashflow, whatever it might be, the ideal position here is going to be 15 to 25 physicians, anything more than that, and you're just paying additional commissions and you're not really achieving more diversification in your portfolio. You're just kinda spreading the wealth and a little bit more about that 15 to 25 position level is where you want to be to have a diversified portfolio. Now, if you have 15 to 25 physicians, that means that you're going to have roughly in that range of four to 12% preposition. Now what I would recommend is keep your favorites around that eight to 12%. Keep the ones you're maybe a little bit worried about or you don't know enough about them or you're still a little concerned about them, put them in that four to six range. And anytime that stock gets above 12% or maybe above 14%, that is when you should rebalance your portfolio, you should take some of those profits. You should put that money into different stocks or you should spread that money out through the rest of your portfolio. And that is how you rebalance your portfolio. And when you do this, when you have 15 to 25 positions of that four to 12% position size, I highly recommend that you have at least five different industries that is going to give you adequate diversification between those positions. And it's gonna give you good position sizing so that you can achieve steady and consistent returns throughout the years. Now, I get asked about my long-term portfolio a lot, and this is basically what it is made up of. So when you look into here, I focused on kind of five different industries and these are the companies that I focus on. So in technology, I'm really heavy on square, Amazon, Google, and Facebook. I think those are the best business models in the technology space. I think those are the companies that are going to be much more important 51015 years from now, I think they're all gonna do extremely well. I'm also super interested in the transportation space. Obviously airplanes and consumer travel is taken a hit. However, I'm really, really excited about Tesla drone delivery Canada. I think Uber is going to be the primary mode of transportation for short and medium long distances and the next 20 to 30 years. So I really like that ride-sharing business model and air cargo is only going to increase. So I really like cargo jet, a Canadian company. The other industries that I like our food, gaming, and the work from home space, I think worked from home is only going to grow. So I like Upwork and fiber. I really, really like gaming or actually just made a swing trade on Electronic Arts and I made a 100% on that return. I also like Activision. I think both of these companies have good management and they're going to grow over time. And I think the food's base is right for takeover right now by these plant-based products, these meat alternatives, I think the food spaces changing drastically right now with the food delivery, with the meals that are ready to go and delivered to your door. I think the food space, It's changing just drastically right now. And I think a lot of these companies here, good food company beyond me and very good butcher's are all very well positioned to take advantage of that. So this is what a lot of my long-term portfolio looks like. Now, when we start talking about swing trading, things get a little bit different because 20 positions is just too much to keep track of. If your swing trading, you want to be looking at those positions every single day. You want to be analyzing them and keeping up to date on the news. 20 companies is just way too much to do that on, especially if you are still looking for other positions or you have anything else going on in your life that is just a lot to manage. So what I say, when it comes to swing trading, you need to choose the number that you can manage. Typically, when I see swing trade is it's usually in that three to ten range. Anything more than ten just becomes a lot to manage every position and stay on top of it. Anything less than three N_0, maybe get bored a little bit because it's not super active and you're not doing a whole lot. But that three to ten range is sort of a Goldilocks range that I see most people falling into in this definitely where I fall when I'm swing trading, I usually have that six to ten level. So that, that way I can check every stock, every day. I can stay on top of the news. I can look for new opportunities and I can do anything else that comes up in my life that seems to be kind of a Goldie swash zone for me and it allows me to watch those stocks each and every single day if I need to get out of that stock before my stop-loss, do I see something that I don't like? It gives me the ability to do that with every single stock I'm in. Do that every day. Now when it comes to position sizing for my swing trading, I always hold some cash between 5, 15% of my portfolio is always going to be in cache number one, that gives me the ability to execute on any opportunities that I see come up when I'm fully invested. And number two, if I need to pull some money on my account for any reason, identity card decks and I needed for insurance, whatever it may be. I've got some cash that I can pull out without having to close any MI traits. So I think that is a rule that all swing trader she kinda have in their back pocket is keep a little bit of cash and then you divide the rest of your money, that 80%, that 85% divided by the number of positions that you hold. Let's say it's six positions that you'd like to have. That's how much should be your full position in any stock? Maybe you build into your positions into chunks depending on your strategy and how you operate. That is how I think you should be swing trading. Take your full portfolio size, save a little bit of cash left over and divide it by the number of positions that you can manage. And that should be your position size for swing trading. But make sure that you set a hard stop loss. That is something that a lot of people don't do, that they forget or they move it down. You need to make sure that you set a hard stop loss when you are swing trading. Because when you swing trade, it is better to get out early because you are wrong than to ride that wave all the way back down. You can always buy in at a lower price, but you do not want to be averaging down when your swing trading that is the wrong methodology because the losers quick back in at a lower price if you still like it and move on. Now when it comes to diversification and swing trading, it is just as important as it is in long-term investing. The reason is because you're holding these stalks overnight. Anytime you hold the stocks, overnight, news can come out in the morning, news can come overnight news can come out overseas and they can drastically impact the industry that you are invested in. So if your swing trading, you still need to be diversified. You need to be spread out into a couple of different industries. Anytime you hold those stocks over night, you risk the chance of the huge gap up or a huge gap down for the industry. And if you're not diversified, it will destroy your portfolio. But now, when it comes to day trading, I usually recommend between 13 positions. Anything more than that can become a little bit difficult to manage, especially if there's any news coming out in the middle of the day, any fed reports or rate hikes can really mess you up if you're a day trading with more than three positions. And so when your day trading, you must have a stop-loss and you must have a target for that trade. Those two things allow you to put together a risk reward ratio. And when you combine that with your percentage win rate, you can then determine what your overall profit and loss is going to be. Your overall percentage win rate and your risk return ratio are the two largest factors when it comes to analyzing your trading. And you need to know both of those factors because that determines your ability to succeed. Now when we talk about position sizing and day trading is completely up to you. You can invest 100% of your portfolio if your stop loss is 5% below where you entered the market, it doesn't really matter how much money you have in there is the risk of your entire portfolio. You're only risking 5% of your portfolio on that trade. So it doesn't really matter how much money you have in there if you invest half of your portfolio, but you have a 10% trailing stop-loss on there. You're risking the same amount as if you had invested your entire portfolio with a 5% trailing stop loss. So you really need to understand risk management strategy is the most important thing when it comes to day trading. Now, now, diversification does not matter at all when it comes to day trading. The reason for that is that you are not holding these stocks over night. So if the industry turns around in the middle of the day, you should be able to realize that you should be good to understand it because you are looking at it. It doesn't matter if you owned three different positions on the exact same industry as long as you understand the market and what is going on with those three stocks. And you have an appropriate risk management strategy for all of those traits. It doesn't matter if they're all in the same industry. Diversification does not matter when you are day trading as long as you can recognize what is happening in the markets. And if you see a turnaround, risk management strategy needs to kick into place and get you out of that trait. Now, just a couple of notes on everything that I've said here. This is all just my strategy and my opinion. This is how I look at the markets. And it is a good way to look at the markets, but it is not the only way to look at the markets. There's several other traders that have a lot of success using other strategies. And so when it comes to the markets, there's several right answers and you just need to figure out what works best for you because everybody traits differently. Alright, guys know In summary, when I'm trying to say here is that position sizing and diversification are the two main factors that you need to consider and understand when you're building a swing trading or a long-term investing portfolio. And when your day trading, you need to make sure that your position sizing is on point and your risk management strategy is ready to go. So see you in the next video.
35. How I set my stop loss: What's up, you guys welcome to another video and this one I'm gonna walk you through in detail step-by-step, how I think about and how I use a stop-loss. And I'm also gonna give you two real life examples of traits that I am looking at today. Here is everything you need to know. Let's go. Okay. So first of all, when it comes down to setting a stop-loss, there are multiple different ways and multiple different strategies to do this. And everybody can be successful using different strategies. But what I'm gonna do here is walk you through how I think about and how I personally use a stop-loss. So if you see somebody else with a different methodology or a different strategy, it's not that they're wrong or I'm wrong. It's that this is how we think about it in INR, trading strategies differ. That's all it is. So here we go. So when it comes to the stop losses, this needs to be determined by technical analysis and support and resistance. And what I mean by that is when I'm looking at a chart and trying to decide where to put my stop-loss. I'm doing it based on support and resistance and price action. So if I have support right here, I'm going to put my stop-loss just under that so that I know if the stock breaks through that support and it triggers my stop-loss. Well, my analysis was wrong and it gets me out of that. The other thing you need to think about is that your stop-loss must be determined before the trade is made. The reason that I say that is because your stop-loss is part of your risk mitigation and risk management strategy. Now, your risk management strategy is something that we need to talk about here because this is what we're basically covering when we talk about our stop-loss. So your risk management strategy in my view, comes down to three aspects primarily, these are the most important aspects of your risk management strategy. Number one is position sizing. How much of your capital are you putting into each position that you take is at two positions with 50% each, are you building a diversified portfolio would maybe 5% each. Or you day trading with almost your entire portfolio each day. It depends on your trading style, but I can tell you the longer out you go in the more diversified portfolio you want, smaller position sizes you want, and the more holdings you want. But if your day trading, maybe you need to use that capital to get the return you're looking for. So this really comes down to your trading style now secondly is diversity. If you're swing trading or if you were building a long-term portfolio, you need to make sure that you have diversity. So if you have 20 holdings, but they're all in electric vehicle stocks, then you've got a big problem there. You need to diversify and get four or five different other industries in there. That's what I mean by diversity. Because if all of electric vehicle stocks fall one day, your portfolio is going to absolutely plummet and that is not what you want. You want steady and consistent returns when you're building a long-term portfolio. And lastly, this is where your stop-loss comes in, but it comes in for your risk and reward ratio. So when you get in at $10 and you put your stop-loss at $8 and your take profit at $14, that is your risk return ratio. You're risking $2 to make $4. That is what I am talking about when I say risk return ratio. Now for me and my personal trading, the risk return ratios I usually like to look for is at least a two to one ratio, especially when I'm swing trading. That is kinda my golden rule, especially for this swing trading. So that's what we're going to look at here. So what I wanna do is put this into actual use cases and walk you through how I look at a chart. So the first one here is Helion holdings. Now this is a stock that actually came up in my distort chat today. I mapped this out for everybody in there and now I'm going to walk you through how I think about this chart. So when I see this, I'm going OK, there's very, very clear support at this 1790 $18 mark. There's very clear support tested once in November and now once at the beginning of December. When we zoom into the chart, you can see that the stock is coming all the way back down to the 792 range and maybe testing the 17801790 range in there. And so if I was gonna make a trade on this stock today, this is how we look at it. So my entry point right now. $18.30 if I was just going to buy it at the market price, that's where I would be if I was going to set a stop-loss on this outset it at $17.50, that is below support here, and there's enough room there for a little dropdown. It's not going to fill my order right away. If it sets a new low of 1790 or 1788, it's not going to fill my order. But if it goes all the way down to 1750, clearly that is a breakdown of support. Clearly I am wrong in my analysis here. And that is when you want the stop-loss to kick in. And so when I look at this chart, I see, okay, we're trading pretty horizontal here around the 1790 $18 mark, 1830 right now. So what I'm gonna do it semi stop losses, red line here at $17.50. My put my take profit here just before the resistance. So obviously you can see we've got a spike in the price right here. At the $21 level, it wasn't able to break $21 right here. So what I'm gonna do is I'm gonna set my take profit at $20.50. That's this green line here. So when we mapped that out, you can see I'm getting into the stock at $18.30. My stop losses as 1750, it is below support right here. I'm taking profit before the next level of resistance. So I'm taking profit at $20.50 instead of the resistance level at $21 so that when my order it gets filled. Now when we do the math on this, you can see that the risk on this trade is $0.80. The reward on this trait is $2.20. And when you break that down as a ratio, the ratio is 2.75. So when you take this and you go back and you say, okay, I've got a trading opportunity here. Now let me see if that aligns with my trading strategy. Okay, it's good, decent position size, I've got diversity. I actually want to be in this industry and it has a risk return ratio of 2.75, which is higher than my two minimum for swing trading, which means this is a good trade. I'm gonna execute this trait and I'm gonna get into this trade. Now the next example we're going to look at is Comstock resources anchor traded on the New York Stock Exchange. The ticker symbol is Cr k. And this chart is super, super interesting to me because as you can see here, the price was at 131, came all the way back down to $4, went all the way back up to over $10, came back down to like $4.450 right here, all the way back up and for for, for a bounced off the $4 mark for the last basically 2.5 years right now. And this is really, really amazing because if you could pick up on this and you could sell at a 2030 40% profit everytime this price bounced off for, you want to have like ten different trading opportunities over the last two years with this dock. And so what I am really, really interested in is it looks like we're starting to come to the end of a descending triangle here. The price is also starting to come back down to this for 450 level. And so when we zoom in here, I want to analyze this doc for a trait. So this is the end of that chart. I'm not looking at it on a four-year period. I'm looking at it on a daily period in this chart as you can see. So the end of the chart is back in June, July here, and then today is December fourth, 20-20. And as you can see, this talk has basically been trading within this channel, but it's continuously bouncing off this $4 mark right here. And so as of right now the stock has come all the way down. It's making a little bit of a bounce and it's sort of hovering around $4.75. And so when I analyze this chart for a trade, there's a couple of different things that come to mind. One is we have very, very clear support at $4 here we have structural technical support. Price has very clearly bounced off of $4. So what I'm gonna do is I'm gonna set my stop-loss just below the $4 for ten Marketing and ascended at four. I'm going to set a 390, maybe 380 somewhere in here, this red line. And then I'm going to send my take profit at the next level of resistance. So as you can see, the price wasn't able to break through this trend line here. There's clearly some resistance around this 6.2 mark, 6.4 marks. I set my take profit at the $6 mark. So a little bit underneath the trend line, and we're going to analyze this stalks. So right now the price is at $4.76. So my entry, let's just call it $4.75 for easy math, my stop-loss at 3.8. So this red line is even a little bit lower right here. So let's say my stop losses at 3.8, I'd put my take profit at $6. So just blow this 6.2 that was up here. Take my profit at $6 right here. And when you do the math on this, you can see that the risk is $0.95. The reward is only a $1.20-five and the ratio is 1.3. So when I ask myself, does this fit in with my trading strategy? The answer is no, this does not fit in with my trading strategy and I should not take this trait. However, is there a level that this trade actually makes sense and does fit in with my trading strategy? And the answer is yes, there's definitely a level where it does make sense and this is what it looks like. So if I change my entry from four 75 down to 440, this little white line here, as you can see, it is moved by changing my entry to $4.40, but I keep my stop-loss at 3.8 and I keep my take profit at $6. So those haven't changed at all. The new math on this trade becomes a risk of $0.60. I'll reward of a $1.60 per share and a ratio of 2.67. So now this trade makes a whole lot of sense, is definitely fits into my trading strategy. And it's a trade that I would be more than willing to take. So if the price falls to 4.4, that is probably where I'm going to enter the trait. I could also place a limit order to get in if the stock falls to 4.4. But what I might wanna do is just hold off and just watch the stock. Because if it comes back down to 4.2, 4.1, that might be an even better entry. And if it falls below that 3.83.9 level, well, that's okay. And lost 20 or $0.30 a share. But I still have the massive upside of five or $6 there, which will give me between a 1.2 per share in profits. So really, really nice risk return. If we can get in at $4.40, it does not fit within my strategy at $4.75 though. Now one topic that comes up a lot when we're talking about a stop-loss is converting your stop loss into a trailing stop loss or just using a trailing stop loss in the first place. So I wanna talk about that for a minute. Now, a trailing stop loss is something that moves up when the price moves up, but it does not move down. Let's say you get in at $10 and you said a $2 trailing stop-loss, it will steady stop-loss at $8. And as the price moves up to $12, your stop-loss will then move up to $10. If it moves up to $13, your stop-loss news up to $11. However, the stock comes back down to $11. Your stop-loss does not move and it will execute. Now you can set that trailing amount in either a dollar amount or a percentage amount. It's whatever works best for you. I personally use a trailing stop-loss, but I do not start with a trailing stop loss. I wait until my trade has made about 25, maybe 50% of the profit, that target profit that I am expecting. And then I convert that trade into a trailing stop-loss. The idea here, you cut the losers early with a hard stop loss and you let the winners run with a trailing stop-loss. So instead of having to exit my trade rate at my take profit, if that stock decides to run, what I will do is I will tighten that stop-loss. Instead of maybe 10% trailing, I will turn it to 5% trailing. And that way I tightened up my stop-loss. If the stock starts to run, I have full upside potential and then it gets me out as soon as the stock starts to turn around. That is my personal strategy. That is how I like to use a trailing stop loss, and that is how I like to trade. However, there are multiple different strategies and you need to figure out what works best for you. I do not start my trades with a trailing stop-loss. But the reason for that is if I get into Apple at a $100 and I said a $10 trailing stop-loss on there because I see clear support at a $100, the stock may go to a $120 and then dropped back down to a $109. It has not crossed that level of support, but because I started with a trailing stop-loss and we'll get me out of that trade and it won't allow me to capitalize on that trait that is still there and still existing and still testing my assumptions. And so I do not start with the trailing stop-loss, but once I am comfortable with the profits, I convert my stop-loss into a trailing stop-loss by cancelling out the original stop-loss and placing and new one fairly quickly. Now a couple of notes when it comes to a stop loss when you trade and when you make a day trade, a swing trader and investment, you are making an assumption as to whether that stock will go up or go down. The stop-loss should be there and should be designed to get you out of that trait if your assumption is wrong. So if your assumption is that there is support at $100 on Apple stock, your stop-loss should be placed so that when your assumption is proven wrong by the price action and it will get you out of that trace so that you can cut your losers fast and you can let the winners run. You can get back in at a lower price on the companies that you like. You can get out of these losing trades quickly so that you do not have bay colder and you're not holding it in your portfolio. Now, in summary, when you are learning about a stop-loss and experimenting with a stop loss, you should be doing it in a practice account. You should not do it with your real money when you can blow somebody else's fake money. That is the way that you experiment. That is the way that you play with different strategies. And that is the way that you test the user interface that you were actually going to be trading on. You need to open a practice account. I use mine every single day even as an experienced trader and I highly recommend it. Secondly, you need to adopt the principle of cut the losers early and let the winners run. If the stock is falling, you need to sell out and buyback in at a lower level when you see support and when you feel comfortable with it, do not let that stop, drag down your entire portfolio for months and months when you could be investing that money somewhere else and making a return to buy even more of that favorite company that you like at a lower price. That is the way that you should be thinking about it. Also, you need to have a trading strategy. I compare all of my stop losses to my training strategy to make sure that every trend I make fits within my strategy. And you need to be doing the same thing. You also need to be journalling your traits so that you can see where you can improve and you can analyze your training to become a better trader.
36. Pre and Post market Trading: All right, you guys welcome to another video and this one we're gonna talk about pre and post market trading. We're gonna go through everything you need to know in order to execute an order, as well as the risks associated with it. Here you go, alright, so pre and post market trading can also be referred to as extended hours trading or after hours trading. And basically it's the ability for you to place an order and have it execute before or after the regular market opens or closes. Now, there's a couple of things you need to know about. And the first one starts with turning on the data. So I personally use quest trade and to turn on the pre and post market training data, all you have to do is right-click on a chart, you click on the settings from the drop-down menu and then you get this little window that appears. And there's a little box here that says show pre-market and post market trading. When you click on that, what it's gonna do is it's gonna give you all of the data and all the candles for the pre and post market sessions before and after the regular day. And so that's going to open it up for you to do the analysis and actually decide what traits are going to take based on the pre and post market action. Now, the hours of training depend on the type of security that you're trading. So on quests trade that Canadian securities do not have a pre-market session, it just doesn't exist. You can only trade them when the market opens. However, Canadian securities do have a post-market session that closes at 05:00 PM. Us securities do have a free market session and an opens at 730 AM two hours before the regular market opens and it closes. The post-market session closes at 05:30 PM. So you've got about an hour and a half after the regular markets. So depending on your broker and the area or the geographic region of your security, that is what is going to dictate the hours that you can actually trade pre or post market. Now to execute the order on a canadian security, I use question for all of my trading and there's four things that you need to know. Number one, it has to be a limit order. So as you can see here, my order type is set to limit. It has to be set to auto as the ECN or routing system. So as you can see under route I have it set to auto. The duration of the trade has to be set as day. So my duration here is set today and it has to be in a multiple of 100 unit. In order to trade in the Canadian post-market, you do have to trade in a variety of 100 shares, which can make it difficult, especially if those shares cost a lot. So you need to make sure you're well aware of that before you try and make that trade in the post-market FOR canadian security. Now, for a US security, there's a slightly less rules. Number one, it has to be a limit order, so that's the exact same. And then number two for your ECN and your routing system, it has to be set to ARCA. So right here I have my route set to ARCA and then for my duration and asked to be set to Good Til extended market. So that's what GTM stands here. And that's what's basically going to keep your order alive in the post-market. So if you were to place this order here, post-market on Apple stock, this one would execute and you'd be all set. So kind of interesting, you need to make sure that you understand your broker first of all, and then you understand how to place these orders because it is different than placing a regular order. Now there are a couple of risks to extended our tradings. Number one being low liquidity, most people trade during regular hours and that means that there's fewer people trading before and after the market. And that means that there's lower liquidity and possibly larger spreads. The spread is the difference between the bid and the ask. And when that gap is large, it means that it's harder to get filled your specific price and the price that you actually want to get filled out. And so that can increase the volatility, that can decrease your profit. And it can increase the basically risk associated with trading pre or post market. The other thing that you need to be aware of, It's a lot of institutional investors that will listen to the news or read the news or the earnings or whatever comes out from a company and then make a decision based on that news. And so they're trading with a lot of money. And if your company that you are looking at has a lot of news or earnings or anything planned for that day. You need to be very careful because it can be very, very volatile. Now, there are specific advantages and reasons why people trade pre and post market. Number one being more control over your positions. If you know how to trade pre-market and post-market and you find out news or you change your mind on your position, or you want to get out of that position and maybe the market is already closed. This gives you more control over that position to be able to get out of it or trim the position, or at least be able to know that you can do that. And so being able to trade pre and post market just gives you more control over your portfolio. The next thing is news. Most of these companies released their earnings or their press releases before or after the market, but usually during pre or post market trading. And so if you are actively training during those times, you can actually trade on the news. So if a company blows its earnings out of the water, you can analyze that report. You can realize that and get in before the market opens the next morning and maybe you have an advantage there. The next thing is if something happens over the weekend, if Boeing plane crashes on Saturday, you can make your decision on Monday morning in the pre-market on what you'd like to do with that stocks. So there's lots of different options there. Basically it gives you more control over what you decide to do. Now in summary, you may want to learn how to trade pre and post market because it gives you more control over your portfolio. It allows you to enter an exit before the big crowds. And it allows you to basically make those decisions and have more control about what you wanna do with your own trading even if the market is closed, it can also help you get out before other traders in case something bad happens. And so it basically as another tool in your tool belt that you can add so that you can improve your trading and hopefully your overall returns. And now if you guys aren't using questions and I'm sure that the broker that you use, how's he frequently asked questions page and I'm sure that's on there. So just do a quick Google search and you should be able to find it. It's not too difficult, but there are specific rules for trading pre and post markets and make sure you're well aware on the security that you're trading, as well as the broker that you are using. See you in the next video.
37. How to use the VIX: What's going on, you guys. My name is Zak Hartley, and today we're talking about the vics or the Volatility index. Okay, so let's get straight into it. What is the volatility index? Well, some people refer to it as the Fear index. Basically, what volatility means is that prices are going to change. Nobody knows what's happening. Nobody can predict what's gonna go on in the future, and that equals risk that equals people losing money and not knowing what to do. Therefore, when the volatility is high and this volatility indexes high, people hedge their bets. What that means is that if you own a long position or you own equity and apple, you may want to place another bet so that if you're wrong on Apple and the price starts to go down, you will not lose as much money. Now, one of the ways that a lot of investors do that is by buying put options. What put is it basically the option to buy the stock at a specific price on a certain day? Therefore, you can make money when that stock goes down, and so a put option hedges your risk. On the downside, So if you own Apple and you on a large position in Apple and you want to limit your downside risk, you can buy put options that you make money even when that stock goes down. Now what the vics is is it compares the S and P 500 or the broad market, to the amount of put options in the market. What it's saying is, here's where we're at, and here's how many people are hedging their bets when a lot of people have their bet. The vics skyrockets because it's not sure what's gonna happen when there's less hedges in the market. People are happier to earn own equity because they know what's gonna happen. Therefore, the vics starts to sink and drop lower. So the vics were first to the broad market compared to how many people are hedging the market. That's all it is, And it basically shows you how much concern large investors have about the future of the stock market. So people had with options and it's the comparison of the S and P 500 to the number of options in the market. Now that this is the formula for the victims, pretty calm. Piil it complicated, and when you extend it out, it goes what seemed like forever. But I'm not gonna dive into it. I kind of give you the summary there and what I want to do show you how we can use the vixen are trading. So the vics represents implied volatility or risk. Therefore, when the vics goes up, it means that the market generally goes down when the vics goes down. The market generally goes up because there's more confidence in the economy and the ability of these companies to make money. So he was just an example of the last six months and what's happened. All these stocks air up to today's date, so great example of rate in the market when Kobe headed hit at its peak at the middle of March. And so on the left side we can see the vics. Here. It looks just like a normal stock chart, steady in from the bottom left. Going into March, it starts to absolutely skyrocket, and it peaks at the height of cove it in the middle of March, and then it slowly basically drops off to about 31 points. Now, if you look at the other chart here, the S and P 500. It is the complete inverse of this graph. You see, it's pretty high starting out and then coming into margin completely plummets. That's because the volatility and the risk in the market, as shown by the number of put options in the market on the vics, is going on skyrocketing compared to the volatility and the risk in the S and P 500 is completely prominent. So the vics goes up, the S and P comes down really simple. And here's another example of it. So this is the vics compared to the Dow Jones industrial back in 2011 Super study on the left hand side here and then July hits. And by August we have completely spiked and almost tripled on the vics. And then, if you look at the Dow Jones industrial, you can see pretty steady coming in, and then July hits. August comes around and we have completely plummeted. So the exact inverse of the vics again. So as you can see, it's a great telltale sign of when this fix is going up. The market is usually going down Therefore, we can use it as confirmation of our trades. So, in summary, when the vics goes up, the market goes down. When the vics goes down, the market goes up. Therefore, you can say Okay, if you think the Dow Jones is gonna go up over the next month and the vics is going down pretty steadily, you're probably right and probably have a little bit more confidence making that trade. However, if you think that doubt Jones is gonna go up over the next month and you're investing in some blue chip stocks. But you also see that the fix is starting to creep up and creep up even faster and faster. Well, you should have a lot of hesitation in that trade. You should double check all of your math and all of your assumptions, and you need to really think about what you're doing, because when that Vicks goes up, history has shown that the market usually goes down. Therefore, we use the vics to determine the market direction in the market sentiment of large investors that control the stock market. So it compares the S and P 500 out of the money options and it is the fear index, and it's primarily investor driven. The reason I say that is because you have to be buying put options to have any in impact on the VIX index. So not many people are buying put options. No beginner traders know. Basically, entry level guys and not many of retail traders will be buying put options to hedge their investments. Onley advanced traders and wealth are actually going to do that. Therefore, this index is primarily investor driven by today's driven by the majority of the market. And that's why it is important. And that's why it's a great indicator off what's gonna happen in the future. So I hope you got some value out of this video. I hope you learned something, and if you did, please remember to show a little bit of love. I sincerely appreciate it on help. You have a great week trading bye for now,
38. Technical Summary: What's up, Everybody so are starting to come to the end of the technical segment of the course, and I just want to do a quick overview of some of the main topics that we've covered so far . So technical trading. This is the idea of using the charts to make your trades. And the big thing here is that you need to start with the big picture. When you're going to make an investment into a stalker into an industry, you need to make sure that you know how that country and how the global economy are doing so that you're aware of what's happening in the big picture in case something turns around . When you start to make that trade, you need to follow your trading strategy that we've helped to develop. Through this course, you always need to learn about new indicators and patterns. I have only touched on five or six different indicators, but there are literally tens of hundreds out there and lots of different strategies and methodologies that you can use when doing your technical analysis. And I have only scraped the surface here, so there's a lot more that you need to learn and know about before you start making your big trades, nothing is perfect and get nothing is guaranteed, though you need to really remember that you could have every indicator in the book line up perfectly as a buy, and you could have every trendline point to a buy, and things can change very quickly. So you need to mitigate your mitigate your risk of a stop loss or protecting your position in some way. You need to be prepared for any position to turn around on you. Okay? Price described his bearish and bullish. It's bullish when it's going up on his bearish. One is going down, and it is the foundation for all of the indicators and trend lines. They pull all their information from price almost all of the time, and you need to know how to place your orders by doing market orders to get in right at that exact price that's quoted for you or as close as possible, or using a limit order to protect yourself by doing a stop loss or only getting in a certain prices. Trend lines are the strongest tool you can use. One looking at a chart. They're made by connecting the highs and lows to form different channels. And the more times that a price touches, ah, supporter resistance line to stronger that supporter. Resistance is. The other thing is that if you touch a resistance sign three times, then you break out above it. That resistance line is now considered your support line, so resistance and supporter interchangeable, and they're basically resistance lines for price movement more so than anything else. This does come with practice in time. You need to look at hundreds and hundreds of chart, and you need to really practice this and get good at it over time. To really start to pick up on the different tendencies within the charts. One good resource for this is using stock charts dot com Those That's where I've got most of the examples from this course. It's a great resource for annotating the charts. What I mean by that is drawing on the charts and then keeping your annotations there over time. So that is, the chart develops. You can still see where your drugs were. Now. Patterns is a big thing. Those air developed from the trend lines. You start to look for patterns in those trend lines, and some of them are tell tale signs for what's about to happen. Coming up now. The ones we looked at were triangles, place consolidation and head and shoulders patterns. But there are several more you should look at by doing your own research. They're identified using good trend lines, and they're strong indicator of future movements. So if you see one of these patterns that I've listed, it is a strong indicator. It is not the all end all be all, but it is definitely a strong indicator. Volume is really good. Volume is basically a confirmation of what you think is probably going to happen. So if you see the stock price significantly go up, you see increasing volume, or at least consistent volume all the way through. That means that other investors are still willing to buy it at that price. Now, if you see the stock price go up and there's declining about declining volume, it means that people are unsure of what to do when the stock is at that price. They're not sure if they want to buy or sell it, and it means that there could be some unsteadiness in the market, and that trend may not last as long as you hope it will. So if you see a trend happening and there's decreasing volume, you cannot be sure about it. If see a trend happening and you see increasing volume, it is a confirmation of whatever trend is happening. Moving averages are really important. They are a little bit of a lagging. Indicators will never give you a ton of information right on the spot, but they will help you identify the long term trends. Moving averages of the average price over a certain number of time periods, usually represented as 20 or 50 or 101 looking at the charts and their best used when you have at least two different moving averages. The idea there is that you can start to see crossovers of the moving averages. And when the faster moving average crosses above the slower moving average, that is your buy signal. If the faster moving average crosses below the slower moving average, that is your cell signal. So lots of different ways there and these are just one tool that you want to add on to your technical analysis, build up your buyer cell position. The Mac D is definitely one of the strongest indicators that we can use. It is comprised of two different moving averages, and it hits to Graham. The history Graham shows the difference between the moving averages, so if they're starting to converge, you'll see that hissed a gram or bar charts start to shrink. And when those two moving averages in the Mac D cross over each other similarly to the moving averages in the last page, that is your buy signal, and that is your cell signal. Typically, the Mac D utilizes faster moving averages than what you would see on a general chart on what I've shown in this course. So it is a much more representative indicator off the swings that are happening in your stock price, which is great to see. Next one is the RC. It is an indication of oversold and overbought and is used to identify the stock moving faster than usual. So if your stock usually appreciate that 10% per year and then all of a sudden you see a 15% increase in the price, that is what we're talking about. That is where we're saying Okay, maybe something probably didn't happen with the company here, and we're just seeing a sturgeon and trading volume in a surgeon price. Maybe this isn't the right time to buy in, and that's what the R s I can help us determine. So it's ranked on a scale of 0 to 100 below 30 is considered oversold and above 70 is considered overbought whenever they exit either of those owns. So whenever that line is coming back towards the middle of the RSC, those air your signals, those are the signals. So when it's blowing is coming back out, it means that prices dropped too quickly for what the actual history has shown us, and that's when you might want to buy it and the same thing on the reverse. Now your stop losses. A Miss risk mitigation technique. It helps you limit the losses in case you are wrong when you make a trade. So it is an additional trade used to limit the loss. It is usually placed slightly blower. The buying price. If you buy apple it 100 expecting it to get toe 1 30 you might want to place your stop loss at 90 or 95 so that in the event that apple plummets, you are sold and you have exited that trade at 90 or 95 instead of 80 70 or 60. The idea here is that you want to limit your risk on a trade. However, if it is placed improperly or place too close to your buying or to the current price, you can exit a trade early and miss out on that opportunity for the gains that you had planned. Now your trading strategy is definitely one of the most critical important sections here. You really need to identify your goal in your timeframes. What you trying to get out of this and what are you willing to put forward? And how often do you want to be looking at this screen? Are you gonna be a day trader checking at basically every hour? Or you're gonna sit down once a week and look at your investment or even once a month? How are you going to trade and what is your strategy? Are you going to be a day trader? A swing trader at Dividend Trader? What are you going to be, how much you're going to trade in each position. How much are you willing to risk with each position that every stock that you by how much of your portfolio do you actually want to put into it? Use it somewhere between one and 15% on the high end, And how are you going to mitigate your risk? Once you put that percentage into that stock, how are you going to basically protect yourself in the event that you're wrong? There's lots of different ways you can do it, too. Protective puts stop losses or diversification in your portfolio. And when you make that trade, what are your buy and sell signals? What is going to force you to make that trade to buy it? What is going to force you to make that trade to sell it? You should be very clear with yourself up front. So in those situations arise, there's no debate in your head. Now charts and accounts start with global and national indexes, so when you're going to get into stock trading, you're going to get into the market. Look at the global and national indexes so you know what is going on in the broader market . He should also use a software that lets you annotate and keep notes over time. Stock charts dot com does a good job of that, but you do need to learn new indicators and look for correlations when I mean by that is, I've only covered a couple of indicators. There are many more to learn and to know about, and once you know about them, you can start to see correlation between stocks. You can see how the S and P and the TSX follow each other very closely because the Canadian and American economies are very closely linked. You can also see other trends between the price of oil and oil and gas producing stocks. So you need to be very careful and identify the correlations and always continue to learn new things about the indicators and the trends happening in the markets. The last thing is, you need to choose the right markets and currencies when trading. There are a lot of companies that trade on the TSX and the New York Stock Exchange, so you need to be very careful which market you're trading in what currency your training with because it also has implications on your taxes now and summary. Nothing is perfect. None of the routines or methodologies I've talked about here going to save the day or or be 100% but they are going to help you give hints and signals as to what you should do. The technical principles will apply to most charts supplied all stocks, indexes, currencies, usually commodities and a couple other things as well. I don't know how well they're going to apply to crypto currency, though. Now what you should do is try to connect your charts to what you were seeing in real life. For instance, Google bouncing off the $1000 price level three times. That's kind of a sign that people are willing to buy Google out of $1000. I don't expect Google to fall below $1000 because we've seen so much support there. So the next time Google hits $1000 I'm going to be a personal buyer now, in other news or other trends they might want to be looking at. With covert 19 you can see a dramatic increase in the price of zoom stock. Everybody's doing videoconferencing. Everybody's basically on the computer right now, zoom is taking off in generating a ton of revenue, therefore their stock prices increasing because of covert 19. That is a trend you may have wanted to pick up on, or the fact that cruise ships air falling because nobody in their right mind would be booking a cruise ship during the middle of a pandemic. So those are different things that you can use in your real day to day life that you're picking up on to make informed decisions in the stock, mice, the stock market and hopefully make some money on The last thing is manage your risk stock market can make a lot of millionaires, and it can make you a lot of wealth, but it can also take your money. So you need to be very careful with how you manage your risk, what trade you make and how much of your portfolio you put into each trade. Be very careful with those two things on. Always follow your trading strategy. Thanks
39. 5 thing I wish I knew: What's up, you guys welcome to another video. And this one, I'm going to go through the five different things that I wish I had known before I started day trading, swing trading, this mindset and this video is going to be geared towards short-term investments. This is enough for long-term investments. So these are just the things that I wish I'd known before I started doing this. Short-term investments are used. So the number one thing is you're trading journal. You need to start this early. You need to start it as soon as you start trading because this is super important. Your training journal is what keeps track of all of your statistics, your win rate, your average loss, your average when, what percentage you are at each strategy or each charting pattern you're trading journal is where you keep track of all of your information. It's kind of the equivalent of a pilot's flight log you and chose to pilot that was hiding as flight login when show you as hours in the air, would you while the trading journal is the exact same thing, that trading journal is where you logged your trades. You keep track of what strategies you use to keep track of which strategies work best for you. And you figure out what your average return is, your average risk return. And you can basically dial in your strategy using the information that you pull from a trading journal. This is the most important thing and it is your number one tool when trading because no matter how good your chart is, no matter how good your setup is, if you don't have a good trading journal to pull information about your specific trading from. You are never going to be able to refine your specific strategy. And so this is number one. So It's kinda like a fly log. It tracks your performance and this is how you refine your strategy, the trading journalist, how you figure out what works best for you. Are you a day trader, you a swing trader? You really good at trading gaffers. Are you really good at trading early in the morning, late in the afternoon? What works best for you? You figure out all of that information from your trading Journal. Idea number two is your strategy before you sit down at your computer and you make your first trade, you need to figure out a strategy. When I talk about a strategy, I mean, what stocks are you buying? What causes you to buy them? What is your entry point, your exit point, and what is the goal here? What is the risk return? You're willing to accept all of these different things come into your strategy. And so when I say strategy, I mean to say that you need a strategy before you make your first trade, you need to test out your strategy using a practice account. You need to refine your strategy using your information from your training journal and you need to be able to write it down if you cannot accurately convey your strategy to a piece of paper or an online message, you do not have a strategy. You need to refine it, you need to simplify and you need to be able to convey to other people. Otherwise, it's just too complicated and I don't believe you to be totally honest. Number three is a practice accounting practice account is the best tool that you will ever use because it is fake money that allows you to trade in the real market. Now some of them apply commission, some of them don't. So how realistic your practices account is depends on which broker you use. Ok. So if you're not sure how a specific order duration works or a specific order type. You don't have to mess it up with your real money. You can open up your practice account. You can make a couple of trades. You can see how it reacts and you can get used to trading with that specific order types, that duration, that option, whatever you decide, you can test it out in your practice account. You can also test in and hone and refine your trading strategy using a practice accounts so you don't have to use your own money. This is definitely what I recommend for beginners. You need to make money in a practice account before you make money in the real world. And you should not have FOMO or fear of missing out or be worried about not spending your real money. Because if you're going to lose it, it's better to lose the fake money. And there's always going to be more opportunities ahead. So don't even worry about that. Don't let it cross your mind. The market is going to be here for the next 25 years and there's going to be just as good opportunities next year as there is right now. So use a practice account first. You will learn so much from it, I promise. Oh yeah, no. Number four is risk management. This is where I think a lot of people drop off. They get the cool computer with the lights. They got quest trade setup or whatever platform they used. They got all the monitors and the goddess strategy. Now they start trading, but they forget to talk about risk management. And so what I mean by risk management is what is your target exit? At what point do you want to get out of this stock? Or at what point are you happy with the profits? What is your stop loss? So if you're wrong on this stock and it goes the other way, at what point are you going to get out? And then position sizing how much of your entire portfolio are you going to dedicate to this position? This is probably the most important aspect of risk management because if you put too much capital into one specific position, it can offset your entire portfolio. And that is usually the number one way that people mess up is having too large of a position in one single stalk. The next one is diversification. So this one is a little bit similar, but let's say you have great position sizing, but you're all in the same industry. Well, that's not a good solution either. What you want to have is maybe 20 stocks at 5% of your portfolio each, but you want to have them in different industries. And so that is referred to as diversification. So between position sizing and diversification, those U2 strongest aspects with regards to managing your risk. And then it comes down to executing a trade according to your trading plan and your risk return ratios that you were looking for. The last aspect of risk management is upcoming events. So if the company is releasing earnings tomorrow is about to put out a major release, is expecting an FDA approval or as super susceptible to any changes in the economy or government announcements. Those are things that you are going to want to consider before you actually make that investment, okay, now the last aspect of this is time. I wish I had known how long this was going to take because it is not going to happen overnight and it's not going to happen in one week. It is going to take a lot of time to understand how the markets work, how they interact with each other, how to actually make your traits, how to put together a strategy, and how to backtest that strategy. So that going forward you can refine it, you can improve it, and you can improve as a trader in general, that is not going to happen overnight. That is going to take a lot of time because trading is a skill just like any other profession. If you're an NBA basketball player, if you're a bricklayer, if you are a roof or if you're an accountant, whatever it is, you're never going to be good at it on the first day. It is going to take time to hone your craft, refine your skill, and improve yourself to get better at whatever you are trying to achieve. So this is going to take time. And the last thing is that you need to learn as much as you can. There are unlimited resources out there and everything you want to know about the stock market is available completely for free. All you need to do is filter through all the crap that's out there. You need to filter through the BS and you need to get down the facts of how things work. You need to understand them from the basic fundamental level, and then you can build your strategy upon that. But do not listen to somebody that has the ultimate solution for you are the ultimate indicator or that's making millions off crypto was a small, tiny investment. None of that is really what you need to do is figure out what the facts are you needed to dive down. You can find it online through trusted resources, go to Yahoo Finance, go to investopedia, go to different resources that will actually tell you the truth about what you are learning and that is the best way. And hopefully these videos are helping you as well. Everything in here is based on my experience, so I will see you guys in the next video.
40. Intro to Fundamental Analysis: What's up, everybody? My name is Zak Hartley, and today we're talking about fundamental analysis. So first thing we're gonna do is we're going to start with a quote. The quote is in the short run. The market is a voting machine, but in the long run, it is a weighing machine. That quote is from Benjamin Graham. He was the author of The Intelligent Investor and kind of the godfather of fundamental analysis. Now what he means by that is in the short run, nobody knows what the market's gonna do. Nobody has any idea. It's tough to predict, and it's gonna go up and down with the trends that tides. What's hip, what's fashionable. It's going to go up and down just like anything else. But in the long run, it is going to act as a weighing machine, basically saying that take away all the glitz and glamour, which one is truly more valuable? Who has more gold, who is truly providing value to the end consumer and turning it into net profit and actually generating a return for their investors? And so what this quote is about is don't worry about the short term. Worried about the long term and finding companies that are actually valuable that are actually worth it. Toe hold in your portfolio and so fundamental analysis as about weighing out those different companies and figuring out which ones you actually want to hold and which ones you actually want to own. Now. Benjamin Graham This this book was written in the early 19 hundreds, but something a little bit more recent still an older gentleman as Warren Buffett. A lot of people know him as a chairman of Berkshire Hathaway, and the reason I'm using these two examples in these thes quotes years because fundamental and analysis and fundamental investing is very strongly rooted in your mind set. You have to have the right mindset in order to be able to weather the storm in order to think properly about thes investing decisions. So I'm giving you these quotes because this is how these two people think, and they are some of the best in the game when it comes to this specific topics. So what we talk about Warren Buffett to that I really like from him are Price is what you pay, but value is what you get, and so what he's saying here is if you buy a stock at $100 you are happy with the dividend and the cash flow that it gives you back, it is paying you something that you are very happy with, and you're glad to pay $100 with it. Well, if it then drops down to $90 it's still providing you $100 worth of value for now, $90. So that stock in your mind should mean this stock is now on sale. This stream of cash flow is now on sale that I valued at $100 area leer. It is now 10% often $90.20 percent off $80.70 dollars, $60. And so what he's saying is that price and value are two very different things, and what you're looking for is something where the value to you is higher than the current price and that difference. There is your profit margin. And it's one thing that he definitely lives by, because even when his stocks plummet, his holdings crash, he's still happy to hold these stocks, and he never really consider selling many of them. Next, our favorite holding period is forever. Now, he says, it's a lot because when he buys a company, he plans to buy it for a lifetime. Fundamental analysis and fundamental investing is definitely about the long term. You're not gonna be training in and out on a weekly basis. You're gonna look for ah stock that you're happy to hold on the long term that's providing you cash flow or that's providing capital gains that you are happy with and that you are looking for on a consistent basis. And so he buys these companies that are going to do that on the Forever time period because he plans to hold them forever if he can. Some of his investments include Heinz. They include railway companies. They include electricity companies. They include Geico, um, Berkshire Hathaway itself. So there's a lot of different companies under that umbrella. He owns a minority stake in Coca Cola. Hey owns a minority stake in Apple. He owns a minority stake in a several different large large companies. But the idea here is all of these companies that I just listed have been around for over 20 years and they're gonna be around for at least another 20 years without a doubt. And so he's holding these companies, and it's buying these companies for the long term, and that's the key here. And so Warren Buffett is the CEO of Berkshire Hathaway. That's where he does all of these investments. Soup Berkshire Hathaway owns all those positions that I just mentioned, and in 1962 the Berkshire Hathaway stock was $7.60. Now, over the next five years, Warren Buffett basically took control of that company, became CEO and has ran it ever since. And sit now training in 2020. I looked this up today, April 22nd. I believe it is. Thes stock is trading at $279,000. 902 179,000 $960. So really an amazing return. Warren Buffett is one of the richest men on the planet, and he has done this completely through fundamental analysis. And the reason I bring up these two is because Benjamin Graham was actually Warren Buffett's mentor. Reading the book The Intelligent Investor is where where Warren Buffett began investing, and that's where he got his initial ideology. And today it's done pretty well for him. He's usually in the top five richest people every single year. So in summary, fundamental and out analysis and investing is about the long term. You're usually looking for one or both, or combination of capital gains and dividends. Capital gains being buying the stock at one price and selling it at a higher price. That would be considered a capital gain. And it dividend is that dividend that you receive on a monthly or quarterly basis from that stock as a cash payment. Those dividends could be reinvested, or they could be withdrawn for casual tea you live on or invested elsewhere. Now the key here is that we're looking for great companies at good prices. It's another distinction here between value and price. We're looking for high value and really great and organic growth, and good companies that are high value at good prices were looking for that slight difference there, and that's where we want to get in. And that's the analysis in the strategy. So we're gonna use to is find that difference between the price and the value and these companies. But the one thing you need to be really clear about it before you go any further is try and set your goals. What are your goals? And then let's find a strategy to get there. What I mean by that is are you looking for consistent Cashel that you could come back to every single month? That's just going to coming into your bank account to dividends because then we can look at strategies to focus on dividend Cos otherwise, if you're looking for undervalued companies that are going to appreciate in generate large capital gains, we can use different strategies for that. And then the rest of this course, we're going to evaluate both of those options. So please join us along. It's going pretty exciting. We're going to go through both of those objectives here pretty soon. But this is the introduction to fundamental analysis. Thanks.
41. Finding the Financials: What's up, everybody? My name is Zak Hartley, and today we're gonna talk about financial statements. Now, as you can see, I have a new Power Point presentation. I've recently just built a brand new computer to specifically do some stock trading and video editing, so it's kind of a new set up on its own. Windows 10. So new Power Point system. This is gonna be the layout moving forward, but let's get right into the video. So financial statements. When I talk about financials, the three documents I'm talking about are your balance sheet, your income statement and your cash flows. Those in the numbers those of the basically nuts and bolts of your business. That's what everything gets summed up to is how much money did you make, how much cash is in the bank and what is your balance sheet look like? These are the numbers that make up your business. Now, how do you find these numbers? Well, there's three different ways. One. You can go to the company website. They're almost always posted there, too. There are certain filing organizations that take in these financials, so everybody in Canada has to submit to an organization called Cedar. Everybody in America has to submit to an organization called Edgar. They're basically acronyms for big, long fancy terms that say We're gonna take all your financials and verify them for C. R A. The third way you conduce it is to Yahoo Finance or other websites that are actively tracking those companies, so you should never have a tough time finding them. And the reason you would want to find them is because that is going to give you the financial performance of these companies over time. Now there's two types of financials that we're going to focus on and that you're really gonna want to look out for. They are basically categorized as 10-K and 10-Q The reason they're named that is because those of regulation numbers in the basically law that they have to requires them to submit . So they're acronym is 10 can 10-Q just because of legal standards? Not for any other reason. But the difference here is that the 10-K report is the annual report. So this is the once a year Big Daddy filing that the company has to submit to the SEC to Edgar to cedar, Whoever it is and basically say, Here's all of our financials Here is all of our reporting Here is basically everything you need to know about the company, and this goes out as basically proof that they're accurately reporting. And for all of the investors to know about now, the quarterly report is a little bit smaller, and it's a little bit different. Thief financials are at the top of the report, as opposed to the middle of the report in the 10-K and it's usually generally a smaller report, and it breaks things down on a quarterly basis, whereas the 10-K is a yearly basis. So small differences that every company will report 3 10 cues and then 1 10 k throughout a year, and they usually come 1 to 2 months after the actual date of the quarter. And so the quarter ends on December 30th. Your financials and your 10-K or 10-Q report might not be out till January or February end of January and February. Somewhere in that range, usually, so we're gonna get into it. I'm gonna show you exactly how to find these different things. So the first thing we're gonna look at test Legis because it's an easy one on. The best way to find these is to actually just type in the company and then just go investor relations and you can see investor overview. Now I'm doing this pretty much live here. So you've got basically everything you would ever want to know about the company right here . And if you go to financials and accounting, you see 2019 Q 4 This is the Form 10-K So this is the annual filing you can see we did. Q two cute three Q to Q three and then Q. For that was the end of the year. That's gonna be there. 10-K report. The rest of these are all going to be like a 10-Q So that's the difference here. That's that's the separation between him. Now, if we go to the Form 10-Q you can open this up and there's different things that you can look out. We're just gonna look at it as view HTML so you can look at it online and this is what it looks like. It's a lot of writing. It's not super appealing. It's not something that you're probably gonna enjoy looking at. But it's this is where all the nuts and bolts your company it's. So we look at Tesla Incorporated and the first thing we're looking at is their balance sheet. So on the left hand side, here we have their palates, assets broken down into current assets and basically long term assets. So current assets right here, basically cash and money coming in, and then all the long term assets that they own and then liabilities on the other side, short term and long term as well. And equity for a total of 32. Basically 1,000,000,000 on either side, it looks like so the balance sheet is basically snapshot in time. And this is where it tells you how many assets the company has and what they're worth, what the liabilities are on that company and what the shareholders equity breakdown looks like and how much of that profit that company has generated. Secondly, is a consolidated statement of operations or the income statement. So this is how much money was brought in during a specific time period and the 10-Q reports the quarterly reports. It's gonna be over three months time period. So when we look at the timelines over here, you can see three months ended september 30th 2019 compared to 2018. Its component quarterly basis the revenue, cost of revenue, gross profit, operating expenses. All of the information you would want to know is right in here. We're gonna break down another video, what we're actually looking at in those, But this is how you find them. So right here you can see the income statement and then just below it, we should see redeemable cash flows right there. So statement of Castro's This is where they spent their money. This is what they did with the money that came in and how they used it to generate basically revenue and income. So that was the first way that was looking at the company website. The second way is going to Yahoo finance. So we go to the basically main message here, the mean page we type in test so you can see test the ink right there, and we can come across all the way over to the financials and we can see different things here. So what? We're looking at right now is the income statement The same thing we looked at in the last report. We see the trailing 12 month. So this is basically the last year, and then you can see it broken down on a quarterly basis. Oh, no yearly basis here. If we switch over, we can see it on a quarterly basis. So lots of options. Same thing with the balance sheet and the cash flow statement. So again, all three financials that you don't wanna look at and the last thing we're going to do is look at Edgar filings. So you type it into Google. Really simple. We're gonna type in the company name. This is what Edgar stands for on somewhere in here. But you go Tesla in your company name, agency, test and create. Here. This is the one that we're looking for. So you click on them, you can see that there last filing. You can see all of their filings in here Now, when I say filings, this is basically any time a public company does something. If they hire a new executive, if they let go of a board of directors, if something changes drastically if they issue stock options. They have to file all of that with the SEC and the Edgar basically filings. And so where that's all captured, it is in here. And so when you see SC 13 g or eight K, these are all just different documents that the company had to file and the ones that were looking for the 10-K in the 10-Q Because they are the most important and they provide us with the financials. The rasam are based filing documentations. You want to look at it in detail, but you don't. There's no way you can look at every single one for every company. So we're gonna stroll down, scroll down. We see 10-K right there. We click on the documents, we can see 10-K description right there. Click on this and it's gonna open up basically the 10-K document. Now the 10-K is much bigger than the 10-Q And your financial statements are located somewhere in the middle there, usually in that graph format. So that's what we're going to be looking for. And we're gonna be looking for the consolidated statement of income, the balance sheet and the statement of cash flows. So selected. Consolidated? No, we don't want anything selected. Selected means they're just pulling out certain numbers. And using that, we want the full break them. So you keep scrolling. I'm almost at the middle of the document here. Boom, Consolidated balance sheets. That's what we're looking for. This is the big home run. Now. Again, a balance sheet is a snapshot in time. This is where the company was at on a specific date, specifically their year. And so in this case, they had $6 billion in cash, junior $46 million in restricted cash, $12 million in total current assets and $34 million in total assets. You can go through and see the liabilities can also see the consolidated statement of operations. So, revenue, total cost of total revenues right here. In 2019 Tesla did $24 billion 570 million. Pretty good number. Pretty cool to see for a little start up company like that. And you can really see all these numbers and then cash flows should be under here. Right here. So there you go. We've now looked at finding the financials on the Edgar website on Yahoo and on the company website. So we're just gonna go back to our little presentation here. I'm going to finish this off of the summary. So all public companies, anybody that you can trade, you confined those financials on a quarterly basis that usually come out 15 to 45 sometimes 60 days after the end of the quarter. You never really know. But they are announced, usually a couple weeks in advance of when they're going to release them, usually before after the market opens or closes. Secondly, all investors must have access to the same information that is a rule of the stock market. So if a company releases a piece of information, all investors have to have access to that information. It has to basically be public knowledge in the event that it is not public knowledge that is considered insider trading. So what that's great for is somebody starting out in all of us individual investors. We should have access to the same information as all of the other traders. We may not have access to the same Softwares and formulas, but we should have access to the same information and when you have information that somebody else can't get, such as insider information or information that's not public. That's considered insider trading. You really need to avoid that because it's a slippery slope that you can get caught up in so much trouble. So that's what insider trading is is when you have information that is not public. Lastly, the 10 came the 10-Q The 10-K is the long format yearly on report, and the financials air in the middle of the report that 10-Q is a shorter format quarterly report. It comes out three times a year, quarter, quarter, quarter and then year end and the financials usually at the top of that report. So check out the next video, where we're gonna talk about what the financials actually are and what we're looking for in general. Thanks and stay tuned
42. Reading Financial Statements : What's up, everybody? My name is Zak Hartley, and today we're going through how to read financial statements. Now this is a very in depth topic that has a lot of details to it. So I am just going to scratch the surface and come to the summaries here. So financial statements, ones that we're going to look at our the balance sheet, the income statement and the cash flows thes could be found on the quarterly and annual reports that 10-K and the 10-Q Like we talked about in another lesson, the 1st 1 that we're gonna look at today's the income statement. The income statement represents a company's performance over a period of time it as a start and end, and we're measuring the performance of how they did in between that time period. The specific performance we're measuring is how much money came in and how much money they were left with at the end of that time period. How much they made and how much came in. Not necessarily all of where went, but how much came in and how much went. They actually net profited. So the sections of the income statement that we're gonna look at and these come in order and they make a lot of sense. The 1st 1 is revenue revenue or first to how much money you actually brought in. Cost of goods sold is how much money you spent to produce the product that you sold. So if you are tested and you produce a car cost, a good soul represents the materials and the labor that goes into making that car. It does not represent your corporate office in your CEO salary and your email subscriptions . Next step after that is your gross profit. So your revenue minus you crossed a good soul gives you your gross profit you grows. Profit from there is attracted by the operating expenses. This is very CEO salary, and your corporate office comes in. So you've got your gross profit minus your operating expenses gives you your EBITA have. It is a very common term. It refers to earnings before interest, taxes, depreciation and amortization. It's basically here's how much money made before ah couple of different accounting changes and you pay taxes. And then at the very bottom of the sheet is net profit. And that's how much the company actually brought in at the end of that time period. So how much companies how much money the company did in revenue, and then how much actually left with to put on the profit line at the end of that time period? That's what we're looking at here. So the company that we're gonna use in this video is an example is Apple because everybody's familiar with them? They understand the product and have fairly simple financial. Surprisingly so this is pulled from their last reported financial statements, and I do believe that they report pretty soon here. But this was from the last one that I could find. So if we walk through this right now, talk to bond, we see net sales. That's your revenue. That's how much money they brought in. $79 billion from products, 12 billion from services total of $91 billion. And from the three months the three month period that ended December 28th 2019. Compared to the year before that, they increased it by eight or 9%. Comparatively, if we go down this sheet, you can see cost of sales. That's your cost of goods sold. That's how much it cost them to make the iPhone. So products and services, you can see the exact same amount. Their gross margin here was $35 billion so they brought in 91 billion. It cost them 56 billion to produce those products. They're left with $35 billion. They're operating expenses in here. So their corporate headquarters, their CEO salary, their overhead. They're basically overarching business operation expenses that they have to pay no matter what are in here on $9 billion that they're operating income and that the very bottom here you can see their net income. So they brought in 91 they were left with $22 billion at the end of this basically time period. Earnings before provision for income taxes is what they refer to his evident. You'll see it change some of these terminologies on different financial statements, but this is basically the summary. Someone we look at this we're saying OK, They brought in 91.8 billion. They cost them 56 billion. They were left with 35. They spent $9 billion on their operating expenses. Their earnings before interest, taxes, depreciation and amortization were 25 billion. They refer to it as a slightly different term here, and after those taxing and accounting changes, they were left with $22 billion that went into their retained earnings. That is really important. That's how you read this income statement, and then you can start to do your math based on it. So that's the 1st 1 That's a read the income statement. The next financial statement that we're gonna look at is the balance sheet. The balance sheet is different than the income statement. The income statement happened over a period of time. The balance sheet is a snapshot. It's like a It's like taking a photo off. Here's the company on this specific day. It always happens at the end of the quarter. So if we're reporting on Q three, it's the last day of Q three. This is the snapshot of the company, and this is exactly what it looks like. And what we're looking at when we take this snapshot of the company and take this report on the balance sheet is we're looking at how many assets and liabilities the company has in other terms how much money the company actually has, how much the company has, and then on the other side of it is how much the company hopes. Who do we owe money to and what is the debt on the company? These two categories are broken into long term and short term. Now we're gonna go into a very basic intro level accounting principle. But it's really important that you know this. You recognize it, and you start to identify three different pieces that are at play when you read this balance sheet, because it's very important. So every balance sheet is structured like this. Assets equals liabilities and shareholders. Equity assets are things that the company owns, like cash, inventory equipment, property investments and accounts receivable. So somebody gives us money for an order or places in order with us. That's an asset. Same thing with the cash. Same thing with the physical properties. The liabilities are things like accounts payable and debt. These are the things where the company owes money, and then on top of that shareholders, equity comes from the sale of stock and retained earnings. So the idea here is that your assets has to equal your liabilities and your shareholders equity. So imagine you're just starting out a company. And you had you wanted to purchase a piece of equipment to manufacture your which you out, you buy a machine on net 30. Okay, so now you now have an asset. Your assets has increased in the company, but you now have an account payable, and you owe somebody else some money. So you've made a transaction where you've purchased this equipment, and the key to this transaction is your assets have to equal your liabilities in your shareholders equity. So when your assets go up and you increase your equipment, you also increase your accounts payable. So the idea here is any time you make a transaction, there's always two sides of it, and you have to always make sure that your company the assets equals liabilities and the shareholders equity. And that's how you can determine that breakdown in the makeup of the company. Now we're gonna look at the actual financial sheep. I'm gonna show you exactly what I mean. This is apple. The exact same financial statement is the last one we looked at. If you look at it, we've got three different categories here. Assets, liabilities and shareholders equity. I don't run through a real quick and then go into detail. But if we look at assets, we can see the total assets for this year's $340 billion. We look at the liabilities and shareholders equity. We can see current liabilities, non current liabilities on this line right here, total liabilities of $251 billion. We can also see total shareholders equity of $89 billion. And when you add up liabilities and shareholders, equity equals $340 billion the exact same amount that the assets equal on the apple balance sheet. So the principle here is that your assets always have to equal your liabilities and your shareholders equity. That's how balance sheet is structured. And the reason is structured like that is your assets or what the company owns the liabilities or how they got there. And the shareholders equity is basically did you raise any of that money to get your assets by selling your stock? So let's go through this. We look for the assets. The first things on here are cash marketable securities accounts receivable UNAMET Tory's. The exact same things we talked about in the last like this is basically everything the company owns. Now. The difference between current and non current assets is usually determined by a period of one year. If that asset is gonna be turned over or used or is liquidated or is change within one year is generally considered a current asset. If it's a piece of property that you plan to hold for 20 years, like the Apple headquarters, that is a non current asset, and that's the difference. The same thing with liabilities. If it's a liability that's due within one year, it's considered a current liability. If it's do later than one year, it's considered a long term liability. So as we go down, you can see inventories None, um, other other current assets here at $12 billion total current assets of $163 billion you can also see property, plant and equipment so all the buildings they own and other securities at the own maybe investments in other companies and their total assets, or threatening $40 billion. And that's basically what Apple owns. A snapshot of the company at that exact period of time. Everything the company owns is basically on this list in here somewhere. They own $340 billion worth of assets. Now they Oh, they owe everything underneath this year. So their current liabilities, everything that they owe within one year you can see their accounts payable is $45 billion . So fairly substantial. They also how other current liabilities off $36 billion. They've got some liabilities in here up to $102 billion that are due within the next year. And they have another $148 billion that do within the next maybe 5 10 15 years, this term debt here and other non term liabilities. This is basically long term debt that they're paying down on a yearly basis, and you see that equals $251 billion so they have $340 billion worth of assets. They manage that by getting $251 billion worth of debt, and they also have down here you can see total shareholders equity of common stock 45 $1,000,000,000 retained earnings of $43 billion. So you can see here that most of their money came from basically debts and liabilities, but almost almost half of it just under half of it came from equities, such as to retained earnings that we saw on the last income statement that net profit. That's your retained earnings and that goes right into this balance sheet here and when you sell your stock in return for money to be used in the company that hits the balance sheet here. And that's what those two things on the bottom here are. The 45 billion and the 43 billion are basically Apple selling stock, as well as returned earnings from the company operating and basically using that money to generate more assets. And that's how you read a balance sheet. Here's what the company has. Here's Who they Oh, here's how they raised money by selling stock. And here's how much money the company is profited and kept in the bank account. That's what you're looking out when you see a balance sheet like this, the last one that we're gonna cover is the cash book. The idea here is you're looking at the starting cash in the ending cash. And what happened in between there? The Kachin and the cow show for the company, and it's broken down into three sections. The operating the investing in the financing sections of the cash flow statement. So when will you this? This is the exact same document from Apple. This is the casual statement from the same time period you can see at the top. Here we have their operating activities net income, the same number pulled from the income statement. This is how much money they basically made. And then this is what they did with all of that money. You can see cash generated by operating activities that generated $30 billion within that quarter. You can see that they invested it in a number of different ways non marketable securities, purchase of different security, sales of marketable securities, payments for acquisition of property, plant and equipment. So they're basically paying off their leases in these different areas here and then in the financing activities. This is something really unique about Apple that I just want to point out repurchase of common stock. So this company is actively buying. In the last quarter, they bought back $20 billion worth of their own common shares to basically raise the price of their common share. So something really unique in just a quick glance of looking at the cash flow statement is where you can see that type of information. They also had to pay taxes proceeds from issuing stock. There's a bunch of different things in here, but this is basically what happened to the money through operations. Where did you spend it to invest into the company? And how did you finance those operations and investments? That's what you're looking at in the cash flow statement and the big glaring thing here when we look at Apple in the first glances $20 billion rate into basically buying back their own stocks almost as much as their net income for the same quarter. So pretty drastic. Pretty interesting. Women look at the cash flow statement, but the idea here is this is where you look to figure out what happened to the money in between those three months because you're not always going to find it on the income statement. And the reason is is because, for instance, if Apple purchases an asset, apple purchases a brand new piece of equipment that cost $20 billion. That is not an expense for Apple that is going to hit their income statement. That is the purchase of an asset that is gonna be on their balance sheet and their cash flow statement. Because that is an asset there. They're buying, and you're not going to see the purchase of an asset on the income statement, which is why you cannot rely on just the income statement you need to be able to look at and understand all three of these financial statements. The income statement shows you how much money they brought in and how much they were left over with the balance sheet of the snapshot of exactly what the company owns and what money they owed different vendors, as well as how they raise that money to produce the assets and the cash flows about what happened within that three month time period with all the money that they had. So that's a quick summary on the on the cash flow statement. Another couple quick things income statement shows profitability balance you to the snapshot of company and cash flows. Show what the company is doing with that. So pretty much what I said, but in summary again. You really need to know these. I am just scraping the surface on these. That was a super quick summer. And you can dive so much further into this, but we're going to focus on is the ratios and comparing these financial statements between different companies so that we can analyze them and see who is the best in their industry. That is what we're gonna focus on for the next little while here. So So please stay tuned again. My name is Zak Harley, and thanks for watching this video.
43. What are Ratios?: What's up, everybody? My name is Zak Harley, and today we're talking about ratios now ratios, air information gathered from the financial statements that quarterly in the annual statements. And basically what we're doing is we're taking the numbers on their dividing, multiplying and basically combining them together to get a result that we can compare to previous quarters and two other companies. The reason when you want to do this is that we can analyze thes companies and decide which ones we want to invest in and how we can measure the performance of that company over time . So the first ratio that we're gonna look at is the net profit ratio. It's very simple. It's a net profit divided by the Net sales. And it's basically a measure of the efficiency of a company at turning revenue brought in into profit that they can get back to shareholders or use as an investment into the company . Now, as an example for this video, we're gonna use Apple because we've looked at their financial statements in a previous video. So they're easy to understand and because they're fairly simple and straightforward, and they apply to all the ratios we're gonna look at today. So when we look at Apple, we can see that they did $22.2 billion in net profit. They generated $91.8 billion in net sales. When you do the math on that, its really simple it's 22.2, divided by 91.8 and gives us a 24.1% net profit margin on. I got all of these numbers from their consolidated statement of operations or basically their income statement from the last quarter. And as you can see, I've circled the numbers here in Crete. So 91.8 billion in net sales, 22.2 billion in that income. And these are the numbers that I'm using to generate the net profit margin. And this is the basis and the metric that we use to analyze how efficient this is. This company of bringing in money and turning it into profit so really simple. I got this one right from the last quarter's financial statements. The next ratio that we're gonna look at is the price to earnings ratio. It's basically saying, how much profit did this company generate? like the last one. And how much is that stock worth? Comparatively so if we have to, companies that generate the same amount of profit? This is the metric we would use to see which ones at a better price and out of better valuation in comparison to the profits that they generated so really simple. It's just stock price divided by annual earnings per share. Now when they say earnings per share, what I mean is the net profit on an annual basis, divided by the number of sheriffs. So if your company generates $1000 it has 100 shares outstanding, AH 1000 divided by 100 would be $10 in earnings per share. Simple math is just earnings of the company divided by the number of shares on. We're looking at this on an annual basis, and we're also looking at the stock price on today's price. So the reason we look at this is to show the relative price compared to the earnings so that we can see which ones a better deal if we have to. Companies that are giving us roughly the same earnings when we look at the comparison of apple, we can see that their price today's $270 of 58 cents. Their annual earnings per share, based on the last 4/4 is $12 in 66 sets. So all I've done is taken the earnings per share in 1/4 and added them up the last 4/4 to get the annual earnings per share. And when we do the math on this and we divide the stock price divided by annual earnings per share, it gives us a ratio of 22. Now. I pulled this information from the same sheet as the last ratio is located. At the bottom, you see earnings per share, basic and diluted. Now, the only difference here is basic means. All of the shares that are actively traded in the market and I alluded includes the shares that are given to executives that can be exercised at a later date. So, for instance, if an executive gets a bonus or an incentive structure that says you can have 100 shares one year from now, if you hit X target, you get it. At this price, that would be a share that isn't in the market yet but can be exercise. And it would be included in the diluted number, but not the basic number. So we always want to use the diluted number. And to get the annual earnings per share, you're gonna add this number up the last 4/4 and then you're gonna divide the stock price. By that total. In this case, it was to 78.58 divided by 12.66 and gave us a ratio of 22 a p e ratio of 22 that we can now use to compare to the last quarter the last year, as well as every other company in their industry that we're evaluating of whether or not to buy the stock Next. One that we're gonna look at is the current ratio. This is really simple. It's just a current assets divided by the current liabilities, and it is a comparison and analysis to see can this company coverage short term obligations , doesn't have enough cash in the bank to cover the expenses that are gonna come up within the next year. So it's basically saying, Can the company's survive number one and two? How well is the position, cash and assets wise to cover the short term obligations that are gonna come up over the next year. The math is really simple current assets divided by current liabilities. So when we look at Apple, we see $163 billion worth of assets on their balance sheet, divided by $102 billion worth of liabilities on their balance sheet, and it gives us current ratio of 1.59 You can see those numbers identified very clearly here. On the balance sheet. 1 63 billion divided by 102 billion gives us 1.59 It means that Apple is in a great position to handle all of their liabilities and expenses over the next year. And if we compared to this to this to the other companies, we would be able to see how well they're positioned relative to Apple. For instance, Microsoft, um, Amazon, Google any of the other tech companies, so you can also do this with long term liabilities and assets. But generally it's concerned with short term liabilities and assets just cause it's on a one year basis, so it's a little bit more of a sense to ratio. The next one we're gonna look at is the dividend yield. This one is extremely important for any dividend investors, long term fundamental investors and anybody looking for cash flow. It's also one that Kevin O. Leary and Warren Buffett really focus on because they're all about cash flow. So the way it's calculated is really simple. It's just dividend per share on an annual basis, divided by the price for share. So the price for shares really simple. That's the price is trading at today, and the dividend per share on an annual basis is just a some of the dividends they're paid from that stock in an entire year. And the reason we look at this one is because it analyzes how large dividend is compared to the price that we're gonna pay for it. So if we buy a stock for $100 it gives us $5 dividends and as a 5% yield gives us $1 dividends, it has a 1% yield. If the stock was $200 and it gave us a 10 brick dollar dividend, it would still have a five percent yield. That's the basic math here, and it's basically saying by invest X amount. How much money am I going to get back? And how do I compare that between these companies? Which one's the best in giving me the most money? That's what we use this ratio to figure out. When we look at Apple, we can see that they pay a 77 cent dividend per quarter. That means that they're giving out 77 times for on an annual basis, and their current price is $278.58. When we do the math on that, it's 77.77 times four, divided by 278.58 and it gives us a total of 1.11% yield. That means that Apple is paying back 1.11% of its stock price to its shareholders in the form of a dividend every single year. Now that's a very low number. It's not a big number, and it's because Apple is a tech company that invests most of its money back into itself. Instead of giving that out as a dividend, that's why it's being able to grow so quickly since its inception. We look at the numbers. This is the statement, um, shareholders equity is located right below the balance sheet. You can see here dividends and dividend equivalents declared per share is 77 cents for the quarter and in December 28th 2019. So Apple pay back 77 cents in the last quarter. You multiply that by four. That gives you your annual dividend divided by the price of the share it gives you your yield. If they paid back much more, that yield would be much higher. And you get back more, much more cash on an annual basis through your dividends. That's the idea. What dividends is the casual basis of the money coming back to you, And this ratio helps you determine which one is going to give you the most cash back as that dividend, based on the amount of money that you're gonna put it. So in summary ratios help us to compare companies and understand their performance. Over time, we're gonna look at five different companies, all from the same industry, and we're looking for the highest dividend I'm going to compare these five companies, and I'm gonna look for which everyone has the highest dividend yield that someone I'm gonna pick. It also houses me. Look at their performance over time. Has that yields gone up has that you'll gunned down and which ways that trending as well. Ratios air specific to their industry, though. So when you look at Apple, you want to compare those ratios toe. Other tech companies don't want to be comparing them to an oil and gas company or a solar company or something completely different, because the ratios won't make sense and will be very off. You want to compare company ratios when they're in the same industry. That's how you analyze a market and decide which companies to get into you. Choose an industry and you choose the best company that fits your risk, tolerance and your golds. The one thing you do need to realize that was I've only explained four ratios here, and I've done them on a very summary basis and only scraped the surface. There's a lot more detail in each one of these ratios, and there are also hundreds more ratios for you to look at and understand the key here is no the big ones, the ones that I've gone through and maybe a couple more that you should learn and then focus on the ones that are specific to the industry's. You want to get it. If you're in a tech industry, probably want to focus on growth. If you're in an energy industry, probably want to focus on the operations and the dividend yield. If you are in a medical or by ASU tickle company, you probably want to focus on different ratios than earnings because they're not gonna have any earnings. They're developing their technology. So the big thing here is you want to focus on ratios that are applicable to the industry that you are trying to get into because there are hundreds of different ratios. There's hundreds of different calculations. Focus on the big ones to know a couple of more and then focus on the ratios that are specific to the industry that you want to get into. That will give you the clearest and most identifiable information to make it accurate. Trade. All you have any more questions? Send me an email. We're gonna dive into this a little bit more in the next couple videos to definitely stay tuned
44. Comparing Companies Using Ratios: What's up, everybody? My name is Zak Hartley, and today we're talking about comparing companies to figure out which one to invest it. So the first thing you want to do when you're comparing companies is look at the global economy and look at the country's economy so that you can figure out what's going on in the big picture, what direction we're going in. And if the industry that you are about to choose is going in the right direction. That alliance of that country's economy, what I mean by that is, if global oil prices are crashing, you probably don't want to get into an oil and gas extraction company. If the financial crisis is re happening and and all the banks you're going down, don't get into financials. Be aware of what's going on in the big picture after that, identify an industry that you want to be in and identify who the best in class Cos. By that I mean, who's the largest who makes the best product to as the most popularity who sells the most product, something that distinguishes them as the best in some way and then find a couple of competitors to compare against them so you can get a good depth and that diversity within that industry of the different companies so that you can make an informed decision about which one you want to be. A. For this example, we're going to focus on the technology industry. We're going to look at Apple, Microsoft and IBM. We're going to figure out which technology basically computer company we want to get into because we see value in it. And the way that we're going to compare these companies and evaluate these companies is by doing a breakdown using four different metrics for different ratios. Thes ratios are the net profit margin price, earnings ratio, the liquidity ratio and dividend. You. So what's gonna happen here is we're gonna compare three different companies based on four different financial factors. Now, to do this, I mean a spreadsheet here. We've gone through the ratios in a different example, and I made a spreadsheet here and got the companies listed out over talk here. So Apple, Microsoft and IBM, based on their ticker symbol at the top and then on the last year get the four factors so net profit margin price to earnings ratio current ratio and then do the dead yield. So when we go through this chart, we can see that Apple is the best profit margin at 24% compared to 20% 11% from the competitors. We can see that Microsoft has the best price to earnings ratio, meaning that there is the lowest price for the amount of money that they're earning relative to the amount of money that they're earning. They could be perceived as the best value for the earnings that every shares generate. That's what this ratio is. We look at the current ratio. This is basically comparing the current assets to the current liabilities, and we could see that Microsoft also wins this category. It means that they have more cash in the bank or marketable securities or inventory, that they can convert basically assets that if all of their bills came due tomorrow or something bad happened, they would be able to withstand longer than Apple would be able to, and longer than IBM would be able to pretty substantially in this case and then the dividend yield. So this is a new interesting one. This is how much money becoming is paying back to its investors to dividend. So we'll go through the income statement. You got your revenue, you've got your net profit at the very end of it, and then that net profit. The company decides how much of it they want to pay back to their shareholders as a dividend. That dividend is usually represented as a dividend yield in comparison to the press, so the company pays $5 dividends throughout the year and their stock price is $100. They would have a 5% yield in this case, Apple Isa 1.1% yield. Microsoft has a 3.5% yield and IBM has a 5.13% yield. So now we've got a three companies who have got our four different ratios that we're gonna use. Compare them and we've highlighted which company is the best at each ratio. So when we look at this the first glance, it's easy to say Microsoft. It has to winning ratios. Apple and IBM both have one, so Microsoft is rationing best. When you look at this data, though, we need to die a little bit deeper just to confirm that. So we're looking the net profit margin. There's 4% difference between Apple and Microsoft. Not a huge difference, but substantial enough when we're talking about the kind of money we are so small difference there. But when you look at IBM, both of whom are almost double what IBM is, so I am clearly low profit margins. Not a great sign there, just as the overall business, their ability to convert money coming in into net profit not a great sign from the company there price to earnings ratio. Apple is 22 times their earnings, meaning that you would have to take 22 of Apple's last earnings to get to their price, their earnings per share compared to their price. Microsoft is only eight, so micro sized is showing that it's a much, much better value for the earnings. The price compared to the earnings of that stock is a much better value and Microsoft than it is an apple. We look at IBM, Microsoft is better than at IBM. But IBM is better than Apple, so kind of a toss up on where you go there. But it drastic drastic change between Apple and Microsoft there So small change between that profit margins, drastic change between price to earnings ratio and then look at the current ratio, we can see that both Apple and Microsoft are above one. That means that they have more assets on the APP liabilities. However, we can notice that IBM is below one that is a red flag. That is a bad sign that is us seeing that they have more liabilities than they have actual assets on their balance sheet and shows that they could have some trouble paying down all of those assets and or storing all of those liabilities within the next year because they don't have as much assets, so they better be able to build that up in some way, primarily cash. So after looking at this, I'm three ratios down into this, and I could see that IBM has lower profit margins there middle on the P ratio. But they have a terrible current ratio, and I could see that they could have some liquidity problems already. IBM is that IBM is just not the place that I want my money. I have some concerns there. The profit margins aren't high enough for a technology company There. VE Ratio is actually fairly decent. It's kind of appealing, but their current ratio worries me a little bit. And I know just from my knowledge, I haven't bought an IBM computer in a while, and I don't know too many people that have. So I know they did launch IBM Watson. I don't know a lot of information about that, but so far the financials don't look good on IBM and my head. I'm thinking Apple or Microsoft when I get down a little bit lower. I'm looking at the dividend yo that. I see a 1.1 compared to 3.5 compared to 5.13 now. I'm being the showing 5% probably because their stock has drastically fallen over the last little while. When I look at Apple and Microsoft, their stocks have risen over the last little while. They dipped into covert, but they're starting to come back up and they're still holding, holding at least a dividend, Which is nice to see now. Apple is at 1.1% dividend. That's pretty low. That's not really gonna count for much. It doesn't even cover inflation these days. but I seen Microsoft's currently at a 3.5% the evidential. Now that is appealing. That is actually something substantial. That is a little bit of income. It covers all of the inflation. It could grow over time, and and that's a nice little piece of dividend. It's not great, but it's a nice compared to the 1.1 it's through is literally three times a day. So when I look at this chart now, if I compare just Apple and Microsoft C, Microsoft has a better price to earnings ratio. They have a better current ratio, and they have a higher dividend yield. They have close now profit margins. Its a difference of 3.5 3.6%. So it's not huge, but it's it's a difference. And when your time with that much money is definitely difference, but they're paying a much higher give it in yield. They are paying a or they have a higher current ratio and they have a higher way lower storey price to earnings ratio, which means I'm getting better value for my money. So when I compare the three major computer companies here in tech companies, I'm saying I want to buy Microsoft because I'm gonna get a small dividend for it. I get better value for the money that I'm putting in in terms of earnings, and there are very safe company. They've got tons of assets in comparison to their liabilities. So I really like Microsoft as a purchase when I'm going to get into the computer industry. So that's how I would look in this chart. In summary, we're going to use ratios to compare the company performance within an industry. We're always going to compare companies within the same industry, and we're going to use the ratios that are important to us for that industry. For instance, if we're in a startup or a pharmaceutical company or biotech company, they're not going to pay a dividend at all. So we're not going to look for a dividend yield. If we're in a very, um, older industry like let's say we're doing soda pops, they're going to pay a dividend. We're going to be looking for a do. Then you'll let me evaluate that industry. So we have to be very careful that we're using ratios that actually apply to the industry that we're trying to get into. The other thing is, I only looked at four ratios here. You could do this exact same technique with 10 or 15. We're even 20 and basically go through. Say which companies the best, and then take a second glance and evaluate that information to make sure that what you're seeing is completely accurate. And any time that you're gonna do this, that this basically strategy, make sure you're doing it with companies in the same industry. It does not make sense to come Bear apple toe Walmart or or Highs Teoh, a technology company. You need to make sure that you're doing this within the exact same industry so that you can compare apples to apples and these ratios will make more sense. So if you have any questions, send me an email. We're gonna dive into this a little bit more in the next few videos, so stay tuned
45. Market Cap and Share Price: What's up, you guys? My name is Zak Hartley. Today we're gonna be talking about market cap and share price. Let's get right into it. Shares thes are the things that were buying and selling A share represents part of a company of our represents. The ownership of that company and a company has control over its shares. What I mean by that is when you start a company or when it comes to get started, they can issue any number of shares they want. If it's a single person, you can issue one share he can on that share, any of 100% of the company. He can also issue a 1,000,000 shares. And he can over all a 1,000,000 he can own almost all of them. You can own half of him. Whatever he wants to set up, he can issue as many shares as he wants. Companies can all shoot, issue more shares to raise money. So, for instance, if you start a company with 1000 shares and then you you prove it out, you've got some revenue. You've got something cool here, but you need to raise some money. You can issue new shares in return for capital to raise that money. And now you've diluted the company. You've issued more shares. They're worth possibly last, possibly more. But there's at least more off them, and lastly, it coming. You can split its shares. This one is really important because it makes a difference as to what the price is off that share. And what I mean by a split is, let's say your share value goes from $10 to $100. You can split that share in a 2 to 1 split 321 split a 10 to 1 split or 20 to 1 split whatever number you want, and what it will do is reduce the value of that share by, let's say, 2 to 1, and it won't double the amount of shares that you own, so the value the overall value that you own will not change. But the number of shares that you own will change. Now. The reason that companies do this is for a couple of different reasons. One is, if the price gets too high, you can't invest in. If it's a $20,000 doc, it's difficult for me or you or the average investor to get into. Also, if it's too low, they can't get listed on certain exchanges. So in the New York Stock Exchange to be listed on that stock exchange, you have to have a treating price of at least $1. And if your price falls below $1 for 30 consecutive days, you either get delisted or you have to do a reverse split. The reverse split is when you take all the shares that you only you do it 2 to 1 reverse split and you basically say, OK, everybody has half his many shares now, but they're worth twice as much, and that way you could get your price over that $1 to stay on the New York Stock Exchange. There's also certain biases around penny stocks. A lot of people like to trade penny stocks. So, for instance, when all of these cannabis companies came out and started in 2014 15 and 2016 they all started at 25 50 60 70 cents a share because institutional investors weren't gonna buy them . But guys like me and you day traders Day today investors speculative investors, guys that can take some risk. We're definitely gonna buy them and being able to own AH 1000 shares at 60 cents instead of one share of $600. It makes you feel a lot better. One and more people are willing to buy that that are basically going to buy it speculatively. So having a low share price allows junior investors, young Investors, day investors basically anybody that's not trading with millions of dollars. Ah, low share price allows them to get in really easily. High share price kind of deters them, and you have to be listed as certain prices to stay on certain exchanges. So if there's a lot of different moving pieces here, when it comes to your share price as a technical feature, more so than what it represents with terms of value and it's $5 or $10 it doesn't really mean anything. But if it's 50 cents or a dollar 50 in terms of staying on the New York Stock Exchange, that's a massive, massive difference. So these were some of the different things that a company can do to control its share price . Now, when we talk about market capitalization, what we're saying in some other terms. It's called market Cap, but what we're saying is this is the market value of your company. That's all. Market cap for market capitalization is, and it's calculated by share price times number of shares, super simple calculation. All of the shares outstanding are issued. Basically every share that's out there, the largest Army confined times the actual stock price of that share at this moment. So an example of that is Company A has a market cap of $1000 that could look like 1000 shares at $1 each, Or it could look like one share out $1000. Now it could be any spectrum in anywhere on the spectrum. Inside of there could be 500 shares at $2 each. It could be anything we want. But what I'm trying to say here is that the price of that share in this situation, for instance, means absolutely nothing. It could be $1000. It could be $1 but that company is still only worth $1000 and that's why we use market capitalization show shares Market cap. The number of shares outstanding is just important as the price, you're multiplying the price by the number of shares, so both of those air equally as important. But you cannot compare the share prices because they could have different number of shares issued. What I mean by that is you cannot compare the share price of Apple versus Microsoft because Apple might have three million shares issued and Microsoft Mind only have two million shares issued. So you cannot compare the price of stocks because 99.9% of the time they're going to have a different number of shares issued. I can tell you that almost all the time, and that is the reason that we use ratios and market cap Market cap will let us safe. Microsoft's a $2 billion company and apples a $3 billion company. And the ratios will let us say Apple mais 20% on their revenue and Microsoft makes 25% on their revenue. So instead of complaining the price, we're going to use ratios and we're gonna use market cap to compare these different companies. Now. When does the price really matter? While like I mentioned at the beginning of this video price really matters when the price of one single share is higher than the position that you want to hold. For instance, if you want to hold all of your positions, you wanna hold 20 positions. Each one has 5% of your portfolio on each one of those is gonna be $1000. Well, unfortunately, you're not gonna be a to buy any of the stocks on this list of Amazon Google, Berkshire Hathaway because they're all well over $1000. Just to hold that stock to buy the Amazon is going to cost you $2400 just to hold one stock . So most people aren't gonna play very lightly with a position and Amazon if they're just getting started out or if they're just getting into the markets. And what that does is it eliminates all those speculative and retail investors from buying Amazon stock so they don't have these crazy price movements on a little bit of news. Like what we were seeing in the cannabis industry lasting at the bottom Here, you can see Berkshire Hathaway their prices $261,000 for one single share as because Warren Buffett refuses to split its stock. And so, in order to buy into Berkshire Hathaway Class A stock, you have to have $261,000 just for that position. However, luckily, they do have a Class B share. That is that price divided by one hundreds, 100 or 1000. So I think they might have a couple of different options. Now you can get into Berkshire Hathaway without needing to invest that much money. But, for example, without splitting their shares, that's where Berkshire Hathaway has ended up over 50 60 years. So pretty amazing Great job, toe Warren. But this is just an example of why you can't compare the price to devalue. Amazon and Apple are both worth more than Berkshire Hathaway, but their share prices air trading, Apple's at $200 the Amazons at $2400 apples even worth more than Amazon. So that's why you can't compare the prices. Lastly, in summary, we're going to use the market cap in the ratios, compare these companies and not the stock prices. And the stock price should not matter unless the price of a single stock is larger than the position you want to hold. That is because we're going to use ratios and market cap and other techniques to determine whether or not we want to buy these stocks and not the price of the individual stock itself . Unless it is a larger than the position we want. Then we have to figure out other ways around it may be buying an option may be buying a partial share, maybe buying a different way into it, or maybe buying one of its competitors or maybe one of its suppliers. Lots of different options. But in summary market capital ratios, That's the way we're gonna compare companies. And that's why the share price means not as much as you might think it should. So it got any value from this video. Please shows of love. Thank you so much. My name is Zak Carly Doctor. Soon
46. How Dividends work : What's up, everybody? My name is Zak Hartley, and today we're talking about how dividends work, So a dividend is a payment from the company back to its shareholders. It happens when a company generates profit. For instance, Apple sells iPhones and services. They sell them, they make money on them, and at the end of each quarter, they're left with some net profit. Some of that profit gets reinvested back into the company through R and D, through salaries and through equipment. And some of that profit gets set aside and paid out back to the shareholders as a dividend . Now who decides how much that dividend is and where it gets paid? Well, the board of directors is in control of this. You see, the CEO operates the company. But the board of director chooses that who the CEO is and how much the dividend is and what happens with the profits of the company as well as the strategy of the company. And so the board of directors comes in and says, OK, here's our strategy. Here's how much money we have in the bank. Let's put this together and see how much we want to give back to our shareholders in the form of a dividend. Therefore, the board of directors has full control to increase or decrease the dividend at any point, and they can completely cancel it if they feel the need. What that means is that if you invest into a company because of a dividend and the board of directors decides to change their mind and no longer issue dividend, you now have to make a decision. Do you still want to hold that stock or do you want to get out of it? And there's nothing you can do to hold them accountable for not paying that dividend. So the important dates you want to watch for when a dividend when you're looking for dividend and this is the actually the process, that company will go through to issue the different it happens over three days. The 1st 1 is the date of declaration. So on the date of declaration, that is the day that the board of directors actually announces the dividend to use a couple days after the meeting, where they've decided they come out and neither list on their website or through public filing, and they say OK, X Company is going to issue a dividend, they usually release it, and then they have two more dates that come out with that announcement. The 1st 1 is the date of record. Now. The date of record is the day that the company actually goes soon says Okay, here's everybody that owns the shares. However, there is also a date called the ex dividend date that happens two days before the date of record. The ex dividend date is the day that you must own that share or by that share before in order to be on the date of record. Now the reason they do that. So, for instance, you have to own it before the ex dividend date, and you have to own it on the date of record. The reason that they do that is so that they don't have millions of people trying to buy the shares directly before the date of record and sell them directly after you see this giant spike of people just trying to play the dividend game, and that is why we have the two dates here. CF hold it over a 48 hour period, at least, and that's how you collect your dividend now, The last day here is the actual date of payment. This is the big money day. This is when you actually get paid. This is the day that the company actually pays a dividend out to the shareholders. Now, if you own the company directly, you'll get that basically money put into your account. If you own it through a brokerage, that company will pay the brokerage, and then the brokerage will put that money into your account. And so when it company decides to pay a dividend, they have a meeting at the board of directors. They decide. Okay, we're going to issue this dividend. They come out with an announcement. That's the date of declaration. They say you need to hold these shares on X Date. That means you have to be on record of holding that. Shane. You have to have bought it at least two days in advance of that date. And then the dividend date is the day that actually gets paid. Now a lot of companies have what's called a drip program. Drip stands for dividend reinvestment plan, and what it means is when a company pays you out a dividend. It takes that dividend, and it automatically reinvests it back into the stock of that company. So if three M pays you $1000 in dividends, it automatically takes that $1000 and goes back in and buys X amount of three M stock. Now the advantage here is that you pay very little commission and very little management feet because it's automatic. You don't have to pay that basically $10 for every trade in and trade out. It's very low commission. You don't have to pay any commissions on it. So it seems to a lot of money there and basically builds up your position in one stock that's gonna hopefully continue to pay out a dividend. It's kind of like earning compound interest, but it's on a dividend instead. The problem with a drip campaign, though, is that if you have a large position in one company within your portfolio and your in a drip program with that company, that position is likely going to grow relative to the rest of your positions within that portfolio. What it could mean is that over time you have an even larger position in just one company relatively to the rest of your portfolio. And if something bad were to happen in that industry or to that company, you would be at risk of losing a very large percent of your portfolio because you're less diversified. Being evenly spread out a monk Shal larger number of companies. So a drip program is really great because you can save on the commission's. You can save on any management fees. However, it can establish one very large position within your portfolio that you may want to re balance over time. That's where portfolio balancing comes into play, and we're gonna talk about that in a later video. Lastly, you want to look at taxes, especially when you're trading over any international borders. Taxes are a big implication, or depending on what type of the counter. And so always check into that. I can't give you any advice on that, because you could be watching this video from all over the world. But definitely look into the taxes whenever you're talking about your dividend reinvestment plan. In summary, dividends occur over three days. There's the declaration date to record date and the actual payment date, and you must hold the stock. On the certain days to receive that dividend, you can reinvest your dividends or use them as cash flow. You can generate enough dividends completely live your entire life off. That is the angle. That is where I think everybody wants to get to. So we're gonna work on more strategies to get there coming up. So stay tuned and follow along in the next few videos.
47. Dividend Investing: What's up, everybody? My name is Zak Harley, and today we're talking about one of my favorite subjects, and that is dividend investing. So what is it? Dividend. Let's just cover that real quick. A dividend is a payment that comes from the company and goes back to the shareholders. So if you buy a stock in a company that pays a dividend, it's usually done quarterly. They will send you a payment every quarter. You can choose to keep that his cash and put it into your investment account. Or sometimes you can put it directly back into that company if they have a program. For now, these dividends come from retained earnings and net profit. So when you go through your income statement, you see revenue than at the bottom. You see your net profit that net profit at the end of each quarter goes into your retained earnings account, which is the sum of all of your net profits from throughout the year. And then, out of that retained earnings account, a company pays a dividend back to its shareholders. Now that dividend is decided by the company. The amount of that dividend when they pay that do, then how much activity and is, and all those different factors are determined by the company. They can turn an honor off at any point. They could decide to change it at any point, and they're not held to any basically certain restrictions on that dividend. Now. These dividends are usually paid coordinated, but you can also see them done monthly or annual. What is the goal here when your dividend investing that's a really good and important point to go? Get out here? And the goal here is to build a portfolio dividend paying stocks to generate cash full. Now what I mean by cash flows payments that are coming back to your bank account on a monthly annual quarterly basis. And you can use that cash flow to either reinvest back into your portfolio, being best back into that stock or to use for your daily expenses. And I think that's really the ultimate goal of do. That. Investing is to develop a portfolio of dividend paying stocks that will generate enough cash flow for you to cover all of your living expenses. If you can do that, you will have hit financial freedom basically, the end goal that says, All right, I have a portfolio. This is where my money is and my money covers all of my living expenses, and that's angle here with dividend investing. So how do we achieve that goal while we achieve that goal by buying and holding stocks that will continue to pay their dividend and hopefully grow that dividend over time? How do I identify stocks for dividend investing that are going to meet that goal? Well, we look at four different factors to get started. The 1st 1 is the dividend yield, the dividend payout ratio, the history of that dividend and a dividend growth rate. Now I'm gonna go through all of these individually here. So the yield is how much that stalk actually pays us. If we pay $100 for a stock and it pays us $5 back and a dividend per year, it has 5% yield. The payout ratio is how much of the net profit per quarter is paid out as a dividend. How much of that money actually goes back to the shareholders in the form of a dividend on each payout number of years and the safety of that dividend is basically how long have they been paying that dividend consistently? That's what we're looking for here is we're gonna be holding these stocks for the long term . And so we want to stock that has a track record of paying a dividend and that we think is going to continue to pay a dividend if they just announced it. Or they have a history of not paying their dividends and taking it in and out. That is a red flag for us, and we wait may want to be very careful there because it's not going to give us consistent cash well, like we're looking for. And the fourth factor is the dividend growth rate. That is how much this dividend increases over time. So, for instance, if you buy a stock for $100 your book costs $100 it gives you 5% dividend a $5 payment this year. Well next year. Hopefully, it gives you a 6% painted for a 7% payment or an 8% payment on that payment increases over time because what will happen is your stock price will also increase over time. So if you buy it at $20.10 years later it's worth $30. That stock is still gonna want to maintain a Let's say, 5% pay up, and at 5% on $30 your dividend will have just increased 50%. 5% instead of 20 will now be at 30. So that's what we're looking for. Here is a dividend that disagreement grow over time so that hopefully, in 2030 40 50 years from now every dividend is worth the amount that you actually paid for the stock and you're making four times your money. Justin, do it. That's the best case scenario. So this is the breakdown that I'm using here. What I've done is I've taken two different dividend paying companies to that. I like that. Both manufacturer have the equipment, so they're in the exact same industry. The manufacturer, big construction equipment, farm equipment. They do just about everything. It's basically anything that's not gonna go on a road, and that as big wheels John Deere and Caterpillar make it, we're going to evaluate them by the four factors that I just described on here that yield the pale ratio. The number of years in the dividend growth. And then we're going to figure out which company has the better financial factors and which one we would want to put our money and as a dividend investment. So when we start with yield here, we can see that John Deere has a 2.15% yielding. Caterpillar has a 3.57% newt, meaning that for every $100 we put into Caterpillar, we're gonna get 3.57% of that money back and a dividend per year with John Deere is 2.15 So kind of a drastic difference. They're not quite double from counter pillar, but but fairly close. So ah, good increasing caterpillar here on the yield beating. We're going to get more money back, the money that we put in, and it's gonna basically decrease the amount of time until we get our full investment back . I really like that. That's a big one. We look at the payout ratio we're seeing 29.69% and 35.2. This is basically the company generates net profit at the end of the quarter. That's all the money that they actually made. And then this is how much they're saying We're going to pay out in dividends now. What you want here is you want to get as much money out of the company as you can, but you don't want that to cause the company to be financially unstable. So you have to kind of find this middle ground here. For instance, if the company was trying to maintain X up dollar dividend but their net earnings decrease , their pale ratio would increase. And that would put more stress on the financials of the company. If the amount of their standard dividend that they were trying to maintain ever increased of what their net income was for that quarter. That would be a drastic problem for any of these companies, and they would have to cut their dividend because they would be losing money just by paying that dividend. So it's a tricky balance where you want a high enough payout ratio that as an investor you feel like you're accurately getting your money back and a good return on your investment. But you don't want that return to cause financial instability in the company because it's too high. So the rule of thumb here is anything over that kind of 60 to 75% is just way too high, and your dividend is at risk of basically not coming out. Anything below 10 15 20% is a very low payout ratio. And so when we look at this, we see John Deere's at almost 30% to counter close at 35%. These air good healthy payout ratios, these air almost probably close to industry standard across the board, these air healthy ratios were getting about third of the money out from the profits. As a share holder, I feel like that's pretty healthy. It's a good number right now, and Caterpillar is 5% higher. Then John Deere. So Caterpillar wins this by a small margin. It's not absolutely drastic, but its material enough to be to be a good chunk of money 5% higher. In a ratio like that, it is pretty good. So Caterpillar wins this one as well here, and this is basically showing that both of these air fairly healthy caterpillars probably got a site at here. But by no games isn't risky. You're gonna put the company in any type of financial instability. Third factor. Dividend safety. You could measure this in a number of different ways. One of the year's I'm measuring one of the ways I'm measuring it is by a number of years that the company has consistently paid a dividend or increased their do over them. We look at John Deere. It's 31 years of who like caterpillars 24 years. So these are blue chip stocks that have been paying dividends for a very long amount of time, and John Deere was paying them for 31 years. Cat opposing pain of 24 years John Deere is clearly a significant amount longer, but like Caterpillar, still 24 years that they've been paying the stocks of both of whom are extremely long term . I would have AH lot of strength investing in either one of these with the assumption that they're going to continue paying their stock because caterpillars at 24 years, I don't see any risk there. If it was at two or three years, there's some risk there, and John Deere was at 30 risk 30 years. That would be substantial difference. But because caterpillars 24 years of history paying that stock. I see this as a very small difference, and there's not a huge risk here when we look at this ratio. Last factor here and this one's a big one. Is the dividend growth rate averaged over the last five years? What I mean by that is how much did the dividend increase from one year to the next year? And when we look at this, I'm averaging it out over the last five years again, annualized return of doing this by basically just looking it up on Google and Yahoo Finance is that's a few numbers to crunch, and it's just easier to look it up. But this is really interesting because we're seeing 3.81% growth rate from John Deere. But it's 6.5% growth rate from counter pips, so it nearly double the growth rate on the dividend from Caterpillar, which is absolutely substantial. When we're talking about holding this stock for 5 10 15 years and just collecting that dude . We're seeing substantial growth in the growth rate. We're seeing a higher patient payout ratio and we already have a higher yield. There's not a big difference in the number of years. So when I look at these two stocks and I do this comparison of which one I would want to own as it dividend investment, Caterpillar is the clear winner. There absolutely the best stock here because they have a higher yield to have a healthy pale ratio. They've been paying this dividend for 24 years and have a dividend growth rate of 6.5% compared to 3.81 caterpillars to clear, hands down winner and I would invest in this star nine times out of 10. Now, in summary, dividends are a payment from a company to a shareholder, and they're designed to provide consistent cash flow. They're supposed to be a consistent payment that happens every quarter from the company to the shareholders, and you can evaluate with company you want to buy the stock on for the dividend based on different ratios and metrics like I have identified in this video. Now I've believed four different factors. I recommend using maybe a couple of a couple of more. If you want to do a more in depth analysis, there's a lot of different ways you can do it and you can add on more ratios. You can, Adam or metrics. You can also find other websites that will give you dividends. Safety score. There's lots of ways to do it, and dividend investing is one of the safest ways to do it. But it takes time is a very long term game. You want to buy these stocks. You wanna hold them for 5 10 15 years. It is a long term play. You don't want to be in and out of them all the time. If you want more information on this, you want to see somebody doing it very well on a day to day basis with a great mindset. It really knows what he's doing. You should check out, you tube, you should go on Andrey, Jake. I've put his name on the screen here. I don't quite know how to say it, but I watched a couple of his videos and he just has a phenomenal mindset about how to actually do dividend investing. The guy loses 30 40 $60,000 he still holds all of the stocks. It's really investing is really interesting because it's mindset is really, well, a keen to dividend investing, and he has lots of lessons for people who are. So check hemo, follow along with the rest of the lessons and stay tuned. It's gonna be a couple more videos where we dive in deep to more dividend and value investing.
48. Importance of Diversification: What's up, everybody? My name is Zak Hartley, and today we're talking about diversification. So when I mean my diversification, is that old saying that everybody's heard? Don't put all of your eggs into one basket Now it's a metaphor, and what it means is the eggs are your money. The eggs represent all of your money, your savings and everything you can generate. And the basket is all the different places that you can put your money now. Some of the options or some of the baskets of where you can put your money. Our cash stocks, bonds, mutual funds, E T. ETFs and index funds. Basically groups of those different assets. You can put it into gold or silver you put into crypto. They can also put into real estate. I'm going to do a brief walk through just on the sea and see the advantages and disadvantages of each of these baskets. So when we talk about cash, that downside is that there's no return on your money and you lose 2% per year to inflation . That $100 bill is never gonna make you any more money, and it's gonna be worth less. Every single year that goes on. Also, if you have $50,000 you better have somewhere secure to store that either in a banker in a safe in your house, it can be a little bit stressful, so there's not a huge upside toe holding onto cash except for just safety and security for yourself. Stocks are really interesting. They actually have the highest annualized return on your investment. If you look at stocks over the long term, they're by far the best return for any asset classes, and they have an average gain of 7 to 8, sometimes even higher per year. When you look at full in next funds, they're completely handled digitally, so you don't have to worry about storing everything, and they can provide you a dividend so that $100 stopped can pay you a dividend every single year and be worth more at the end of it as well. In comparison to your $100 bill, however, it does require a base level of understanding, like what we're talking about here and what you're learning in this course now, bonds are kind of unique there in almost guaranteed return on your investment. What I mean by that is, the only way that your bond doesn't get paid out is if the company or the country goes completely bankrupt. Now the downside is that your principle is subject to inflation. For instance, if you buy a $10,000 bond or $10,000 worth of bonds and their 30 year durations, well, that $10,000 is now going through 30 years of inflation. And the buying power of that $10,000 is gonna be drastically less in 30 years than it is to today. So you lose a little bit to inflation over the bonds. You need to make sure that your interest rate on that bond is much higher than your inflation, so that you are making money. Now there, two types of basic bonds There's Treasury bonds and corporate bonds. Treasury bonds are guaranteed to countries and governments. They're extremely secure, their usually referred to his T bells. Whereas corporate bonds are slightly less secure. However, they are much less risky than stocks in comparison. Still, now, mutual funds E. T. ETFs and index funds, thieves air basically groups of stocks and bonds, and the nice thing about these is that they offer you instant diversification. So if you have a portfolio of $20,000 you want to get into 20 different companies, you don't need to make 20 different trades and paid mission 20 different times. You can buy one mutual fund E T F for index fund, and get instant diversification within one trade of your $20,000. Now these different groups can hold stocks or bonds or both, but they're primarily a long term investment. They're there to measure long term results and usually track an index or the results of the general market. They also have low management requirements from you. So, for instance, if you were looking for instant diversification and you didn't want to look at the stock market all the time, one of these would be a great auction for you because they're low maintenance. Somebody else's managing them most of the time, or they're tracking an index that which is going to give you the results of the market. And over the long term, that's generated 7 to 9% return, so you're in good hands here. Golden silver. The downside here is that they have no ability to generate casual. That $100 piece of gold is never going to generate you a $5 bill worth of dividends. The price fluctuates based completely on the value of that mineral and supply and demand. At the time, if we find a giant storage of gold in the ground and we go in mine it successfully, there's going to be more supply, and the demand is gonna go down in the price is gonna fall. Same thing vice versa. And golden silver, usually used as hedges against the economy when the economy is going to collapse of the world, is on the brink. People by golden solar, because they think they'll be up to trade it later and because everybody else wants it. So it goes up. Golden silver is usually hedge against Akani the economy, but it is never going to provide you cash will. And it has a lower return than stocks do over the last 100 years. By far last one is crypto currency. This is a digital currency, and the value is based on supply and demand. Just like stocks, however, is extremely volatile. It is fairly unregulated. What that means is that if something goes wrong, you're gonna have a very difficult time trying to figure out what it was and why it happened and getting your money back in the stock market. You're not gonna have that issue. There's plenty of regulation, plenty of support and plenty of people that are willing to help you out, especially wherever your brokerage is or wherever you trade. Now those are the different places that you can put your money. You can also add in a couple other ones in there, but those are the main ones, and the reason you might want to use one or two or a couple of those different baskets to store your eggs is because you want to diverse fight. The reason you would want to diversify is because it significantly lowers your risk. A lowers your risk because there is less impact from any single threat. What I mean by that is if you develop a portfolio that is very heavy in oil and gas companies, it's 90% oil and gas companies, and the price of a barrel of oil plummets or falls. Your entire portfolio is going to fall. However, if you had a portfolio that was made up 1/4 of oil and gas companies, 1/4 of soil solar, 1/4 of consumer packaged goods companies and 1/4 of technology companies. If oil and gas plummets even worse than it did in the last example, you were going to lose much less money than you had in the first example, because you're diversified in three other industries that are hopefully going to make up for that loss. The idea here is long term security. If one falls, hopefully you have 345 other options that are going to make a little bit of money to make up for it and a little long term. All of them will make a little bit of money so that you can generate some returns for your investments. Now there are some downsides to diversify. The downsides are that you pay higher transaction fees and rates. What I mean by that is, if you bought three, if you took your entire portfolio and about three oil and gas companies, you'd pay three trading commissions. But if you developed a diversified portfolio of 20 companies all in different industries, you would pay 20 trading commissions, so you would pay I hire mounted, generate a diversified portfolio in comparison to an oil and gas focus portfolio. If you didn't go with an index or A and E T f. Now there are more maintenance and management fees to a diverse five portfolio. Because you own so many stocks, it can take re balancing. Sometimes you own too much of one stock and too little of another, so you have to make it trade to re balance that and there's lower reward. We talk about risking war trade off here. When we have a diversified portfolio, the reward is lower because you were. If you have a stock that goes up by 100% you own a smaller proportion of it at the diversified portfolio, compared to if your entire portfolio was in that stock. So it limits the risk and reward for you. And it's better for a long term trajectory, especially when we're looking at dividend investing or fundamental investing. No, when you're building your portfolio, there's a couple things you want to think about. How old are you? How much time do you actually have to manage this and look at these stocks each day? Do you need income from your investment. So are you at the point in your life where you're trying to generate an income from these investments? And what industries do you want to be in? Are there any that you don't want to be in on, then the taxes. So my portfolio this we're just going to use this as an example? I'm a younger guy on the 25 year old male. I want to put five hours per week into managing my stocks. I don't need the income. Right now. I'm probably working a second job and the company, the industries that I want to be in our technology, solar consumer package, goods and equipment. I think these industries are all going to see growth over the next few years as technology and renewable energies come online and people are spending more more money. So this is the portfolio that I want to try to develop as a sample, and as an example, here is what it could look like. Well, because I'm 25 I have plenty of time to develop a retirement and really plan for the long term. So I want to try and make some good capital gains early. I'm gonna go with stocks because it provides the highest return to meet up with the four industries that I want to go into. I'm gonna buy a couple of stocks in each of the industries, and I'm going to try and buy some stocks, at least some stocks that operate in other countries or operate globally so that I'm not completely focused on the United States. So when I look at technology, I'm gonna buy Apple, Amazon, Zoom and Shopify. All four companies operate completely globally around the world, and they're in different interest industries. So I think it works out really well for me. But they're all tech focused and fairly high growth with good management teams. I really like that. Next. I want to go with solar. I think solar is the foundation of the future. I think that's what most of our energy is gonna rely on. So I want to be well positioned here. I want to go with the solar manufacturer and first solar. I want to go for a solar generator in terra form power, and I want to go for a solar user in Tesla's automotive so that way I'm getting the full spectrum here. I'm not overweighted in just solar manufacturers. I have a solar company at all three ends of the consumption cycle. After that, I'm going to go to consumer packaged goods. I really like Nike. It's got a place in my heart, and it's a company that I really like. They have a good product and they have great branding. So I'm gonna own Nike. I want to get into beyond meat. I looked at their technical chart the other day. I did a video on it here. You should really check it out, but the technicals look phenomenal. The business model is great. They had a huge spike. It's finally jumped down to a realistic price, and I think I want to get into it. And I also want to be in Pepsi because I drink Pepsi every day and soon millions of people as well as all their other products. They're not going anywhere anytime soon. They pay a steady dividend. I'm really like the company After that. I want a little bit of exposure to the big machinery to the big equipment. I think the world economy is gonna grow over the next few years, and we're gonna need equipment in order to do that. So I want to own CAT and G E. Both of these companies pay fairly good dividends. They're great companies, and they're going to be around for a very long time. So I want to put these into my portfolio as long term growth companies that will give me a little bit of a dividend and should give me a return over the long term. My parents portfolio, though, is gonna look a little bit different. So again, this is another sample portfolio, somebody just at a different stage in their life. So this is a 60 year old couple couple. They only want to put in about one hour per month in tow, looking at their portfolio and managing this. They do want income because they're putting in a decent amount of money, so they want to be able to see some dividends or some bonds or some coupons or some interest coming out of this investment so they can go on a vacation at the end of the year , and they want to be insecure industries. They don't want to be in anything fancy or anything that's super volatile. They want to be in industries that have been around for a while that are establishing that a big players that are going to provide consistent growth for them into retirement. So their portfolio is gonna look very different. It might only have 40% stocks. It might have 60% bonds. Those bonds could be heavily made up of Treasury bonds, and they could have some corporate bonds as well. That's going to give them the most security and ah, lot of basically confidence knowing that their money is secured, they're going to make a little bit of money on it on the coupons that are associated with those bonds. And in 40 years that money is still going to be there for them to either pass on or for them to use. And the 40% stocks that they have are probably going to be focused into a dividend focused e T f. So the E T F. Because it has extremely low management fees and the dividend focus because that means that we're going into aged companies that are established that know exactly what they're doing, and they're going to give us a little bit of cash flow for us to live on, so this type of portfolio would work much better for my parents. But it wouldn't work for me at all. It just wouldn't give me any excitement. It really depends on where you are in your life. So in summary, what you really need to focus on here is figure out a strategy that aligns with your goals . Figure out D Are you looking to own stocks? You looking own bonds? Are you looking to generate income or you looking for capital gains on? Then establish a strategy and a portfolio that is diversified enough to give you a risk return ratio that is within your tolerance. That is the whole goal. Here. You can buy three companies that are extremely risky, or you can buy three companies that are extremely stable and your risk return. Tolerance will be completely different, even though you still only bought three companies. So you need to be very careful with which companies you buy the risks associated with them and how they fit into your portfolio as a whole to make sure that you are diversified enough to get a risk return ratio. That was within your comfort level. My name is Zak Hartley. And thanks for joining me. We're gonna be going into a couple more videos here soon, so please stay tuned.
49. Real Estate and REIT's: Okay, So in this video, we're gonna be talking about real estate and reach. Reach our financial tool that you can purchase, just like a stock that will give you exposure to the real estate market without actually having to own any property and go through with buying buildings. So let's go through it in depth. I'm gonna cover everything in this video now, real estate, Israel, simple real estate is just land and buildings. So when you purchase real estate, you're purchasing the rights to that land as well as any buildings that might be on top of it. Now, the advantages to real estate are that it's easy financing and you can get really good interest rates. Right now, it is the only way that you were gonna be it to go out and get a 305 106 $100,000 loan. The bank is gonna hand you that money, and you're gonna pay an extremely low interest rate on it. Now, if you were doing that to start a business or you were doing that for a new venture, you doing that for any other reason the bank would give you absolute hell to try and get that money. It would be very difficult process. But because you're buying real estate in your buying a house, they can secure it against that house, and therefore they could give you a large amount of money at a very reasonable interest rate. Now, the other advantage from investing in real estate is that everybody needs somewhere to lift . Everybody needs somewhere that they can lay down. They can rest their head and they can raise their family. So, ah, lot of people end up spending money on real estate, no matter what. Whether it's to rent a lease, we're actually buying the property. No matter what. In your life, you end up spending money on Mula State, so sometimes it's a good avenue to actually just purchase that asset. Now, once again, it is an asset. When you buy real estate, you're owning that asset. You increase your net worth, and you can use that asset later on. You can sell that asset later on, or you can refinance it now. The big thing here is you can use that equity in the future. So, for instance, if you get a loan for a $500,000 house. You pay $300,000 of it down. You can almost use that $300,000 as a line of equity on to your next down payment, your next house or whatever you'd like to use it for. So there are some big advantages to real estate and depend on your life stage. You may want to invest in real estate now. There are also some big disadvantages to real estate. The number one disadvantage for meat personally is the liquidity. Real estate is not liquid when you go out and buy a piece of property and a piece of a building on top of it, because in order to sell that, in other words, convert that into cash, you liquidity. You need to go onto the market. You need to hire an agent. Possibly you need toe list it you need to bring in viewers. It can take 123 months to sell a property, a piece of land and that's in a good case scenario can sometimes even take longer. Therefore, if you needed that money quickly or you have an emergency where you saw better investment, sometimes it could be very difficult to get that money out. Secondly, it's hard to diverse by if you're a younger person. So maybe like me and you're putting $40,000 into a home, you can't go out and buy a home by a small commercial property by a health care property. You can't diverse five your real estate portfolio as easily, so it can be a little bit difficult, especially if a tornado or a fire or a flood rips through a specific area of a city, a county wherever you could, be at significant risk of losing multiple assets or all of your single asset. So it's very difficult to, divers find. Spread your risk out in real estate because of that high up front cost and the fourth bullet in the side. But there's also ongoing expenses. If you own a property in a city or almost anywhere, you're gonna be paying property taxes on that. You're also gonna have to pay to maintain that when your heater goes out when your water tank explodes when your flood, when the flood comes into some weeks on your floor. When all of that crap happens, you have to pay to maintain and upkeep that property so that it's worth at least something later on. And it doesn't deteriorate over time. I mentioned this before, but there's a large upfront requirement, so challenges to real estate also some positive. But it goes both weights now. Should you invest in real estate, it really depends on your personal situation. There are some advantages to super low interest rates, and because of Cove it and everything that's happening in the global economy into a buyer's market, you can probably get some pretty good options. Some pretty good properties out there. However, there are other options to just going out and purchasing a massive investment piece of property a house. There are lots of different options that you can use, and one of them that on this show in this video is a real estate investment trust. So R E. I t. Stands for real estate investment trust and what it is is it is an entity that operates just like a company but focuses on real estate. It manages real estate by managing the building or the house or the mortgage or the loans. Whatever it is is in that real estate industry, and it makes money by the loan payments, the interest by selling the property and other basically small little ways that are focused 100% real estate. They're completely real estate company now. The nice thing about thes reads is that they are legally required to pay dividends. So unlike the stocks and the companies that we've been talking about, the pay dividends, it is up to them whether or not they gave the dividend. Those companies can choose at any point to cut that dividend to zero, and you're kind of left holding the bag, especially if that's why you bought the company with a REIT. It's completely different. They're completely obligated by law to pay out the majority of their earnings to shareholders, which means you're never gonna get a letter in the mail saying that we've completely cut the dividend and you no longer you're gonna get any cash flow. These return business to provide you cash flow as much as possible. They nice advantage here is that there could be bought and sold like a stock so they completely eliminate that issue of liquidity. They give you access to the real estate market and explosion to the real estate market, but they could be bought and sold just like a stock. You can day trade them if you wanted to get in and out of your positions within the exact same day. There is no requirements for you to hold him. There's no fees to get out of them except for your trading commission. Depending on where you trade, there's no requirements at all for you to hold or sell any of these assets, and therefore it is completely liquid, just like any stock that we're gonna buy on any of the other videos that I've talked about . Now it's really nice. And in order to find these they there's a couple different ways. Google's a really nice way. Yahoo Finance. Or, if you're looking on stock charge dot com, where I go, they end in dot you and so stands for dot unit reaches sold as units. They're not necessarily stocks. They're called the units, and so they end in dot u. N at the end of their tickers. So really simple now. The advantages of these is that they're very liquid and it's super easy. 02 divers by you can only reach in a variety of different things, such as houses, commercial properties, health care, buildings, almost anything, even even data center. So lots of different options there. There's also absolutely no meaning. So, like a house we have to up, keep it and pay your taxes and make sure that it's okay. There's nothing you have to do when you want to read. It sits in your portfolio of pays you cash, and it just sits there and does absolutely nothing. There's also low upfront cost most of these REITs or trading under $100 some of them under two or $300 so you can literally get in for a couple of shares at less than $1000 almost all of the time. And it's a completely different contrast compared to the 2040 $60,000 up front you would need for a down payment on real estate property. The other thing here is there's a huge tax advantage with the REITs in comparison to a regular company. Now I know that's probably question is, what's the difference between a real estate investment trust that operates just like a company managers property compared to an actual company that does something similar. Well, the differences in the tax is so the tax advantage for a REIT is huge, because when you're a corporation in your standard company, if you make $10 million in Canada and the US, you're probably gonna pay 15 to 20% of that net income in taxes to the government, meaning you have 80 to $85 million left over to pay to your short shareholders, put into retained journeys and invest back in the company. So you've just paid out a big chunk before. You can actually do anything for your investors because you've paid your taxes. Re operates completely different where they pay their Tak Bai paid their dividends and their investors before they pay their taxes. So far, we makes $100 million. They can pay $80 million back to their investors in their shareholders and then pay 15 or 20% tax on $20 million so they have a significant significant tax advantage. But they also have legal requirements in order to pay that money back to their shareholders . So there's definitely benefits and drawbacks. To a reader and a company, however, reach is much better for the shareholders because they're leaving legally obligated to pay that money to the shareholders as well as they have a huge tax advantage because they can pay that money before they pay taxes on the income. So huge advantage to read and definitely a great opportunity for investors looking for cash flow and exposure to the real estate market. Now, read reads. Come in variety of different types. You can get them and residential REITs that manage possibly home mortgages or apartment buildings, or on things of that nature. You can also find reads that focused strictly on commercial properties and retail properties. You'll also find office REITs and health care REITs. You can also find specialty REITs, and we're gonna look into that here in a second. Now I'm in Canada, but I know a lot of viewers in the United States going to show you two. They're pretty popular, but I just want to talk about the differences first. So in the United States they pay dividends, which means you pay taxes just like you would if you were receiving dividends. Now there's a preferential tax treatment on dividends in the United States, meaning you paying less taxes on your dividend income than you do on your regular income from a job. So the U. S incident it's you have an advantage to make your income coming from dividends in Canada they're referred to as disbursements, and those disbursements are tax based on how that income was generated. So if the Read made its money by selling that property, or if the read made its money by interest or if the remain its money on mortgages, that income is all gonna be taxed differently. And you have to know that for your taxes. So they're small differences on the personal side of your taxes when you bring in that income after it's been paid off from the company. The operating principles, though, are the exact same twin can in the United States. Just small differences in taxes and the way that they word it in the U. S. It's a dividend and candidates of dispersement so not a huge difference there, though just f y. I now popular REITs that you can look at this one's in Canada. Real can real estate investment trust. This is one that I'm looking at right now, and I have a little bit of money, and it is yielding 8.96% right now, so significantly higher than some of the companies that we were looking at. It is doing very well. It's actually most popular one in Canada by market cap, and it's been a good one for me over the last little while. It's paying pretty consistent, steady cash will. So I really like that. The next one is This one's really cool. This is one of had my eye on for a little while, and it's public storage REITs. So this is a read that focuses strictly on public storage. So when you need to store all the crap in your apartment because you moved to somewhere else, you can store it in a storage locker and these guys manage those storage lockers. And the cash flow from those storage lockers goes up through this company and then gets paid back to the shareholders that hold this basically unit that's treated just like a stock so thes air to reads that are super popular that have done really well. I'm really interested in the public storage when I've been looking at this recently. I currently own Rio can in Canada because of the dividend, so or because of the dispersement. So lots of great advantages to these REITs. And just in summary, you do not have to buy property to get exposure to the real estate market. There are plenty of other options out there. Reads being one of them, and so there's lots of different ways to do it. The thing here is that you need to find the solution that fits you best if you're gonna be paying $1500 a month in rent for a house because you have a family. But you could get a mortgage for $1500 a month as well. Go get the mortgage that makes more sense of and build an asset. You can build up your equity, and you can use that money later on. Now, if you are a guy like me, a young guy that can pay a couple $100 in months instead of $1500 on a mortgage, I can invest that money and make a higher return. Well, that's probably a better situation for me, and that's why I'm invested in So what? You need to do something about your situation. Figure out what makes most sense for you. If you have a family and kids and you want to raise him up in a nice picket fence backyard of the money to buy the house, it's probably the best situation. If you're a young guy that wants to travel and go explore the world, maybe it's not the right choice. So thinking about what's best for you, and if you get any value out of this, please remember to show some love, thank you so much and talk to you soon.
50. Short Selling : What's up, everybody? My name is Zak Hartley, and today we're going to talk about short selling. What is it and how do you use it? So, first of all, short selling is used to make money. When the stock goes down, just like when you buy a stock, you hope to buy it low and selling high. The idea here is you can make the exact same amount of money using the same principles by buying at high and selling it low. Now there are a couple of trade offs here. One of them is there is much higher risk, depending on how you set up to trade. What I mean by that is when you buy a stock and hope that it goes up, your maximum downside or your maximum loss is 100% of your investment. But when that trade goes the opposite way and you're trying to make money, when the stock goes down, your maximum upside becomes the amount of the stock. But your downside is infinite because that stock could go infinitely higher. What I mean by that is, if you buy the stock 100 hoping that it goes down that stock could go to 1000 or a $1,000,000 it could be substantially higher than your maximum loss had you have bought the stock. The last thing is, is you're gonna need a margin account, so that's a specific type of account where your banker, your brokerage, allows you to borrow money or the stocks from them. It's basically a special type of account that has a little bit more risk, a little bit more paperwork and allows you to use somebody else's money to make some of your trades. So it does have a couple of requirements in order for you to actually make your first short . So however, it does give you a great advantage, especially in a down economy, or when you concede e drastic changes in that stock price is about to plummet. This is the time that you would want to implement some of these short selling techniques, so I did mention this. But risk is the big thing. There is infinite risk here because instead of the stock going up from 100 to $1000 you making money, if that stock goes from 100 to $1000 you've instantly lost 10 times your initial investment . Drastic, drastic risk proportion here, and so you need to mitigate that by incorporating a stop loss into every trade you make. If you put a stop loss on to all of your short sells, it can help to mitigate some of that risk by getting you out of a trade in the event that you are wrong and limiting some of that infinite risk that I've been talking about. The other side of it is, it's a little bit more complicated. Do you really need to understand the bet and time the market properly debated to execute this appropriately and within your trading strategy? So how do you do it? Well, when you short sell, there's basically two kind of steps to it, and this is what's happening in theory. Now, when you go through and you execute on your trading platforms, it's really simple. It's all digital, and it's basically a couple of clicks, but this is what's happening behind the scenes. In theory, you're borrowing a stock from the bank and you're going to sell it for $100 in this example . So what I mean by that is Let's say we're talking about Apple and you think apple is gonna go down? You're going to go to your bank or you're going to go to your brokerage. You're going toe Borough One stock from that banker, the brokerage, the actual stock. You were going to borrow that stock and then you're going to go into the market and you were going to sell it for $100. So now you owe your banker your brokerage one stock and you have $100 in cash. That is where we sit right now. As soon as you've executed this trade. Now, Ah, couple weeks go by a time period goes by whatever it is, and you're ready to get out of this trade. Luckily, the price and the value of that apple share has dropped down to $80. What you were going to do now is you're going to take that $100 that you had. You were going to buy that stock back for $80 you were going to return that stock to your banker, the brokerage. Now, if you noticed here, you sold it initially for $100 you bought it back for 80. There is a difference there of $20 that is your profit. That is how you make money when you short sell a stock. The general concept is your borrowing from your bank or your brokerage. You're selling it into the market to get that cash, you're waiting for the price to full. You're buying that asset back that stock back and returning it to whoever you board it from and you're keeping that difference. That is what a short sell is. So a couple other things the same. It uses the same order process. So once you have your account set up, we've already gone through how to buy and sell your holdings. This is the exact same thing. You just go in and you sell Mawr Holdings and you make sure that you notify that it is a margin account and that you are going to be going into that margin when you sell X number of shares. Now, I highly recommend you always incorporate a stop loss. Any time you were going to sell or short, sell your shares because the risk is so high with these, you never know what's gonna happen it is riskier than a traditional by order, but it is a great strategy for making money when the economy goes down, when your stocks goes down or when your industry goes down. This is the strategy wanted you want to use to take advantage of those type of price swings . So, in summary, short selling involves Born the Sip doc from a banker brokerage, selling it into the market and then buying it back at a lower rate and returning that stock to your bank of your brokerage in keeping the difference. It has a higher risk, but as long as you can understand it, you can trade with a stop loss so you can manage your risk in some way. You should have absolutely no problem short selling as soon as you've set up your account. So get out there, look for opportunities and stay tuned for more videos. Thank you
51. Practice Accounts: What's up, everybody? My name is Zak Hartley, and today we're gonna be talking about practice accounts. Okay, so a practice account is super helpful because it can allow you to learn how to trade, test out new strategies and experiment in the markets without actually losing any money or putting your own money up at risk. A practice account basically gives you X amount of dollars 100,000 sometimes half a $1,000,000 and says, Here you go, go trade in the rial markets, make actual trades. But this is fake money. So little executed, the real prices you'll get in and out of the real prices. But is $500,000 of fake money that if you lose it, it doesn't matter. And if you make it back, unfortunately, you don't get to gains because it wasn't your money in the first place. So practising counter great for anybody that wants to try things out and actually just test the markets before they start going, or if you have a new strategy that you want to apply to it, basically practice count to see the works or just to test it out and put together a trade so you can feel more confident making your first rate. So we're going to step into my computer right now, and I will show you exactly how to set this up. Okay, so I use RBC just because that's the platform that actually trade with. That's the bank that I actually used. However, if you go to question dot com, I will link this below, but you can set up a practice account with them. It's a very similar software and the same metrics as stock charts. However, they will give you $500,000 Canadian and $500,000 US. So you've got a ton of money. You only get 90 days with these guys, but it's absolutely free. You can also use their platform and then get used to it if you decide to use it in the future when you actually trade your money. But you can get up to a $1,000,000 completely off, practice money completely free and try out the software completely free from to 90 days to see if this is actually something you want to do. But for me, I use RBC. So this is one of my accounts right now. As you see, I've got Air candidate here. This is one of the stocks that I've talked about in my last couple of videos. We sold out our entire initial position, so we're actually negative $15 on the book cost and the position is worth $4600. So this number looks weird. It's plus 31,000%. But it's because we took out our initial position and I just left the profits in there underneath. We've got apple under here. I got a call on Apple and where I shop 197% right now. So absolutely amazing. And then if you watched my video last week, I own Shopify where I bought options. So this is a margin account. It's specifically for me to buy my options. Now, if you want to open a practice account, all you do is you go to my portfolio and there will be some version of this in every bank there. They're usually pretty similar, but you just click on open a practice account and then you go through some of the steps. So if you wanted to be an investment account, if you wanted to be an investment couch account or in RSP. So ah, margin account basically means you can make calls and you can short on different positions so you can actually borrow the bank's money. So that's where I used for my options. If you just plan on selling and buying stock, then you could just use the cash counts. So that's what we'll do for this. And RSP is more of a savings account. You won't really. It won't apply to anything you're doing, especially if you're in the US. So captured count is what we're gonna do to just buy and sell stocks and get started out in the markets. Practice building portfolios, so learn more about practice counts. Please click here or begin using your practice counts is what we're gonna do on. As you can see, we have $100,000 Canadian and $73,000 American, so they're basically giving me $100,000 Canadian and I can use it on either market. That's what they're saying here and then we can go out and we can basically buy any stock we want. So if we just look up, what do we want to dio Air Canada I just bought Let's look at Shopify again. So Shopify Inc. I could buy it on the Canadian or the U. S. Markets tons of different options here, and you just go through and execute it like you regularly what? And then it comes up in your portfolio and it shows up just like any of the other accounts would. So here's the margin account. This is what it looks like when you buy and sell shares. And this is what this might be. The new one note. So this is what it looks like when you just buy and sell the shares without the margin. So I'm literally just holding the shares in here right now. That's all I'm doing, and it's all on the practice counts. So lots of different options. These practice accounts are great if you are just looking to try and get into the market. If you want to test a new strategy. If you're new to trading, you want to see if you would actually make money testing out the new strategies that you learned so lots of different uses for it. It's also great at exemplifying the different ideas that we're talking about. It's one of the reasons I use it here. So lots of different options and tons of great use of a practice can I highly recommend it for anybody that's interesting getting into training, trading or learning how to trade or testing out new strategies, especially for any beginners. So you got any value out of this? Please remember two shows in love, thank you very much and stay tuned for the next video.
52. Starting Your Portfolio: What's up, everybody? My name is Zak Hartley, and in this video we're going to start talking about how to build your portfolio and by your very first stock. So let's get right into it. Building your portfolio. In this video, we're gonna focus on a long term portfolio, one that is basically meant to start you out, build overtime, pay for your retirement, pay for a little bit of income throughout the way, and basically be that giant cash saved that you need to in case anything ever goes wrong. So building your long term portfolio, that's what we're talking about today. The goal here is steady growth through dividends or capital gains over 2030 40 years. We're looking for A to generate a diversified holdings, meaning we want to build a portfolio that, as companies in it from different industries, so that if one industry has negatively impacted, it doesn't affect our entire portfolio. We're also looking for lower risk cos we don't need to be investing in any biotech companies or crazy startups that are going to save the world because we're looking for long term. We're looking for consistent, steady growth year over year and so we wanted basically be investing in medium toe Teoh large companies that are gonna be here over the long term. And the last point here is we have a long term horizon. We're looking to basically start this portfolio in our twenties, thirties or forties and use it in retirement to basically pay for a living. That's the goal here. So we've got a long term horizon on this. We're looking for low risk companies, diversified holdings, and we're trying to get steady growth through capital gains or dividends. So making your first bite now, this is a really interesting topic, and it's something that's really unique because it's something you're always gonna remember now. As weird as it sounds, you always gonna remember who you lost your virginity to. You're always gonna remember which stock he bought first. Now mine. I remember this like it's clear as day. I remember sitting at my computer and just itching to try and make a trade. I'm strong through the news, and I saw that Twitter had their investor day. So I logged on. I went in and I sat through basically two hours of Twitter's investor day. I watched some presentations. I listened to some calls. I basically sat there and said, Wow, this sounded all pretty good Twitter sounds like it's going on the right path and I bought the shares. I bought probably six or seven shares at $44 I still remember that prices bottom right at $44 and that stock dropped all the way down to, like, 18 $19 within, like, six or seven months like it was absolutely terrible. It was one of the worst buys I've ever made. I lost most my money on it, almost almost within the first couple of months, and the goal here was to buy one that I was gonna hold the whole time. So needless to say, I ended up selling Twitter. It was a terrible investment. I did absolutely horrible on it, but it's stuck with me because I always remembered. I wish I had bought Apple. I wish I had bought Apple with seven years ago, when instead I bought Twitter. If I had bought Apple, I would have done phenomenally well. So the reason I'm making this video is to say, Do not make my mistake. I got in. I didn't do any research. I sat through some stupid presentation that I thought, Oh, wow, this company sounds good. And I made a trade because I wanted to make a trade, not because it was the right investment. So I'm coming to you and saying Do not make that mistake by a stock that meet this criteria basically by a stock that you would be proud to pass on to your kids. So buy something that you know is gonna be here for a while and that you were proud to hold If it's apple. If it's Disney you grew up with Disney shows your kids are probably gonna grow up with Disney shows that that would be a great company on the stock to buy that you can pass on to your kids Anything with Apple. Same thing with maybe Ford Motor Company. If you're a truck guy, whatever it is, find a company that you like that you believe in, and that you're proud to own their stock and plan to hold it for the rest of your life and be proud to pass that stock onto your kid and say, This is the company that I made the decision on when I was 20 years old, I bought it. It's still important, and now I want you to have that. I think that's a pretty cool thing. Eso by the stock that you'd like to pass on. Secondly, by a stock that will still be around in 50 to 100 years. I talk about Warren Buffett a lot. His whole mentality is I buy a stock. That's a company that's still gonna be here in 100 years. And I think you should take the same mentality by a company that isn't with the trend. Isn't a fad isn't gonna fade out in a couple of years. Do not buy a fashion company. Do not buy clothing company by a company that has some heart to it and some integrity, and that's gonna be around for a little while. Johnson and Johnson. Three. M There's so many great companies out there, but find a great one and hold onto it. And last one don't sell it. Buy one share and say this is the first share that I ever bought. I'm gonna hold on to it for my life and hold on to it because you're always going to remember that it's gonna be a really cool moment when he passed this on to your kids and you say, Kit, I bought this share in 2020 back when I was your age when I was a young guy, and it's still worth it today. So I just think that's a really cool thing Teoh have. And I wish that I had that when I bought Twitter, but it didn't, so I'm trying to pass it on to you. So that's what you should look at in your first stock. Now, once you bought your first stock and you're going to build a portfolio around that stock, here's what you should be thinking about Number one. Choose your industries. You want to choose industries that aren't completely connected to each other and hopefully a couple industries so that you have some diversification. Once you've chosen your industry compared, the company's within that industry. Try and find the absolute best company and then maybe find two or three competitors to it. Once you've identified the company's within that industry that you're interested in, start doing your analysis, your technical in your fundamental analysis to decide on which company. You actually want to buy which company want to hold on which company want in your portfolio ? You choose that, and you figure that out by going top down here. That's the industry. Here's the companies that I can choose from. Here's a financial ratios. Here's their technical analysis here, the companies that I actually want to get into, and this is the one that's the best based on my analysis in my research. And then, once you've identified that company, wait for the buying opportunity. Wait for the next dip. Wait for the next technical analysis buying indicator. Wait for the next opportunity where you have a good opportunity to buy that stock at a fair and reasonable price where it will go up over the long term. And lastly, you need to monitor that stock. You need to monitor the stock very closely as soon as you buy it, and less so over time. If you are wrong right away, you might want to get out of that stock right away, or if that price goes down right away, you may also want to buy more of it because it is now on sale. So you really need to think through that question in your head again. Off Once I buy a stock, if the price goes down, was I wrong, or is the price on sale? You need to have that figured out in your head before you make that trade so that you have a plan. If that price goes down, you're going to buy Mawr or you are wrong and you're gonna get out of that trade. You need to make that decision before you actually invest into the company. And if you're playing for a long term return trying to build a diversified portfolio and you see value at the company at a certain price and the price drops, you should almost always be buying more. Unless there is a fundamental change in the business model or the structure around what's happening, you need to be thinking about it as in. This is a good company at this price. Now it's at a lower price, and nothing has changed. I should probably buy more of it. That's how you want to think about these different traits. Unless you were just completely wrong, you need to decide that in your head. So this is what you look at when you're building your portfolio, you've got your first stock. Then you're gonna go through these steps, so choose your industry, compared the company's select your company's wait for the buying opportunity and then monitor that stock extremely closely once you bought it and left. So over time, once you're more comfortable with how it is performing within your portfolio, All right, So I'm gonna go through these exact steps that I just outlined to you now. So choose the industry from me. I'm gonna choose technology. It's an industry that I know very well that I'm very comfortable with that I understand what's going on in that like the dynamics. So I'm going to start with technology. The companies that I'm gonna look at when building my portfolio and choosing the technology industry are apple, Amazon, Google and Microsoft, those of four major companies. They're all what I would consider some of the best in their industry, and they all have amazing potential. Over the long term, I'm going to choose one or two of these four companies to cover the technology industry with in my portfolio now selecting the company's I'm going to compare these four companies , I'm going to compare their profitability ratios, their liquidity ratios and how well they're performing in general. Based on the financial situation, I'm also going to compare their technical analysis charts to figure out which ones I like the best. Now, once I've done that analysis and I've said Okay, Apple and Google of the best ratios, their charts look pretty easy to understand as well. I'm going to choose those two companies. I now want to have Apple and Google inside of my portfolio. Under the technology industry, I'm not going to invest in Microsoft or Amazon. I'm just going to choose Apple and Google for my portfolio because I don't want overweight my portfolio in all technology stocks. I just want to have to technology and maybe a couple other industries with two stocks in them. Each depends on how you want to set up your portfolio and how much diversification you want . Ah, general rule of thumb, though, is that diversification will not do anything for you over and above 20 to 25 stocks in different industries. If you have a portfolio that has 20 to 25 stocks in fairly spread out industries. Diversification will not do a whole lot more for you. It's basically one of those things of diminishing returns. The more work you do, the less you get out of it. So instead of owning three companies on the same industry, if you could only three companies in different industries, that would be the greatest advantage. And then the more and more you add to that, the return gets lower and lower. So I just wanted to add that in there. So you selected companies Apple and Google, those the companies I want to get into. And then I'm going to go into the technical analysis because it will give me short term buy and sell opportunities. So I'm gonna go to stock charts dot com trading view whatever platform you want to use to trade your stocks, and I'm going to consistently monitor Apple and Google. I'm going to either wait for a dip or wait for the technical indicators to show me by signals based on price action movement. I'm gonna specifically focus on price as well as the technical indicators on Apple and Google to identify the best buying opportunity over the next several days, weeks or months. I could wait months to get into Apple or Google, especially if it's over overbought right now. I could wait months to get back into that dip or there could be a great opportunity coming up right away. So once I've identified Apple and Google, I wanna wait that out. I want consistently monitor those stocks and look for that buying opportunity. And then I want to make that by and the last step is to martyr those stocks toe, follow them and say, Is that price going down since I've bought them? And am I wrong or do I want to buy more? And if that price is going up, you need to sit back and enjoy your trade because you just executed your plan perfectly. You went through the entire strategy and you're starting to build your diversified portfolio. So congratulations. Now, if you guys have any more questions about what we're doing, send me an email. But in summary, building a portfolio takes time. You need to understand that this is not suddenly like you wake up. You make 20 trades on the same day, and now you have a diversified portfolio that is the worst way to do it. You never want to do it that way. You want to buy one share at a time with full analysis and knowing that you were building a portfolio, that's gonna be there over time. That's gonna be there in the long term that you found good entry points on every single stock that you've got into. And when that price went down, you bought more toe average. You're buying price lower. That's the key here, but it's going to take time. It's not gonna happen overnight. You're not going to suddenly just wake up with a diversified portfolio and you're not going to get it by just making 20 trades in the date you need to put in the time put in the effort. Do the research on build a proper portfolio that works for you. And secondly, you need to be patient. Like I said, you cannot sit down at your computer and just build yourself a diversified portfolio in a day. This takes time. This takes patients, and this takes you waiting to identify the opportunities and the reason I'm saying that is because you can make money by doing nothing and holding your cash if you go to buy into that stock, and that price is gonna fall anyways, whether or not you buy it. If you can hold on to your cash and you can get into it by at a lower price just by waiting , you're much better off doing that than sitting there twiddling your thumbs and pressuring yourself to make your trade. You could save yourself money by not making that trade. So you need to really understand that and be very careful with your exit and entry points, especially when you're basically trading like this. Last thing is, remember your time, friend. You're looking to trade over 10 2030 40 years with this portfolio. You're trying to build a portfolio that's gonna last you into retirement. Remember, there's no rush. You don't need to get into apple today. You don't need to get into these stocks tomorrow. You've got time, but you need Teoh. You need to put in the work. You need to do the research. You need to really understand what's happening here and you need to put in the effort. So you guys have any questions? Please send me an email. Remember to like this video writer of you Or write a comment below, Whatever it is, please help me out. I sincerely appreciate it. And if you get anything out of this video, please show some sports. Thank you.
53. Managing a portfolio : What's up, everybody? My name is Zak Hartley, and today we're gonna talk about managing and balancing your portfolio. So when we do this, we're gonna look at four different factors. The 1st 1 is balanced. What I mean by that is, if you are invested in, let's say four different industries. You want to make sure that you are equally balanced between those four industries. You want all of them to hold roughly 25% of your portfolio. And if one of them ever gets too high or too low, you want to be a to re balance your portfolio to bring it back to roughly 25%. Secondly, is diversity if you're gonna invest in four different industries? Let's say, as an example, you want to make sure that those industries are very different industries and that they're not correlated. You do not want to invest in oil and gas and airlines because those air fairly correlated industries. You want to invest in oil and gas and then maybe consumer packaged goods. You want to be diversified and split it so that if you are susceptible toe one risk, that risk is not going to contain more risks that will spread to the rest of Europe. Rifle portfolio. The third factor here is risk. You need to know what risks you are susceptible to. If you hold stocks in a certain industry, what risks that industry susceptible to, and what impact could that have on your portfolio if those risks come to fruition? Last thing is trends. What is happening in the global economy, your country's economy and the business world that could impact your stocks. And how can you get ahead of those trends? So brief rule of thumb. We're going to focus on a portfolio that has primarily stocks and is trying to build a diversified stock portfolio. This rule of thumb will work for both dividends and capital gains type of portfolios. But the idea here is this is kind of the minimum that you would need to take advantage of diversification. And so the way that you would do it is by choosing 3 to 5 different industries industries that are not connected to each other and are not correlated with each other. You choose 3 to 5 of them and then invest in 2 to 5 companies in each of those industries. The idea here is that by investing in multiple industries and multiple companies, you have the best chance of getting steady capital gains or dividend gains without the risk of one detrimental impact taking down your entire portfolio. The last thing you want to think about is do these companies operate in different places? You do not want to invest in a couple of companies in the same industry that operate in the exact same location. If you're going to invest in two technology companies, you want to make sure they're at least different products and hopefully operate in different geographic locations. So when we look at this, how do you keep track of it? How do you manage it? Well, it's really simple. The way I would recommend it is using a simple Excel spreadsheet that is the best way to do it, because you could manipulate it. You can build it yourself, and you can use it and edit it yourself. There are lots of Softwares out there that you can pay for, but I recommend an Excel spreadsheet, and I will give you access to mine if you check all my patri on website in the link below or in the description to this course. So anyways, let's get into my spreadsheet hearing and show you exactly what I use. Okay, so this is the spreadsheet that I used to basically manage my portfolio. Now this is a really simple way of looking at it. It's not super complicated. It's really easy to manage, and I tried to build it so that everything was on one sheet. It was really easy to see, to understand and to read. So if we go across the chop here, we can just see the different categories. So the industry I'm currently investing in four different industries technology, renewables, industrials and health care was the four industries that I'm going to focus on. And I'm going to invest in four companies in each of those industries and technology. I'm invested in Facebook, Shopify, apple and Amazon. I own X number of these shares based on the quantity here, and this was the purchase price that I actually bought. The share at this was the price that I got in that, and this was the last quoted price. So this is the only line that I am going in and updating is the last quoted price. Every time I come and sit down at my computer and I say, OK, I'm going to evaluate and balance my portfolio. I come in and I just update the last price for each stock. It takes about a minute. It's really easy to do After that. I've got the book value, which is just the number of shares. Times Theory Journal Purchase price. Any times you see book value, that basically means your original purchase price. When you see market value, that means the current price today. So you have your book price, which is what you paid for it, and you have your market price, which is what it is worth today. That difference is your gain or loss on the stock. So if we look at Facebook, I bought it to 49. It's currently a to 63. I bought 19 shares of it for a value of 4700. The market value today is just under $5000 so I made a gain of 262%. Now here's the great thing about this spreadsheet is it shows me the weight of that holding in my portfolio. So at the bottom here, you can see my market value all added up. I have a $97,000 portfolio right now, and the weight of my Facebook shares in that portfolio is 5%. Now, this is great, because all I had to do is update the last price and automatically spits out the weight of this specific holding in my portfolio. And it does that for all of my holdings here. So as you can see, all of my holdings air somewhere within 5 to 8%. So I've got 16 different shares here, and they're all within 5 to 8% as soon as they get out of that 58% range. It means that I neither need Teoh completely get out of that stock. It means that I need to either by Mawr or I need to sell some of it to re balance and get within that 5 to 8%. That's the goldmine for me, especially when unfolding exactly 16 stocks. So this is what I'm looking for in here. 5 to 8% of my weight. And then on the end here, you can see I've basically categorized emerged this cell here and I've added up the weights on the per share basis. So Apple owns 5%. Shopify owns 7% of my portfolio. Added all of that up on the side here so I can see what weight the entire industry of technology has in my portfolio. So now I know I have four positions that hold 575 and 8% and I know that that industry holds 24% of the weight of my portfolio. I can also see that renewables at the same that industrials air 23 and that health care is currently 29% of my portfolio. So this spreadsheet is really great because all I have to do is update one number. It automatically spits out what my Danes are for that stock as well as what that stocks wait is in my portfolio and what that industries weight is in my portfolio so that I could make sure I'm balanced by my industry. I can make sure that I'm diversified by looking at these companies and making sure they're operating in different regions. I know what my risk is when I get into these companies and I can use this spreadsheet to basically manage and balance it as I move forward. So, for instance, as an example, if Amazon Inc suddenly shoots up and their last price goes to $3500 Amazon becomes a major holding within my portfolio. It is now at 10% and you can see the industry weight has gone from 24 to 26%. Amazon is now above my 8% 8% threshold, and I need to sell some of those shares to bring it back down to that 5 to 8%. The reason I want to do that is because if something bad happens to Amazon, I don't want it to have a significant impact on my portfolio. I want to keep a balanced, equally weighted portfolio, and therefore I'm going to sell some of my Amazon stock and invested elsewhere. I'm going to take that profit, and I'm going to put it into a different stock and raised the entire level of my portfolios that I can maintain consistent gains overall. So this is what I am using. If you guys were interested in getting this exact spreadsheet or seeing my life stock market portfolio. You can follow me on patri on and can subscribe there to get this exact spreadsheet as well as my life portfolio. But in summary, the idea here is you want to keep a balanced portfolio. You want it to be almost equally weighted. You want to keep track of it in the spreadsheet, and you want to make sure you're managing your risk and you know exactly what you hold and what percentage of your portfolio each of those holdings our thanks and stay tuned for the next video.
54. How to handle down days: What's going on, everybody? My name is Zak Hartley, and today we're gonna talk about how to manage and trade your portfolio when the market is down on the day. Okay, so today was a bad day. Jump into my screen here, and I'm gonna show you the charts. So this is the NASDAQ. As you can see, we lost 506 100 points. The Dow Jones industrial dropped pretty significantly as well. The world market is doing okay, This is the world minus the U. S. And the S and P 500 had a bad day as well. So you could pretty much chalk this up and say this was a bad day for the U. S. Market as a whole, which is where I I most of most of the traders have most of their exposure. So what we need to talk about is, how do you manage a day like this? Well, there's two things you need to do. Number one is take a look at your portfolio and say, Are there any stocks that I need to get out of? When you have a down day like this? It could be the start of a new trend, the sign of a reversal or the start of a new pattern. So what you want to do is look at your stocks and saying which ones are most susceptible to this down day. Now, the big key here is what caused this down date. Was it caused by Kobe? It was it caused by an interest rate, whether caused by some other factor going on in the market. For instance, if it was cove it and you owned airlines, you may want to consider getting out of your airline stocks. If it was an interest rate, you may want to consider getting out of your bank stocks. Different factors like that can influence what stocks you should be looking at. But what you should do is say, OK, here's my portfolio here. The 123 stocks that I'm concerned about and then you should dive into the charts and say, Do I need to exit these positions? Do I need to get out? So I need to take a loss, so I need to lock in my profits. Is it time to leave these stocks? So that's the first thing you need to do and then the second thing you need to do is say, Hey, OK, we've got a dip here. We've got some weakness in the market that the day was bad. Is there any stocks that I should be looking at as a buying opportunity? Are there any good stocks that I want to buy the dips, Some phenomenal companies that I believe in, that maybe there's some weakness in the price and to create opportunity to buy, or are there just some other companies that are showing some exceptional value and now it's time to pretty to get in. So I'm gonna show you an example of this and what it looks like in my portfolio, and we're gonna go through it right now. So this is what the markets look like. We just went through that. Let's go to my holdings. And as you can see, I own about seven shares right now. So Facebook, Good food and Google. I also own Apple, Amazon, Microsoft and Tesla's, so we're doing pretty good on all of them. Apple is by far doing the best and the two that I'm concerned about a good food and Tesla's . So let's dive into that in the charts and see what they look like. So there's the S and P. Let's start with Teslik because it's easy to find. So this is Tesla here was set an all time high in the middle of February, and we now broke through that at the beginning of June, were coming basically back down. And we're probably gonna test this high this support level right here. And so this stock is okay yet it hasn't even tested it yet. It hasn't even broke through it yet. But if it does and it hits that kind of 908 80 mark, that's probably where I'm gonna say, OK, this was a bad trade, and maybe I actually want a short test that maybe I want to get on the other side of this because I was probably wrong, so that could definitely happen. However, Tessa just also announced that they're having a battery day on September 15th. I'm super excited about that. I think it's gonna be a big day and could hold some enormous, enormous potential for the company in the future. So I like what I like Tessa in the long term. Now the other company I was looking at was good food. There's another company like in the long term. And as you can see here, they basically do a sport line here around this for 20 mark. And it has bounced off this support line 123 almost four times. And it looks like it's probably gonna bounce off of it again, or at least tested again. So it hasn't broke through it yet. If it breaks down to this kind of 3 75 mark, that's what. I'm gonna be a seller and say, OK, take my losses. The wrong trade got in at the wrong time. I still like the company. They're posting some phenomenal financials, but that's what I would consider getting out of it. As of right now, I'm gonna hold it. So where that leaves me? Well, we just had a down day on the market. We lost couple percent on all of the indexes and most of my portfolio. However, none of my concern stocks of the stocks that I'm worried about have broken through any major levels of support. Yes, so I'm gonna keep holding them now. The second step to this and what do you want to do any of bad days. Say, are there any companies that I want to buy there any companies that I want to get into? Are there any companies that I really like? Well, one of the companies that I really like is square. So I've been looking at this company for a while, and if you look, they dropped all the way down to 35 $37 on a couple different days, and now they're trading at over $100. So I really like this company. I think that was some phenomenal upside. They have a great technology, a good platform and what they're doing in the strategy they're going. I really like it. I really appreciate it. And I think they're doing a good job. So this is a company that I might want to get into a zoom in here and to see what it looks like a little bit shorter timeframe. And as you can see here, it's being almost pretty stayed 35 up to $100. If this comes down to that $85 mark, I'm probably gonna buy it again, because I do expect to see some support here. This blue line might be a little bit high, but I expect some support around 85. So I actually Hope Square comes back down 85 so I could buy it. I think it's a good level there, and I think it's a phenomenal company with some amazing upside. So, in summary, the big thing to consider is when you see and you sit down at your desk and you see that all the markets are down a couple of percent and your performance taking a hit, what you really want to consider is, Is there anything that I want to get out of? Is there anything in my portfolio that I need to sell or exit my position or shrink my position? Possibly. And then the second thing you want to do is is there any opportunities get into a stock that I maybe thought was overpriced before? Is there any weakness in some stock prices that I really want to get into is they're great company, a long term company that I combine now for a couple of percent cheaper than it could before or for a higher yield on a dividend, so multiple different things to consider. But those are the different factors you should look at when you're saying okay. I just sat down on my computer. I'm down to 3% on everything the market is dating. Taking a beating. Where do I want to be? One of my seeing. And then the big thing is trying to figure out why the market has taken that beating. Because that will help direct your investment principles moving forward anyway. So more to come. Stay tuned. Talk to you soon.
55. FOMO: Are you guys welcome to another video? In this one we're gonna talk about FOMO or fear of missing out. Now whether you'd become a day trader is swing trader or a long-term investor. This is definitely something you are going to need to deal with because it is going to come up and it's going to hit you like a ton of bricks. So here's what you need to know. Are you guys so FOMO can happen in a variety of different ways. Number one is you make too many traits. So let's say you've got to watch those with a ton of great opportunities on there and you decided to trade all of those opportunities so that you don't miss out on any of the opportunities. Well, that is called overtraining and that is not a good strategy. Secondly, is making bad traits. Let's say you're hyper-focused on one company because all of its competitors have just started to run and you don't want to miss out when that company starts to run. Well, that can lead to a very, very bad trade and that is caused by FOMO. And lastly, when you don't make any trades and you start to miss out on traits because then they're running. That is also a phone when it feels terrible, I know exactly how you feel. This is how it affects our traits. Number one, it throws off your mental stability. It is not good for you mentally. It makes you question how good you are and makes you question your confidence, and it definitely brings you down a notch. Secondly, you change your game plan as soon as you left FOMO step in, you go away from you strategy, you go away from your planning. You go with your emotions and you go, oh my god, I don't want to miss out on this one and you make a bad decision and we'll actually, you lose money. And so your ability to control your phone will, will have a significant impact on your mental stability, on the execution of your strategy, as well as your final profit and loss at the end of the day. Okay, so what is the answer to FOMO? Well, here is what I tell myself every single time one of those emotions enters my brain while I'm trading, this is what I say. Realised that you've already missed out and you are going to keep missing it. So any opportunity that you're looking at right now and you say, geez, I shouldn't trade on the practice accounts. I really want to just get into this doc and I'm worried about missing out on it. You need to get over that. You need to start on the practice account, you need to start slow, you need to start easy because you're always going to miss out on opportunities. Now let me just show you what I mean by that. Okay, so this is the Apple stock chart from 1991 all the way up to 2020. You can see today it's trading at a $116 and the price back in 1991 after you adjust for stock splits was around $0.15. So it's really, really amazing the stock has gone from $0.15 to over a $116, just in a matter of 40 years and you've already missed out on it. Now, let's say you're looking for something a little bit more short-term. I totally understand. So you can see at the beginning of August here, the stock was trading at around $2.75. The next day the stock actually hit a high of over $13. So just in the period of one day, this stock actually moved by over 600% and now it's all the way back down to $3.12. And the last chart here is the apple options chart. Now what I want to show you is that these options are moving by two or 300% every single day. So you can see they opened around a dollar and they went all the way as high as $3 here. So absolutely amazing moves. And what I'm trying to show you here is that if you're worried about a five or ten or 20% move that you are going to miss out on and you need to let that go. You need to get rid of it because there's so much more opportunity out there. And if you are looking for volatility or big moves, there are a ton of different ways to get that without feeling like you're missing out on. So how to deal with FOMO? You need to tell yourself that you miss the opportunity. You are going to continue to miss the opportunities. However, there's so many opportunities out there for you to capitalize on. You need to let it go and you needed to find another opportunity. You need to understand that you are going to miss some of these. You need to get over it. It needs to go right past you and you need to say, okay, I'm back into search mode, I'm back into execution mode. I am over this FOMO that is coming over my body. I need to get rid of it and I need to acknowledge that mistake. And if I can, I need to refine my strategy and get better at my specific strategy and make sure I stick to that strategy so that phone will doesn't creep back in. Now, in summary, everybody is going to experience FOMO or whether you're a short-term trader or a long-term trait, or it is going to happen as soon as you watch a stock and you miss that big gap up or you miss that Big Dan, you don't get in and keeps running, you're gonna feel absolutely terrible it happened to me this week. I know exactly how it feels, but you need to get past it. You need to let it go. You need to find the next opportunity. You need to refine and adjust your strategy as much as you possibly can to make sure that it doesn't happen again. And if you do that, that is all you can do. You cannot let these emotions tear you apart or weigh you down for the day. All it's gonna do is messy ups in the long run. And so what you need to focus on is letting it go and funding the next opportunity. That is how you deal with FOMO.
56. What is an IPO?: What's going on,
you guys? My name is Zach Harley,
and in this video, we are going to talk about
everything you need to know to understand an initial
public offering, why they happen, why companies
do them and how they work? And at the end of the video, we are also going to
dive into one that just happened a couple of
days ago. So stay tuned. Oh, so IPO stands for
initial public offering, and the big thing we're
talking about here is the difference between
private and public companies. So on public companies are ones that you can
actually buy shares in, the ones that we're talking
about, mostly in this course, and the ones that you
can go in and find information about them
as just a public person, compared to a private company that doesn't have to
report as financials, that doesn't have to
do anything like that. So the big difference, the big differences here between private and
public is size. You're obviously going to be a private company if
you're much, much smaller, and some of the larger companies choose to go public so
they can raise money. Now, when you're
a public company, your reporting requirements
are very, very different. You have to report to all
of your shareholders and the government or the basically governing agency,
all of your financials, all of your changes
of directors, every transaction that
you make in that company has to be reported and
fully transparent, whereas with a private company, the only thing you have to worry about is paying your taxes. The third thing is liquidity. When you are a public company and you can trade your shares, you can buy and sell shares, you have lots of
liquidity there. You can get in or
out of the market. You can turn your shares
into cash really easily. But if you're the owner of a
private company and you own 50% stake in Joe's
tire change, well, it's really difficult
for you to sell 10% of those shares or
5% of those shares, build up in that position
because you have to negotiate basically an equity transaction with
the other partners. So very difficult thing to
do in a private company. And the big difference
here is growth. So companies go public to
help them grow so that they can get more money to invest into their company,
to grow the company. So those are the big differences here between private and public. Now, why do companies IPO, well, for kind of
the same reasons. One to raise money. So
if they have run out of friends and family
and local investors that are willing to
write them checks, Well, if they IPO,
they can raise a ton of money from
everybody around the world, and it's much easier. The other thing is liquidity. If you have a couple
of investors that have been in your business
for five, six years, and they haven't been
able to get any money out because of liquidity issues, well, you can IPO and those people can finally get
a return on their money. And then third is scaling up. It's a great way to raise money to get the right people
on your team and to build a reputation to help your company grow
over the long term. You can bring in money, you
can bring in financing, you can bring in
publicity and awareness about your company
through an IPO, and it can really
help you expand. So a couple of big
advantages to being an IPO, but you also have much, much heavier reporting and financial requirements
that come with it. So this is what the Beyond
Meat IPO looked like. They IPOed on the NASDAQ. It's basically a digital button, but basically Beyond Meat said, Okay, we've got a product here. It's doing really well.
It's time to raise some money and scale this up and really try and take over. And so that's what
they did. They ran an initial public
offering on the market, and they raised millions and millions of dollars,
hundreds of millions. So they did really, really well, and it was one of the most
successful IPOs in history. So this one happened about
a year ago, and today, we're going to look at a company similar to this later on. So definitely stay
tuned for that. Now, what happens during an IPO? There's a couple of
different steps here. The first thing is
the company and the shareholders and the
management team say, Okay, we need to raise some money, we're going to go
through an IPO, and we're going to try
and scale this up. So they hire an investment bank. That's step one. And what
that investment bank does is it helps the company
prepare for the IPO, by preparing what I mean is putting together all their
financial statements, putting together a good
investor presentation, putting together a good story, and then going out
there and basically preselling those shares to
investors in the network, in the banks network, in
the investing network, and the community, and to
institutional investors. So maybe where your parents put their retirement money or
an RRSP, or a pension plan. All of those groups and
pools of money could be buying different types of IPOs and investing
into the market. So the investment bank will
basically put that package together and then go and sell those shares for the company. Once that happens and they have enough people that are
willing to buy those shares, they say, Okay, going
to close the IPO. We've raised that
amount of money. Now we're going to
head in exchange, and we are going
to start trading. So the company goes out. They say, we're going to
issue 1 million shares at $10 a share. They raised
$10,000,000 basically from these different people
through the investment bank. They say, Okay, this is closed. Now the next day, usually the next day or
the next business day, they will go to the market. They will ring
that opening bell, just like the photo
that you saw there. And those shares will now be exchanged and traded
on that local market, either the NASDAQ, the
New York Stock Exchange, the Toronto Stock Exchange. And the company will
have traded 20 20% of their equity or 10,000 shares in return for 123 $4 million. And so that's how a company raises multiple
millions of dollars. It's through getting an
investment bank to help them out, going through the IPO process, raising that money, and then
launching it on in exchange. Nice thing about that
is if you IPO at $0.25, and then a three months later, your shares are
now trading at $1, you can sell another 1015 20% of your company at
that new price level. So it really helps you establish valuations
for your company, and it lets the market dictate what it's willing to pay
for them afterwards. So great opportunity for companies, but what
happens after? Well, the company uses
that money to grows. So in beyond Meat's case, I think they bought a couple
of different facilities. They expanded their production
and their capacity. They put a little bit of
money into marketing, and they really tried to
expand who they're selling to. But with that money that they've been given and now
trading on that exchange, it means that guys like me, guys like you, anybody in
the world, guys, or girls, can trade that stock, and it means that they
need the information required to trade
that stock, such as, financial statements,
balance sheet, strategy, presentations, meeting minutes, whatever it happens to be. And because of that, this
company now has to report that. So that's how we get quarterly financial statements,
meeting minutes, and all these
different requirements that we can read in, read into, look into and analyze in order
to make our investments, and anybody can own
that share now. So once Once those shares have gone through
the IPO process, they're now traded on a market, anybody can purchase
those shares. It means that I
could be an owner in 100 different companies, I could be an owner
in one company. It doesn't really
matter. Almost anybody can own those shares once
you go through an IPO. So you have to be able to manage a larger number
of shareholders, such as sending out disbursements,
sending out documents, or being able to manage the voting rights of that
many different shareholders. Now, the one that
we're going to look at today is a new one.
It just launched. The companies based
out of Victoria in British Columbia
here in Canada. It's kind of a cool
one. I used to be on meat at the beginning
of this video, and this is a similar company. It's called good Butchers, and they basically do
vegan meat products. So really cool companies, small little company,
they started as a restaurant. It
slowly expanded. I grew into products,
and now they sell all across Western Canada. But I will give you
a quick disclaimer, very, very small company. This is a very small IPO. It is not a Facebook
or Uber IPO. It's a very small scale. But it just happened
a couple of days ago basically in my backyard, so I wanted to
bring it up to you because it could also
be a good opportunity. So very good butchers is
what the company is called. The Tickers VERY. That's
why it's in there. They issued 16 million
shares at a price of $0.25, and altogether, they
raised $4,000,000, and they're going to be putting that money into a new
production facility. So really simple,
straightforward, the company needed to raise a significant amount of money. They're in a small little town in Victoria, and they said, Okay, we're really
going to scale this up, and we're going to try and
be an industry leader. That's at least what
their website says. So they knew they were
going to IPO at some point. So instead of raising
$4,000,000 from a couple of local venture
capitalists or investors, they said, Let's just
IPO, let's launch. Let's get it out there, and
let's see what we can do. So they got their $4 million, and they just opened a
new production facility. I'm going to dive
into it right now. I'm going to exit PowerPoint. We're gonna go into
my Internet Explorer, and we're going to start
looking at this stock. So pretty exciting. That's it for IPOs for
this lesson, though, and then let's get right
into analyzing this stock. So let's jump into it. Okay, so I'm in the
stock chart right now. I'm looking at stock charts, and this obviously
looks kind of funny compared to some of the other videos that
you've seen me do, and it's because this company
literally just IPOed. So the IPOed on June 18, it's now June 25. So they've had six days of
trading, including today. They went from basically $0.25 all the way up to the $2 mark, and now they've fallen
back down to $1.19. So little bit of volatility. You can also see very
low trading volume has significantly decreased here
over the last few days, but this stock has literally only been here for five days. So, unfortunately, we
can't really perform any technical analysis because
we don't have enough data. There's no moving averages. There's not enough
time to run a MACD. There's not enough
time to run an RSI. We can't really establish any
levels of resistance unless we were looking at a
day intra day period, maybe a five minute,
ten minute period. But on a day, full day period, we can't do anything
with this chart. So we could definitely
zoom in if we wanted to, but I'm not focused
on day trading, especially in IPO
stock right now. So This chart doesn't
tell us very much, which means we need to
start looking elsewhere. So first thing I'm going to
do is go to the website. This is what it looks
like right now. And as you can see,
very good butchers, all I did was click on
Investor Relations, and you can sort of see what they're doing and
what they want to do. The stocks at at
dollar 19 right now. So, research and development, manufacturing and distribution, and they've got this
little store here, I looks like in Victoria,
which is pretty cool. So nice to see and then download our
investor presentation. I just downloaded this. There's not much else on
here. So pretty simple. So let's go to it. This
is the presentation. Real simple, it's
just a PowerPoint put into basically a PDF, so
you can scroll through it. So really cool, market dynamics, talking about the
size of the market. And then this is what I
thought was really unique. This is sort of why
I like the company. Pretty sad steady sales
all the way through here, nothing, amazing,
nothing fantastic over the last kind of 12 months. And then boom, March
hit, COVID hit, and their sales
doubled one month, and then doubled
again the next month. So in April of 2020, they did almost
500,000 in sales, in March of 2020, they did almost
250,000 in sales, and before that there
were around 100. So really amazing financials over these last two months.
I really like that. And the trend that they're on
is just phenomenal as well. So Some of the highlights in here, you can
kind of go through. They just kind of
basically glamorize everything as most companies do in these types
of presentations, and it makes it look good. Little bit of a leadership team, share cap, you can kind of
see how everything's done. And then this is
the important part, use of proceeds over
the next 12 months, so you can see exactly what they're going to
spend your money on. Estimated Vancouver build
costs are net $416,000. So they're going to put a good chunk of the
money that they just raised to expanding
their facility and trying to grow from there. Corporate activities, highlights,
industry positioning, strategic approach,
company foundation. They just kind of basically hype up why they're very good. And then what I
thought was really cool and I really like this. You don't see it very often, but you actually get the e
mails of the CFO and the CEO, and you also get a phone number. I don't know if it's the office or their cell phone number, but you don't see
that very often. I really like that,
or I appreciate it. I could call up the CEO
of this company if I wanted and give them a
call and shoot the ****. Probably wouldn't take my
call, but that's okay. So really cool here. That's just the
investor presentation, and then these are
the financials. So not phenomenal financials right now because it's
such a growth company, but it does look good. So March 31, 2019, to March 31, 2020, so basically a 12 month
comparison of the quarter, so 338,000 compared to 218,000. So really nice, they're
increasing their revenue by almost 50% year over year. So phenomenal phenomenal
growth right now. However, they are losing a pretty significant amount
of money right now, as you would expect with a
company that is going to try and grow as rapidly
as these guys are, especially in a
market like this that they will need to do in order
to compete with beyond me. So really cool. You can
kind of go through all of their financials and
basically their strategy here and how they've
raised their money. And then I have a little
app here that tells me how much revenue they do
on their website per month. So right now it's saying about
50 to 100,000 per month, which is not too bad, and it also shows me their
best selling product. It's a big box of meat here,
which is kind of cool. So this is just a plug
in that I use for analyzing Shopify
stores, but, like, this is their best
selling product, according to their
online store right now. So kind of cool. Kind of neat. And then the one What was the other thing I
liked here. The Facebook ads. So I can see their
Facebook ads rate here, and you can see all
of the advertisements that they're doing right now. They're doing a pretty
good job as well. So I really like the
campaigns that they're using. They're doing pretty
much everything digital. They're really focused
on e commerce. I think that's definitely
the way to go. And they're much more
creative than beyond meat with regards to their
product offering, so I like that as well. So doing good overall, I think it's a good company. I'm going to analyze their
financials a little bit more, but they just IPOed that you can get in for basically
$1.20 a share. I don't think you could
go very wrong on it. I think this company's
doing very well. Drastic increase since
the IPO. It was at $0.25. It went up to $2.
Now, it's at $1.19. So crazy fluctuations in there. However, Company heavily focused on E commerce, I
really like that. Company heavily
focused on renewable, sustainable, better products,
I really like that. The alternative to meat industry is exploding and it's
doing phenomenally well. So I really like that.
It's a Canadian company with a young ambitious group, and their CFO looks like he's got a lot of
experience as well, and they just raised a phenomenal
amount of money that's going to give them room to run for at least the next 12 months. And not only that,
but since then, if they needed to raise
more money later on, they could now do it at $1.19
per share instead of $0.25. So I don't see a lot
of downside with this. It's also owned 41% by insiders. So shareholders in the company are actually work in the company and our founders of the company. So I think that's very, very important because it gives them the ability to
issue more shares, as well as keeps them
very invested and motivated to grow this company and really achieve
something great. So I like it pretty much from various different
angles. I like it. I think it should
be a good company. We'll see how the first
kind of quarter goes, but I'm probably going to make a small investment into it. And if you guys have any
questions about IPOs, about this company
in particular, or about any other ones, please let me know, I'd
love to answer them. And if you got anything
out of this video, please remember to show some
love. Thank you very much.
57. Buying into an IPO: What's going on? You guys welcome to another video and this one I'm gonna break down for you the three different ways that you can buy into an initial public offering or IPO. Here's everything you need to know. Let's go through an initial public offering is the first public sale of a stock. It is used to raise money in order to help that company expanded. Now when a company goes out and goes through an IPO process, so they say, okay, we want to raise $500 million. We're going to sell this many shares at this price and let's see who wants them and then honest specific IPO date, those shares then become publicly traded and that company now has very specific reporting requirements. And so in this video, we're going to break down the three different ways that you can buy in. And so number one is to buy the actual IPO at the price that the company issues. Number two is to buy an ETF and number three is to wait for day number one. And so we're going to walk through these three options in detail in this video, starting with number one and that is buying the IPO. And so the first way to do this is to reach out to your broker if you're with your banker, if you're with Quest trade or interactive brokers doesn't really matter. Every single broker is going to have a way to handle this kind of particular to them and they will also have their own restrictions and limitations. And so with Quest trade, that is the brokerage that I use and they use something called the IPO centered. You basically go in there, you can see which stocks are available, which stocks are upcoming, and which stocks have closed. And you can basically try to bid in and get in on that initial public offering. Now, the problem here is that there are some restrictions. It is not quite as easy just going in and buying the stock with question, For instance, you need to have a minimum of $5 thousand that you can basically put towards that stock. It needs to be liquid, any need to bid to basically hold it there for a couple of weeks until that company goes public depending on where your brokerage is located, you may also have limited access to Canadian or US markets. You might not be able to invest cross-border depending on where your account is and who your brokerages. The other thing that you need to understand is that you may bid $5 thousand to get into the Airbnb IPO. But if that IPOs oversubscribed, you may not get filled on your order at all and you're $5 thousand have just sat there and then come back to you a month later. So you need to be well aware of that and nothing is guaranteed in this process. However, all of these brokers do have newsletters that you can sign up to so that you can get alerts on when different companies are going public, when the documents are available and when you can actually put your money in and try and get into that IPO. Now with question and this is what the IPO center looks like. As you can see, they have currently four different companies that are open or that are about to IPO or currently raising money. You can also go through all of the closed listings as well, and you can dive into the basically documents here. It's really, really great. They also have basically an IPO bulletins. So I signed up for this. You put in your name and your information, and then they will let you know when different companies come available and when different companies are raising money. Now if you're trying to do some research before the company's ever get to these IPO centers or any of these basically platforms, go to a few different websites. Number one is the nasdaq, and number two is the New York Stock Exchange, both of whom have little sections on their website for IPOs and you can find basically a calendar of what's upcoming which come user perspective, their IPO and what stage of the IPO process. They're actually also use market watch. They actually have an IPO calendar that basically assimilates all of the different market information. And I think they do a really good job when it comes to tracking and giving you information on IPO. So I highly recommend them. Now if you want to find the real financials and the real IPO filings behind these companies. In Canada, it is a website called CDR.com, and in the USA is a website called Edgar.com. And basically what these websites do is they act as a database for every single public filings. So if there's any type of Financial statements, disclosures, notices, anything like that. You can find it for any Canadian or US company on these websites and you have full access to the revenue of the balance sheet, the breakdowns of every publicly traded company. These are great resources. They're not good websites by any means, but they're great resources. Now the second option you have for getting exposure to IPOs is to bind to an ETF or an exchange traded fund. What that is is a group of companies and so you buy one share or one unit in this ticker. In this case, I'm looking at FBX. And what that does is it gives you exposure to a 100 different companies that have recently IPO. And so for instance, FBX is one of the largest IPO ETFs, and they hold companies from day six. So they don't get in right on day one, this ETF will buy into the shares and they will hold him from day six to one hundred, ten hundred. They will do it for a 100 different companies. And the advantage here is it allows you to get exposure to the different IPO companies, but it also gives you diversification. So basically what this fund is, is it's really great for growth of young companies if you think there's a lot of IPO action coming up and you think there's a lot of potential, this is probably the best place for you to invest because you don't have to pick and choose which horse is going to win. This gives you market exposure to all of the recent companies that are IPO. Basically day six to 100, there's over a 100 companies in there. And I highly recommend it if you don't want to pick and choose different companies. Here's a list of eight different IPO ETFs. Each of them has different basically goals and objectives in marketplaces. So make sure you do your due diligence on it. Fbx is only holding US equity opportunity, so there's no Canadian exposure there. So make sure you know what you invest into. But here's a list of eight different ones that you can take a look at. An all of them seemed to do pretty good. Now your third and final option for buying into an IPO Company is to buy in on day one, they will basically open the market. They'll usually that's who you see ringing the bell is when an IPO how options, that's usually what that picture is. And basically at nine AM or 930 in New York, ready to go, that market opens, those stocks, start to trade and you better be ready for a roller coaster because the first day, it's usually not very smooth. It is extremely choppy, IT IS super volatile, and you have no idea what's going to happen at that price if it's going to drop by 40%, or if it's going to double in 20 minutes, you have absolutely no idea, You have no technicals to go off of. You have very few fundamentals to go off of, and you're basically making a bet on the company, the business strategy, and the management team because most of the time that don't make money and there's no charts to actually look at. So if you buy in on day one, it's just as risky as buying in to the IPO. However, hopefully you can buy it at a dip. So let's say IPOs, it dips and then comes back up. That would be the best case for you if you can buy it on that dip. However, this is definitely something that takes a little bit more attention. A little bit. You've got to be sitting at your desk when the stock starts to try it and you gotta be ready to go. And I highly recommend holding these stocks long-term. It's pretty tough to day trade these IPOs, but that is just my experience. Maybe you've got your own strategy. And in summary, there are three ways to buy into an IPO. However, you need to expect volatility. None of these stocks opened at $20 and are at $21 the next day, they're usually up or down by at least $5. So you need to expect some volatility there and you need to do your own due diligence on looking at Airbnb right now. So I'm super interested in it, but I am diving through the financials on the egg grew websites, so definitely do your due diligence.
58. Stock Buy Backs: What's going on? You guys welcome to another lesson. In this one, we're gonna talk about stock buybacks and everything you need to know when you see that a company is buying back its own shares. We're gonna go through how it works, what happens, and the risks you need to be aware of. Let's jump right in. Okay, so what is a stock buyback? This is when a company goes out into the public market and they buy its own shares at the market price. An example of this would be Berkshire Hathaway spending their cash on Berkshire Hathaway stock. So berkshire Hathaway is Warren Buffett's company. They are a big, big name when it comes to companies that buy back their own stock. Warren Buffett is a big believer in that and he kinda goes into different examples of that. Another example of a company that does this a lot is Apple, and that's what we're going to look at here in a minute. But what we need to talk about first is what happens to those shares when a company buys them back in the marketplace? So when a company buys its own shares in the marketplace, those shares become part of treasury shares and they are not included in the shares outstanding. So remember, when we talked about market cap that has shares outstanding times the prices of shares gives you the value of the company. If a company goes out and buys back its own shares, they get put into treasury shares. They're not part of shares outstanding. And basically what that's doing is it's reducing the number of shares that are available in the public market. What that means is that the supply of shares available has gone down. And this is really important because the price of the stock is dependent on the supply and the demand. If tons of people are trying to buy Apple stock, that's going to drive the price up. If tons of people are trying to sell Apple stock is going to drive the price down. And so when a company goes out and buys its own stock, it reduces the supply. And that in turn, makes those shares a little bit more rare and it increases the price of the rest of the shares. And so that's what I'm referring to on this side here of supply and demand. If the demand remains the same. So the same number of people out in the public marketplace still want to buy Apple shares, but Apple is buying back its own shares and taking them out of the marketplace than the value of the remaining shares will increase to make up for that, because Apple, the company, is still worth 1 trillion or $2 trillion, whatever it may be, there's just less shares available in the marketplace. Now an example of this for somebody that, that's a little lost here or doesn't want. A business example is Pokemon. So over the last few years, Pokemon has just gone crazy. And the most popular or the rarest and most valuable card is the holographic chars aren't. And so let's say that chars art is the most rare and the most valuable Pokemon card in the market. An example of a buyback in this example would be poking on the company, going out into the market and buying out half of the available chars arts and then destroying them. Obviously, Pokemon can still go out and make more chars are cards later on, just like a company can issue more shares later on, however, as Pokemon destroys the chars are cards, or as a company buys back its own stock, it reduces the supply. It makes the remaining supply much more rare, and it increases the value of that remaining supply of chars arts or of the stock. And so. Pokemon went out and bought half the chars arts and then burn them. The remainder of those chars ARDS would be extremely valuable. That's the exact same idea, is what happens in a stock buyback. Now the big question is, how do you tell if a company is buying back? Well, the number one way is from the financial statements and that's what we're going to jump into in just 1 second here. But if you can't find it in there or you need more information, then you should go to management interviews. Anytime you can see the management speak especially about that topic, you need to listen to that very carefully. And then three is previous history. If you notice that Berkshire Hathaway always buys back their shares at 300, that you might have a prediction or you might have a little bit of insight that they're probably going to do it again in the future if the price drops to that level. So Let's dive into the financial zone just in case you're wondering if you ever see the term 10 Q that refers to the quarterly financial statements, if you see the term 10 K, that refers to the annual financial statements. So if you see 10 Q or 10 K, it means quarterly statements tend k is the annual kind of all put together now on Apple's 10 Q quarterly statement, the most recent one that came out, I just pulled this and they had an entire note that explained their share repurchase program. As you can see here, that company repurchase 200 million shares of its common stock for $24 billion. So they actually outlay this. They tell you exactly how many shares are buying at what price and everything is related to you on the financial statements. It is also posted on the statement of shareholders equity. I've got this big green arrow right here, that's basically next to this line. And as you can see, $24 billion in common stock repurchase from Apple for the three months ended December 26. And these guys are buying back a lot of their stock. Luckily, they have a very, very large cash balance. So this 24 billion dollars here and common stock being repurchased isn't anything to be concerned about. Now, there are some risks though, when you see that a company is buying back its own stock. And these are the risks that you're going to want to be aware of and be concerned about. So number one is management might be buying back the stock to give themselves a short-term returns. So if I'm the CEO and I own a ton of shares in XYZ company and I notice that I've got some cash. I can go in and buy those shares and then I can increase the price of my personal holdings. I can then exit when they're at a high and I can make some really good money by spending the company's money to buy back those shares. And so you need to be very careful here because if management owns a ton of shares, usually that's good because it means they're invested. But if they have the power to spend company money, buying back other people's shares to increase their own profits. That's a big risk that you need to be very well aware of. Secondly, is that buying back the stock does not help the company grow. When a company spends its cash balance to buy back its own stock as cash balance that they can't spend on research and development, on opening a new location, on hiring more people, on growing the firm. It means that they're spending that cash in the stock market rather than on their operations. And so you need to be very, very careful about that because you need to think about if you were the CEO of this company, you had X amount of resources, where would you be spending those resources? Would it be on growing your company or would it be on buying back the stock or would it be a split of both of them, like what Apple is doing? Now, here are my final thoughts. Every situation is different. There is no blanket rule to accompanies good when they buy back or they're bad when they buy back. Every situation is completely different. I can tell you that Apple is a fantastic company that is extremely well-run and is one of the best companies in the world and they're buying back their own stock. So there's no blanket statement here. It can be good and it can be bad. You need to be watching out for is management intentions. And if you were management, what would you be doing with your resources? Stock buybacks can be good if they are done with the right intentions and the company has more cash than they need. But if the company is struggling for cash and the management does not have their intention in the right place. It can be a recipe for disaster, a need to be very careful now, in summary, stock buybacks depend on the situation. When a company buys back its own stock, that stock goes into Treasury, it is removed from the public marketplace, is removed from shares outstanding. And usually as long as demand stays the same and the company is still operating basically the same way. Usually the price of the rest of the remaining shares will increase. Think about it as if pokemon was going to go out and buy half of all the chars are cards that would make the remaining half much more valuable. So think about that and we'll see you guys in the next video. Here we go.
59. Insider Trading: What's going on? You guys welcome to another lesson. In this video, we're gonna talk about insider trading. Who class devises an insider? What does it mean when they buy or sell? And how can you figure out who is buying and selling? Here's everything you need to know. Let's go. Okay, so let's just start with what is insider trading? Insider trading is when people with any company buy or sell the stock. The reason this is important is because they can have in-depth knowledge that the average investor does not have. And that means that they have an advantage. And there's a lot of rules in the stock market that are designed to make sure that there's an even playing field so that all investors have access to the exact same information. And when you're an insider and you have information that the average person or the average investor or every other investor does not have. That means that you are subject to specific rules and regulations, such as reporting when you buy and sell. And that's what we're going to talk about here. And that's what's considered Insider activity. And the reason it's important is because they have knowledge that the average investor doesn't. And so usually you can use it as a signal to either support or go against your trading hypothesis. Now, who classifies as an insider? Well, really simple, if you're the CEO or if you're any C-level executive in the company, you are definitely a, an insider. If you are a high level manager, you are most likely and insight or if you're any type of director, VP, you're definitely an insider. And if you're on the board of directors or if you're an investor that owns more than 10 percent of the voting shares, you are considered an insider and your subject to specific rules where you have to report every buy and sell that you make with regards to basically most of your public transaction. So what does it mean when somebody buys in as an insider? Well, this is typically viewed as a good sign because it means that the person is buying more shares. And when people want to buy the shares, that's what drives the stock price up because it is a market. So as more people want to buy, it's going to drive the price up. So number one, a good thing. Secondly, it means that they see the company as a good investment. They're taking their hard-earned salary or income or whatever it may be, and then putting it back into the company because they see it as a good investment for their hard-earned income. And that is usually a good sign, especially if they're an insider of the company because they see what's happening on a day-to-day basis. And as an investor sitting out at home here, I have no idea if, if the CEO is an absolute door knob that everybody hates and everybody's basically planning a coup against him. I can't see that, but the insiders can see that they can feel that. And you can start to see how they feel based on that Insider activity. And so they are buying. It means that they see the company as a good investment. And it's usually a signal of confidence in the company and the higher up you go. So a manager buying isn't a huge deal, but if the CEO is consistently buying every single month, That's usually a very, very good sign. So that's something really important to me. Now, what does it mean when they're selling the shares? This is also very important. One of the reasons that management might be selling is because they may think the company is overvalued if the company has had a major run up and it's based on hyper, it's based on expectations. Management may think, okay, the company is just a little overvalued right now. I'm going to lock in some of these profits for myself. I'm gonna take my shares and then I'm going to have some cash to play with. So that could be one thing that's happening. Could be how you tell when a company is overvalued as if the stock runs up dramatically and then management cells out that could be assigned that they just think it's been a good run, but the company is a little overvalued. The second thing is that management might have less confidence about the future of the company or market conditions. So if the company hasn't had a major Ron up and they come and the management is still selling those shares. It may mean that they just lack confidence in the basically competitive advantage and the situation and the market conditions that the company is in. And that is a red flag. So when you think that management is selling because they lack confidence in the business model and the market conditions. That is a major red flag and that's when you want to get out. However, there are some times where it just doesn't matter. So for instance, that insider might just need the money for another purchase or for an emergency. Let's say they crash a car and they need to buy a new one or something happens, and they have a big medical bill. There's a variety of different situations that could cause somebody to need to sell those shares, to use that money for a different situation without having any impact on their confidence in the actual company. So you need to take that into account. The other thing that it might be as at maybe they sign on with the company, they invest a ton into the company. The company starts to improve, the stock price goes up, and then all of a sudden they have 75% of their net worth, one single stock. They may need to rebalance their portfolio and that's just them adjusting their portfolio. So you need to understand that management or insider selling the shares is not always a bad thing. However, if management is consistently selling shares and they're trying to get out of their positions, then that's definitely a red flag, a need to be well aware of that now, how do you find out who is buying and who is selling? There's a variety of different ways to do this. Here are a couple of websites. Fin vis.com will have most of the companies that you're looking for, especially if they're on the larger market cap size. However, if they're smaller companies, you may want to check out inside are tracking.com. And if they're a Canadian company, you may want to check out Canadian insider.com now, can't find any of the information you're looking for. They're going into Google and type in the ticker and then type Insider activity directly after it. It will pull together all of the information about this topic. And I promise you, you should be able to find the information there. And if you're looking for one more option, you can always go to the exchange that the stock is listed on. That is where they have to report all of the Insider activity every time management or an insider buys and sells, it has to get listed and it has to get posted to the exchange. So you can also find the information there. We're gonna do a quick exercise and we're going to try and find the Apple Insider activity. So what we're gonna do is just open a new tab here. We're gonna go to Google. We're going to type AAPL inside or activity. And I think the first thing that comes up is nasdaq. So we're going to click on this. And what's cool about this is it lists every single transaction that has happened from insiders at Apple. So as you can see, it's basically going back to February here. You can see that all of these people are basically, basically transacting. And so a lot of these are options execution. Some of these are cells. Another option execute. And I think if we go to page two here, we can actually see the CEO. So he's actually listed as Officer. This basically goes by the relationship to the company, the last date, so the date that it was transacted, The type of transaction right here, the owner type. So this is basically how it was transacted, the number of shares traded, the price at which they traded, and then the shares held by that individual. And as you can see right here, this is kinda cool because this is Timothy cook. This is the CEO of the company. And when you click on his name, you can actually see all of his activity. So he actually owns both shares and Apple as well as Nike, and he's selling them off right now. So he is going through an automatic cell and Nike as well as an automatic cell in Apple. And so what that means is that he is basically just going through, and every quarter or every few months he's selling a couple of shares, just a trim his position and lock in some profits. Not really a red flag there. That's what happens with a lot of people, especially somebody that's be the CEO for about ten years now there's no problems there. Now, the transactions here, you'll notice they're a little bit different. So these automatic cells, these are scheduled transactions to sell the stock, but these dispositions where it says non open market, this is an agreement between the employee and the company itself to buy or sell the shares. So there's a variety of different types of transactions. If you ever have any questions about anything you see on this chart here, you can just Google it and you can find the definition extremely easily. But we're going to jump back to this side here and I just want to give you my last kinda notes here. So my recommendations, Insider activity is not always representative of future stock performance. You need to understand that sometimes people sell the shares just to put that money in different places or cover there but are covering emergency, whatever it may be. Sometimes they sell for a variety of reasons, not related to the company. However, as soon as you think they are selling because of a lack of confidence in the market or the company, or the product line or whatever it may be. That's a huge red flag and that's when you may want to reconsider your position or we consider taking a position. Lastly, you need to use Insider activity as a signal and not a reason to make a trade or get out of a trade, you need to use it as a signal that gets basically compared to the rest of your analysis put together as a whole. And then you analyze everything as a whole and say, Do I still want to be in this trade? Or should I get out of this trade or should I enter this trade? That's what you need to do. This is just a signal that you use similar to the indicators, similar to the price action, and similar to your fundamental analysis. You put it all together to make a decision and that's how you should be trading, will see you guys in the next lesson.
60. 3 ways to make money when markets drop: All right, You guys welcome to another lesson. In this video, we're gonna talk about three different strategies that you can use to make money when the market is going down or even when an individual stock is going down. Here's everything you need to know. Let's go. Okay, So there's three strategies that we're going to talk about. Number one is inverse ETFs. Number two is put options and number three is shorting stocks. We're going to talk about them in the order of risks. So number one is going to be the least risky option here, and number three is going to be considered the most risky option. There are definitely strategies that you can use to mitigate your risk and limit your risk. But in general, this is pretty much how I would consider it. Now, number 1 is inverse ETFs. Let's first talk about a regular ETF, which is a group of stocks that track an index and can be traded as one. So remember, an index is basically an imaginary group of stocks that somebody uses and they measure it based in points. That's what the nasdaq, the Dow Jones and the S and P 500 are. That's why they're referred to as something and measured in points. However, a ETF is what you can use to actually trade that index. The ETF is a group of companies that is actually held. It has a price and a ticker and you can actually trade it. An inverse. Etf is pretty much the exact same thing, but it moves in the opposite direction. So when the S and P 500 moves up and the ETF moves up, the inverse ETF will move down. The exact same thing happens when the S and P 500 and the ETF move down. The inverse ETF will move up, and that's where you have an opportunity to make money when the stock market goes down. Now, an example of this, I have a couple here and there are formatted in this way. So the index or the group of companies is going to be on the left-hand side here. And I'm talking about the S and P 500, the Nasdaq, and the Dow Jones, an ETF that tracks the performance of these indexes is in the middle here. We've got the SPY, the QQQ, and the DIA. All of these track the performance of the index. So if you just want to buy flat into the S and P 500, you can go out and you can buy SPY, and now pretty much track the exact performance of the S and P 500. Now, the inverse ETF of each of these is listed on the right-hand side here. So if you want to, if you're short on the market and you think that the S and P 500 is crashing right now and you want to capitalize on it. You can buy the inverse ETF, which is SDS. Same thing here for the nasdaq, which is P, S, Q. We're going to look at this one in just a second here. And the Dow Jones is as DOW. Now, let's look at this nasdaq example. So we're going to track the nasdaq index using the ETF QQQ. And then we're going to look at how it correlates and the relationship between QQQ and PSQL, which is the inverse of QQQ. So first of all, let's look at the QQQ chart. Again, this is the nasdaq ETFs. So this ETF tracks the performance of the nasdaq. As you can see, we're falling pretty sharply right now. And so for the last three days, we've had a pretty steep decline in the value of the QQQ. But when you look at the PSQL, you can see that for the last three days, we have risen pretty dramatically. And that's because this is the inverse. The QQQ, which tracks the Nasdaq. And so, so if you're short on the market, you can go out and you can buy the PSU at about $14.74 as I take this screenshot and as the nasdaq falls and as QQQ falls, the ps q will rise in value, and that's how you can make money as the market goes down. Now, as you can see here, we had a pretty bad day in the nasdaq, but the PSQL chart only moved by about 1.87%. So obviously, these aren't monumental moves even when the market's moving pretty drastically. And so if you want to get a little bit more action and a little bit more movement out of your charts, you can use something called a leveraged ETF. Now this is exact same ideas or regular ETF, except that it will move by two times or three times the other underlying ETFs. So if you were looking at the Nasdaq and then you'd bought a leveraged ETF. This one would move the same way, but it would be amplified by two or three times. So an example of this is the ps q. So this is the inverse ETF of the nasdaq. If it moves by 2%, then the S QQQ, which is the inverse leveraged ETF of the nasdaq. This will move by 6%. So if you are saying, Hey, technologies crashing, the market's crashing right now, and PSUs just doesn't quite do it for me. It's not moving quite enough. You could buy SQS, queues and it will move by three times as much. Well, you do need to realize though, is that it moved three times as much in the other way as well. And so S QQQ is a three X leveraged inverse ETF of the Nasdaq. And so this is one option that you can use if you think technology's crashing and the market's crashing, this is a great option. However, you do need to realize that the leveraged ETFs are not meant to be held for long durations of time. The reason is they get that leverage from holding options underneath that S QQQ ticker is basically a complex algorithm of different forms of options. And because their options subject to time decay, which means the value of them depreciate over time. And so if you hold these basically securities over a long period of time, the value of them will slowly depreciate. They're meant for short-term trading and day trading, but they do give you exposure and leverage to make money when the stock market is going down. So they are a fantastic tool on your tool belt. And if you're new to try to make money on the stocks, go down and shorting the market, then this is definitely the place to start. This is definitely the most, least risky places to just buy the inverse ETF. And then by the leveraged inverse ETF, if that's the way you want to go and you want a little bit more risk. Now, the second option here is to buy put options. This is probably Another big kinda step up on the risk level. And this is pretty tricky because there's a little bit more that goes into this. So put options go up when the stock price goes down. That's, that's the goal here. We're trying to make money when stocks go down. And so if you buy put options, you've got a pretty good chance of doing that if the stock goes down. And so a put option is the ability to sell the stock at a specific price on a specific date. So let's just walk through an example here. Let's say that you buy an Apple put option contract for $1 per share. So a contract makes up 100 shares. That's how you have to buy. Options is in the form of contracts which represent 100 shares. So you're into the position for a $100 in that position, that contract has a strike price of $10. That means you have the ability to sell those shares at $10 with an expiry of one month from today. So that's how you get into the position you're buying an Apple put option contract that has a premium of $1, That's what you're paying to get into it. You have the ability to sell Apple stock at $10.1 month from today. Now, if the price of Apple shares declines to $5 after one month, you can then go into the market. You can buy the shares for $5, you can sell them to the contract holder for $10 and you can make that $5 profit in between. You did spend $1 to buy the contract. And so that $5 per share minus $1 per share for the contract leaves you with $4 in profit. Now, you did have to have a little bit of money to go into the market and buy those shares afterwards. But your initial investment on this was only $1 for a profit of $4. That is a phenomenal return. And that's the advantage of buying options is that the risk to return ratio is much, much higher. Now, let's say that instead of Apple stock declining to $5, it actually went up to $15. And your strike price was $10 one month after you bought it, that would mean that your options are going to expire worthless and you will have lost 100% of your investment or that entire $100 that you put into the option. And so the risk to reward ratio goes both ways. When you play with options, you can lose all of your money a whole lot quicker. You can also make a whole lot more money than if you had just owned the shares. Now, there is a couple of things to know about options. Number one is that you can sell the option contract. So once you make that contract, that is a security that can be sold at any point before it expires in order for you to actually convert that contract into shares though and either buy or sell. It does have to be on the expiry date. However, once you've got that contract leading up to that expiry date, if it becomes more valuable leading up to the expiry date, you can sell it at a profit before it expires. Second thing, options are much more volatile than stocks. They much, they move much more dramatically on a day-to-day basis. So you need to be very careful that they also have a much larger spread, meaning that the bid and the ask, or on different levels. And so you need to make sure that there's enough liquidity for you to actually get into the trade. Options are also a little bit more complicated and the terminology is different. The strike price is the price at which you can buy or sell it. The expiration date as the date at which you can convert that contract into actual shares. And the premium is the price at which you pay for that contract. So there's a little bit more that goes into it and the contract itself represents 100 shares. So you need to make sure that you know what you're doing before you get into options, because there's a lot that goes into them. Now, the third option to make money when the stock market is going down is too short a stock. Now this is a fairly simple concept, but it takes just a minute to wrap your mind around. Number one is that you borrow your stock from your bank or your broker. So if I use Quest trait are going to borrow one share of Apple from Quest trait, then the second step is that I'm going to go into the market and I'm going to sell it for $50. I'm going to sell it at the market price for $50. And I'm going to hope that that price falls lower and I'm going to wait that step 3, you gotta wait for the price to fall. That's the assumption here, is that the stock is going to fall. That's why we're shorting it. So you waited out and let's say that the price falls to $30 now. Well, I can now go back into the market and I can buy that share for $30. Now remember, I borrowed it from Quest trade and sold it for 50. So I had $50 and I owed quest trade one share. I sold it at 50, I'm going to buy it back at 30, and I'm going to return that share to Quest trait and I'm going to capture that $20 in between. And that's how you short a stock and that's how you make money when the stock goes down. Now there is some risk to shorting the stock. And what I mean by risk, I'm talking about unlimited risk. And you must put a stop-loss on any of these traits. The reason it's unlimited risk is because let's say that I borrow shares of Apple from Quest trait and I sell it in the market for $50. I'm hoping it goes down to 30 so that I can get it back and return it to Quest trait. However, if the price of that share over night jumps to a $100, I then have to go into the market the next day, buy it at a $100 and return it to Quest trade. And I just lost $50 on that trade. And so let's say that the stock went to a $1000 or $10 thousand overnight. I would still have to go back into the market by it at that price and return. It's a question, I still owe them one share of Apple and so there's unlimited risk when you short a stock because that price of a stock can go up to a million dollars or you can go as high as it wants. However, if you just buy the stock and it goes bankrupt, it can only go to 0 and you can only lose 100% of your investment when you short a stock, you can lose more than your initial investment, but by putting a stop-loss on it, you limit most of that risk. So you need to be very, very careful when you short a stock. You need to make sure that you have a stop-loss on it. Now, the process of shorting a stock is pretty much the exact same thing except instead of buying to open the position, you're going to sell to open the position. And then you are going to buy to close that position. When you buy it on the clothes, it's going to automatically return that share to your broker, your bank, or whoever you borrowed it from. Now here my final thoughts on these three strategies that we just talked about. Number 1 was inverse ETFs, and number two was put options and number three was shorting the stock. I think that the inverse ETFs are usually the best place to start if you're new to being short in the market and basically betting on the market going down, then you need to make sure that you are managing your risk because it's usually a riskier trade and using inverse ETFs is the best way to manage your risks. Secondly, is that the market does not always need to go up in order for you to make money. Money, the more you know about the market and the more tools you have on your tool belt, the better off you're going to be and the more options you're going to see and the more opportunities you're going to have to make money. And so knowledge is super, super crucial here. And the more knowledge you have about how the market works, the more ways you will find to make money. I want a 100 percent believe that. I think it's absolutely true. And so these are three different strategies that you can use to make money when the market goes down. So when you see red days and you can see more red days coming, that should be an opportunity for you to make money, not have to basically crunch up your portfolio and struggle through the next little while. It should be an opportunity for you to make money if you can master any of these strategies, I'll see you guys in the next video.
61. Averaging Down: Okay, so averaging down is really simple. It's when you bind to a company as the stock falls so that you can lower your average stock price. Now, obviously, as soon as you bind to accompany, we all want the stock to go up. When the stock goes down, you have two decisions. You can cut your loss or you can buy more into it. And that's called averaging down. And that's what we're going to focus on in this video. All right, so let's look at an example. So you buy 100 shares of Company XYZ at $1 and then a month later, the shares are now trading at $0.80. So you can either cut your laws or you can decide to average down and you can buy a little bit more. In this case, we buy 100 and more shares at $0.80 and we do the exact same thing one month later at $0.70. At the end of this, it leaves us with the result of owning 300 shares at an average price of $0.83. And so the idea here is you made your initial investment at a dollar per share. Now you're into it at $0.83 per share. So you're a little bit lower and you've averaged down as you've built a bigger position. We're going to talk about when that's a good idea and one that's a bad idea. So first of all, this is just my opinion and this is for entertainment purposes only. You need to do your own research and make your own investment decisions. One is averaging down a good idea. Well, the answer to that is really, really simple. It is usually a good idea to average down when the asset that you are averaging down into is generating your cashflow. So if it's a $100 stock that is paying you $5 in dividends and the stock price all of a sudden falls to $90, but it's still giving you a $5 dividend every single year. Then all of a sudden the stock has just become on sale and you're much better off averaging down because you are actually getting the same level of cashflow at a discounted price, you actually have value and incoming cash flow that you can base your valuation off of. And in this case, you're actually getting a discount on that price as long as you are happy with that dividend, are happy with that cashflow. And this situation or the support and the security of that cash flow has not changed. So if we're not forecasting that that dividend is gonna get cut or that dividend might get removed, then that is a good purchase and you should be averaging down into that. Two examples of this are dividend-paying companies and real estate investment trusts. Or reads, if you put the idea here is cashflow. If the asset is generating new cashflow, I totally support and I recommend averaging down into it as long as your portfolio remains balanced, that is the caveat there. You do not want to have all of your eggs in one basket. You do want to be diversified. But if you do have an appropriate level of diversification, I fully support averaging down into an asset that provides dividends or cashflow. So now when is averaging down a bad idea? Well, in my opinion, averaging down is a bad idea. Anytime that we were dealing with young companies, anytime we're dealing with companies that do not pay dividends, or anytime we're dealing with companies that do not have any direct cashflow going back to shareholders. Now there's three reasons why I do not recommend averaging down into young companies or companies that do not pay dividends. Number one is position sizing. Number two is time value of money, and number three is the risk return ratio. And I'm going to justify all three of these to you right now. Okay, so the number one reason is position sizing if you get two or three investments into accompany and it continues to fall, how do you manage the rest of your portfolio position, sizing and diversification. Becomes very, very challenging because if you continue to increase your position size in that losing company, what ends up happening is you not only have a larger and larger loss, but you have more and more eggs in that one single basket. You have a larger portfolio of your cash in that one single stock. And so therefore you are less and less diversified. You have a larger and larger waiting in one particular stock, and you are now missing out on the other opportunities that are out there. That leads us to point number two, this is time value of money. Time is valuable. You need to understand that if you just hold $1000 in cash, you're gonna lose about 2% per year to inflation if you had just invested that cash into a Canadian GIC or even an American GIC, you can make at least 1.5% completely risk-free. So just that value of time rate there between inflation and making 1.5% is about a 3.5% difference just based on where you decide to put your money. And if you decide to put your money in a losing stock, you have made that difference even significantly larger. Therefore, it is much, much better for you to cut your losses early, invest that money into at least a GIC, if not a winning stock. And then when your stock that you are looking at averaging down into actually finds a bottom and starts to turn around. That is when you should put your money into it because otherwise, you are tying up more and more of your money over time that it's just going to average down and lose money instead of either keeping it in cash and losing 2% or putting it in a GIC and making 1.5%. So there is time value in your money. The more time that your money is tied up in a losing stock, the more money they you are losing because you are not making money, you are risking the opportunity cost. Now the last point that I want to talk about is the risk return ratio. So this one is really important and this is actually the biggest factor for me. So as you average down, the more times that you averaged down, the risk return ratio gets worse and worse and worse. And so I'm break that down for you in an Excel sheet so you can see exactly what I mean by that. So let's use an example and we have to make a couple of assumptions for this. So let's say it is a $5 stock that loses 5% per month. So it starts at $5 and then it loses 5%. And you can say that this is per year, per month, whatever timeframe you want. This is just an example. And so the stock loses 5% per month and you invest $500 per month, averaging down into it. Now, again, you can extend this out over any number of time periods or however long you want, but this is what the math looks like. So there's a lot going on here. Let me just break down the columns for you quick. On the left-hand side here is the months. So month one to three, if you want to use years, you can as well. This is the stock price at $5 and then minus 5%, minus 5%, minus 5%, an investment going in a $500 per month. And this is our total investment by month. So you can see at the end of 12 months we're at $6 thousand in total investment. This is the number of shares we are purchasing with each and every single month. As you can see, it gets higher and higher as we go down because the stock is getting cheaper. And this is the total number of shares that we've purchased in total. So at the end of 12 months is first and won't 1616 shares. Now, here's the important price here. So this is the average price. So obviously on your first Monte buy a 100 shares at $5, your average prices $5 when he buy in the next month and the stock is 5% cheaper, your average price is $4.87. And obviously we can go all the way down here. Now where the real math comes in here is the spread. This is the difference between your average price and the current market price. And what I'm trying to point out here is that the more times you average down, the larger the gap will be between the current market price and your average price. So for instance, let's say you average down using these assumptions ten different times at the end of the tenth period, your average price will be $3.93 sets. However, the market price of the stock will be $3.15. And this difference there, this spread there is $0.78. And so now the stock has to go up by $0.78 before you can even break even $0.78 on a company like this, that's $3.32 is about 20% of where it's at. And so you need the stock to go up by 20% just for you to break even. And the more and more times that it averages down, the higher and higher that spread is in the higher and higher return you need just to break even on your stock. So as you can see, if you average them once or twice, it's, it's not really a big difference here. But as you average down, let's say 12 times there's an $0.87 difference between your average price and the actual stock price at the time, which is $2.84. So there's an $0.87 difference on a $2.80 doc that's like 25-30 percent difference just because you average down. Now, obviously, this is an assumption. These numbers are just simplified. Obviously this isn't exactly how it works, but this chart does explain that principle of the more times you average down, the larger that spread becomes and it becomes harder and harder for you to make money on that stock. So what is my advice? Well, my advice is to cut the losers quickly get into a position, set a stop-loss on it. If it crosses your stop-loss, get out of that position quickly. Take the loss taken in your mind and say, yeah, I was wrong on that. I'm going to wait for a better entry point now. And that's how you should handle these talks. Because what that allows you to do is have that money and keep that cash that you can reinvest it into the next best opportunity instead of being tied up in an absolute loser. That is the goal here, is to maximize the return on your money and you cannot do it if it is tied up, averaging down. So the goal here is to free up your time and free up your cash. Find another opportunity that is the best advice I can give you is do not sit in a loser ghetto, cut the loss and find another opportunity that is going to be a winner. There's so much opportunity on the stock market right now. All you need to do is do some research, do a little bit of digging and find the stump. Find the company that fits your profile. So in summary, averaging down is not a good idea. In most cases, the one scenario where it is a good idea is if it is generating new cashflow. So if a dividend is still secure in that dividend hasn't changed, but the stock price has fallen, then I do recommend averaging down, but anything other than that, it's usually about ideas. So you should cut the losers quickly.
62. The Most Important Lesson: What's up, everybody? My name is Zak Hartley, and welcome to my channel. In this video I own go to explain to you one of the most important rules you will ever learn when trading the stock market, and that is to identify the larger trend. What I mean by that is identify what is happening in the broader market so that you can extrapolate that into what's happening in your individual stocks. And we're gonna die right into that in this video right now. So let's jump into my screen right now. I've got the Dow Jones industrial pulled up here on a six month average, using the candlesticks on the left side you can see basically coming in here superstate e stupor, consistent with consistent gains over the last basically 34 years. And then all of a sudden, the end of February hits the beginning of March and the basically Dow Jones industrial completely tanks all the way down toe below 19,000 points on March 23rd. That happened because all of the government shut their borders. All the all the governments put in restrictions. Social distancing went into full effect, and basically different economies completely shut down. After that, we saw three higher days of trading on the Dow Jones industrial, followed by a continued trend for about a week and 1/2. That was the trend reversal. And now we're have entered into a period of consolidation for the last basically 3 to 4 weeks, the Dow Jones industrials being trading horizontally within this period of consolidation at about 40% of where it waas from its high. Now, this is really exciting for a trader because we have just had a massive reset in the market , a complete re correction. And now we're trading in a consolidated time period, about 40% of where it is. What that means is that the great companies and the companies that are gonna be able to handle cove it and are going to be to get through this are gonna be doing much better. They're gonna bounce all the way back and even higher. And the companies that aren't going to be a to handle cove it that are going to struggle through this for the next couple months are going to continue to state low or stand a period of consolidation. Now I'm gonna show you exactly what I mean by this when we look at a couple of stocks. So just to reemphasize this Dow Jones completely crashes march 23rd all the way down, comes back up about 30 to 40% of the way and then consolidates for a period of 2 to 3 weeks . We're gonna look at a couple of cases here where now we have identified the perfect buying opportunity. The 1st 1 I want to look at his Facebook. So when we go to Facebook here, we can see just on immaculate and immaculate thing here almost the same thing. So we're trading over or was sent this to six months. You were looking at this exact same chart. So steady, consistent growth over here on the left absolutely plummets all the way down between the march 16th and 23rd and then it starts to come back. And the amazing thing here is that we have just broken through an all time high. So this was the previous high for Facebook. Yesterday we had a breakthrough off that high, and today we have confirmation off that trend. So what's really amazing here is if you were looking at Facebook and the Dow Jones. You could have seen the Dow Jones take a drastic trend and you could have sold your Facebook shares right in here. You could have followed it all the way down to the bottom here. And then when you saw three positive trading days on the Dow Jones, you could have re bought your Facebook shares rating here on the 26 27th. You could have wrote the shares from 160 all the way up to 235 which would be in phenomenal gains just by using the Dow Jones industrial and thinking about it. When we look at Cove, it people are gonna be on their phones. More people are gonna be using Facebook more. It's not gonna be hit nearly as hard as any other business will be. And so Facebook could be a great investment through covert. And when we look at this, we saw one across over in the Mac D to a coming out of the RC three complete trend reversal with increased volume and four, we're now approaching the all time highs with a breakthrough. So I am going to consider buying this stock right now, I'm looking at it for a long term investment, or at least a little bit of gains as we continue to break through this all time high. And I think this trend of pate Facebook being an instagram, especially being more popular throughout Cove in I think this is going to continue. So I think Facebook is a great buy right now. I'm gonna save this. I'm gonna consider buying it later in the day. An accident of this exit charts a change. Yes. Default upload. Okay, The next stock I want to look at is square. Now, I think this one is really interesting because it shows some amazing, amazing technical indicators. So this is the chart that I have about. As we can see, it is a little bit longer, so we can go all the way back to 2018. When the stock hit a high of $100 it fell all the way down to $50 in, lost 50% of its value in less than six months, a very volatile and drastic move and then since then and has been trading within a period of consolidation. So it hit all the way down to $50 and since then it has hit this 82 $83 mark 123 times during Cove it it bounced all the way down to below $35. Remember, this was $100 stock that was now down to below $35 it was started at $85 US in two weeks before that. So from 85 down to 35 now backed up to $81 and is testing this 81 to 85 zone for the fourth time right now in the last two years. So I am super interested in square, especially if it can break through this basically horizontal line of resistance. And get through this doubt means it would have broken through on its fourth attempt. That's a pretty strong breakthrough, and I think it could easily climb up to 100 if not break through 100. I also really like their business model, and I think it's a solid company. It needs a little bit of help on the CEO sectors. Jack Dorsey has his hands full, but so much potential worldwide for this technology especially when you look into the developing countries square so much potential to expand and grow. I absolutely love this company, and I think it's great potential. I'm watching this extremely closely right now. 1234 times we have hit this 81 $85 mark and this could be the opportunity to break through . But if you look at this, we were looking at it last time. We saw a little bit of a breakthrough and then we dropped from $85 all the way down to, like, 31 $32. So we have to be very careful with this stock, but great opportunities and get in and out of it. If you can pick up on the trends next one, I want to look at his Microsoft. So we're gonna go in here Microsoft. So this one is also super interesting. I'm looking at this one basically over a two or three year time period and we can see super strong, steady growth all the way. And I'm gonna narrow this him down to one year because it's super super interesting here it looks almost identical to the Dow Jones super steady growth 1 85 We come to the end of February, beginning of margin drop all the way down to like 1 35 and then it comes all the way back up and it is retesting. The highs now it's really unique about this is if you look at Facebook and you feel like Microsoft, they're both retesting their all time highs. If you look at square, it's retesting. It's two year high. So what? What I really like about this is there's three companies right there that are not going to be extremely heavily impacted by Cove. It they're all gonna be impacted. But they shouldn't do very well in it. And there have already rebounded much more than the Dow Jones and all very similarly, which means we can understand it. We can read it and we can predict it now. When I'm looking at this in the next couple of weeks, what I want to look for is if the Dow Jones starts to recover and one or two of these stocks starts to break through, significantly break through one of these all time highs. That is a clear trend that all of these stocks are more than likely gonna break through their all time highs. As we see a bit of an economic recovery in these different countries, particularly the U. S. And Canada, this could be the great opportunity to predict the trend, get in on it and make some really easy money as we break through those all time highs and then sell it the next dip. This could be the opportunity that we've been waiting for for a little while. So Microsoft, another huge opportunity, looks identical to the Dow Jones drops all the way comes all the way back. Same thing with Square. Same thing with Facebook. And there's one more than I want to look at. And it is Lulu Lemon so completely different industry. We're now going into retail, and once again we see almost the exact same picture. Strong, steady growth over the last year and 1/2. And in February beginning of March, the stock drops almost almost 40% from $260 all the way down to about $130 all the way down here and then back up to $261 today and we're testing those all time highs. So, cove, it basically put a 2.5 months pause on. These three stocks were looking at Facebook. We're looking at Lulu. We're looking a square with looking at slows. The other one I talked about whatever it waas Microsoft. But all of Omar near those basically all time or two year highs because they're gonna do extremely well with Cove it They all reacted the exact same to Win Cove. It hit Covitz starting to recover. And these are the companies that are going to recover the best because they're less impacted by cove. It they're all trending in the same channel on we can predict these patterns. I have my eyes super close on all of these. And if they break through these all time highs, I am going to be a huge fire on all four of these stocks. So this is what I'm looking at. This is why I'm keeping my eye on. And this is where I want to be now, the real key here and the real trick would have bean to see the Dow Jones crash cell or short sell all of these stocks and then want to start to recover by them back and ride this entire hyo. But there was a ton of volatility in the market, and you would have had got pretty lucky to time that right? So we're gonna wait for our technical indicators and our patterns and our moves to arrive. And if we see a breakthrough here, that is when we're gonna look at considering to buy this stock. So those are the four that I'm looking at today, if you have any interest or any comments or questions about what I'm doing or you completely disagree with me sending comment below. But if you get any value from this police, let me know about it. Show some love, show some appreciation. I truly support it. And I hope you wanted a little bit from this video. Thank you.
63. Course Summary : stock market basics course. This is the course summary video, and in it I just want to go through some of the main topics and some of the mindset initiatives that you should be thinking about as you've wrapped up this course. But before we get into that, I just wanted to say quickly, thank you for paying attention all the way through. It really means the world to me. Hopefully, you learn something out of this, and if you have any more insights or you want to ask questions, you want to reach out to me, please send me an email. It is in the description to this video, and if you're interested, I also have a patron account where you can see my live portfolio holdings as well as some of the recommendations as well as all of my technical analysis. So please check that out. But in summary, let's get into it here. The main points that I want to cover the reason this course is valuable is because stocks are valuable and the Dow Jones, the S and P in the TSX, on average of the last 50 to 100 years, produced a return of 7 to 9%. That's higher than most real estate. It's higher than gold or silver, higher than bonds tired than G. I seize, and it's higher than almost any other type of asset that you can put your money into. Stocks have in the past had some of the best performance amongst any asset class. They are more volatile, but over the long run they produce some of the highest returns amongst any asset class. And that's why you should be invested in stocks and why you should know how to invest in stocks. And hopefully we did a little bit of help in providing that knowledge here to you today. Secondly, trades execute, Wanna buy and sell order match Any time you want to buy some shares, there has to be somebody on the other side selling those shares. When two of those orders match up. That's when your trade executes. And that's when you have either bought or soldier shares. And when we look at figuring out when the best time to buy or sell those shares is we used to different methodologies, fundamental investing and technical investing, Fundamental is largely basically looking at the financials and technical investing is largely looking at the charts. We're gonna go into depth in both of those real quick here. So technical investing. This is when you're looking at the charts, looking at the price action or the price movement on a chart and trying to figure out where we're at and where we're going. The idea here is you always want to start with the big pictures to look at the global economy, look at your country's economy, look at possibly an industry index and then go down to your company and figure out. Is it in line with what's happening in the big picture? Or is it going against what's happening in the big picture just so that you are aware off what is happening overall? Secondly, understand your indicators, so you have your price action. That is the main indicator. Putting trend lines on there that is the main that is, the key toe everything here and then you use your indicators to justify your position and help reinforce your assumptions. Based on the trend lines and the actual price movement. The key here is understanding your indicators. Which ones apply which ones work well with your stock and not overloading it. Do not dumb 30 different indicators onto your chart because it's going to confuse you. It's going to give you bad information. You want to apply three, maybe six different indicators to your chart in the beginning and then build on your strategy from there. Speaking of that, you have to have a strategy. Go into building a portfolio or go into day trading or going to swing trading. But make sure you have a strategy for when you're gonna buy when you're going to sell, how much you're gonna invest, what your risk tolerances and what the plan is. Overall, make a plan for each and every trade you make. Where do you want to get in? Where do you want to get out where you're gonna put your stop loss? Are you gonna take profit all at once? So you're gonna break it down into segments. Lastly, make a plan for every trade, just like I just mentioned. Every trade you execute, you should have a target price that you want to get out at. You should have a target price that you want to get in that you have stop loss or If your dividend investing you should have a certain yield that you're trying to get from the stock every single year. And if you are not getting that for whatever reason, then maybe it's time to re balance afterwards. But you need to have a plan for each trade with a get in a get out. Unless you are planning to hold that for life and pass it on, you just need to have a plan for it. Fundamental investing The big key here is value versus price. What value are you getting for what price? And as soon as the value is higher than the price, That's when you may want to make your investment. The big key here is understanding why you are buying the stock if you're buying that stock because it is giving you cash flow through a dividend that if you buy it at $100 in the price job soon to 80 then you should probably be buying more because it's giving you basically a price that's on sale compared to 100. It's still giving you the same cash flow. Otherwise, if that's not your mindset, you probably shouldn't be dividend investing and looking at a stock like that. Thirdly, build a diversified portfolio. Build a portfolio with a couple different industries. A couple different companies that have low correlations so they're not connected. When one risk takes out one of the stocks, it is not going to impede the rest of the stocks here. That's what diversification meat, and it helps you build long term, steady returns instead of huge different fluctuations based on market volatility and specific risks, fourthly, learned to manage your own portfolio. If you can manage to pick and choose your own stocks, that's a great way to save some commission safe. Some management fees have have a little bit of sense of mind about what you're actually investing in and feel good about it as long as you're doing okay with it. Otherwise, pay a manager to do it through an E T F index feet and manage it that way. Instead of getting fully hands off in summary, the more you can understand about what is happening and why the better position you will be to take advantage of the change. What I mean by that is, if you understand how the stock market works why the prices air changing, How to understand why the prices air changing and you can start to piece together the different parts of the puzzle. You can see that when the next virus hits, cruise lines are probably going to sink again. That might be a great times. A short cruise lines if they bounce back over the next five or 10 years. And another virus it's being able to connect those dots is really the key here. And the other key that I just want to touch on is it's not technical investing verse fundamental investing, the real strength years when you can use both of those. If you can identify a stock that is undervalued and then by it on a dip that you can see in the technical analysis, that is the best combination and the best way to get the maximum returns. So being able to utilize both fundamental and technical analysis to get the best entry and exit points is going to serve you the best over time and help you get the best return. So the challenge here has become an investor that knows a little bit about everything and then specialize into one strategy that you find works for you and how it's meet your personal goals. Everybody's gonna be different. So you really gotta have a strategy here. The last thing I want to do is talk about a couple of quotes just because I think they do a really good job of establishing the correct mindset when you're investing in the stock market. The 1st 1 is from William Feather. It says. One of the funny things about the stock market is that every time one person buys another cells and both think they're stupid, what he means by that is when you go in and you buy some little crazy biotech company that you think is just gonna blow up over the next couple of years, well, there's somebody else that's selling that stock that probably held it for the last couple years. That's now selling it because it didn't blow up. So just keep in mind that any time you buy their somebody selling and think about in your head, are you sure you should be buying this right now? Somebody else is selling, and the vice versa, just as a quick double check, because this is a great explanation of how the stock market works, as well as what's happening in people's head as the price changes. Secondly, the stock market is a device for transferring money from the impatient to the patient. This is Warren Buffett. Warren Buffett is a long term investor. He relies on dividends. He relies on cash look, and he relies on money coming into him. And the best way to do that is to just wait it out. Once you have an agreement, would you have a stock? Once you have a company paying, you do it and it's time to sit on your hands and wait for the cash to roll in. But it takes a lot of time, and Warren is extremely patient, so he has no problem being patient and waiting for that money to come in and transfer from the impatient to the patient. And that's him. So the key here for Warren Buffett is long term investing. Make sure you have something that is going to meet your goals and then sit on your hands and be patient with it. That's the big thing for war. Lastly, this is Albert Einstein, and compound interest is the eighth wonder of the world. He who understands it earns it. He who doesn't pays it now. Compound interest is a pretty amazing thing. It's where you make money on the interest that you made last year. The same thing applies to dividends. The same thing applies to your bonds. If you have a bond out there that's paying you interest, and then you go invest that interest into another bond while you're making compound interest right there. So there's a lot of different ways to do it. And the key here is to be on the right side of it, bringing your dividends bring in your interest, whatever it is, just make sure you're on the right side of compound interest because Albert was right and this is the key to financial freedom later on. So if you have any questions, please reach out to me. Check on my patri on, check out the rest of my videos. My name is Zak Hartley. Thank you so much for joining along in this course. I'm really glad. And I hope that you got something out of it. I'm really glad that you were here and thank you. Peace
64. Stocks to watch during Covid-19: What's up, you guys? My name is Zak Hartley, and in this video, I'm gonna walk you through three stocks that you should have your eye on right now. Two of them I'm about to buy and one of them I am going to buy in this video. So stay tuned. Let's jump right into it. Okay, so on this chart here, I'm looking at Lulu Lemon over a six month time period. I'm going to quickly annotated just so I can show you exactly why I'm interested in this chart and exactly what I'm looking at. And it is because of this high right here. So I'm going to save this exit. That So this is what I'm looking at right now. So, February 2020 Lululemon hit about $265 they hit their all time high cove. It hit and the stock fell all the way down to $130 fell from to 60 to 1 30 fell by 50% in less than a month's time. Since then, it has recovered all the way back up. It has now hit $276 in it has broken through the all time high that was set previously. Now the reason that I am super interested in this is because the economic recovery is starting to happen. Right now, things are starting to open up. People are beginning to feel more comfortable spending money, and we're actually going to see some money coming back into the economy. At least that is my prediction. However, if we go into shutdown number two and the entire countries locked down again, this could change pretty quickly. So I'm keeping an eye on this one. But I'm looking at Lululemon right now. They just broke through their all time high. There are $276. The technicals don't look terrible. I still in there some room to run. And it is a great, fantastic company. I absolutely love what Lululemon does. Their product is phenomenal. They have a cult following and I think that they're online Sales will really go up over this covert time period and I'm sure that their in store sales will resume basically back to normal as soon as this is over. So that is my assumption on New Lemon. I absolutely like this stock. I think It is a great a great company to own. It is at its all time high right now, and it is about to break through its previous all time high, and that is why I have my eye on it right now. Now the other company that is similar to this that I'm keeping an eye on, actually, let's go through my chart list here is Facebook. I'm super interested in this one because it is showing almost the exact same patterns. Super study and the February hits Beginning of March Stock plummets almost down 50% and it comes all the way back up, and it is now in its third day above its previous high prior to covert 19 soap. I really like Facebook. I think their business model is also great, especially if Cove it locks down again. Something happens with Kobe, no matter what it is. People are buying online, people are advertising online, and that is the model behind Facebook. It's also become more popular as people are on their phones more often during locked down. So I like everything about Facebook and has just broken to its previous all time high. I think this is a great buying opportunity. It is Memorial Day in the United States, so I won't be it to buy Facebook or Lulu today. But I'm looking at both of them, showing very similar patterns in line with the Dow Jones. I think we're going to start to recover as an economy, and I think these two companies are gonna be very well positioned to see gains from this period out unless we see a drastic change with how the government's handle cove it in American the and canned in particularly now. Those are the two companies that I'm looking at that I want to buy into that. I'm waiting for tomorrow to open. Let's see what happens and I'll probably buy in. However, there is one company that I want to buy into right now, and it is a Canadian company, so it's good for me. I could buy it today. It's called the Simply Good Foods Company. No, that's not it. Good food, real good food. It's not even on here. What the heck Food. There we go, Good food market. This is the one that I'm interested in. It's a Canadian company. They're based in Canada. They do an awesome product. They're absolutely phenomenal. I've tried the food. It's really good. They have quick delivery times and they are expanding like crazy. So number one, let's look at the technicals. And then we're gonna go into the fundamentals and tell you a little bit more about why I'm buying this stock at the moment. So super steady stock all the way across 3 25 3 50 in that kind of range all the way across Cove, it hit the stock drops to a dollar 50. It fell by more than 50% of the more than Lulu and Facebook. And it came all the way back up even faster than Lulu on Facebook, which is absolutely amazing. This is some crazy volatilities, so you need to be really careful with it. But in a period of less than a month, it fell by 50% came back by 50% and now it is up by another basically dollar $20.30 almost another 50% there, so really amazing, honestly, A pretty amazing recovery. But here's what I find really interesting about it. So good food. They're basically like at home meals they deliver to you cook it and it's everything that you need to make a meal there really quick, really easy. All the ingredients are all set. There's a bunch of companies that do this, but why? Like good food is I went to their website is what it looks like good food. And you can tell that when you go to investor relations, it takes you here and you can see their financials. So when go to financial statements, this is what I'm really interested in here because I like to see the growth. Now when I go to their revenue here, you can see that their revenue the three month and six month period ended February 29th. So this has absolutely no March, April or May in it. It ended February and their revenue year over year went from 36 million to 58 million, almost 59 million. That's a 40% increase, almost doubling their revenue. Absolutely amazing huge growth of this company. Now this is a growth company. It's really important to say that it's a growth company. They might not be making a ton of money, but what I do like about this company is that they're not losing a ton of money. They're bringing in 58 58 almost $59 million in profiting $18 million on that, and they're only losing three million. They're almost doubling their revenue year over year, and they're only losing $3 million. I can take that loss without a problem without it even hurting if they're doubling the revenue year over year and hardly losing any money. I absolutely like those financials. That is a good ratio to me. They've almost completely doubled their revenue from 2019 to 2020 with the trailing 12 months. And not only that, but they have a ton of cash on hand. They have $67 million worth of cash, and they only have $35 million worth of current liabilities, so they have tons of cash to handle anything that's gonna happen in Cove. It they're almost doubling their sales year over year, and that doesn't include Covitz. So we'll have to see what happens there. And it's a great company with a great product that is significantly growing. So the other thing that I found here that I really liked was there basically investor fact sheet. It was this link rate here, investor fact sheet, and you can see here that it's okay. Canadian market With active subscribers reaching 246,000 people, that means a quart of a 1,000,000 people subscribe to good food and order their products. Number one that's a ton of People number two. That's a giant increased 55% in Greece compared to last year, and number three, that business model is phenomenal. You have people ordering products from you consistently with recurring revenue, safe profit margins and as soon as you have a supply chain locked down, all it is is just continually servicing those customers. So I absolutely love the business model. I like the financials. The growth rate is phenomenal. Everything about it is good. And here's Here's the kicker. Here's why I really like this right now. Is the current cove in 19 Pandemic has had no impact on the financial results of the quarter ending February 29th 2020 but will impact our 33rd quarter results. We expect the pandemic to have a positive impact on revenues with increased subscriber growth, order rates and average order values, but also expect our operations to be impacted by staffing and supply challenges also caused by the pandemic. So I agree. Staffing and supply challenges are going to be a challenge. However, if you can get past that, I do agree with them that they're going to see an increased revenue. Because of Cove in 19 people are finding different ways to get their food easier. Ways to get their food. Nobody wants to fully cooked three meals a day, and good food has great market presents, a great product, continued growth. And I really like everything. They're doing their great market fits. So I'm looking to this company financials or great technicals. A great business models. Great. I'm looking at the chart right now. It's a little bit high. I totally agree with that. It's a little bit high right now, however, this company is doubling its revenue every single year, and it almost didn't move for the entire past year. Are gonna break this down? Let's go to three years and let's see what the larger chart looks like. I always say that start with a larger trend and then break it down from there. That's exactly what we're gonna do here and we can see, Since 2018 this stock from 2018 all the way to 2020 traded almost at exactly $3.25 in that range, plus or minus about 50 cents. So for the last two years, this stocks almost no movement from $3.25 all the way until Cove in 19. It's up about 30 40% since Cove in 19. But in that two year period, it was complete consolidation at around that $3.3 25 marks. So what that tells me is, for the last two years, the company didn't see a lot of stock price appreciation recently with Cove it and everything happening. There's been some action here. However, I do think that there was a build up over those last two years where the stock price didn't move and it probably should have. I think this company is great, and I think the valuation is a little bit low right now, So I am going to be a buyer of Good Food Market Corp because Cove it's gonna help their numbers. I think they do a great product. I absolutely love their business model. They have tons of cash on hand. They have consistent revenue and repeatable revenue coming in. And the stock price hadn't moved in the last two years. Prior to Cove it. I think we're seeing a little bit of volatility right now, but I think the stock has a ton of room to run, so I'm gonna buy into it, and I'm gonna buy in right now, So okay. Keep working. Good food. $4.60. 1000 shares, probably by 1000 shares. Puts me at about 5% position. So that's not too bad. We're going by 1000 shares. Canadian Market Price Day. Any part doesn't matter. Continue this boom, boom, boom. All right, confirm my order. There we go. And order submitted. I now own 1000 shares of Good Food Market Corp dot com. It is in my portfolio and I will keep you guys posted on how we do over the next little while. If I make money, if I lose money, I will keep you posted. And I will tell you, just so you know, I am in this for period of a couple of months. That is where my initial mindset goes. If things changed drastically with Cove, it and the restrictions get set back in. I may accept this stock a little bit early, but my mindset is I'm in this for probably a couple weeks to a couple of months. I expected to go up. If I cease amiss, significant games right away, I'll probably get out and take my profits. Otherwise, this could be a couple months play or even a long term hold. If I continue to like the company over the long term, so we will see what happens. I'm gonna keep my eye on it over the next few days here. I'm also going to keep my eye on Lulu and Facebook. I want to get into those. Probably this week if this trend continues, but we'll see what happens. We're gonna continue watching the Dow Jones and the S and P to try and get an idea and a read for what the general markets going to do. And then we're gonna make her trades from there. So if you have any questions, send me an email. I hope you got something out of this video and we will talk to you soon. Bye. For now,
65. Buying FB and LULU: What's going on, everybody? My name is Zak Hartley, and in this video I am going to be buying two different stocks, Facebook and Lululemon's. So let me show you exactly why I am buying those stocks. First of all, I am looking at the Dow Jones industrial average. This is just kind of a reflection of the United States in general. And we can see something really interesting emerging here. First of all, really study. Coming into Kobe, Kobe hit the Dow, Jones completely plummeted. It started to come back. And then, like I pointed out in one of my earlier videos, we're in a period of consolidation. It started about 1/3 of the way through April, and what's really interesting is today we just had ah, break out of that consolidation. So what I mean by that is we had price action today where the open and the close today were higher than the previous highs throughout that consolidation. And you can see that illustrated in my chart here by this little block right here. This is the price action today, trading well above this blue line where the previous consolidation happened. Now what that shows to me. What that makes me think in my head is okay. Done with consolidation, we're seeing continuation off the economic recovery post. Kobe, That is what I think is happening right here. The country completely shut down and start to come back. We had a couple weeks off. Okay? What's really gonna happen here? We're starting to see the light at the end of the tunnel. We're starting to see different things. Open up, different businesses open up. And that's gonna meet more spending and better earnings. So we're starting to break out of that consolidation. So that, in my mind, is what's happening here and now I want to get on the upside of that, and I want exposure to it. So I am buying into two stocks Facebook and Lulu Lemon, because I think they have the best upside during this economic recovery and because they both just broke through their previous all time high. So let's dive right into it. Start with Lululemon. This one's really easy to see. Super clear pattern. In 2019 the stock was trading very bullish all the way up to $260. Cove it hit. The stock fell all the way down to $130. And since then the stock has climbed all the way back up to its previous high. Even through that period of consolidation in the Dow Jones, Lululemon has continued to trade a higher and higher because they are want a great company to have great e commerce sales and three make a great product with a cult following. So I think that that business is going to continue to grow. They make a phenomenal product in their market share, is growing there, also expanding where they sell their products. So I really like Lululemon. I like everything they stand for. The company is phenomenal and they're now breaking out basically that consolidation period where we hit our high and then we dip down with Kobe. We came back up and now we're breaking through that previous high. I want to ride that out and see if I could get into this continuation of a bullish long term up trend. So that is lewd 11 that is number one. The second company that I am going to be buying right now is Facebook. Here's exactly why we see a similar pattern this is on a smaller chart. We're only looking at six months, but you can see the previous high of around $220. Kobe hit the stock dropped by 1/3 all the way down to $140. And since then, since then, in the middle of March, the stock has recovered all the way back up to above $220. And where you can see here is we have three positive days above $220 then we have today's trading, where we hit $240 then came back down to $232. Now what I really like about this is one. It was the fourth day above that basically previous high. So it means we're getting close to really confirming this trend. Number two is we closed higher than yesterday's open, so we have not established a new low, were still higher than we were the previous days, and that means that we're continuing that uptrend. Even though the stock basically lost 4% from its open today, that is OK, we're still within that uptrend. And what is going to mean for us is. We can get in at a better price. And the options are gonna be cheaper if we decide to go down that path as well. So Facebook and Lulu Lemon one. We had a break out of the consolidation of the Dow Jones And then both of these companies are now at all time highs after a recent breakup. So I want to buy both of these companies, so we're gonna go right into RBC and get into my bank account, So I'm gonna blurt this out so you guys can't see it, but let's get right into it and let's buy these stocks. Okay, So the 1st 1 that I'm gonna buy his Facebook, we're gonna buy into this and I'm gonna buy a $5000 position. So I'm just gonna do the quick math on this really simple 232 divided by 5000 towards other way around Story 5000 divided by 2 32 I was 21 shares, so number shares in 22 shares That will be just over 5000 US. We're gonna buy it. I'm going to use this account. Boom boom will buy it at the market price. It's currently for 48 so it's a little bit late right now, but I'm gonna buy a market price tomorrow. Now, I'm planning to hold this for a couple weeks to a couple of months. If it continues to really go up, I might even hold a long term. And for that reason, I'm not worried about setting a limit price. I'm not worried about maybe 10 or 15 cents I might be able to save by setting a limit price because over the long term is not really gonna matter. And I just rather the convenience on this trade in particular. I'm also not going to set a stop loss on this right away because I am going to be watching it every single day, almost all day for the next week here. So I don't need to stop lost, because I'm gonna be on top of it. If I was planning to walk away from it, We're not really Look at it for a little while. I definitely set a stop loss, but other than that, I just confirmed the trade. It was $5100. U S. About 5% of portfolio. That I'm working with and we're all set and good to go. So that one is traded. The next one we're gonna do is Lulu. I'm gonna buy these shares. Okay. There you go. Well, sort of the same price. So we're in Bye bye. 20 of these shares. It's like my count we're gonna buy from the Canadian account number shares by 20 of those at the market. Price continue and price on this is $5600. So I just bought into Apple. Just bought into Lulu will confirm both of these and I bought in because they're in line with the Dow Jones so I can predict the trend here. The Dow Jones is breaking out of consolidation, and both of these companies are breaking above their all time highs. So the fundamentals and technicals of these charts look absolutely great. We're seeing an economic recovery, especially in the United States and in Canada with these companies primarily operate, Facebook is online, and online sales are driving incredibly high, and most of them are using Facebook to advertise. And as soon as people go back into stores, Hank Lululemon, one of the number one place is that they shopped as they look for quality. So I really like both these plays. I've placed orders on both of them. And if you guys were interested in taking a look at my portfolio, definitely check out the Patriot account. We can see everything live what stocks unfolding, what stocks I'm selling and why. But without any further do, that was the reason I bought Facebook in blue. I can predict them with the Dow. Jones got break out on the Dow, Jones got a break out of bull stocks. The technicals look good, and I'm gonna monitor them over the next couple days in case I'm wrong. I do expect Facebook to test this to 20 mark. So if it comes down to 2 20 of them still gonna hold it. If it drops to 2 10 25 that's where I'm gonna really question things. And if it drops below 200 I will have lost about 10 or 12% there. That will be my total cut off because it will broken the support here at the 200 range where I think we should have a fair level of support. So in the long term, I'm hoping for this to go up there, I could just keep it and hold it. I do expect some short term gains over a little while, but it could test the to 20 and all way down to the two of five zone. If that happens, it's worst case scenario and it will probably be pulling the trigger on it. But that's my training plan right now. If you have any questions, send me an email now we'll talk to you guys soon.
66. Buying Shopify Options: What's up, everybody? My name is Zach Harvin. Today we're gonna be buying options in Shopify. All right? So, like I said, we're going to buying options and shop by. And the reason we're doing that is because I just sold half of my Air Canada options position at a massive 136% gain. If you want to see that video throwing a little tab up here and the link down below, But I've got my $5000 back, I've still got $5000 sitting in Air Canada. That is pure profit. So we want to reinvest that original $5000 the company that I'm looking at today's Shopify So I really like Shopify. If you look at some of their financials, they're doing amazingly well, I'll just pull up there. Last quarter announcement on the first line in it is first quarter rather Negroes 47% year over year. There are very, very few $1,000,000,000 companies. They're growing their revenue of 47% year over year and shop buys one of them and they're doing amazingly well. So I want to get in on this upside now. They just announced their financials on May 6, which needs the next set of financials, is probably gonna come out in about three months. So we go June 6 July 6 August 6. They're probably gonna come out sometime in August, which means I want to buy options for September or October somewhere in there. So let's look at RBC. I'm buying it in the US right now because there's a little bit more volume on the options compared to the Canadian market. I'm looking at an expiry of October 16th. I'm gonna be looking to call it now. This doctor now string at $747.33. It has traded as high as 850 within the last month. So it came up. It's got a little bit of a correction right now, and my plan is I'm buying it on the dip right now. That is my strategy. I'm planning on buying on the dip. I expect this trend to continue because shop by such a great company and with Kobe, I think shop by. Revenues are going to skyrocket as more and more companies come online and shop buys the number one player in that space. So I won't buy options for September October for probably around that 808 50 mark. Need a little bit higher. Let's see what we can do. Look it up. Some look for Shopify and I'm going to be looking for a strike price options. I'm gonna be looking for a strike price in October. October 16 is the day that the options expire. We have a straight parts right now $748 Aiken, by the $750 strike price for price of $103 which means my break even is gonna be around $850. Now, that seems really good to me. Let's just compare it a little bit lower. If we look at a strike price of $800 the current aspirin now for it is $84 which means my break even is $884. So this one is clearly a much better bet. I also like it cause the break even is 8 55 And if you look at our chart, we pretty much hit that 8 55 mark about a month ago So let's zoom in here. A and C were right at that 8 50 mark radio shop by. So all we have to do is break through a previous high on between now and October, and we will be doing extremely well. So I really like this training to buy these options right here on by one contract. It should be about a $10,000 purchase. So a little bit more than the games have you made on our Air Canada options, But that's ah is perfectly fine. That's wrong. Okay. Got our tomb, uh, about open being by one contract, single shop Boom. It's all good from from that trade. All right, from the straight. All right. And so here we go. We can see it right here. So I purchased it from my margin account. We bought it toe open. I bought one contract. Was a call auction. Meaning I am long on that contract. The symbol was shop, so I bought it in company Shopify. It expires month 10 day 16 year, 2020. So october 16th 2020 as a strike price of $750. That C means that it is a call same information right down below. Here. It's on the US market because it had more volume than the Canadian market. On the commission I paid on this trade was $11.20 U. S. And the total proceeds of the trade was 10,700. So being now owned shop by options were in it until October or until we sell it. I'm really excited and really confident with this. I think we're going to do really well. I do expect to hold this for kind of 1 to 2, maybe three weeks. I don't expect to get out of this right away, but it could be. Could be some big news coming out soon, especially within the COVITZ, so we'll see what happens. But if you get any of that value out of this, please remember shows love. Thank you.
67. 42% Profit on Beyond Meat: What's up, everybody Zach Hartley hearing today is a big dam finishing off, coupled different videos from the course, but it is March sixth and we're about to execute our cell of our trade on Beyond Meat. So if you'll remember, I filmed a video on April 21st about how I was going to buy beyond me based on the technical indicators. Well, it's ten trading days later and we're about to sell it. And I'm going to show you the results here. So when we get into it, I'm gonna go to my RBC holdings. You can see I'm going to click on my portfolio holdings. And when we go down, you can see I've got the exact same beyond me shares here, 50 shares. And today we're up 22% and overall were up almost 44% on the shares over a course of ten days or the trading. Now, just to show you that I actually traded them and show you the real history here. Here's my activity history. And as we scroll down, you can see on April 21st, we bought beyond me 50 shares and it actually executed on April 23rd. But we did buy those shares, are now holding them. And when we go back to my portfolio holdings, those shares are literally now with 44.27% more in value than they were when we bought them. And when we bought them. This is the chart that we used and I'll walk you through the entire step-by-step analysis that we use to figure out when to buy them. The stock went up. We had three periods of consolidation and fell all the way down to our initial IPO level, the initial level of support. And then we thought there could be a trend reversal. So we had one level of resistance based on the previous level and period of consolidation now is this red line here. And then we drew and ascending triangle with our green lines here, we saw the price rebound off of the 50 level. We sought breakthrough, the first-level of resistance we saw breakthrough the top line of the ascending triangle, and we got into it on April 21st. It executed on April 23rd at $84.50 cents. And today the stock is trading at a $122.46 sets. This is absolutely phenomenal. This has perfectly executed or trade. This is the exact result that we want and now it is time to sell those shares. I'm so excited and this one just worked out perfectly. So when we go into this, we can see the same holdings I've got beyond me or Google, Apple, and I just saw GoPro Today, we're doing pretty good overall. But Beyond Meat, we've coming and we're approaching that next level of resistance. I think we could see a turnaround and we've had phenomenal gains over a ten day periods. So I just wanna take these gains, get out of it and figure out when the next opportunity we'll be to either get back in or get into something else. So let's go through and actually sell this stock. I'm going to sell all 50 of it. A lot of people and a lot of times you can just sell parts of it. Sometimes maybe get your initial investment back or sell a quarter of it. What I'm gonna do here though, is I'm going to sell all of it. If we go back to the chart here, you can see we're starting to approach that next level of resistance here around that 130 mark. And I'm not sure if we're gonna get through that. And I've got some phenomenal gains right now. I'm going to take those gains, i'm gonna take those profits, are going to lock them in. We're gonna go to the bank and we're going to cash in today. So beyond me, 50 shares, I want to sell all 50 shares. Really simple. All I do is click on the cell button, my account comes up, boom, boom, boom. Number shares 50 beyond me, US market, market price. Any part, continue. Now it's gonna ask me to confirm the shares and basically say, Are you sure you wanna do this? I'm gonna say yes. Hopefully a should execute these shares right away. Now it is 1230 here, Calgary time to market is still open, so my order should complete right away. So Transaction Complete. Here's my order. Really easy to do. If I go back to my portfolio holdings, it should still be there, but it's not gonna shown extinct. So yeah, beyond me not showing me anything, but we just locked in $2600 worth of profit of 44% gain in ten days based completely off of the technical analysis in this course, completely off of the RSI, the Mackey, the trend lines, everything that I talked about in the first ten lessons of technical indicators, it came altogether we bought beyond me and less than ten trading days later, I'm now selling beyond me out of 44% gain. I don't know if there's any more proof anymore, anymore information, anymore legitimacy I can provide to how, how true this is or how easy this is or how much it works. But it just takes practice, it takes recognition, it takes understanding the patterns, and it takes time. We waited on it, we found the right day. I executed that trade. We $2600. We made 44% on a trade over ten days. And this is what it's about. I could've done that from the beach. I could've done that from applying. I could've done that from my living room. I could've done that from anywhere. It was super easy and we just executed on it. So if I'm looking at this chart now there's two things. One is it's going to completely break through this level of resistance here. If it does that, I might want to get back into it. Or two, if it bounces off of this level of resistance and I think it's going to fall back down. I might want to short sell it as well. So think about that anytime you make a trade out of stock, for instance, if you own a share and then you say, okay, I'm gonna take my profits while thinking about, Is it a good time to short sell this stock? Because it could be, it could be a great opportunity to make money on the same stock, whether it goes up or down. But you really need to understand that trade and understand the risk associated with it. I talk about more that in some of our other videos, but overall, we just locked in 44% gains over a ten day period while I'm filming this course about the techniques I'm using to get those kind of gains. So I'm super happy about it. I'm really happy with how things went here. We just locked in, let's see. I don't know if we can see what the actual settlement is. I'm sure that trade is already settled, so I've got those gains, I can transfer them to my bank account now and it's time to go for a beer. So anyways, I'm headed out wrapping up the course here pretty soon. Thank you for all the support. Go make some gains.
68. Taking Profit- LULU: What's up, everybody? My name is Zak Hartley, and today we're gonna be closing out our sale on Mu Lemon. So if you remember about a week and 1/2 ago, I made a video where I bought Facebook and Lululemon shares on a covert recovery. I thought, both of whom were gonna do extremely well Well, turns out they did do pretty well, and it's time to get out of them. So I'm gonna show you, Lulu, Right now. This is my history page right now. So, activity history. We bought Lulu Lemon on May 29th at a price. $281. It is now June 9th 2020. So it's been about a week to a week and 1/2 and they've done really well. So we're up about 15 16% on him, and I'm going to sell them, and I'm gonna show you why. So here's the shares were up 15.82% on Lulu Lemon. We've made over $1000 and this is what the chart looks like. So we're coming up, we're coming up, and all of a sudden you can see we had about 317 $118. And now, for four days in a row, we've been trading horizontal. The volume is starting to go down. The Mac D short and fast minds are about to cross over, and it looks like we could be about to exit the overbought zone of the R S s. So we have had an amazing run on Lululemon. We made a great 15% return when he had $1000 on it in less than a week and 1/2. And we've done extremely well on it. But I do think this trend has a probably 50 50 maybe even a little bit more likelihood off reversing now could always continue to keep going up, but I think it could reverse at this point, we're up almost 16%. We're gonna close this out. We're going to take our profits. We're gonna take our gains. We're gonna call it a day and we're gonna pat ourselves on the back for a good trade. And we're going to say we're gonna get out of this at the right time. So back in, back in rbc Right now I'm gonna go Lulu Lemon and we currently own 20 shares of it. I'm going to sell all 20 shares of my Lulu Lemon. Now I'm going to keep an eye on this because I may want to get back into it at some point later on over the next few weeks. But as of right now that technicals do not look great, I think there could be River. So one up, 15 16%. Let's just take those games. Let's call it a day, chalk it up to good trade and move on to the next one. Now I am gonna keep an eye on it, but we did pretty good on it, so we'll exit this. And there we go. So we just proceeded where we just brought in $6300. I put about $5100 into it, and we made over $1000 in less than a week and 1/2. So this is a lesson, and this is me saying when you have made some gains and there's a likelihood that that stock is going to turn around, take those profits out, take your money out and then continue to watch that stock because if it goes back up, it's super easy to get back in. But at least this way you've locked in your gains. You've locked in your profits. And now it's up to you on what you do next with that money instead of just riding the wave out with Lulu Lemon and playing that kind of 50 50 game that we're looking at so super happy with this, I'm gonna go back to my portfolio. We're gonna take a look at it. I'm going, Teoh. Continue to watch you, Lemon. I still think we're on an upward trajectory, but I didn't want to get out of X. I think we're about to see a crossover in the Mac D So it's a good day so far. Here we go.
69. 73% Profit Trade: What's going on, everybody? My name is Zak Hartley, and in this video, we're going to talk about Tesla Motors. I bought a position in them about a month ago and it has done amazingly well. We're up huge on this. And so now it's time to decide. Do we want to buy more? Do we want to hold it? Or is it time to sell? We've got earnings coming out in about two weeks, so it's definitely gonna be an interesting time for the company. And this morning, we woke up with, like, a 14% gain. So let's dive right into it. I'll show you what I'm looking at. Okay? So I'm just gonna refresh the page. You can see what I'm looking at. This is one of my accounts. I mean, the activity history. So you can see the trays of made. And as you can see here on June 10th we made a trade for three different stocks. You bought Tesla, Amazon and Microsoft for Tessa. We bought five shares and I was on June 10. So now if we go to the actual portfolio, this is really cool. No, I don't want to see the SDR Holdings. There we go. So if we go to the port full and you can see how the stocks are doing and it's doing really well, so Amazon, Microsoft and Tessa they're up 25% 8% and 72% respectively, and were also up 200% on my apple investment. And just the rest of the ones that I home well, 13% on Facebook were 40% on good food market were up 17% of Google, so the entire portfolio is doing extremely well. I'm up on every position that I have right now, but Tesla has had an amazing run over the last few weeks. So now it's time to decide. Do I need to reevaluate Tesla? Do I still want to hold this and is this still company that I want to own at this price level? So let's go into the chart and let's just take a look at it now. Test is by far one of my favorite cos I've been following them for years, and I actually bought into the company when I was like 180 I sold out of 400 so I did extremely well on Tesla, and now this is basically around two. So, as you can see here identified a high rate around that $900 level, it dropped all the way back down to 3 54 100 I said, That is a bottom. We followed it all the way up until it hit that high. So it hit the previous high. It broke through, and that's when I bought it in here on June 10th when it retested that previous high. Now, since then, it's gone from about $1000 all the way up to $1700. Now that is an absolutely amazing, amazing cry swing they don't see very often. And in under a month, just over a month of training were up 73% so no company grows by 73% in a month. This is the market changing its perception and how it feels about Tessa. And not only that, but Tesla became the most valuable car company in the world, surpassing Toyota on leave yesterday and today it's going to even make a larger, larger cap ahead. So super interesting company, great company. Overall, their earnings coming out in two weeks. But my hesitation here is that no company goes from $350 to $1700 based on actual performance. This is a changing market sentiment of people becoming more and more optimistic and more more bullish about tests and motors. And to be honest with you, I think it might be a little bit overhyped. There are more and more electric car companies coming out with vehicles. There's more manufacturing companies coming out with electric cars. Ford, Toyota, Chevrolet. They're all launching electric cars. So I love Tessa. I didn't test. It was an amazing company. They have a huge strategic advantage, and they're definitely the leader in the market. However, they have just given me a 73% gain on my trades. And do I want to hold that and stick with that and risk losing it? Or do I want a lock in those gains and say, Zach, Hell of a trade, Good trade, good execution, you identified the by. We're now seeing extraordinary exorbitant gains, and it's time to a cell and take some profits. So that's how I'm feeling. That's what I want to do, and I wanna walk in some profit lock in some trades. I'm gonna make almost $3000 on this. So we go to test up, we can see I bought Tesla for $1018 0 losing it here one second where we have. Where's my trades? Okay, Tessa, I bought Tessa at $1018. It's now at $1753. It's up 13.5% today, and it's up 72% overall. I am going to take that 72%. I'm gonna lock in my profits. We're gonna make $3600 on this trade in less than a month of absolute doing. Absolutely nothing. So it is time to sell my shares. And Tesla. It is time to make some money, lock in those gains and feel good about the trade that I just made. So sell five shares are selling it on the US market. Tesla. I'm selling it at the market price. Any part? I'm going to continue this. We're gonna confirm this trade, and I am going to lock in lock in those gains. Okay, so here we go. Here's what we got. I sold five shares of Tesla on the U. S. At the market price. It was good for the day. It costs me $9.95 in commission and it was proceeds of $8700 on basically a $5000 trade. So absolutely amazing trade. And it is time to celebrate. I bought myself a new present. Here we go. I bought the cash gun. So every time I make a trade, now I get to shoot some cash in the air. If I can figure out how work it, it's like opening up way loaded up with the goods. Oh, yeah. Just so my test, The shares made $3000. All seriousness. It was a great trade. We got in. We chose our by point. We said, Okay, this is what we expect to happen. That is exactly what happened. And I had the discipline toe actually close up that trade. Now, who knows? Testing might go up by another 15 2030% tomorrow or over the next month. But honestly, I don't really care. I just made 73% which is an amazing, amazing profit on a trade that was very simple, very easy to find very easy to see, and we did extremely well in it.
70. My Long Term Stocks: What's up, guys, welcome to another video. And this one I'm going to talk about the industries and specific stocks that I hold in my long-term portfolio. If I was going to start from scratch and start all the way over him, do a long-term portfolio. These are the companies that I would buy first. Here we go. Okay, so to make it into my long-term portfolio, there's three different things that has to happen. Number one is it has to be in a growing industry. I have to think whatever company I am buying into is in a industry that I think more customers are going to be entering, more competitors are going to be entering, and there's going to be more tension on it over the next 20 years. If that is not the case, that I don't want anything to do with it. Secondly, it has to become more important. So even though oil and gas is growing at like, let's say one to 5% per year. I don't think that industry is going to be more important in 20 years. I think other forms of fuel and energy will be more important than oil and gas. And therefore, I don't have any oil and gas companies in my long-term portfolio. And lastly, it as savvy 20-year timeline, I have to think that that company, that business model in that product line could be there 20 years from now and it's still as potential, or at least the management team has a chance to evolve it over the next 20 years into something that will maintain its profitability and consistency. So if it doesn't have that, I don't want anything to do with this. So these are my three checks and now let's move on to the companies. But before we do that, if you guys get any value out of these videos, please consider hitting that like and subscribe button. I sincerely appreciate it. It really helps on my channel and my only goal here is to help you make more money. So please consider hitting those buttons and let's get into the companies. Okay, So the first industry I like to look at is e-commerce. Now this is super important because it has grown exponentially over the last 20 years and it is only going to grow in the next 20 years. And Amazon is one of the major players in this. They are the number one company when it comes to logistics that can get you a package in today's, they're the only company that can do that here in Canada, and it is absolutely amazing now, Amazon is the absolute best when it comes to buying no name products from China, from big warehouses, from whatever and getting them shipped to your door. It's great for electrical cables and wires and stuff where the brand doesn't matter, but where your brand does matter. Shopify is then the next best player. And so Shopify allows you to build a website to host your brand. They charge you a subscription fee. They take a little bit of cutoff the revenue. Their business model is absolutely fantastic because as you grow, Shopify growth and Shopify is really expanding. They're doing investments. They are lending you money. They're really expanding the financial side of their business and they're really growing exponentially fast. I really like their business model and between Amazon and Shopify, you pretty much take over all of online retail, which is absolutely amazing. And then to drive traffic to that retail and to those e-commerce platforms. Almost everybody is using Facebook, whether it's through the Facebook platform or through Instagram, it is really amazing. So these three companies give you the holy trifecta of e-commerce, at least in my, my opinion, and I currently hold all three. Now the next industry is pretty close to this. It is technology in general and the companies that I like here, Apple, Google, and DocuSign. And the reason I like Apple is because Apple should have been the first company that I ever purchased. Instead of Apple, I bought Twitter at $44 and I sold it at $21. And it was one of the worst traits I've ever made in my life. But I tell everybody your first by should be apple and you should never sell it because I guarantee you over the next 20 years it is going to go up. It is only done that in the past. And I think that is only going to continue there. The absolute best at recruiting engineers, recruiting talent, and developing some of the most cutting edge technology. I don't think that is going to change even though the iPhone 12 maybe in your opinion, you didn't like it? I didn't like it or there's very few changes soon as they hit that next breakthrough item, that next breakthrough product, I think, I think we're going to be thinking the same thing when Steve Jobs released the iPhone. So I think Apple is a long-term play and it is a great long-term hold. And history will prove that for you if you just look at their stock chart. Next one is Google. Google is only going to become more and more influential over time when it comes to search, when it comes to YouTube, when it comes to everything else that they're doing in the driving space, in the cybersecurity space, in the cell phone space, it is absolutely amazing. Google has their hands in almost everything. And Google is a major player where if you can invest in them, It's almost like investing in 10 different areas. It's absolutely amazing. And so the last company that I really like is DocuSign. I really think that they actually have a strategic advantage here because they do all of the formal paperwork. Anytime you need a bank loan, anytime you need a new mortgage, you gotta do some legal papers. Everybody uses DocuSign. They have a monopoly on the market, and I think they're absolutely amazing. All right, the next industry is cybersecurity. Now in this industry, I like Palo Alto Networks and fortunate they are by far the two large players in the industry. And I think they've done a really good job as securing all of the major players. And anytime that somebody has a major leak, a major break and major data breach. These are the companies that they call to secure their systems and provide them with the security that they need to keep the hackers out. And so I think they have an amazing business model. I think the need for their services is only going to increase more and more as the world moves to digital and end at what they do provide a crucial level of security, not only for the countries, but also for the companies and for the employees. It is super, super important. And I think their industry is going to grow exponentially over time, especially as more and more of the world moves online and moves digital. Now energy is a tricky one for me because I think we're at basically a change point in the industry the last 50 years has been dedicated to oil and gas. And I think the next 50 years is going to be completely dedicated to renewable energy. The problem is that renewable energy industry is still very young. It's very difficult to identify clear major players in it. And it's very difficult to identify who's going to be the major winner 20 years from now. And so, instead of trying to do a solar panel company or a solar, basically energy company, what I've decided to do is invest my money into Tesla. The reason I like Tesla's because I think there are at the forefront of the industry and they are basically solving the major problem, the major problem in renewable energy, not the power generation, it is the power storage. And based on the developments that they have, I think they have the best battery development team, the best bet battery development manufacturing. And I think they are well positioned to capitalize on this transition over the next 20 years. So when I'm talking about energy, I'm talking about electrification, our knowable power generation and storage. And I think Tesla is the best equipped company to capitalize on this transition. I think in 20 years from now, they're going to be an energy company that also makes cars, not an automotive company that also makes batteries. Now the next one here is Berkshire Hathaway. And I know you're saying this isn't an industry, this is a stock and a conglomerate that owns a ton of different companies. And that is why I like it, because I like to pick and choose those industries and those stocks that I am most excited about. But when you invest in Berkshire Hathaway, you're basically investing in the rest of the market because they include insurance companies, CPG companies, transportation, media, Real Estate, clothing. This company literally chooses all of them except they are handpicked by Warren Buffet, the greatest, one of the greatest investors of all time, if not the greatest. And so what happens here is Berkshire Hathaway and Warren Buffett go through and pick their ultimate favorite companies that they like. And then you can invest into Berkshire Hathaway. And this is what I do. I pick and choose the industries and the specific companies that I absolutely like. And for the rest of the market, I buy into Berkshire Hathaway because I know Warren Buffett has already done the due diligence and picked up the long-term investments because he has a 50 year time horizon in it for me, I'm only looking at 20 years, so I trust Warren and by doing that, I'm buying Berkshire Hathaway now, the last company on my list is drone delivery Canada. This is the risky one. This is the X vector. This is the one that you shouldn't have a large position in, but you may want to have a small position and because you don't want to miss out on it. So I really like drone delivery Canada because I think they have huge potential there, a long-term hold for me and they have an amazing business model. So what these guys do is they have three different drones that they've developed as well as a software to coordinate those drones within the regulations Transport Canada, as well as any other regulations in which they operate. The nice thing here though, is that they can sell, they can license, they can lease all of that equipment and software to any operator around the world to build their own business model. And that way as those operators build up their business model, they pay the royalties back to drone delivery Canada in the long run. And I think this company is going to do extremely, extremely well because they are not only developing the drones, are developing the hardware, the software, and the regulatory required equipment that you need in order to actually operate these drones. And I think they have an excellent business model, huge potential, and I actually just bought into them this week. In summary, I chose these companies and these industries because I think they will be here in 20 years. They're all long-term holds and I personally own almost all of the companies on this list. And so if I was going to start from scratch with a 20-year portfolio and I was 18 or 20 or 25 years old. These are the companies that I would buy. This is how it was. I would start and I wouldn't worry about any small dips over the short six months to one year timeframes, I could focus on the long-term and I would focus on building my positions in these stocks, in particular Berkshire Hathaway, because it will give you the most diversification. And so this is all just my opinion. You need to do your own due diligence, but thank you for watching. We'll see you guys in the next video.
 Zac Hartley, Entrepreneur and Investor