Transcripts
1. Intro: Hello everyone. My name is Zach Hartley and welcome to my day trading
for beginners course. In this course, I'm going to provide you with a
step-by-step guide to get you started day trading responsibly
and profitably. This course is
going to be made up of five to ten minute videos. They cover one topic per video
so that they are simple, easy to understand, and
you can apply that topic to your day trading or
your strategy right away. I'm also going to incorporate real life examples from my trading history and
my training experience so that you can easily
understand and apply all of the concepts that we're going to talk about at the
end of the course. I'm also going to have
a couple of videos of live trading sessions so that
you can see exactly how I personally apply
all of the lessons from this course to my
actual day trading. And you can see the results
a little bit about me. I am 28 years old. I live in Calgary, Alberta and I've been trading since 2016. I also make content
on YouTube and TikTok also have
several other courses here on this platform. And I am an angel investor
for private equity, meaning that I will invest into private technology companies
to help them grow and scale. How did I learn to trade? Well, that's a great question.
Thank you for asking. I actually took a course in
university called Intro to the stock market in
my fourth year at Mount Royal University
here in Calgary. That was the little
piece of bait that I needed to get hooked
on the stock market. And ever since then, I've been trading and
investing my own money. In the last two years, I've spent over $8 thousand
buying day trading and investing courses from
influencers on YouTube. I have made review videos, reviewing and taking
all of those courses. So if you want to see
any of that content, you can definitely go check
it out on my YouTube channel. But the goal here was to take
in as much knowledge as I possibly could distill and test out all of the
best strategies. And then my goal with
this is to bring it to you in an easy to consume package that you can
take and apply to improve your own trading
and become more profitable. My overarching goal with this course is to share
everything I know about day trading
with you through simple five to ten
minute videos. I've broken this course into individual videos
that only cover one topic each so that you can easily understand the topic, apply it to your
trading and hopefully improve with every single
video that you watch. That is my goal. And I have tried to distill all of the best strategies and information that I've gathered over the last,
basically seven years. Now, a couple of things
to know about the course. Number one is there's
no experience required. I'm going to walk you
through the basics. I'm going to go step-by-step. If you already know the basics, you can just skip
to the next video. That's why I have divided
it into so many videos. Simple, one topic videos
that are easy to consume. There's also going to be a resource package that is gonna give you all the
links and everything you need to get started
and a project for this course that
we will be talking about in the next video. If you get any value
for this course, if you have ideas for improving this course or if
you like the course, please consider
leaving a review. I read and try to respond
to every single review. And I sincerely
appreciate the feedback as I tried to improve
this course over time. If you have suggestions
for how we can improve or topics that you'd like to
see added to the course. Please leave a review or
comment and I will make that content and added in
to provide more value. That is, my goal is to
provide as much value as I possibly can and get you guys
started on the right foot. If you're interested in seeing
any more content from me, there are five courses on Skillshare right now
with more coming, I have a channel on YouTube, a page on TikTok also run a discord chat where
I post all my trades, all of my analysis. You can get a more
up-to-date sense of what I'm doing and
what I'm investing in. I also have a website and you can book a
phone call with me. If you need anything
from me at all, you can get a hold of me. It should be very easy and I look forward
to your feedback. Thank you so much for
clicking that button. I hope to provide you as much value as
possible throughout this course and look
forward to seeing you in the next videos,
talk to you soon.
2. Course Project: Alright everybody,
thank you for making it through that
first intro video. Before we get into the actual day training
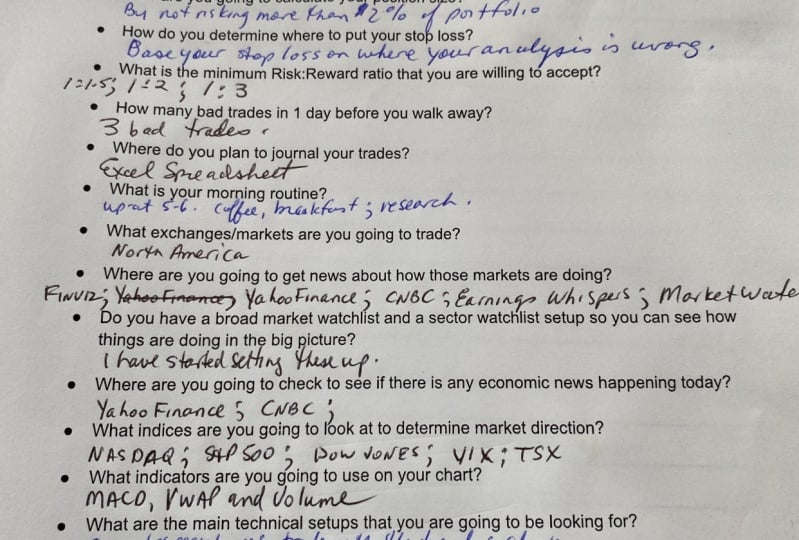
content though, I just want to talk real quickly about our course project. The course project is a very simple one-page PDF
with a variety of different questions on
it that is designed to help you build
your trading plan. The answers to all the questions are going to be contained
in this course. So what I would recommend is print off this page
and start answering the questions with a pen or pencil as you go through
the course content. By the end of this page and by the time you've answered
all of these questions, you will have thought about every different aspect
of your trading plan, whether it's risk management or how to manage the trade
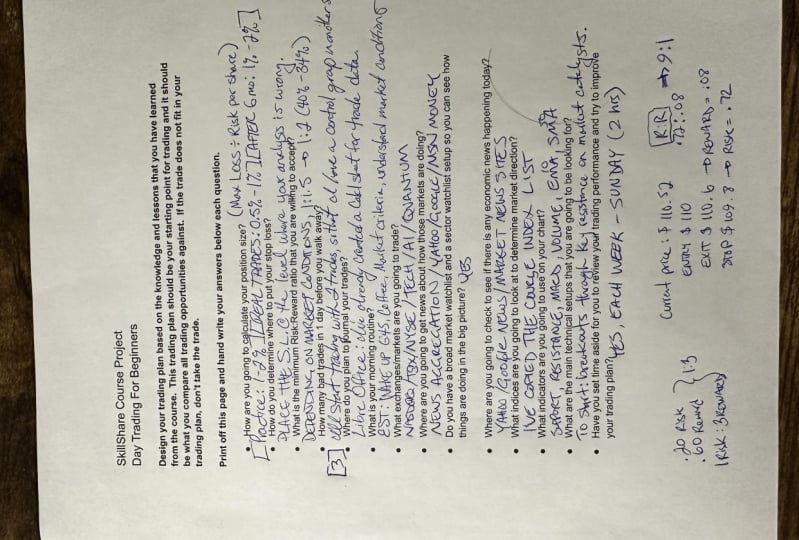
once you're in it. The idea here is that by
answering these questions, you will build your
own trading plan so that by the end
of the course, when you're ready to start
trading with real money, you can enter the market. You can evaluate
opportunities to see if they fit within
your training plan. And if they don't,
you reject them. If they do, you execute on them to become a
profitable trader. And then you can evaluate
the performance of this plan and improve
it over time. The idea here is that
you have everything ready to go by the time
you've finished this course, you can find this PDF under the projects and resources
tab of this course. And if you consider submitting a photo of your
finished first draft, I would sincerely appreciate it now without any further ado, let's start day trading.
3. What is a Stock?: All right, everybody,
Welcome to lesson one. In this video,
we're going to keep things very simple
and we're just going to talk about
what is the stock and what is market cap. Those are the only two
topics we're gonna cover just so we can
ease into things. So without any further
ado, let's dive right in. So what is a stock? Or a stock represents
ownership in a company. And the term stock
is actually pretty interchangeable with the
term shares or equity. All three of those words pretty much represent the
exact same thing. And all of those
shares or stocks can be either paper or digital. Now as day traders, we're only going
to be dealing with digital shares because it's
just much easier to transact. And most of the time these
companies don't actually have paper shares that you
can buy and sell. Everything these days is done on computers and it is done online. Now, why do people own stocks? Why do people day trade? Why do people get into this? Well, there's only two reasons. Number one is because
stocks entitled people to the profit that
the business generates. Now for us as day traders, we're not going to be holding
these stocks for very long. So we're not gonna
get any access to the profits that these
companies generate. However, because these companies trade on public exchanges, they can be bought and sold at different prices
to earn a profit. And that is what we're
focused on as day traders. Now, what is the market cap? Market cap actually stands
for market capitalisation, and it is the price of
each stock multiplied by the number of stock
that the company has. Basically, what we're
trying to do is figure out if we wanted to buy
this entire company, how much would we have
to pay for it today if we wanted to buy all the
shares at today's price, this is how much
it would cost us. And we do this because
it gives us an idea of what that company is
completely valued at. What is the total price? What is the total
value of that company? And we can compare variety of different companies to see
which companies bigger, which company is more valuable, and which company
is growing faster. Now, to calculate the
market cap of accompany, all we're gonna do is
we're going to take the price per share
in this example, it's $5 and we're
gonna multiply it by the number of shares
that the company has. That definition or that term is called the
shares outstanding. And in this example, it is 100 shares. So if we multiply 100 by five, that gives us a
market cap of $500. This is usually how we identify
the size of the company. We do not use the share price to identify the size of the company or the
value of the company, or how good or bad
that company as the share price actually doesn't have that large of an impact
on it because this is super, super important here, a company can issue as many
shares as they want. So if you go down the street and you start your
own corporation, you can choose if
you want one share, a million shares, or
a billion shares. And when it comes
to the companies that we're gonna be looking at, It's pretty much the same thing. They have a lot of
control with regards to how many shares are out
there in the world, which is referred to
as shares outstanding, like I just mentioned to you, companies can
control that number. And if they can
control that number, they can also
control the price of those shares relative to the number of
shares outstanding. And so it's really, really
important that you don't use the price per share as a metric of how
valuable a company is. You have to use market cap as a metric of how valuable
that entire company is. Now, just to give you
an example of this, we have two companies here. We have company a and company B. Their price per share are
very, very different. Company a is currently
priced at $27 per share and company
B is only a $1.79. However, the shares
outstanding a company a, they only have 1207
shares outstanding. Company B has 18,500
shares outstanding. Now at first glance here, if you didn't already see
this market cap number, it would be extremely
difficult to try and figure out which one
of these companies was worth more on a market cap basis without
using a calculator. Like you couldn't just
look at this and say, the $27 company is worth more. Because in reality here, when you multiply 27, 1207 shares outstanding
comes out to $32,589. When we look at company B here, their share price
is only a $1.79, but they have way more
shares outstanding. That gives them a
market cap of $33,115, which is bigger than company. A company with a much
smaller share price can actually be worth a whole lot more than
a company with a larger share price now just has a real life example of this. Here are two different stocks. On the left we have
Berkshire Hathaway. This is Warren
Buffett's company. And on the right we have
Apple Incorporated, the company that
makes the iPhone. And as you can see, Apple's
currently trading at $166 while Berkshire Hathaway
training at $443,450. So the price of Berkshire
Hathaway shares is just exorbitantly high while
Apple is trading at a $166. However, when you look
at their market cap, you can see that
berkshire Hathaway is only worth $650 billion, while Apple is worth
$2.6 trillion. So Apple is worth like four or five times as much as
Berkshire Hathaway, Even though their
shares are only worth a fraction of
Berkshire Hathaway. So again, the point I'm
trying to get across to you here is you cannot compare companies based
on the share price. You have to compare them
based on the market cap. Apple is a much, much larger and much, much more valuable company
than Berkshire Hathaway, Even though the share
price is lower. And so in summary
for this video, stocks represent ownership
and accompany and we can buy or sell the stocks
of public companies that are traded on
exchanges to compare companies and figure
out which one is larger or more valuable. We're going to use market cap. We're not going to
use the share price. We're going to use the
market cap because it takes into account the number of shares that gives
us the total price if we basically wanted to
buy that company today. So that is it for less than one. I hope you got some
value out of it. Let's move on to less than two. I will see you guys there.
4. Stock Exchanges: All right, everybody,
welcome to lesson two. In this video, we're gonna
talk about stock exchanges, how they work, how you
can interact with them, and how we got to
where we are today. Let's dive right in. Okay, so first of all, what is a stock exchange? Well, Stock Exchange is a location that allows
companies to list their shares and be bought or sold by a variety of
different people. For us, we are
traders and so we're going to access the
exchange by using a broker. For us that's basically
just going to be a software that we're going to use to buy and sell the shares. And in reality, what's happening here is we're the trader that is using a brokerage in order
to access and exchange, to buy and sell those shares
were using the broker as an intermediary to get access to that exchange where those shares are being bought and sold. And it's really a cool system. It's quite efficient and
it works really well. And the way that we
got to where we're at today is also a unique story, and that is the history
of the stock market. The stock market
started a hundreds of years ago in Amsterdam. Amsterdam was pretty much
the center of the world, especially when it came
to trade and commerce. There were a lot of people in Amsterdam that ran businesses. They would import goods from all over the world and they
would sell them in Amsterdam to other
people that were traveling from all
over the world. And these people were merchants. And these merchants
had to receive their goods from different
places around the world. And in order to do that, they would send out ships. The ships would have
people on them. They would go out
to a certain area. They would find resources or ****** or whatever it might be, and they would bring
them back to Amsterdam. Now the problem here
is that back in the day when a ship
left the port, there was a twenty-five
percent chance that it didn't come back. There's a chance that
it got looted by pirates or it's sank
in rough weathers, or the sailors just didn't make it and they
died on the voyage, or maybe they just
didn't want to return. So there's a variety of reasons why those ships
didn't come back. And if you're a small merchant, that it just saved up all of your money to afford
one shifts worth of goods to go out and come back so that you can sell
and run your business. That was a huge risk. And if the shifting come back, you might be out of business. And so what they
did was instead of everybody sending out their
own ships, they decided, let's pull together our
money and let's get four or five shifts
and all go out at the same time so that if
one doesn't come back, we can all share what's left. And they did that by
dividing up the rights and the bounty and the profits
from these ships using shares. And that is where the idea of
stock and shares and equity first started was to solve the problem of what happens if these ships
don't come back. Now, over the course of years, a lot of people start to realize that this was a
really good system. It kinda spread out
the risk and it made everybody a little
bit more profitable. And so this idea and this
system kind of started to begin to infiltrate
different areas of the economy. And eventually it pretty
much took over to the point that people
started to own shares, the right to profit in a
variety of different companies. And eventually it got so big that people started to
meet at a coffee house. And the main place
where they started to meet was actually in London, at a small little coffee
house where investors and traders and businesspeople would meet to buy and sell
different shares. And that coffee house actually became the first
ever Stock Exchange. And they grew so large that that system
ended up beginning to travel around the world to the point where we now have
the New York Stock Exchange, the Toronto Stock Exchange, the Shanghai Stock Exchange, and a variety of other ones. And it all blossomed
from the shifts in the Netherlands at a couple of traders at a coffee
house in London. Now we have the global
financial system. So it's a really
exciting story that I personally and just
fascinated by Anna, actually driven or walked by where this all started in Amsterdam, which
was really cool. I did a walking
tour there in 2016. And it was just so
unique to see that that was kind of where
everything started. Now, when it comes to exchanges, there's a couple
of different types of exchanges and there's different categories and
levels to exchanges. Now what I mean by that is
we have big exchanges like the New York Stock
Exchange and the Nasdaq and the Toronto
Stock Exchange, and even the Shanghai
Stock Exchange in the London Stock Exchange
all over the world. And there's kind of like
that top tier of exchanges, usually one in every
major country. And then after that you also
have some smaller exchanges. We have the neo exchange, the OTC exchange, and there's a bunch of them all
over the world. Now, the reason
that these ones are smaller is because
they usually take in smaller companies with lower
market caps and they have lower reporting requirements in order to list your
shares on the exchange. So for instance, if you start
a company and you want to go public and you want to list on the New York Stock Exchange, there's a very large
threshold of things that you have to
be able to do and meet and reporting requirements. In order to list your
shares on those exchanges. And I'm talking about
the tens of millions of dollars worth of expenses. They get it done. Now when it comes to
the smaller exchanges, those reporting requirements
are much, much lower. And so it allows
smaller companies to list their
shares publicly and raise money without having to meet all of the
major requirements. The problem here is
that you get a lot of smaller companies that are
much, much higher risk. You've got a couple of
companies that aren't real companies and are
there to just steal money. So that happens every
once in awhile. And realistically, most
of the companies on these smaller exchanges
will be much more volatile than some of
the larger exchanges, and they also won't
have as much liquidity. Liquidity, what I mean by that is the number of people
that are buying and selling the shares will be lower than on the
larger exchanges. And that can make it more difficult for you
to actually execute your orders at the price that you want to
get in and out of. Now I'm going to
dive into that in a whole lot more detail
later in the course. But I just want to make this
big difference here is that these smaller
exchanges can be good. This is where you're
going to find a lot of the penny stocks, but they can also be
extremely high-risk. For me personally, I focus mostly on the larger exchanges, primarily because they
still have good volatility. So I can make my trades in
and out of them very easily, but they also have
great liquidity. So getting in and out at the
levels that I want much, much easier on the
larger exchanges. So this is where
we're going to spend most of our time in this course. Now, why does it matter? Why does it, why is
there a difference between these large
and small exchanges? Well, one of the reasons is
that large money managers, So the people that
run pensions and retirement funds and
large pools of money, they're not allowed to buy shares income these
that are listed on small exchanges because of the risks that I
just listed for you, they're not allowed to
invest big pools of money into these tiny companies
that are very high risk. And so it kind of eliminates a whole section of the investing community that just aren't allowed
to trade them. And the larger exchanges
usually have better liquidity. If you're trying to invest
a $100 million, obviously, you can invest that into a $50 million company that's listed on one of the
smaller exchanges, You need to go invest
that kind of money into billion-dollar
companies that are usually going to be listed
on the larger exchanges. And so there's a couple
of different factors that go into it they need
to be aware of now, when it comes to trading hours, when can you actually trade and invest your money and
for us day trade? Well, here's what you
need to know for us. And in this course
I'm mostly going to focus on the North
American markets. If you're watching this course from another area of the world, outside of North America, everything is the exact same. You just need to understand the different
timings, the rules, all of the applications of
everything I'm going to talk about in this course is
the exact same strategy. You just kinda need to change the timeframe and
some of the names, but everything else
is going to be the exact same for this
course though, I'm going to focus on the
North American markets because that's where I trade. And in the North
American markets, all of the exchanges are
in New York or in Toronto. And so we're always going to be using Eastern Standard Time. So if you hear me refer to a time during a trading period, usually going to be an
Eastern Standard Time. I currently live in
Calgary, Alberta. I'm in Mountain Standard Time, something I have to adjust for. Trading hours though regular
trading hours are going to be from 09:30 AM to
04:00 PM Eastern time. This is where the
bulk and probably 95% of trading happens. This is where we're going
to focus on and this is what we really want to
be prepared for here. However, you can trade before 930 a M that is called
the pre-market session. It goes from four AM to 930 AM. You can also trade after 4PM, that is called the after
our session and that goes from 04:00 PM to 08:00 PM. So you do have some control. There are a variety
of different options. However, the bulk of the trading happens right here during
the regular hours. Now the reality for day traders is that almost
all of your action, almost all of your
traits are going to happen in the first
three hours of the day. Most trading activity,
most of the volatility, most of the big moves
that we're going to see, day trading are going to happen in the first
three hours of the day. So you need to be ready to go. By the time the market opens. You need to have already
done your research. You need to be ready to sit
down for a couple of hours and execute your strategy that we're gonna go
through in this course. Now, just to reiterate this, the mornings are the most
important for a day Treta, you need to be well-prepared
and needs to be well-rested. A need to take this seriously if you're not a morning person, you need to change your routine. You need to become
a morning person and you need to get
better at this. I need to go to bed
earlier more than likely. Also the evenings, the
after our sessions. That's usually when we get
a lot of earnings reports. And so what will happen is a company will finish the
trading day at four PM, release their financials
usually around for 15 or 430, and then you'll be able to trade and invest or sell or buy whatever you want to do based on those earnings in the
aftermarket session, it's a little bit more
difficult to do because there's a whole lot analysts
and there's also a whole lot of computers that you would be
competing with. Not necessarily going to
focus on that strategy, but earnings usually come
out in the evenings. So that's why I usually say
evenings or for earnings. Now, in summary, notice was a bit longer video,
but here we go. There are a variety
of stock exchanges around the world that
you can trade on. You can trade pretty much
anywhere around the world. They all have different
trading hours, so you need to be
well aware of that. In this course,
we're going to focus on the North American exchanges, are mostly going to focus
on the large exchanges and usually the kind of medium
to large market cap stocks. Now the mornings or when everything happens
in the stock market. So if you already know that this is going to be
a problem for you, start to slowly
change your routine, start to get up half
an hour earlier, maybe go for a walk in the
mornings, maybe read a book. Just slowly start
to change up your routine just slightly
so that you can start to get up a little bit earlier and be ready to
go when the market opens, because I promise you, it
will help in the long term. So that's it for this video. I will see you guys in the next one and we'll talk to you soon.
5. How Exchanges Work: All right, everybody,
welcome to lesson three. In this video, I'm going to walk you through how these exchanges work and how the price of
a stock changes over time. Here's everything
you need to know. Let's go. Okay, So
starting us off here, how do exchanges work? Well, exchanges are very simple. All they do is accept orders
from buyers and sellers. So the exchange exists, it has certain stocks that
are listed on that exchange. And all it does is accept orders from the buyers and the sellers. And then what happens is
when a buyer places an order at a price that the seller
is willing to accept, a trade takes place now this could be vice versa,
buyers or sellers. But basically what's
happening here is the exchange is bringing
in these orders. And as soon as a buyer
and seller agree upon a price, a trade executes. Now, just to give you a
visual representation of it, Let's say that
this right here is the exchange were accepting by orders in the middle column, we're accepting sell orders
on the right column. And here's the current price
on the left-hand side. As you can see, we have buy
orders all the way up to 105, and we have sell orders
all the way down to 106. So it's very likely that the last transaction
happened at, let's just call it 1.505. And now it'd be the
current market price for this security. Now, if somebody wanted to
come in here and just buy shares right away without placing any type
of special order. They just wanted to
buy shares right now. They would have to
go in and buy shares from the person
that is willing to sell them at the lowest price. And as of right
now, it is at $106. This person is willing
to sell 60 shares. The next person is willing
to sell 50 shares out $107. So if the person that wants
to come in and buy right now only wants to
buy up to 60 shares, then they can buy all
60 shares at 106, and that would be the
new market price. However, if the
person wanted to buy, let's just call it 100
shares of Company X, Y, Z. They would buy all of
the shares at 106, and then they would
have to go up to 107 and they would have to buy
40 shares from this person. All of a sudden, that is the last transaction that
happened for this security. And now the price
has moved up from $105.50 all the way
up to $107 because there's now no shares that
are left to be sold at 106 since this order just
captured all of those shares. Now, this also works
the exact same way if somebody came
in and they wanted to sell 100 shares
of Company X, Y Zed, they would have to
sell those shares to the person willing to
buy 20 of them at 105, they would then have
to sell 30 shares to the person willing
to buy at 104. Then have to sell
their last 50 shares to the person that is
willing to buy out 103, and the current market
price would then drop all the way down to $103. That'd be the last transacted
price for this security. And that would bring
the price from $105.50 all the
way down to $103. And that is what moves the price of shares
in the stock market. Now, just to give you an idea of what this looks
like in real life, Here's just a screenshot
from my dashboard. I'm going to walk you
through every single detail of this screenshot here
in, throughout the course. But as of right
now, I just want to focus on this colored section right here and let you know that we are looking at Apple stock. As you can see right now, on the left-hand side, this is the bid section, and we have bids to buy
the stock at $165.2421, at $164.49, at $162. This is where all
of the bids are and this is what it
looks like in real life. On the right-hand side
here, we have the ask, this is all of the people that are willing to
sell their shares. And the lowest cell
right now is $165.34. You can see that the ask
is higher than the bid. And the last price right here is right in the middle
at a $165.27. This is what it looks
like in real life. For an example, on Apple shares, you've got the bid on one side, you've got the ask
on the right side, you've got the last
transacted price. And if you wanted to go into the market and buy right now, you would be paying a $165.34. But if you want to sell, you would only get $165.24. So at $0.10 difference there, and that difference is what
we refer to as the spread. Now, the big thing that I'm
trying to get across to you here is what moves
the stock price. And the answer to that
is supply and demand. If more people want
to buy those shares, they're going to be placing
more orders to buy. And that is going to drive the price up because
they're going to have to buy at higher
and higher prices. The price of the share
is determined by the last transaction
that was executed. If the last transaction keeps
going higher and higher, that is what moves
the shares higher. That's what moves
the price higher. However, if nobody wants to buy and everybody wants to sell, they're going to have to sell
at lower and lower prices. And that's what moves
the price down. So the price of a stock is completely dependent
on supply and demand. Now, just to reiterate here, when it comes to
supply and demand, if demand increases and supply either decreases
or remains the same, the price will go up
because the demand from these people will force them to pay higher and higher prices. However, if demand falls
and supply remains the same or increases,
prices will fall. Demand is usually what we're watching for in
the stock market, the supply of shares, yes, it can be controlled
by the company, but it usually doesn't
fluctuate by much over short periods of time,
especially day-to-day. So supply as a day trader
is never going to be. What we're focusing on. We're always focusing on demand. Is demand increasing
or decreasing? And if you can just
figure that out, That's half the battle. Now, what causes supply and
demand forces to change? Like I said, in
the stock market, we're usually focused on demand. So what are the main factors
that we're looking at? Well, for instance, news, if a company has really,
really bad news, for instance, there
a biotech company and their clinical trials
just completely failed. That'd be terrible
news that is going to reduce the demand
for this stock, which means people
are going to sell and it's going to
drive the price down. You could also have
industry trends. We're an industry is
growing or there's a new booming market that could drive prices higher because
of increased demand. And people wanting
to buy those shares. If lots of people want
to buy the shares and there's not many
people willing to sell, you're going to have
to pay higher and higher and higher prices in order to convince
those people to sell. And that's what
drives the price up. You also have politics
that can change it. Recently we've seen that hype from celebrities and influencers can really have a
significant impact on the markets and innovation. New technologies can really start to change
things and disrupt them and create new industries
that can increase demand. Now, in summary, Here's
what I'm trying to say. Exchanges capture
orders and when buyers and sellers match
up and prices align, That's when trades execute. Prices change based
on the orders. And orders are a result of
supply and demand for a stock. Usually, especially
for day traders, we are only focused on demand. We're trying to understand
if demand is increasing or decreasing because
on a day-to-day basis, the supply is almost always
going to remain the same. And so this is what I'm trying
to get across to you here, is how exchanges work and how in supply and demand
impacts the price. Throughout this
course, we're going to dive deep into this concept. I'm going to walk you through
everything you need to know about how to
place these orders, how to understand these charts, and basically get you
started in day trading. So let's dive in and stay with me here as we move
on to lesson four.
6. Market Participants: All right, everybody,
Welcome to lesson four. In this video, we're
going to talk about the market participants and who you're going to
be trading again. So just to get us started here, there are three different
market participants. The first one is
retail investors, institutional investors
and market makers. Retail investors are
people like you and me. We are individual
investors that are investing our own money
using off-the-shelf tools, using basically our
own brainpower. And it doesn't matter
if you have $5 million or $10 million. If you're doing it yourself, you are an individual investor, you are a retail investor
in a retail trader. Now traditionally,
we used to make up about 10% of the market volume. In recent years. That has grown to
somewhere between 10, 30% of market volume depending on the day in
the market conditions. The reason it's going up so
fast right now is because of the rise of commission free trading apps in
Canada where I live, we have well simple
and flamingo and the United States they have
Robin Hood and Weibull. And around the world, there's a variety of different
mobile applications so you can buy and sell stocks
completely free width, which has lowered the barrier, is increased the number
of retail investors that are entering the
market over time, this number is probably going to continue to increase as well. So it's something
to be aware of now, the second type here is
institutional investors. This is organizations and companies that invest
other people's money. Think of hedge funds, pension funds, mutual
funds, and banks, all of these different types of organizations take in
money from other people, pull it together and
then go and invest it. Usually it's much larger
amounts than retail investors. And usually it's done
for the long term. And usually they have done an extremely large amount of
research because they have access to analysts and manpower and better
technology and softwares. And so this group of
investors actually makes up about 70% of the market volume, again, depending on the day and the conditions and
things like that. But they're usually
investing for the medium to long-term hedge funds are probably going to be the
shortest investors here. But pension funds, mutual funds, and banks will all be
investing for the long term. Now, the third participant in the market here is what's
known as a market maker. These are organizations that provide liquidity so that we can buy or sell without needing somebody on the other
side of the transaction. So remember when I explained
how exchanges work, when a bid and an ask match up, that's when a
transaction happens, but there has to be somebody
on either side of it. Well, when there's not
somebody on the other side of it and you still want to sell your shares at a
reasonable price. That's where
market-makers come in. And their job is to
basically provide additional liquidity
and additional options for you to buy or
sell your shares. Now they do this by offering
a bid and ask price. So we can pretty
much always trade. They make money not by holding the stock or by
buying and selling the stock, but they make money
on the transaction. So if you look and you
remember our exchange diagram, the bid and the ask
are always gonna be slightly different and then when they match up that
transaction happens. But that difference is
known as the spread. And market-makers make money
by taking the same share and selling it at different
prices to make that spread on
every transaction. That's what they're
trying to do. They're not trying
to hold long term. They're trying to
provide liquidity in the market and make a tiny little bit of profit
for their bottom line, they're not trying
to hold long term. Now, the big problem
that a lot people have with market-makers has come
from this term right here, known as payment for order flow. Robin Hood is one of the
larger trading apps in the United States
and they actually make money from payment
for order flow. So when I put an
order into Robinhood, they're actually selling
that order to market makers. They might charge me ¢0.5 or an extra scent more
for that trade. And that's how Robin
Hood is making money. The market makers
are making money on the spread and they're
given Robin Hood, a little bit of a kickback. That's how Robin Hood offers
commission free training. Definitely something to know because if you're using a broker or a platform that has
payment for order flow, you might not get
the best executions. Market-makers are also
known for spoofing. That is, when they
place fake orders in their broker that
they don't plan to fill. And it makes it look like
somebody is going to sell a ton of shares
at this price, or they want to buy a ton
of shares at this price. And then when the price
starts to get up to that level, those
orders disappear. It basically influences
the stock price and it makes other people think that there are certain levels of
support and resistance. We're going to dive more
into that in a little bit. And they can also
buy or sell to close stop losses or fake out traders. Obviously, if they are buying and selling in
these transactions, they are going to have a good cash balance and a
decent number of shares that they're just holding to facilitate
those transactions. And if they see a large amount of stop losses or buy orders, they can actually manipulate
the market to take up those stop losses or fill those
by orders prematurely. And so they have a fairly large amount of
control over the market. And it's something that
you need to be aware of and it's something
that we're gonna talk about throughout this
course with regards to how to combat some
of these problems. Now, if you want to tell
how much of the shares of a company or owned
by institutional versus retail investors. It's really easy. Yahoo Finance and then
you click on Statistics. It's going to bring you
to this little page here. And I've taken a screenshot
of Apple where you can see that the percentage
of shares held by institutions is 60.07%. So almost two-thirds
of this company has held by institutions
that have done a ton of research that have sent their analysts
that have followed the stock and that
believe in this company, that means it's probably
a pretty safe company. However, if we look at GameStop, we can see that only 28% of the shares are held
by institutions, a much smaller percentage. So the institutions have
less faith in this company and retail investors are probably holding the
majority of the shares, which means we're probably
going to see more volatility. Retail investors trade on hype, they trade on news,
they trade on emotions, and they trade on trends. They don't often
trade on profit. They don't often trade on fundamentals of the
business and they don't often trade
for a long-term. And so when we see high retail ownership
like we see in GameStop, that usually means
that we're going to see more volatility. By volatility, I just means more rapid price
movements up and down. It's probably going
to move by five or ten or 15% per day. Whereas Apple is probably
only going to move by one or two or 3% per day. So in summary, here, there are three main
market participants. You've got retail investors, institutional investors,
and market makers. If a stock has a
high retail presence or it's a meme stock
like GameStop or AMC. It means that those stocks
are probably going to have a little bit
higher volatility, meaning that they're
going to move more rapidly than a stock like Apple or a stock like
Procter and Gamble or like Johnson and Johnson, those stocks that
a little bit safer and of high
institutional ownership. And lastly, this is who we are
gonna be training against. This is who is in
the marketplace, and this is who
we're trying to make a profit with or against. And so it's really important
that you know this, it's important that
you understand it, and it just helps
you get an idea of the dynamics of
the marketplace. So I just really wanted
to share it with you. Now let's start moving
on to lesson five.
7. Short Selling: All right, everybody,
welcome to lesson five. In this video, you're
going to talk about how you can make money
when prices go down. Now, when it comes
to day trading, there are two different ways
to make money and profit. You're probably familiar
with strategy number one here that is buying
low and selling high. But strategy number two here
is what we call shorting. This is basically where you're buying high and selling low. And I'm going to
explain how that works. But first, just a little
bit of terminology here. You may have heard
these terms before. Somebody that has
a long position or somebody that has
a short position. If somebody has a long position, that means that they are
currently holding the shares and they want the price to go up because they're
gonna make money. If somebody says that they
have a short position, that means that they are
currently shorting the stock and they want the price to go down so that they
can make money. That's what we're going to
focus on in this video here is shortening and creating
short positions and how that works. Okay, so here's a
step-by-step process of what it looks like
to short a stock. The first thing that we're
gonna do is we're going to borrow the shares
from our broker. So let's say that we want
to short Apple stock. We want a short
ten shares of it. So what we're gonna
do first thing is we're going to borrow
shares from a broker. We now own those
shares and we owe our broker ten shares of Apple. The second thing
that we're gonna do is we're going to sell those shares in the market and we're going to collect cash. So he borrowed them
from the broker. We're gonna go into the market and we're going to
sell those shares, and we're going to receive
cash for those shares. Now we have a pile
of cash and we owe our broker ten
shares of Apple. Now the third step here is
to wait for prices to fall. You have some idea
in your head that the price is gonna
go down over time. And so you're going to
wait for that to happen. That is step number three. Step number four is to then go back into the market with
that pile of cash that we have and we're going
to buy those shares at the new lower market price. What's nice here is
that we're not going to need to use our entire pile of cash because we
actually sold them up here and we're going
to buy them down here. So we're gonna take a
little bit of our money, probably most of our money. And we're gonna go
in and we're going to buy those shares back. And now we have a little
bit of money leftover. We have ten shares
of Apple stock, and we're going to return
those shares to our broker, that is step number five here. And as you can see,
we are leftover with a small little pile
of money right here, and that is our
profit on the trade. So basically what's
happening here, we're borrowing shares
from the broker. We're selling those
shares in the market. We're waiting for
the price to fall. We are buying those shares back. We're returning those
shares to the broker and we're keeping that difference
here as our profit. That is how shorting works, and that's how you can make
money when prices go down. Now, let's walk through
some examples here. Let's say we're
looking at Apple stock again, this is the ticker. That ticker is a four digit code that represents a stalk
and apples scenario. It is AAPL. If you
looked at microsoft, is MSFT, if you look
at Amazon, it is AMZN. This is the code that
we use to identify the stock when we're putting it into our broker in our computer. I'll walk you through all
of that shortly here. But let's say in this example, we're looking at Apple. The stock is currently
trading at $100. That's the situation that
we are walking into. For us. We're going to short
five shares of Apple. So that means that
we're going to go to our broker and
borrow five shares. We're going to sell them in
the market and we're gonna collect $500 in this example, step number three here is
apple falls down to $75, so it's going to plan, the price is coming down, which is good for us, and we're still holding
on to our pile of cash. Then when the price hits
seventy-five dollars, we're gonna go into the market and we're
going to buy five shares of Apple back at $75 per share. We're going to
return those shares to our broker that we
borrowed them from. So we're taking our $500 here. We spent a $100 per share on, we're going into the market
at $75 per share to buy them, we have a little bit
of cash left over. And once we buy those shares, we're going to return them
to our broker and we're left over with twenty-five
dollars in profit per share, or a twenty-five percent ROI, which is extremely nice. This is exactly how
shorting works, and this is basically what
we're looking to do and how we're going to make
money if prices go down. Now, let's say that the
price actually goes up. So this scenario, it
starts off the exact same. Apple's trading at $100. We short five shares of
Apple and they were holding a pile of cash and we owe
our broker five shares. However, apple, instead
of falling down, it has now increased to a $150. Now, here's the
thing was shorting. You owe your broker five shares
of Apple and they're not going to accept anything other
than five shares of Apple. You can't give them cash, you can't give them money, you can't give them other shares. They have to receive five
shares of Apple back. And so that forces you to now go into the market and
buy five shares of Apple back at a $150 per share and return those
shares to your broker. Now, you've just
lost $50 per share because you sold them at 100
and you bought them 150. You've just lost $250 on your trade and it
wasn't a very good result. So as you can see, there are some risks when it
comes to shorting stocks. The big risk here is that
if the price goes up, you will be forced to
buy at the higher price. And unfortunately, it doesn't matter what that
price goes up too. So if it goes to a
million dollars, you're going to be forced to
buy in at a million dollars. And that's why some
people say that shorting stocks specifically
has unlimited risk. However, in reality, your
broker has safeguards that are in place there to prevent you
from owing more money than, for instance, what
is in your account, what you set as your parameters. We're going to talk
about that more as we choose a broker here, but these are the risks. And as day traders, we're going to manage
these risks and combat these risks by not
holding short positions, overnight, companies release
their earnings after hours. That is usually a
huge catalyst for major price changes in a stock. So as long as we're not holding these securities overnight, we're probably not going to see any major price
changes that could really hurt us if we
were shorting a stock. So that is what we
are focused on. That is how we are
going to manage our risk when it
comes to shorting. In summary, what
I'm trying to get across from you here is that it doesn't matter
if the stock is going up or down as day traders, we honestly don't care because we have strategies
to make money if the stock goes up and we have strategies to make money if
the stock goes down, well, we're trying to do
as day traders is to identify what direction
the stock is trading in and buy into that trend
and then sell out of it when that trend changes or
when the direction changes. That's in simple terms what we're trying to do
as day traders. It honestly is no
more complicated than that because
we have strategies to make money when
the stock goes up and when the stock goes down
and to mitigate our risk, we're not going to hold
short positions overnight. Now this sounds a little
bit complicated and we haven't even started
trading any stocks yet. But I want to do this lesson at the beginning of the
course because it's really important for putting
you in the right mindset that we can make money
in any direction, in almost any condition. And it really comes down to our own strategy and discipline because there are so many ways to make money in
the stock market. There's also a lot of
ways to lose money. And what it really
comes down to is understanding how
the market works, which is what we're
working on right now. And then building a strategy
that fits your lifestyle and your trading style and
your personal preferences. And that's what we're
gonna be working on later. So stay with me as we move on to the next lesson
and I'll see you soon.
8. Index and ETF's: All right, everybody,
Welcome to lesson six. In this video, we're going to talk about what is an index, what is an ETF, and how can
you use them in your trading? Let's dive right in. Alright, so to start us off
here in index is very simple. It is a theoretical group of companies that is
measured in points. You've probably
heard of the nasdaq, the S&P 500, or the Dow Jones at some point
throughout your life. And those are all
examples of an index. An index is a radical group of companies and the reason
that we measure it in points so that we can
compare the performance of that index over long
periods of time, because it's a
group of companies. If one company goes bankrupt or one
company gets acquired, it can be very difficult
to adjust for that. And so by measuring endpoints, we make sure that
we're comparing the same thing over a
long period of time. And we can measure the
performance year over year. Unfortunately, though, because
it's measured in points, you can't actually buy an index. You can't buy the nasdaq. You cannot buy the S&P 500 and you cannot
buy the Dow Jones. But you can buy a security that gives you
the exact same result, the same performance,
and it's pretty, pretty close to
buying into an index. And that security
is called an ETF. It's almost the
exact same thing, but it's traded in dollars. And an EGF stands for
exchange traded funds. A basket of stocks that
is designed to track the performance of an index
by holding the same stocks. So the ETF holds the stocks that are in
the index so that you can actually buy into that basket or that group of securities. Now what's really nice about
ETS is that they're very flexible and they come in a
couple of different options. A regular ETF looks
something like this, where it is going to
track the S&P 500. So all of the
companies that are in the S&P 500 index are going to be in this S&P 500 ETF and
you can buy it for $411. So if you are a
long-term investor or a swing trader or
anything like that, and you just wanted to get
exposure to the market. This could be a good
option for you. However, we are day traders, so we're looking for
something a little bit more advanced and something that's gonna give us a little
bit more control. And luckily, there's a
variety of different ETFs. For instance, there's what's
known as an inverse ETF. And the inverse ETF is very
similar to a regular ETF. It's a basket of
stocks that moves in the opposite direction
of the regular ETF. For instance, if the S&P
500 goes up by 2% 1 day, the inverse ETF is gonna
go down by 2% 1 day. This can also be
another option to short the market and make money as stocks or the
market goes down. This is just another strategy
or another way to do that. Now, this is just
one example here. You can also buy
an inverse ETF for the nasdaq or for a variety
of different industries. There's actually a whole lot of options with regards
to inverse ETFs. There's also the option
to buy a leveraged ETF. Now, leveraged
ETF, for instance, this one is for the S&P 500, so it tracks the
performance of that index, the S&P 500 index. However, this one,
as you can see, has a a3x leverage on it, meaning that if the
regular S and P 500 index went up by 2%, this ETF is gonna go up by 6%. So whatever happens to
the regular S&P 500, this one is gonna go up
by a factor of three. So if the irregular S&P 500, ETF and index went up by, let's say 4% and
add an amazing day. This one is gonna go up by 12%, which is really,
really remarkable. So you can use it to get a little bit more
leverage without having to borrow money
from your broker. We're going to talk more
about that in a little bit. But I wanted to bring
this up here because we have the option
of trading stocks, or we can trade ETFs, or we can trade options. We're going to dive into that
at the end of the course. These are two different options and we're also going to use the index is to understand
the direction of the market. The nasdaq represents a lot
of technology companies. The S&P 500 represents
the broad market and the Dow Jones represents a lot of banks and
industrial companies. And so we can use these
indexes to try and understand what direction the
overall market is going in. And that is going
to be extremely important for us
later in the course. So it's really
important that you understand what is it index, what are we trying to
understand from it? What is an ETF and what
is the difference? Because in summary, ETFs
gives us the ability to purchase a group of stocks and treat it like
a regular stock. Most of the time, they're
designed to track an index such as
S&P 500, nasdaq, the Dow Jones, or some other type of specific
industry, for example, renewables or computer chips or, or consumer package goods. It could be a variety
of different ETFs, just depends on what
you're looking for. We also have the
options by inverse and leveraged ETFs, which
is very exciting. So for instance, when
Russia invaded Ukraine, if you knew that that was going to put a lot
of pressure on the oil and gas industry and
prices we're going to go up. You could have bought
a leveraged ETF for natural gas, for instance, and made it three times
as much money buying the leveraged ETF
as you would have if you had just bought
the regular ETF. Oh, just a basket of
natural gas stocks. And so we're going to use
these different tools and leavers to her advantage as we start to build out
our trading strategy. And the other thing
that's nice about ETFs, they usually don't gap up or
gap down very significantly. What I mean by that
is if you have one single stock and
it has great earnings, could gap up by 20% or if it has bad earnings could
get down by 20%. When you hold an ETF, there's usually 50 to 100
different stocks in there. So one earnings result
is usually not going to drive the price
massively up or down. That is good for us
because it means most of the action is probably going
to happen during the day. And that's what
we're trying to take advantage of as day traders.
9. Types of Trading: All right, everybody, welcome
back to the next lesson. In this video, we're
going to dive into the strategy that we're going
to use for day trading. And we're also going to talk about the three different types of trading and investing that you should
be familiar with. So let's jump right in. Alright, so when it comes
to trading and investing, especially in the stock market, there's kinda three
different categories that people fall into. The first one is investors, the second one is swing traders, and the third one
is day traders. That is what this
course focuses on. But you should be aware of the other two
because I'm going to refer to them and talk about
them throughout the course. But investors are buying
into a company with a long-term horizon
because they believe in the business, The future growth. This is like me
buying it to Apple because I believe in the
company and what they're doing. And as long as the company
continues to innovate and create new products that are aligned with what I expect. I'm going to continue
to hold that stock and even pass
it onto my children. That would be the
definition of an investor. That would be how they think. Now a swing trader is a
little bit different. They are buying into a security with a plan to sell
that security, because they are trying
to take advantage of short-term trends that
they can profit from. Basically, have Russia invades the Ukraine and the price
of oil and gas skyrockets. A swing trader is
going to go out and buy oil and gas stocks, hold them for a couple of weeks, and then sell them at a profit. That is what a swing
trader is looking to do. That's not what we're
focused on in this course. But I want you to
be aware of this because if you get to
the end of the course, like data and just isn't for me, you may be interested in
swing trading or even just building a long-term
investing portfolio because day trading is
buying and selling the same day to profit from
the movements in price, we're going to find
a reason to trade. We're going to find a
catalyst or we're going to find something that
causes us to say, Hey, there could be
an opportunity here. And then we're gonna go
through our strategy that I'm going to break
down for you right now. The strategy is to number one, identify
trading opportunity. This could be based on earnings, is can be based on news. This could be based on the
price action from the chart. This could be based
on industry trends. It could be almost anything. You're going to try and identify training opportunity
and then make a prediction based
on that opportunity. If company X, Y, Z
has good earnings, I think the stock is gonna
go up from here to here. That could be your prediction. And then what we're gonna do is once we have that prediction, we're going to calculate
the risk to reward ratio. How much do we have to
gain by taking this trade? And how much are we risking
when we take this trade? And do those parameters meet
the conditions that we're setting for ourselves and
our own trading style. If it meets all
of our parameters and it meets all of our
training conditions, We're gonna go on to
execute the trade. And most importantly,
as soon as we execute the trade and as
soon as the trade closes, we're going to
journal or trade so that we can measure
how well we did. We can measure why we
got into that trade, why we got out of that trade, and we can improve our
performance over time. This is actually the
most important part of any trading strategy is journalling your
trades so that you can better improve that
strategy over time. Now, throughout the course,
I'm going to walk you through all five of
these steps and we're gonna go through this
strategy line by line in very fine details
so that you fully understand what it takes to
become a profitable trader. But in summary, here, there are three types of
trading and investing. So if you don't like day trading or you're not an investor, maybe try one of
the other types. Day trading is taking advantage of the
price changes within a single day and
profitability is dependent on your
risk to reward ratio. This is something
that you need to get through your head very early on. Trading is a numbers game
as a game of probabilities. And if you can take a trade
where you have a forex upside to a one downside
and you can just make 50%, you can be right
50% of the time. You're going to be a
very profitable traders. So that is the kind
of system that we're gonna be looking
to set up here. And the only way you
can do that is by going through a strategy and
actually tracking your trade. So I'm going to walk you
through how to do that. And I'm going to give you
all the tools that you need in the next couple
of sections here. So stay with me.
10. Trading Platforms: All right, everybody, welcome
back to another lesson. This one is extremely
important because in this video we're going to start talking about trading platforms, practice accounts
and account types so that we can get you
started on the right foot. Here's everything
you need to know. Let's go. Okay, so when it comes
to training platforms, I am most familiar with the North American markets here in Canada and the United States. If you live outside of one of these two countries, I'm sorry, I can't offer a whole
lot of expertise with regards to which platform is
going to work best for you. You may need to do
your own research on this specific topic. However, if you live in Canada, I personally recommend
quests trade. This is the software
and the platform that I use for all of my day trading. It's also where
I'm going to pull all my examples and
screenshots from, from throughout this course. If you're looking for
a different broker, then quest trade in Canada, you can use interactive brokers. They actually have
slightly lower commissions then quests trade. But I personally like
the software and the visual aspect of trade much better than
Interactive Brokers, more just personal
preference and anything. If you live in the
United States, I would recommend Weibull. They have a great software,
a great platform, and it is commission free. You also have the option
to use TD thinkorswim or Interactive Brokers is also available in the United States. Now the nice thing about
these brokers and about these platforms is most of
them have sign-up bonuses. Meaning if you use
a specific link, when you sign up and create
an account and deposit money, you will get either free cash or free commissions deposited
directly into your account. I have put all of the links in the resource file associated
with this course. So definitely go
check that out if you are ready to
open an account. Now, when it comes to
choosing what type of account to open on
these platforms, if you're a day trading, you want to open
a margin account. It is very cut and dry. This is gonna be the
best thing that you can do if you don't
have the option for a margin account
for whatever reason or you want to open
a second account, then you would go with
the cash account. However, a margin
account is going to allow you to borrow money
from your broker's. It's also going to
allow you to clear and settle your trades
almost instantly. So this is definitely the
way you want to go for day trading if you are
investing or swing trading. The other two types of training that we
talked about here, where you have a EFSA
or RSP and Canada, or an IRA or Roth IRA
in the United States. This is when you're
going to want to use this registered account. You're going to want to open these different
types of accounts, but you do not want to do any day trading in
these accounts. These are registered
accounts that the government can
see that gives you tax advantages and
the government does not want you day trading
inside of these accounts. So please be very aware of that. If you live in Canada, you should not be day trading on a consistent and regular basis in either of these accounts. And same thing if you live
in the United States. That's why we have
a margin account. That's why we have a
cash account and allows you to do things
like day trading. Because if you did
that in your TFS, say you'd get to
take advantage of the tax benefits that are not
designed for DEI training, they're designed for
long-term investing, and that is why the
government doesn't like it. Now, the most
important message from throughout this entire
video is right here, and it is the term
practice accounts. This is something that
you need to take very, very seriously because I
promise you it will be the best tool that I can give you from
throughout this course. A practice account, also known as a paper account
or paper money, gives you fake money to
trade in the real markets. So it gives you a
trading account with fake money in it that you can buy and sell real stocks with. Now what I mean by
that is that you're using fake money so you don't
actually own the stocks, but it's gonna give
you the same results as if you did on the stock. So you can see if you're a profitable trade or if
you would have made money, or if you would have
lost money without actually losing your own money. It is the most important
tool for any new trader. It is extremely important
and this is the best way to get started and test out
new strategies or traits. Anytime I'm trying out a new
trade or a new strategy, or I'm looking at a
tricky new security that I've never
dealt with before. I do everything in a
practice account because if I don't understand it completely
and I mess up the trade, that way I can lose the fake
money and not my real money. The most important concept here is that you are
losing fake money. You can try new things out, you can be more risky. You can try out new
trades and strategies, and you can do
whatever you want with fake money without any risk of losing your own money and decreasing your
personal net worth. Now, for me, I highly
recommend quest trade. I will put a link basically in this video or in the resource guide that will take you here. It's like ten seconds to fill
up the information here. Quest trade will give
you $0.5 million Canadian, half-a-million
dollars US. And they'll let you run
in their practice count using all of their software
and all their benefits, completely free for 90 days. It allows you to get
used to the software. It gives you the
opportunity to make trades, test out the strategy. And you can go through
this entire course, test out all the examples, do everything I'm doing in a
practice account and see if you're profitable before you actually put in your own money. Now, here is your
homework for this lesson, I know homework,
it doesn't sound like anything fun, but
you need to do this. I'm very, very serious about this and it's super,
super important. I can't emphasize it enough. You need to go out
and need to open a practice account if you live in Canada, the United States, or somewhere else, find a
software that will give you a practice account or a paper
account, going to open it. And I'm going to walk you
through in the next few lessons how to buy and sell
your first stocks. So you need to use
it as an exercise. You need to take what you learn in these videos and
in these classes. And you need to go
and apply it in this practice account and
test it out and make sure you understand everything that I'm talking about as we go from one lesson to the
next because it's just going to build
on top of each other. Now, here is the reason that it's so important and
here's the why behind that, why I'm pushing you to do this. And the reason is
because the odds of you losing money or the chances
of you losing money, and obviously that's a
chance here and day trading, those chances are the
greatest at the beginning, at the beginning of your journey when you are just
learning how to make training and learning
the new strategy and learning what
I'm talking about, the odds and the
risk of you losing money or the greatest
at the very beginning. It's just like anything. Think about learning how
to shoot a basketball. You're going to be
terrible at the beginning. But if you practice
for three weeks, you're probably going
to get better at it. It's the exact same
thing with day trading. It's just like going to
practice instead of a gain. When you go to the game, you're trading with your real money. And when you go to
practice your trading with fake money and you go
practice for two weeks. And then when the
game time comes, you're ready to go and
hopefully you can hit the shop. Now, here's the
best-case scenario. Here's what I recommend, here is what I wish
every single person watching this video would do. Most people aren't gonna
do this because it takes a lot of work and a lot
of self-discipline, and it's very hard to
manage your emotions. But the best thing you can do is use the practice
accounts until you are profitable with fake money before ever trading
with real money. And so if you can
get good at trading and you can understand
the concepts that I'm trying to
teach you here. And you can put them
into application with fake money
and be profitable. That is, when you should
transition to the real money, you shouldn't be using your real money and depositing
your last $1000 into your trading account that
you just don't bend and starting to train and test
out new strategies with that, that is the worst thing
you could possibly do to test out a new strategy
They never done before. They've never even traded
before with real money. That is the one thing I
want you to avoid here. So please open a
practice account. And I also want to
tell you that you're not missing out on anything. People get this sensor, this urge that if they make a little bit of money early on now they're missing
out because it was fake money. It
wasn't real money. And the truth of the matter is, you're gonna make money in
DEI training if you have a profitable strategy
that you can scale up and then you can refine
and improve over time. You're not gonna
be missing out on anything because that
is the key to it. And so you can just take that strategy and
improve it over time. You can apply it
at anytime period. The key is getting
that strategy down, understanding it and being
able to apply and execute it. And that's what the
goal of this course is now here in summary, first thing you need
to do a piece of homework is go open
and practice account. Second thing is get started
opening a brokerage account, preferably a margin account. You do not have to
fund it right away, but just get that
process going and get it started so that when
you're profitable in your practice account, it's ready to go for you. And lastly, do not rush. The stock market has been
trading for over 230 years. The New York Stock
Exchange started in 1792, is not going to
stop anytime soon. So whether you
start trading with real money today or tomorrow, or next week or next month, I promise you it is not
going to impact how wealthy you are 12 or
three years from now. What is going to impact
how wealthy you are? 12 or three years from now, is how well you can day trade, how well you can put together a strategy and how good
you can make that strategy over time by journaling
it and understanding how your personal emotions
affect your trading, then adjusting your strategy
to navigate that over time. That's my goal. That's what I want to
teach you in this course. But don't rush it. Don't rush it. Take your time, use the practice account and don't lose your money
in the beginning, loose big money in the
beginning. We'll see you soon.
11. PDT Rule: All right, everybody,
welcome back to the next lesson in this one, we're going to keep it nice
and short because we're just going to talk about
the PDT rule now the PDT rule stands for
Pattern day trader rule. And in Canada this
rule does not apply. There's nothing similar to it. So if you're from Canada
and trading out of Canada, you don't have to
worry about it at all. But if you're from
the United States, it's gonna be very important
for you because the PDT rule limits you to three-day traits
within a five-day period. One day trade is considered a buyer and a cell
within the same day. And you can only do that three times within a
five-day period if your account has under
twenty-five thousand dollars and if you're using
a margin account, now, as you can see, this is kinda targeting and
pointed at new traders. And it's designed
to slow them down so that they don't
risk too much. Now there are some ways to get around the pattern
day trader role. But in general here what I would recommend is as a new trader, you should be very, very
selective with your trades. You should only be taking the absolute best traits
and you should be very, very careful, especially when you're first getting started. You should always be using a practice account to get started. And when you transition
to your real money, it should be very
selective and be very careful and make sure that
you're doing things correctly. If you need more than
three day trades within a five-day
period, most people do. There's a couple of
ways to get around it. Number one option
here is you can open accounts with multiple brokers. So for instance, the PDT rule only applies
on a per brokerage basis. So I gave you three
different options for us brokerages to where
you can open accounts. If you open an account at all three of those
different brokerages, you'll then be able to execute nine day trades within
a five-day period. You also have the option
to open up cash accounts. Cash accounts are not
subject to the PDT rule, so you can make as many
trades in them as you want. However, the trades
that you make in a cash account will usually take one to two days to settle. Meaning that when you exit that trade and you
settle that trade, it may take 24 to
48 hours for that cash to become available
for the next trade. And so using a cash account is also going to slow you down, but it isn't option
that can give you a little bit more
flexibility and a couple of more trades
on a weekly basis. Now, in summary here, the PDT rule is very important. If you break the rules, you will be fine for it. I believe you get
a warning first, but I live in Canada, so I haven't got one yet. You need to be careful
and make sure that you follow those rules and you
also need to be careful, especially when you're
starting out trading. You should be very selective with the types of traits
that you're making. So you shouldn't be
needing to break that rule right away anyways, but there are a couple of
strategies to get around it. You need to make sure
that you're first starting out with the
practice account though, you need to make sure that
you're at least very close, if not already profitable in that practice count before you ever start trading
with your real money. Now, that's it for
this video and the next one we're gonna
start talking about level two and some data packages
that you can purchase from your brokers to help improve
your trading over time. Definitely stay tuned
and we'll see you there.
12. Level 2 Data and Real Time Data: All right, everybody, welcome
back to another lesson. In this video, we're
going to talk about levelled to data
and real-time data. These are two things
that you might get asked about when opening your
brokerage account. So I just wanted to address them upfront so you know
what they are. Let's jump right in. Okay, so leveled to
data is sort of an idea that you should be familiar with because we've talked
about it before. But Level two data
is being able to see the orders that are stacked
up on the buy and sell side. So like I said, these exchanges
then these marketplace take orders from buyers and sellers and when they match up, they execute the trade. Level two data allows you to do is see which orders
are stacked up. Now the reason that
you might want to have level to data and
the reason that that could be an advantage to you is because you can see
if there are a lot of people planning to sell at a specific level and vice versa. So let's say that
you are day trading. You're buying Apple at $110 and you think it's
gonna go up to $120. Don't have any level to data. Basically, all you're doing is you're hoping it goes up to a $120 based on your own technical analysis
and your strategy. But let's say that you have leveled to data and
you can see that there are a couple of
massive orders to sell out Apple stock at $118. Well, if you see
that information and you're trying to
get Apple to $120, you might have a
good idea that it might not make it up to $120. So you might want
to sell it at a $117 and still be able to capture some profit before those orders take
the price back down. Now, obviously, this can
happen on both sides. You might be able to see some massive orders to
sell the stock. You might also be
able to see some massive orders to buy the stock. You can change and adapt
your trading based on those orders to try and take advantage of
the price action. Now the downside here, and the downside to level
two data is that number one, it costs money, you
have to pay for this. It is an additional fee on a
lot of different platforms. And like we mentioned before, the market-makers can take part in what is
known as spoofing, where they will
place fake orders specifically to get
you to react to them. They will cancel those
orders as the price goes in the direction
that they're looking for. And so not every single order that makes it into level
two is a good order. Not every order is gonna get filled at some of those orders are fake orders and so
it can mess you up. If you don't understand that, it is not gonna be
perfect every time, but it is an additional
tool that you can pay for to
improve your trading. Now here's my advice. You do not need Level two data when you're
first getting started. Level to data is something
that you can use to refine and incrementally improve and
already profitable strategy. Level to data is not going to be the thing that turns you from
an unprofitable trader to a profitable traders you need to focus on first is the
basics and the fundamentals that we're gonna go
through in this course that I'm going to show
you how to use level two and add it
into your training at the end of it to improve it. But you do not need to be
spending this money upfront. You do not need to pay for
all of these upgrades. Where you need to
learn in the beginning is the core fundamentals
of how to day trade, what the patterns look like, and all the basics
that we're gonna go through in the next couple
of sections of this course. That's what you should be
focusing on the beginning. And then you can add
in these features at the end to improve your training once you're
already profitable. Now, the one thing that
you will need though, in order to do some day
trading is real-time data, and luckily this is included
with most platforms. It is included with Quest trade, the platform that I
use and recommend. The nice thing about real-time
data is that it will give you accurate price info
down to the second. So it will be up-to-date, it will be live and it
will be a real readout of every single trade that is happening for that
specific security, whichever one you decide to
watch and allows you to get in and get out at the
prices that you expect. So when you're going through and you're
choosing a platform, if you're not choosing question or you're not
choosing thinkorswim, make sure that whatever
platform you are choosing either has
real-time data completely free or that you
purchase it because you will need that in
order to day trade. Now with Quest trade, the level two data
is fairly expensive. It's about $90 per month. If you want the real-time
data for options trading, it is $20 per month. We're going to walk through options talking about how they integrate into our
day trading strategy a little bit later
in this course. But real-time data is completely
free with clustering. Definitely look into this, this dealt level to data specifically is going
to cost you some money. Luckily with Quest trade, it also reduces
your commissions. So you can save some money
with commissions when you buy level to the point
that they almost offset, which is kinda nice, but it's definitely
something to keep in mind. This is going to be an expense that you're probably going
to have to pay every month if you decide
that you do want to add a level two data
to your trading. Now, in summary, here, you do need real-time
data that is something that you must
have in order to day trade, but you do not need Level two data when you're
starting out. It is something that
you can add on later. Do not pay for it
in the beginning, you're going to have enough
to learn and to focus on and to understand when
we're just starting out. You don't need to add on that extra bell and
whistle until the end, until you've had that foundation and you've fully understand
everything else. And lastly, I said this before, but I need to repeat
it at level two, data will only help
you to improve and already profitable strategy. It will not be the thing
that makes you profitable. So please do not spend the money unless you're already
at that point.
13. Setting up your Broker: All right, everybody, welcome
back to another lesson. I know that so far we've gone through a lot
of PowerPoints. We've talked about a lot of theory and it's been
a little bit dry. But today in this video, we're going to open up
our brokerage account. We're going to start
setting things up. We're going to look at charts,
look at some order forms, and we're going to
start getting ready to make that first trade. And I'm also going to
give you the outline of what you're going to
need to have so that you can understand and apply all of the different
things you're going to learn in
the rest of this course to your trading. So let's jump right in. Okay, so like I said before, I personally use
Quest trade IQ edge for all of my day
trading and investing. I will put the links,
the resource file to this course so you can find everything you need to
download the software, create an account,
and get set up. And when you do that, this is what your page
is gonna look like. It is a blank slate like this. Most of the training
softwares are going to come out as a
blank slate like this. And then the idea here
is that you are going to click on whatever
window you want. Most of the selections are
usually at the top right here. So if we want to
click on watch list, it is then going to
give us a new window here that we can move
around the screen. We can put it wherever
we want and we can kind of customize this screen, look like and feel like whatever we want and set
it up to our preference. So I'm going to show
you how to do this. And the first thing they
want is watch this. That's what we're going to use. As you can see right now, mine is set to market view
and it's basically going to show us how these
different indices are doing. So this is the nasdaq, this is the v6, this
is the S&P 500. And this is what I'm going
to use to kinda scroll through the different charts
that I want to look at. But speaking of charts, that is the next step here. So the one thing that we need here is a chart and
as you can see, there's a label at the top of the question software
here that says Chart. And when you click on it,
it is going to give us a new window here and
we can expand it, we can contract it, we can
move it wherever we'd like. I'm gonna basically expanded out like this so
that now we have a chart on the
left-hand side here and we have a watch list on
the right-hand side. The problem here though, is that I'm currently looking at Apple stock here and
on my watch list, I'm looking at the S&P 500, or SPX is the ticker right now. And so to link these up
here on quests trade, and on most platforms
is a little button in the top right-hand corner that's gonna give you a couple
of different colors. I'm going to select a
green color right here. I'm going to do the exact
same thing for our chart. And as you can see now, the chart is linked to the S&P 500 and so is our watch this, there's a drop-down menu
that will show up here. I don't think it came through
on the screen recording, but you'll know that you'll know what I'm talking about when
you click on this button, you just choose a color. As long as these two colors
right here match up, it means that these windows are going to be sync together. So now when I click
on the nasdaq or I click on the VIX is going
to change the chart. And this way, I can now go
through and I can choose, let's say a different
watch this. So here I have a
tech watch this. He doesn't just drop down menus. They're not coming up
on my screen recording, so I'll fix that
for the next video. But as you can see, I now
have a tech watch this. These are all the tech
stocks that I'm watching. And as I go through,
I can go to Zoom, I can go to apps, I
can go to PayPal, I can go to Coursera and I can start to go through
my watch list here and see what the chart looks like for each
of these stocks, which is really, really nice
and really, really handy. Now, I'm going to walk
you through how to read the chart and how to
use all the indicators. The last thing that
you're going to need for this course and for the next couple of videos here
is your order entry form. This is how we're going to
actually place the orders. You're not going to
need this right away, but I am going to
walk you through it. This is basically the
form that you're going to use to buy and sell your shares. And once you have
this window open, you have your watch
this tear any of your chart on
the left hand side, that is all you need. That is all that we're going to need in order to
start date training. We're going to start from
this simple foundation here, and we're just going
to slowly add on new features and
benefits and new, new strategies and
new indicators so that we can hone in our strategy and improve it over time. But with regards to setting
up your brokerage and getting that first step open to the point we're able
to execute a trade. This is all you need. You need a chart, you
need to watch this, and you need an order form so that you can
execute your traits. And then just make
sure that they're all synced up to the same color so that when I start looking
at Amazon on my watch list, it gives me Amazon
on the chart and it also gives me Amazon
on my order form. Once you have that point, you have everything you
need to start day trading. Now it's time to move on to technical analysis
and learning how to actually understand
these charts. And then we'll learn how
to fill this order form so that we can understand the chart and decide what trade
we want to make. Then we can execute
that trade using the order type that is going
to work best for that trade. I'm going to walk
you through all of that in the next
couple of sections. Let's dive right in.
14. Technical Analysis and Candle Stick Charts: All right, everybody, welcome
back to another lesson. In this video, we're
going to talk about technical analysis
and chart types. That's right. We're going to
start diving into actually learning how to
read these charts here is everything
you need to know. Let's go. Okay, so
when it comes to stock analysis just in general, in the broadest sense, there are two categories that most types of
research fall into. The first category is
technical analysis, and the second category
is fundamental analysis. If you're doing any
type of research on accompany on an
investment or on a stock, you are either doing one of
these two types of analysis. Now, the first type
of analysis here, fundamental analysis, is
analyzing the business model, the financials, and the
economic conditions to decide whether or not to invest in that security or that
stock or that company. Most of the time, fundamental analysis is used
for long-term investments. The reason that most
long-term investors use fundamental analysis
is because you're only getting the financials
once every quarter. You're only getting
economic updates maybe once a week at best. And you can only really
analyze the business model once it's not like it
really changes over time. And so as the
fundamental analyst, you're doing this research
and you're projecting out how this company is going
to do over the long run. You're not trying to make
any short-term traits. This is all just
long-term investing here and it is not what we're
going to be focused on, but you do need to know what the other side of the spectrum is called and what
it includes for us, well, we're going to be focusing on is technical analysis. And this is very simply
studying the past price and volume data to better understand price
action in the future. Or in other words, we're very simply just
looking at the chart. That is literally what we're doing when we
are day training, we're trying to take
in as much information as we can from external sources. But the majority
of our analysis, the majority of what we
are basing our decisions on is quite literally just
happening on the chart. And so that's where
we're going to spend a whole lot of effort
and a whole lot of time and the next little while now when it
comes to charts, there's a variety of different types of charts that you've probably heard of before
when it comes to stocks, There's two primary types of charts that most people
are familiar with. The first type of chart
here is a line chart. This is what you're
going to see if you pull up the stock
app on your phone. This is what you're
going to see if you go to Yahoo Finance. This is what you're going
to see if you go to most intro or beginner or
just informational websites. I'll show you a line
chart like this. The problem with
these line charts is that they just kind of take data points every few minutes or few seconds or a few
hours and they say, Okay, price was here ten
minutes ago and now it's here and
they draw a line, but it doesn't really tell
you what happened in between that time period and that information that is between those time periods can be very, very important for us. In order to get
that information. We're not going to
use line charts. We're actually going to use
what is called candle charts. Now you're probably
familiar with this. Look, if you've ever seen
a stock chart before, this is what all
professionals will use. This is what real day
traders will use. This is what anybody
that is performing actual technical analysis we'll use is candlestick charts. Now, when we look at
this chart right here, you can see a couple of
different pieces of information. First of all, we have
red and green candles. We're going to talk
about what that means in 1 second here. Each one of these vertical lines here represents one candle. That is what I'm referring
to when I say a candle, this is a candle charts
and as of right now, this chart represents
the ticker symbol AAPL, which is the company
Apple Incorporated, the company that makes
the iPhone and the MacBook and all of our
favorite products. So right now, we're looking at a candlestick charts of Apple
Incorporated, the company. The current price
right now is $173.03. You can see that highlighted
in red right here. You can also see the price and the top-left corner right now, it is currently down by 0.09%. As I take this screenshot, or roughly $0.16, the high
of the day was $173.27. So that is what we can
see from this chart. And other big important
thing to look for here is this little drop-down menu right here where it says one m. One m stands for one minute, and that is the time
period of these candles. And so every vertical
line here that's either green or red is a candle. And each one of those
candles represents a time period of one minute. And so the candle represents
the beginning of the minute. And then at the end
of that minute, we move on to the next candle. And that's how you basically build out this chart over
the course of the day. That's what your software or
your brokerage does for you. Now, understanding these candles can be a little bit
complicated at first, so I've got a good
diagram here now you'll notice that these candles
were red and green here. And basically what that means is that when it's a red candle, it means that the price at
the beginning of that minute, in this example, we're looking
at one minute candles. The price at the beginning
of that minute was higher than it was at
the end of that minute. When the price closes lower
at the end of that minute, that's when we're going
to get a red candle here. And this filled in section
right here where it's thicker. This is what we call
the body of the candle. This is where the price moved, enclosed within a minute. But you will also see these vertical lines that
stick out of the body here. These lines here are
called the shadow. There can also be
called the wick, just kinda depending on
who you're talking to, they mean the exact same thing. But you've got the upper shadow here and the lower shadow here. And what these represent
is where the price moved between the open
and close of that minute. So let's say that we were
training on $100 when the price opened that minute
and then went up to 101, it dropped down to $95
and it closed at $97. Well, that's going to give us a candle that looks like this because we opened
101 right here. We went up a little bit, we came all the way back down, and then we closed
at 97 right here. That's gonna give us a
candle that looks like this. So this body area that's
shaded in area is where we opened and closed and those
upper and lower shadows, or how high the price
went and dropped in-between that one
minute time period. Now when it's a
green candle here, this means that we opened
lower than we closed, or the price went up in that
one minute time period. The price started here. It may have went down like in this example where we
have a lower shadow. So the price went down, it went all the way up, and it came down
a little bit more before a close that one
minute time period. And that is what would give us a candle that looks like this. Now, if either of these
candles didn't have an upper shadow or it
didn't have a lower shadow. Basically, what that
means is that the price, let's say, for example, it opened out one-on-one, it came down to 105
and a closed at 105. It did not drop
anywhere below 105. That's what it would mean
if it did not have a wick. Same thing on the
green side here. If it opened at 102 and then it got all the way up to 107
and it closed out 107. It didn't get anywhere
higher than 107. It would give us a green
candle here without this wick. And so the candles represent the price action during that
time period in this example, so far, the chart that I just recently showed you,
this one right here. These are one-minute candles. However, these candles can represent whatever time period
you would like them to. So for example, here, here's the Apple
stock chart over the course of one day
using one minute candles. So as you can see,
we have a lot of red and green candles here all the way
throughout the chart. And each one of these candles
represents one minute. But we can also look at the exact same chart and
use five-minute candles. And what that means is that for every one minute candle here, we're actually going to have
just one five-minute candle. And this is what it looks like. As you can see, we're
still trading at the exact same price of $173.03. The chart even looks very, very similar with regards to the direction that these
candles are moving. However, there is only
1 fifth as mini candles because each one
of these candles represents five-minutes. And so I'm just gonna go back so you can see the difference. Here are the one-minute candles, here are the
five-minute candles. And just to take it
even further back, here, are the same stock. So Apple stock at $173.03, you can see that
price right here, but these are one, our candles. And so each one of these
candles represents one hour. And you can see that
over the last five days, the prices climb from $146.70
all the way up to $172.78. I'm currently holding
Apple shares, so we're making a lot of money, which is really, really nice. But basically you can see how the price has moved
up over time. You can see how the
price has moved up and down throughout
the day and within those candles and
these candlesticks are really nice
because they give us information about what
is happening in-between those time periods that the
line charts do not give us. So when it comes to
technical analysis, we're going to use candlestick charts because they give us more information than the
line charts will give us. Candlesticks can apply to any timeframe and then
rules are always the same. So if we go to the
one hour timeframe, this red candlestick
right here where it has a very large lower shadow or
bottom shadow right here. It means that the
price started here if fell all the
way down to here, and then it closed right here and it didn't go
anywhere higher. That's what those candles mean. That's what these charts mean. And this is why we're
going to be using candlestick charts for all of our technical
analysis moving forward, hope you'll stay with
me. Let's dive right in.
15. Bullish and Bearish Charts: All right, everybody,
welcome to another lesson. In this video, we're
going to start talking about the terms
bullish and bearish. Those are two words
that you're going to hear me and a lot of other people use throughout
your investing lifetime. So without any further
ado, let's jump right in. Okay, So the bull and the bear, or two animals that represent a lot of different things
in the stock market. You've probably
seen the photo of the bull out front of the
New York Stock Exchange. You may have also
seen a couple of statues of bulls
fighting against bears. That doesn't actually
happen in the wildlife. It happens in the stock market. And the reason it
happens is because when we think of the terms
bullish and bearish, it means that the
stock market is either going up or it is going down. So bullish means that
things are going up. If I say that this stock
is bullish or I am bullish about the stock or the
economy is bullish. That means that we think all
of those things are gonna go up over the basically
short to medium term. If we are bearish about
things or if we're bearish on the stock or if the stock is trading at a bearish pattern, or if the market is
trading bearish Lee, or if there's a lot of bearish sentiment in the marketplace, those are all kinda terms or things that mean that things
are about to go down, or the stock is
about to go down, or the value is
about to decrease with regards to whatever
you are talking about. So bullish means things
are gonna go up. Bearish means things
are gonna go down. I'm not sure exactly where
those terms come from. My belief is that bullish means things are gonna
go up because bulls, but their horns up to be aggressive whereas bearish
jump up and slash downwards. That's what I heard online. I have no idea if
it's true or not, but you're going to
hear these terms very often in bullish basically means things are going up and bearish basically means
things are going down. Now, to put this
into an example and actually show you a
bullish or bearish chart. I've found a couple of examples. This is Bed Bath and Beyond, as I'm filming this
course right now, Bed Bath and Beyond has a lot of attention on it and the
stock chart is going wild. It's given me some
good examples here. Now, when we take a look
at this chart right here, we can see that the
ticker symbol is BBB. Why? You can see Bed
Bath and Beyond. That's what company
BBB y stands for. The current price is $17.75. It is down $5.30 or 22.99%. However, I am only looking at a small section of time
from a few days ago. So realistically these two
pieces of information don't really apply to this specific examples that
I'm trying to show you. What I'm trying to show you
here is that we have a chart, a candlestick chart here, where the price starts at around $15 in the left-hand corner, and it rises up to $24 in
the right-hand corner. All the way through the chart, the price is basically going up. Yes, it pulls back for
a couple of minutes at a few different points
throughout the day here. But in general, the chart is going from the
bottom-left corner to the top right corner
in a fairly smooth line, in a fairly smooth price change. This is what I would call
a very bullish chart. This is what I would call it
very bullish price action. Price action refers to the movement of the
price over time. This is going in a
bullish direction. It is bullish price action, and this is a bullish stock
based on this price chart. Now, just to give
you an example of a bearish chart, this is
what it would look like. We're starting in the
top left-hand side at $20.81 and we're finishing off at the bottom
right-hand side, $16 and around $0.50. And so we're starting in
the left and we're just slowly moving down
as time goes on. This would be an example of a bearish charge or
a bearish stock, or this is a stock
that has a lot of bare sentiment towards it. Right now the price action is moving in a very bearish way. And again, this is
a one-minute chart for Bed Bath and Beyond. And it's just taken at a different timeframe
on a different day. Now, these principles of
bullish and bearish actually apply to all
different timeframes and all different security. So just as an example here, we have the nasdaq 100
index ticker symbol as n d x right here. And I have, we're
looking at it from October of 2020 all the way
up until August of 2022. And as you can see,
we're moving in a very bullish projection of very bullish price
action right here. Very bullish movement
all the way from about 10,600 up
to around 16,700, and then this trend changes. So here is a chart
where we actually have both bullish and
bearish price action. Because now from basically
the beginning of 2022 here, all the way to about
halfway through 2022 here, we dropped from 16 thousand
back down to 11 thousand. And that is a very
bearish trend, that is very bearish
price action. And we're moving in a
very bearish direction. We are starting to
see a little bit of a rally over the last
few months here, which is bullish and it could indicates signs
of a trend change. We do need a little
bit more confirmation that the trend is
changing because we do have a couple of peaks
that we've seen in this bearish
long-term trend here. But this is what the chart
looks like right now. So we've got a bullish
trend going into 2022. The beginning of 2022 has
been a very bearish trend. And it looks like we could be at the beginning of a new
trend starting right here. Now, why is this important? Why am I talking about this and why am I spending
five-minutes on this? Well, it is because
understanding if we're in a bullish or bearish
trend can help us to decide if we should
go short or long. Basically, what I
mean by that is if we are in a bullish trend, we wanna go long on the
position and we want to buy into the stock
low and sell high. But if that stock or that security is trading in
a bearish direction, we want to short that stock. We want to go short on
the position we want to buy high and we want
to sell to cover low. And that is going to
make us profit if the stock or the security
declines in price. Now, these rules and
these principles apply to all timeframes
with all securities. And what we're trying to
do as day traders is we're trying to trade with the
direction of the market. For instance, if the
market in general is going up and the stock that
we are watching is going up. We do not want to be
shortening that stock. We want to be buying low and
we want to be selling high, and we want to ride
that trend up. In general, we want to make the assumption that these
trends are always going to continue until we start to
see signs of a turnaround. Now just as an example here of our strategy and what
we're trying to do. Here's the Nasdaq 100's again. And this goes back and
kind of highlights the COVID period that we saw, where we saw a big
massive pullback. And so prior to COVID, we were seeing a
nice, nice rally. We're in a bullish trend here. The stock prices are going up and the market is
rallying in general, and then COVID hits and it changes very dramatically
to a bearish trend. And it continues to go bearish until the index is
almost cut in half, right down to 6700 here. And then that trend
changes again, and it changes into a bullish
pattern where we go from 6700 up to 11,497 here. So as traders, as day
traders in this course, we're not trying to buy in at 6,771 here and then
sell out at the top. That is so excruciatingly
difficult to do. It is so tough to do, and it is almost impossible. What we're trying to do
as day traders here is identify what trend
we are in right now, or wait until we get a new trend confirmation and then buy-in at the
beginning of that trend, sell out when that
trend changes, that means that we don't have to pick and choose the
top and the bottom. We just have to identify what direction that
stock is going, buy into that direction and then sell out when that
direction changes. That is the general
premise and the idea of what we're trying to
do as day traders. And that is what I plan to teach you in the next
couple of courses. So let's keep going.
16. Support and Resistance: All right, everybody,
welcome back. In this video, we're
going to start talking about support and
resistance levels. Now, support and resistance
are very simple. They're key levels within the chart where people
tend to buy the stock. Now what happens when people
buy a lot of the stock? The price starts to go up. And so when we hit
a support level, it's usually like the
price is coming down to support and then
bouncing off of it, you'll hear me use that term bouncing off of
support quite often. You'll also hear me use the term getting rejected at resistance. That is where the stock
approaches the key level where people tend
to sell the stock. Now, just to give you some
examples of exactly what I'm referring to here is
an example of resistance. We're looking at Amazon stock
on a one day time frame. So each candle here
represents one day, so it's a little
larger time-frame. And as you can see,
the price starts at $149 and it comes all the way up to a $188 before
dropping back down to $160. And then if you notice here, it comes all the way back up to 185186 and there's a wick that comes right back up to 188. Again, it obviously doesn't cross one eighty,
eight, sixty five, but it comes extremely, extremely close before falling all the way back down to 165. And so price got back up
to within one or 2% of the high where it hit last time and then it got rejected
at that resistance. Basically what that tells me is that there are a
bunch of people that are willing to sell the stock
and take profits at a $188. And therefore, this becomes
a key resistance level. And to connect this and to
show this on the chart, all I've done here is just
drawn a horizontal line that connects these two high
points in the price chart. Now, here's an
example of support. This is a company that I'm following quite
closely right now. It is Udemy ticker symbol UDM, why they are an online
learning platform. And if you look at this price, it started at $19.90 and it came all the way down $10
right here in March. It then test at
$10 again in May, and it tested $9.47 right
here at the end of June, beginning of July,
before bouncing off support and writing all
the way back up to $15. So basically what you're seeing here is that the
stock has bounced off this $10 level of support
three different times. And it shows that when Udemy
drops to that $10 level, people think it is
selling at a discount. People liked the value of buying Udemy shares at that $10 price. And I do want to point
out something here. You'll see that this
first drop right here, maybe it didn't even touch
that 10-dollar level. Maybe it came to
$10.05 or $0.10 here. The next one, it came
right down to $10, and then the third one here actually dropped down to $9.47. So yes, these levels or these bottoms that
I am referring to, they're not all stopping on the exact same price
level down to the cent, but they are stopping on the exact same price level down to the closest five to 10%. That is what I'm
looking for when we're looking at levels of
support and resistance, I am not expecting the
price to bounce or get rejected exactly at this line. This line indicates an
area where I expect the price to either get
rejected or balanced off of. So anywhere probably plus
or minus 5% from this line, that would be considered
a bounce off of support, just like what we saw on the third bounce rate
here of Udemy at 947? Yes, the price fell below $10, but it didn't drop low $9. So it was still within
a couple of percent of the key level that I'm looking for and then it rallied
right after that. So that is a confirmed
bounce off of support at $10 for
this price chart. Now why does this happen? Why is this phenomenon so
prevalent in the stock market? And when we're looking
at these charts and it's very, very
simple actually, it's because supply
and demand forces, price movements on
all of these stocks. It always comes back down to supply and demand
most of the time, especially on a
short-term basis. Not supply is not
going to be changing. There's not new shares being added or removed
from the market. And so really we're
focusing on demand. Is demand increasing or
is demand decreasing? Because that's usually
going to tell us what direction the stock
is going to move in. And so here's what happens when the price continues to
bounce off a certain level. If the price falls down to a level where investors
think it is a good deal, demand will increase and
drive the price back up. So for instance, let's say
you have a company that is returning you 5% per year on your money,
that is your goal. You're trying to get 5% and all of a sudden
the price goes up. And now all of a sudden your return is going down
because the return is the same, but the investment to get
that return is higher. Well, if the price
comes back down and you can get that five
per cent return again, you're probably going
to buy more shares. And that is exactly what
is happening when we see stocks that have key levels
of support or resistance, people think it is
becoming too valuable or to over-priced relative
to what it is producing. So people continue to
sell Amazon at a $188. People think that
Udemy is producing enough revenue and enough
profit that at $10, it is a discount so they
continue to buy more. That is how these
levels of support and resistance are built up. That's how they get determined. We just happened to be a deceive them in the price charts. And by drawing these lines, it allows us to
understand where they are and what we should be
looking for in the future. So to draw these lines of support and resistance,
it's very simple. All you have to do is
draw a line across the high points or low
points of the price action. When I refer to price action, I am referring to
where this price is moving on this chart over time. And all you have to do is draw a line that connects these dots. Now, I'll show you how to do that broker in just a
couple of lessons here, but it's pretty much simple
and identical on all of them. Now, the key thing that I have to emphasize to you is that these lines that we're
drawing are not like very, very accurate, thin
lines that you should be sticking to
religiously, their areas. So anything kind of plus or
minus five to 10% around that line is the area where you should be expecting
support or resistance. So it's super, super crucial. You are never going to
see a stock that bounces exactly off this 10-dollar
line each and every time, it's always going to be
plus or minus five or 10%. Now, here is something that I want to talk to
you about because this is super important when
we have a level that shows strong signs of resistance like we saw
with Tesla right here. We have strong signs
of resistance at $768. You can see we get rejected
three times right here. If the price breaks
through that resistance, that exact same level
then becomes support. You can see an example of
that happening right here. We have three areas where the stock price has
got rejected at $768. We finally break through on this big green rate
day right here. And then we come back down
and we test the $768 level. It then act as support and we
bounce off of that support. And so when we break
through resistance, that level then becomes support. And when we fall
through support, that level then
becomes resistance. So it just depends on what
side of the level you are on. You need to make sure
that you are aware of that because that is
what we're looking for is a stock they'll trade back-and-forth
above and below this, we can use that crucial level as an entry and an exit level. We're going to talk more about
that in a little bit here. But basically, what we
need to do is learn how to use this information
as a day trader. And the key to this is starting big and
working your way down. So that Tesla chart that
I just showed you here, we are looking on a
one day timeframe. And as you can see, we've got three levels or resistance here, and we just broke through. And then we came back down
and we tested support here. This is what it looks
like on the larger scale. Well, when you zoom into this, it gets very exciting. So here's what the exact
same chart looks like, but with 10-minute candles. So instead of every candle
representing one day, every candle on this chart actually represents ten minutes. And these shaded areas, these lighter areas right here, this is actually after hours
and pre-market trading so that we can see
what is happening at night and in the mornings. And what's absolutely
crazy about this is that the $768 level is right here. So this is the exact
same level that we drew out on the larger chart. You can see that the stock broke through that
level right here. This would have been a
beautiful day to day trade. We had a very key level here, broke above it, and then we
just continued to rally. So that would have been an
ideal day to day trade. Tesla. And then over the
next few days to stock actually started
to come back down to that same exact $768 key level that we had highlighted earlier. And if you had noticed that you could have bought
it on the bounce off of that level and
wrote it back up again. So these are the kinds of things that we're looking
for that can give us opportunity and trading
ideas as day traders. And so what I want to get across to you in
this video is that support and resistance
levels are very important. They exist in the stock
chart and you can draw them by just connecting
the highs and lows. What they represent is changes to supply and demand forces. When a stock breaks
through support, that level then
becomes resistance. And when a stock breaks
through resistance, that level then becomes support. And you can use that to
create trading ideas and find opportunities in
these stocks to day trade. We're going to dive
into that strategy a whole lot more
throughout this course. But I hope this was valuable and I hope it's kinda opening your eyes to show you what kind of opportunities are available. Because you could
have seen this, you could have seen this coming, and you could have
been prepared for it. He could have capitalised on it. So it's very, very
exciting because I'm starting to give you a couple of breadcrumbs that show you, hey, there's a lot of
opportunity in this market. You just need to understand
how to read these charts. So we're going to keep working
on that. Let's keep going.
17. Understanding Candlesticks: All right, everybody, welcome
back to another lesson. In this video, we're going to dive a little bit deeper into understanding candle sticks and what they can tell us about the supply and
demand forces behind the price action here is
everything you need to know. Let's go. Okay, So just as a
quick refresher here, we have red candle sticks and
we have green candlesticks. The red ones means that
we opened here and we closed lower at the end
of that candlestick. The green one basically
means the opposite. It means that we opened
lower and we closed hire, or that the price went up during the time period that
this candle represents. These candles can represent
everything down to a one-minute all the way
up to one day or one week, just depends on the time
frame that you're looking at. Now the body here, this represents the space in-between the open
and the close, but the shadow or the wicks on the bottom and the top of
these candles represent where the price action
traded in-between that time period that
the candle represents. So what we're gonna do in this video is talk about
what the different shapes of the candle's
can tell us about the supply and demand
forces behind it. Now, there's three different
things that we want to watch for when
evaluating candlesticks. Number one is the
size of the Wix. Number two is the
size of the body, and number three is the
order of the candles. So these are the
three things that we're going to cover
in this video, starting with the
size of the wicks. Now, big wicks, like what you see here with a green
and a red candle. Big wigs on either side
means that we have buyers and sellers
competing for control. It means that there's a lot
of people trying to buy, There's a lot of
people trying to sell. There's a decent amount
of volatility right now, which means the price
is going up and down. But when the price
opens and closes out, roughly the same level here, or where we have a
small body like this. It basically means
that buyers and sellers are competing
back-and-forth. And we're basically starting and finishing at the
exact same spot. Now for us as traders, that shows that there's some in decisiveness in the market. Now, on the other
side of things, when we see big
wicks that are only on one side of the body here, on either the green
or the red side, it means that the price
is getting rejected or housebound support and
that buyers are stepping in. And so basically what this means is if we've
got a couple of candles where they have long
wings that are down below. It means that the price
keeps dropping and then investors or traders are
coming in and saying, Hey, that's at a discount right now, that is trading way too cheap and they are
buying it back up. And what that represents
is a level of support. You have the same thing here. If for instance, Let's say
that it looked like this. This just means that
we've got a couple of weeks on the top side here. And it means that
people are selling out every time the price
gets up to that level. And so when we see
Wix like this, these are kind of
a first indication that the trend
might be changing. That's how are we going
to use these types of candles as day traders? They're kind of a sign that hey, we've got good support here. And if the price
keeps coming down, that supports probably
going to step in. That's what goes
through our head when we see these
kind of candles. And the exact opposite, when we see the red candles, especially with the
Wix on the top side. Now, moving on to
item number two, here is the size of the bodies. When you see a body that
is filled in like this, basically what it means
is that the price opened here and it closed here, and we saw a dramatic or a drastic price movement
within that candle. So when we see big
candles with big bodies, That means that buyers are in control or that sellers
are in control. It means that there's
not a whole lot of back-and-forth like what
we saw with the wicks. It means that buyers are in here and they are pushing
that price higher, or sellers are stepping
in and they're selling out and driving
that price lower. So when we see strong
candles like this, it means that we have control on that side with its green
buyers are in control, and if it's red, the
sellers are in control. Now, if we see small
bodies like this, this gives us pretty much
the opposite feeling here. When we see small green
bodies like this, it means that the
momentum is slow and that there's not a
whole lot happening. Same thing with when we
see red candles like this. It means that there's not
any dramatic price movements in-between that time period. And therefore, it's not that the buyers or the sellers
have major control here. It's just that not much happened within that one-minute
time period, especially since the
Wix or small as well. So more than likely, what happened during this candle was that the price
just kinda traded like this and move slightly
up or slightly down. Basically, when we see
small candles like this, with small bodies
and small wicks, it means that
there's not a whole lot of momentum right now. Nobody is in control and not a whole lot is really
happening with the price. At the moment. However, if we see a small candle grow
into a bigger candle, grow into a bigger candle, that would be a very good sign that they're gaining momentum. And this can be the first
sign of a buying opportunity. Basically what it means is that nobody was really
in control here and maybe the price
just moved slightly upwards in kind of
sideways trading. And then buyers
started to step in, and then they started to
step in more and more. And you know, this
course that when buyers step in and when people
wanted to buy the stock, that is what sends
the stock higher. And so this is the first sign that that might be
what's occurring. Now, going the other way here, if we see a big
candle followed by a slightly smaller candle followed by an even
smaller candle, especially with a
big wick right here. That would be a very big sign that this trend is
about to change. For instance, what I mean by this is the buyers
are in control here and they are driving the price up higher
and higher and higher. But if we have a smaller
candle after that, it means that we might be
running out of buyers. And if we have an even smaller
candle rate after that and a wick that looks like
we could have got rejected on the
level of resistance. That'd be a pretty clear sign that this trend is
about to change. And it might be
time to get out of this position or
take some profits, or at least watch
it very closely. Now the other order
that we might want to watch for is anytime that we see major Wix like this
in short succession, maybe a couple of candles apart. This means that there could
be a key level of support or resistance and we probably
need to zoom in closer. So for instance, if we're
looking at a one-day chart or a one-hour chart and we see
some Wix that look like this, that gives us a sign that
we need to move into a one-hour chart or a 10-minute chart, or
five-minute chart, or even a one-minute
chart just to see what's actually
happening here and see if there's a good strong level of support here that we might do to make a trade
on later in the day. That's what we're
going to be watching for if we see candles like this. Now, in summary here, these are not the golden goose, this is not the
secret to trading. These are just things that
can give you signals that can be kind of little flags
that you can look at and say, okay, this might
be an opportunity. This might be something
that I should watch for. This might be something
I should look for confirmation on in the future. And this can be an
early sign to get your attention and possibly
give you a trade idea. And so we use the candlesticks to try
and help us determine if the trend is getting stronger or weaker and when it may change. So if we see a trend like this, it means that we're
probably running out of momentum and that trend
is going to change. If we see candles that
start to look like this, it means that we might
be at the beginning of a trend that is just starting
to gain some momentum here, if we see a lot
of Wix like this, that gives us the indication
that we're probably seeing a bit of
volatility right now, we may need to zoom into a closer time period and we got to be pretty careful
with our trading. And so there's a
lot going on here. Definitely re-watch
this video if you have any questions
about candlesticks. But we're slowly
just going to add layer on layer onto our trading until we have a solid
strategy that's profitable and that
we're comfortable with. And that's where we're gonna
be building throughout the rest of this course.
So let's keep going.
18. Volume: All right, everybody,
welcome to another video. In this lesson,
we're going to start talking about volume and how you can use it to identify
the beginning of a trend or the end of a trend. Here we go. Alright, so what is volume? Well, it's actually
really, really simple. Volume is the number
of shares being traded on a stock chart.
This is what it looks like. So we've got the stock price
and the price action on top and down underneath here we have our first indicator
and that is volume. And you can see each one of these kinda bar
lines right here. It lines up with one
candlestick from the chart, and it represents
how many shares were traded within
that candlestick. Now we are currently
looking at one day chart. So each candle right here represents one day and over time you can see the price ran from $4.38 all the way up to $30, and it's now trading at $8.6. Each one of these
bars here represents the volume of shares
traded during that day. If we zoom into
five-minute candles, each bar down below
will represent how much volume was traded within that five-minute period. This example, though, we're
looking at daily candles. So each volume bar represents how many shares are
traded on a daily basis. You can see we've
got all the way up to 400 million shares. That was kinda the peak right here on this nice green candles. So this is what
volume looks like. Now we need to talk about how to understand it and how to
use it as a day trader. And it's actually
also very simple. Increasing volume
confirms the trend. So if you start to see a
breakout or a bullish trend that is just beginning to form and you see that
volume is increasing, that would confirm that
this is probably a good, strong trend that you're
going to want to trade. But this does go in both
bearish and bullish direction. So if all of a
sudden you start to see the price starts
to go downwards in the bearish direction and you start to see
volume skyrocket. Very strong sign that you don't want to be holding that stock. Now, on the other side of things is when volume
begins to decrease. So in volume starts to decline. That means that
the trend could be changing now to go back to
our Bed Bath and Beyond example right here you
can see that the price is pretty much trading in a bearish pattern all
the way down to $4.38. And then over the next month, it kind of works its way up
to around this five-dollar, maybe $6 level right here. And then the volume
starts to increase. It increases dramatically
compared to how it had been trading in the basically
three months prior to this. And that is a very good science. Now we have the
price going up and we have the volume
starting to increase, even though we have three
red days right here, the volume has
dropped a little bit. It is still two or
three times higher than it was just three or
four trading days ago. So that is still a very
good sign and it is a show that there's increased
volume in the stock. And as that price goes up, that is a very good sign
because it confirms that trend that there's new
traders entering the market, and that is what is
driving the price up. This would be a
very clear case of hype that is driving the
stock up for whatever reason. And as you can see, the
volume continues to increase all the way until we get
to a high of around $30. And on the very next day the volume actually
starts to decrease. And so that would be our
first sign that, hey, maybe this trend
isn't going to last. We can also see that with this specific
candle right here, this very high
specific red candle, we can see that the
price tried to get up to $30 and then it got sold all the way back down to around 23 or $24 right here, just looking at
that candle alone, that is a bearish indication that this trend
might be changing. And then when you add in that
we have decreased volume. That is kinda confirmation that this trend is
probably coming to an end. And as you can see, that is exactly what happened
over the next four days. And so we are using
the price action as the primary determination
of what is happening, whether we're in a bullish
trend or a bearish trend, we see that first candle that's gonna be kind
of a warning sign. First of all, it's red. Second of all, we closed
lower than we open. So that's a big sign, a big red flag that this trend is probably
coming to an end. And then at the same time
the volume dropped off, indicating that there's
less traders coming into the market for
this specific security. There's probably
less people that are going to be there to
drive the price up. And if anybody starts
to sell or take profit, that price is cut, probably coming back down pretty quick. And again, that is
exactly what happened. We got down for two days straight as people
began to take profit. And you could have seen it a day earlier if you are
looking at the volume, understanding what this
candle actually means, like what I've shown you
in this course so far. Now, here's another
example of this. This is Zoom video
communications over a longer time frame. And it's really
interesting because the volume going into 2020 here, it was extremely low. It barely even registers
on the chart here. And then COVID hits. And all of a sudden
people are like, I wonder what
businesses are going to succeed during COVID, I wonder who's gonna do well and all of a sudden everybody
gets an invite to a Zoom call because
they can't go meet anybody and the light bulb
clicks and everybody rushes into Zoom stock and
you can see the volume increased dramatically over
the next six months here. This this Zoom stock did not go up because
the company got better. Zoom stock went up because
everybody wanted to buy Zoom stock because they
thought they could get rich because it was going
to do well during COVID. And you can see that with
the dramatic increase in volume right here
of new traders and new investors entering
the market and driving the price up
all the way to $588. If you check the price today, it's it's dropped
pretty significantly. Let's just take a
look right now. Yeah. So as of today, it's currently
trading at $82.77. So it's not looking so great for Zoom communications
considering that one time, that increase in volume there drove the price all
the way up to $588. Now, just as another
final example here, let's talk about day trading. So this is, as you can
see, a day training chart. These are one-minute
candles and these are one-minute time periods
for the volume. And what I want to show you here is just the trend that you're generally going to
see with regards to volume in day trading, we are going to see the
most volume on most shares, on most stocks at
the beginning of the day and at the
end of the day, there usually isn't a
whole lot of stuff that happens in those middle, three or four hours there, unless there is news
about economic events or interest rates or something dramatic is happening
in the market. Usually most of the action
happens at the beginning of the day and a little bit of action at the end of the dance. So what we wanna do
with volume is try and look at larger charts. Look at one day charts, one week charts to try
and identify where some volume is picking up right now and where some
key levels might be. And then we want to zoom
in and we want to try and take advantage of
it throughout the day. If we see spurts and increases in volume
throughout the day, the same rules apply, but a lot of the time
we're actually using volume on the larger
scale to try and identify trading
opportunities where that volume is either
increasing or decreasing. So we can have a bias
or a trading idea or a plan going into that stock on the day
that we plan to trade it. Now, in summary,
Here's the idea, use volume with
daily candlesticks to try and find good
stocks today trait, That's the basic premise here. And then the same rules
apply it once you get into that day trade and
you've identified that stock. Secondly, a stock
that is breaking out with good volume will likely continue to break out if it has good volume and that
volume continues to increase, that is a good show
of confidence. But as soon as that
volume starts to decline, it could mean that that
trend is likely to change. Now, obviously, none of
these rules are a 100%. None of them will work
every single time. I am talking about things in
general here and on average. So please keep that in mind. It's not like this is a
foolproof method or anything. It's just human psychology that we are trying to
apply to what we're seeing in the charts
and then use it to our advantage to profit through the process
of day trading. That's what we're trying
to accomplish here. I'll see you guys
in the next one.
19. Trend Lines: All right, everybody, welcome
back to another video. In this one we're going to
talk about trends and how you can use them to identify
trading opportunities. Let's jump right in, okay, so first of all,
what is the trend? What am I referring
to when I say that? And basically what I'm referring to is the general direction that the price is going in
most of the time it's gonna be a bullish trend
or a bearish trend. Sometimes you'll also see the stock trading sideways
and consolidating. And this has very
similar principles and rules to the support and resistance that we
covered earlier. The only difference
here is that most of the time it is going
to be on a diagonal. And so here you can see Callaway Golf ticker
symbol E LY started out at $37.75 and a traded
all the way down to $17.78 in pretty much a zigzag. And so to identify this trend
and mark it on our chart, all we're gonna do is take a straight line that
connects the highs of the price action
and a straight line that connects the lows
of the price action. Now, it is not going
to be perfect. Again, it's that kind of plus
or minus five or 10% rule. All we're trying
to do is identify the general direction that
the price is moving in. And then once we have
that marked on our chart, once we have it
drawn out like this, There's two different ways
that we can trade it. Number one is to buy or sell on the bounce off of the bottom
or the top of the trends. What I mean by that is
once you've identified this trend and let's
say you identify it by this point here. You want to buy
in on the bottom, you want to sell out on the top and you want to short
the stock at the top. And then by the
cover on the bottom, if you're willing
to take that on. What I mean by this
is we're basically trying to take these insights. Zigzag movements are trying to profit off of each bounce
from side-to-side. The second strategy here
is to be a little bit more patient and wait
for the breakout. So what we're seeing right here is we've got
our trend line, and now the price has broken
through that trend line. It looks like this trend could be changing and we now have a breakout because
of price action, the price action moving
beyond the trend line. And that is a very clear sign that it could be a
buying opportunity. And so you can wait
for the breakout of the bearish trends to break
out in a bullish way. And that'll be your
buying opportunity. If this trend was going
in a bullish direction and it was going up
and to the right, we would be looking for
the breakout downwards and we'd be looking to short
the stock at that point. Now as we zoom into Callaway
Golf here you can see, I want to point out to you
a few opportunities here. So if you notice that we were in a trend, and you said, okay, the price is coming towards the top of the trend right now. I want to make some money because I think it's
going to come to the bottom of the trend and this is just
going to continue. Well, you could
have played short, you could have sold the stock short at twenty-five dollars. You have made your money all
the way down here to $17. And then you could have
close out your position and made a nice kind
of seven or $8. You could have bought the stock and wrote
it all the way back up to $23 where it approach
the top of the channel. And you could have made
another trade there for some nice and easy profit. If you didn't want to trade the inside of the channel like this, you could have waited for the breakout and you
could have bought on the breakout and wrote it
all the way up to $25. Now, the other
examples that I want to show you here on a
day training charts. So this is Google. It's not quite as clear here, but it's a real example that
I literally just took today. And so it's a good scenario
that we should look at. So here's Google. As you can see,
major price movement at the beginning of the day. Like I said, a lot
of the volatility in the price movement in day trading is going to happen
in those first two hours. You can see exactly that
scenario right here. After that, the price comes
down to 114 and then it bounces off this trend line
three different times. So this is a very key
level of support. This is very important here. It, by the second time you
could have said, okay, we've got some
resistance on the top, we've got some support
on the bottom. We're probably trading
within a channel here. You could have bought it 114. You could have sold at 11560. You could have done
the exact same thing back and forth a
couple of times here. Really, really nice. Now it looks like
the price chart is starting to fall
through support. And so this could be an
opportunity to short the stock. You've got you Well, you've only got about an hour, maybe half an hour
left in the day. So you don't have a
whole lot of opportunity with this example here, but it does show you a
little bit of support, a little bit of resistance, and a very clear
opportunity to buy off support and sell it
the next resistance. Now, the last example here I
want to show you is Apple. These are one-day candles and the trend is a
little bit longer. As you can see, we hit a high of one seventy, nine sixty one. And then we traded
all the way down to 12904 in a bit of
choppy trading, not super clear
trend right here. But since that low of 1234, we traded through and we broke through our previous resistance, this line right here. And ever since then
I've been able to connect the highest,
connect the lows. We're trading in a very, very clear bullish trend. And so as a day trader
looking at this, apple is going to be at the
top of my watch list for bullish trades are buying into Apple and selling out
at the end of the day. And I would also be
considering swing trading. This, this is a very clear
technical breakout and it's a great opportunity that did
pay off excellent for us. So lots of opportunities
here both on the day trading, swing
trading opportunity. This is the kind of
technical analysis that will apply to basically
everything that you do. But as you narrow it
down as a day trader, it does get a little
bit more messier, so you have to be a little
bit more concise with it and you have to watch for it
a little bit more carefully. So we're gonna walk
through all of that. And in summary here,
I just want to say that identifying trends with daily candles can help us to
find stocks to day trade. And then when you identify the trends on a
day trading chart, that can help us to execute
the trades as day traders. So that's what we're
trying to do, is basically start with
the big picture, narrow it down to the
best opportunities possible that are gonna give us the most likelihood of making money and then execute
on those traits. Let's keep going.
20. Chart Patterns: All right, everybody, welcome
back to another lesson. In this video, we're gonna be talking about chart
patterns and how you can use them to identify your entry and exit
points. Here we go. Okay, so first of all, what am I talking about when I
say chart patterns? What am I referring to? Well, chart patterns are
common trading patterns. They usually lead to
the same results. So when we can identify
a trading pattern, we can usually also predict what the next movement
in price is going to be, whether it's up or down. Now, I emphasize
usually here because none of these patterns
are gonna be 100%, nothing in investing and
trading is ever 100%. So if anybody tells you that they're completely
lying to you, what we're doing here is playing the game of odds
and probabilities. And we're trying to stack those probabilities in our favor. And by identifying
chart patterns that usually leads
to the same results, we can improve our probability and hopefully become a
more profitable trader. So that's what we're
going to focus on then when it comes
to chart patterns, there are hundreds of different patterns and bunch
of different names for it. And some people
will call this same pattern five different names, but basically they all kind
of fall into a couple of different categories and the
two categories of pattern. So we're going to focus on today double top and
the double bottom, as well as the wedge patterns. So these are the two
kind of categories that we're going to
focus on in this video. Okay, So starting us off here, we have the double
taught pattern and we're looking at an Amazon
stock chart right now. And as you can see, the
price ran up to a high of $188.65 before coming back down to around $160 and
then going back up to that exact same $188 level and getting rejected
for a second time. This is what we would
refer to as a double top. Now if this happened
for a third time, you could call it a triple talk. You can call it
whatever you want. But basically what
we're seeing here is a very clear level of rejection at pretty
much the exact same price level multiple times. That's what we're looking
for in this pattern. Second thing we're looking for is what we call the neck line. The neck line is where those
rejections find support. So as you can see,
we have rejected at 188 here and we do a
double bounce off of 160. That means that we can
identify 160 as our neck line. We have major resistance at 188, and as soon as we
get rejected at 188 for the second time, we now have a double top
with a neck line out 160. The trading opportunity here is when the price breaks
below the neck line. So you can see
right here that as soon as the price
falls below 160, it falls all the
way down to a 133. Actually see a small uptick
in the volume as well. This is confirmation
of a double top, perfectly executed with a
15 to 20% decline in price, which is exactly
what we're looking for as short-term traders. So day trading on
any of these days throughout this decline would
have been extremely easy. And if you want it
to swing trade it, you could have
done that as well. So this is a perfect
example of a double top collapsing
through the neck line. And here is your
trading opportunity. Now, the double top is also the exact same thing on the other side where it
becomes a double bottom. Here is an example
with Udemy stock. You can see we had a double
bottom at $10 right here. We bounced off of $10 twice. We found resistance
right here around $13. This then becomes our
neck line because it's in-between are two levels
where we got rejected. We have our neck line right
here and as soon as the price breaks above the neck
line in this scenario, that is our buying opportunity. And on either of these
days to day trade, would it be an extremely easy
we have increasing volume, as you can see, we're
expecting a breakout. We have confirmation of the double bottom and basically
throw both of these days, the price opened here and it
closed dramatically higher. Which means that would have
been the perfect signal that we should be day
trading Udemy that day. And we have a bias
with regards to what direction we think
it's going to go into. That gives us everything we
need to pull up that chart, start performing
technical analysis on the one-minute candles and enter that trade
on the write-up. Now, the second pattern here is what we refer to as
the wedge pattern. The wedge pattern is basically
where you have support and resistance levels that are
coming together at some point. So basically either
one of them will be completely flat or they
will both be on an angle. In this example, we are
looking at Tesla stock and we have a very clear level of resistance that is
pretty much flat, around 768 or $770. But we also have major
support kicking in as a trend line with
consecutively high or low. So as you can see here, we have four consecutively
higher lows. We have three areas
of resistance that are pretty much
flat across the top. That means that
these two lines are going to come together
at some point. And that means that we
have a wedge pattern. Now when we have
a wedge pattern, we are looking to buy or sell on the breakout of that
wedge patterns. So what you're seeing here
is a level of resistance, a level of support. And we're looking
for the price to break out of that
support or resistance. In this case, the price is
breaking out to the upside, is going in a bullish direction. And we want to be buying in on the breakout of resistance here. Here's another example
with the stock into it. This company owns the software, QuickBooks and TurboTax
and a variety of others. They're basically an accounting and this utility software. And it's really
interesting as well. We've got a very clear
level of resistance. We've got rejected at this for 20 price three times right here, and we have three
ascending higher lows. That means that when we
draw these trend lines, they are going to come
together at some point. And in this example we have another breakthrough
to the bullish side. Usually what I find
most of the times when we have a flat
trend line like this, that is the side that it
is going to break out too. So if for instance, the price just kept
bouncing off of $10 and the highest
kept getting lower, I would expect the
price to go downwards. But if the price kept getting rejected at $10
with higher lows, That's when I would expect
the price to go higher. And so depending on which
side this flatline is on, that is usually the side
that we see the breakout to. However, we're not going to
enter into any trades in here until we actually see that breakout when we're trying to trade
the wedge pattern. Here's another example of $0.10. This is a Chinese
technology company, kinda like Amazon
and Google combined. And they're really,
really interesting. We've got actually a
little bit at two wedges right here you can see ascending support with higher lows, we've got a trend
line that's coming in a bearish direction over
a little bit longer term. And we break out through our
support level right here, and the price falls from $60 all the way down to
thirty-seven dollars. Great opportunity of price
movement right here. And then we set a new high
around $55 right here. We said new lows
around 40, new highs, around 46, new lows around 42. And so basically we've got two
lines that are just slowly coming together here and now we are watching
for the breakout. It looks like in this example we'll probably see a breakout to the bullish side based on
the current price action. But if it comes back down and breaks through support here, that'll be your opportunity
to short the stock again. Okay. So in summary, double top and double
bottoms usually show signs of a reversal when
it breaks the neck line. Same thing happens when you see a triple top or a triple bottom. It's just one extra
high or one extra low. When it comes to wedges, we're looking for a breakout
of support or resistance. We're not entering
the trade until you see confirmation
of that breakout. And what we tend to see is
when we have a flat line like this that access
support or resistance, we usually tend to see the
breakout to that side. However, nothing is guaranteed and you have to be
ready for both options. So that's it for this video, we're going to put all of
this knowledge into play in the next few lessons
here. So stay tuned.
21. Gaps: All right, everybody, welcome
back to another video. In this one we're going
to talk about gaps and how you can use them
for your day trading. Let's jump right in. Okay, so first of
all, what is a gap? What am I referring to and
what do they look like? Basically, what I'm
referring to when I talk about a gap is the change in price between where the stock closes and where it
opens the next day. So if the stock
closes at a $100, opens at 110, that'll
be a gap of $10. Here's what it looks like
on an actual price chart, we're looking at five-minute
candles of Apple stock. On August 19th, the stock
closed just under 172 here. And then on August 22nd, it opened at around a $169. It was probably a weekend. So there's a two day
period in-between there and the price gapped by about $2 a gap in the bearish direction
at Gap downwards. And this is what I'm referring
to when I talk about gaps. Now, why do they happen
and what causes them? Well, it happens because things can change when the
markets are closed. You can only trade
stocks from nine to four unless you go after
hours or pre-market. And therefore, if things change when the
market is closed, it might impact
what orders are in the system when the market
opens up the next day. For instance, if a company
releases really bad earnings, a lot of the buy orders for that stock that are
in the system might get taken out and it might
reduce the price overnight. If there's an economic event or political event that
can impact the company, that can change the orders
in the system because investors might no longer want
to buy or sell that stock. There's also the
chances on a war or an environmental
event that could drastically impact
the production or the profitability
of a company. And all those things
can happen at anytime of the day and
they can affect the stock. And that is why we see
the prices change. They close and when they open. Now, how do we manage
this as day traders? Well, basically, we do not
hold positions overnight, so we can eliminate the risk
outside of market hours. As day traders, we
are only trying to buy in during
the day and we are trying to sell that position by the end of the day so that we do not have any overnight risk. If you are comfortable
with overnight risk or you want to manage that, then you would become a
swing trader and you would basically adjust your
strategy just a little bit. Most of the rules
and the analysis and the chart reading is
almost identical. But your timeframe and your mindset really need
to shift a little bit. Now, when we talk about gaps, gaps are useful the day traders because they can
give us trade setup. So if we see a stock that
wraps up or gaps down, we can use that to our advantage
because hopefully we can identify whether it is a good gap or whether
it is bad gap, and then we can
go long or short. Now, here's an example of a bad gap from an example
that we've used before. This is Bed Bath and
Beyond just recently here, you can see that the
stock gapped up. What I mean by that is on this green candle day it closed at let's just call it
twenty-five dollar. The next day it opened
right here almost at $29 a traded a little bit and then it
fell throughout the day, so gapped up and then throughout
the day if fell down, what that tells us is that
demand is diminishing, the stock is losing momentum. And that gap of was
not successful, it was not continued, it was not maintained, and there was not
enough momentum behind it to continue running
that price higher. And so when I see
a gap like this, it tells me that
though momentum and the demand for that stock is probably starting to run out. And as you can see here at the stock then
began to gap down, basically confirming
our suspicions here. And this would have been an
excellent opportunity to day trade it the next
day or the next day, or even swing traded
on your way down. Now, a lot of people
will call this type of gap and exhaustion gap. And it usually signals
the end of a trend. So a lot of the
times we will use a gap like this as
the signal to exit our trades or to enter it short if you feel like
holding it over time. Now, here's an example
of a good gap. This is a company called
Splash beverage group. And as you can see,
the stock was trading kind of bearish Lee here
around $2 and then it fell all the way down to $1 before seeing a massive gap up. And if you look at
this candle here, it's really nice
because it opened up one level and it closed higher. That means that demand throughout the day
continued to increase. And we also had it continued by two or three more
green candles and then a massive green candle
even higher here. But it was this initial gap up. They gave us the indication that probably put
our eyes on it. And it's this
initial gap up here. They usually begins
to set that trend. What happens in these
scenarios is that a company will release good
earnings or good news, or they'll sign a
new partnership or something positive will
happen in that company. And it might change the investor's
perspective as a whole, instead of selling as a whole, like we saw for the last
three or four months, people began to buy as a whole. And if there's
enough demand there, as you can see by the volume, it can really start to
send the price higher, which is exactly what
we saw in this example. Now, at the same time, we're also going to have just some normal gaps from
regular trading activity. So as you can see this as Google or parent
company Alphabet. We've got some regular gaps
here in some of these prices. And as you can see, that they're fairly
decent sized gaps, but none of them
are super dramatic. None of them are way
out of the ordinary. None of them are more than
that five to 10% level. And so this is just sort of normal trading
activity for Google. And so when you look at gaps, you really have to
take it in context with the rest of the
market doing right now. Is it super volatile right now, which is just causing gaps
in every single stock? And why did a gap, did a gap because
of good earnings or bad news or good results or maybe an
environmental impact or the country where the
manufacturer is going to war. It could be a variety
of different things. So when you see a gap like this, you have to take it
into context and say, what happened with the company? What's happening in the markets? Is this a good thing or a
bad thing for the company? And do I think that
it could continue? Because if it could continue, then you've got a big
opportunity to watch that stock on that
day as well as the next couple of days to look for trading opportunities to go in the same direction
of that gap. So that's what you
should be looking for when evaluating different gaps. Now, in summary here, a gap up on major
news is usually a very good sign and a
signal that the start of a new trend gaps down on bad news usually signaled the start of a new
bearish trends. So basically what we're
looking for is a gap in either direction because we can trade either bullish or bearish. We're looking for a gap
in either direction. And we're looking for
enough confidence with that gap that the trend
is going to continue. Because if we see a gap down on bad earnings and let's say the market is
trading bearish Lee, and the economic forecasts for that specific industry
is also bearish. Well, this is probably the
start of a brand new trend. But if the gap is good based on good earnings and the
market's doing great, and we expect growth
in the industry. Well, this could be the
start of a new trend. And so we want to
use these gap ups and gaps downs to
identify opportunities and then trying to
evaluate whether or not we think the momentum there
is strong enough to continue. Because if it is, then we have our trading opportunity
now stalks that gap up, but are unable to
maintain the momentum, are usually signs of
exhaustion from buyers. And those are the
stocks that we do not want to be buying. We possibly want to
be shorting them depending on the rest of
the economic conditions. Now, just finally here, how do we use this
as day traders? Very simply, large gaps give us a reason to
look at the stock, evaluate it for a
trading opportunity. Determining if it
is a good gap or a bad gap can give us a
strategy going into the trade. It can either give us
an opportunity to go buy the stock or
to sell it short, go bearish or go bullish. But gaps do not usually happen during regular
trading hours. And so as a day trader, we're not going to be
trading in and out of gaps throughout the day
from nine to four PM, we're going to be
looking for gaps, usually outside of market
hours to try and identify which stocks we actually want to trade
throughout the day. You're not going to see major
gaps throughout the day, especially on a
lot of the stocks that we're going to
focus on in this course.
22. Moving Averages: All right, everybody, welcome
back to another lesson. In this video, we're
going to talk about moving averages and
how you can use them to identify a trend as well as find some buy
and sell signals. Here's everything you
need to know. Let's go. Okay, so first of all,
what is a moving average? The moving average is
just simply a line that shows this the
average price of the stock over a given number
of candlesticks is usually displayed on
top of the price chart. And all we're doing here
is just trying to get an average price over a
certain period of time. Here is a chart of Apple
on one-minute candles. So two-day training chart. See I have a blue line
and our red line, these are moving averages. I have two on the
chart at the moment. You could have three
or four or even just one or you could take them off if you just don't like the idea. I always like to trade with two different moving
averages on my price chart. And basically what they
are is they are a line that is calculating
the average price over a certain period of time. And then it is just continuing
to build that line. As you can see, we've got the
blue line right here with a flag on the right side
of the price chart here. It says it's out of $167.32. That means that the
average price over the last 20 candlesticks
here is $167.32. This red line right here is
calculating the average over 50 candle sticks and it
has a flag at a $166.97. And so these moving averages are just a math
calculation that takes the average price over
a given period of time and then just continues
to build this line. The nice thing about them is that we can use them to identify the trend as well as find
some buy and sell signals. So we're using them as day traders to try and
figure out the trend. If the price is above
the moving average, that would be considered
a bullish trend. If the price is below
the moving average, that would be considered
a bearish trend. And as day traders, we always want to buy or
sell into the trends. So if we are in a bullish trend, we do not want to be
shorting the stock. If we're in a bearish trend, we do not want to be
buying the stock. And so you can use the
moving averages to just very easily and simply
look at a chart and say, are we above the long
term moving average? If we are, I only want to buy in if we're below
the moving average, the only trades I want
to take are too short. The stock we, as day traders are trying
to buy into momentum. We're not trying to fight upriver and go
against the grain. So we use the moving
averages to determine what direction we want
to be trading into. Now, let's say that things
are changing and if the price moves above
the moving average, in other words,
we've got they're moving average right here and the price breaks do
that moving average, that would be
considered a bullish indication and
possibly assign that that trend is changing if the price moves below
the moving average, that would be a bearish
indication and it could mean that that Bull Run
is coming to an end. And so we use the moving average to determine what trend we're in and when the price crosses above or below that
moving average, that can be a sign or a signal that the trend
is changing and we wait, may want to buy or
sell a position. Now, when it comes
to moving averages, there are three different
variables right here. The first one is the input, the second one is the title, and the third one is the period. You can remember from this
example I just showed you, we see moving average that shows that we have this
on our chart right here. And then we have three
different categories. You can see it says
close SMA and 20. These are the three different
variables that we can control as day traders to try and get cleaner
signals out of our moving averages
on the price chart. And this is what I'm going to
walk you through right now, is these three different
variables that you can control. Now, the first one
here is the input. You'll remember I mentioned
that we are measuring the average price over a
set number of candlesticks. And those candlesticks,
they have opening prices, closing prices, they have
highs, they have lows. They have a variety of
different data points. And so we need to choose what data point we want to
use in our calculation. Myself and almost every
trade are out there. We're going to stick
with closing price. That is where the candle closes and moves on
to the next candle. That is going to be
the data point that we use in our calculation. This is a small variable that is not going to change the
end result very much, but you do have the control and the choice to change
it on most platforms. Now the second variable here is the type of moving average. And on most platforms there's at least three different
types of moving averages. The simple moving average is the simplest and the slowest. Basically what it's gonna do
is it's going to take your, let's call it ten
candlesticks here. It's going to take the
closing price from each one. I'm just going to average
them out to give you that line that is
displayed on the chart. The exponential
moving average is going to take the same
number of candlesticks, but it's going to put a lot of emphasis on the most
recent candlesticks. And that emphasis is gonna
go in and exponential curve so that the
last set of data, or the tenth day back, isn't going to mean a whole lot. But the most recent day
is going to be very, very important in determining
that new average. The third option here is the
weighted moving average. And instead of changing it
on an exponential curve, the weighted average usually
makes it a very even curve. So that yes, again, the most recent data is
the most important and the oldest data is not as important in determining
the moving average. What is a more gradual and level inclined to the most
important data, whereas the exponential moving average looks more like this. Now, like I mentioned, the simple moving
average is gonna be the slowest and the smoothest
moving average. The exponential
moving average is probably going to be the
fastest, the most jagged, and it's going to follow
the price the closest, and the weighted moving average is gonna be somewhere
in-between. Now the third factor
here is the period. And this is basically
referring to how many candlesticks you want
to use in the calculation. This is going to be by
far the most important variable that you choose when setting up your moving averages. This is going to determine how much data it uses
in that calculation. If we go back to my
first example here, you can see that the
blue moving average only took in 20
days worth of data. And it moved very
closely to the price. As the price moved, the other moving average, the red line took in
50 days worth of data. And it was a very smooth line
with very gradual turns. And it did not
track the price as closely because it was
taking in so much more data. And so by changing
this variable here, you make a very
large impact to how well this moving average
actually tracks the price. Now, for me personally, I like to have two
moving averages. I like to have one very short moving average that's going to track the price very closely. I like to have one longer moving average that's going
to track the price a little bit more
broadly and give me some smoother and
cleaner signals. For me, it's usually an
exponential moving average over ten candle sticks and a simple moving average
over 50 candlesticks. However, I change these
variables all the time depending on
the stock chart to give me cleaner signal. So for instance, if I have a moving average
that is just super, super choppy and the price
is really choppy as well. I will smooth that
out and I will extend this time period
so that it gives me cleaner signals and cleaner idea of what direction the stock
is actually going in. Because if the moving
averages goose going like this and the
price is going like this and they're crisscrossing all
the time does not give me very clear data
and a whole lot of information that I can
actually use in my training. So I will adjust
these variables, usually starting
with the time period so I can get cleaner signals. Now, here are a couple
of examples of how you may want to use
these as a day trader. Okay, so first example
here we're looking at Google on a one-minute chart. And this is a very, very nice day trading charts. So like you can see here in the first couple of
minutes, things get wild. I honestly never trade the first five to ten
minutes of the stock market. It's not worth it. You
have no idea what's happening and there's no
clear direction set yet. So the first five-minutes
happened and as you can see, we settle out below
our long-term moving average here that is
taking in 50 candlesticks. Eventually though,
at around 945 here, we break through
this moving average and we cross above our short
moving average as well. Both of which are very good by signals and bullish signal. So if you had entered
the position right here, you would have got in around $114.40 and you could have wrote it up for the next
two to three hours here, all the way up to 11567. So this is just a
very clear signal where only one thing
happened today. Google dipped below the
moving average and then broke above it and basically wrote that up the next
two to three hours, this would have been
a very clear signal. And as soon as the price falls
below this moving average, that would have been
your cell signal and you would have just made
that much profit. Now the next example
here is Netflix. Again, as you can see, lots of volatility here. And the first five-minutes we dip below are moving average. And then we finally
break back above it. And by the time we're like 101520 minutes into the market, it's very clear that we are in a bullish trend and we
are slowly moving higher. This would be a really
good sign as a day trader. And as soon as we
start to break through the resistance rate here, this could be your
entry point on a really nice entry at 226. You could ride that
up all the way along. And then as you can see, we're starting to
see some resistance around $234 right here, about 1520 minutes ago. It looks like we're
testing that to 34 again here pretty soon. But if we get rejected at 234, that would be what looks
like a double taught to me. And if we fall below that moving average or the neck line, that would be a clear indication to get out of this position. Then the last example I want
to show you here is Nvidia. Again, lots of volatility in the first five
minutes of the market, stocks settles out below
the moving average. It finally breaks through
the moving average with strength and then bounces off the moving average
several times. And again, as you can see, we're starting to just sort
of level off right here. This would be a very nice and clean entry point right here. And the stock falls below one seventy three fifty right here. That's probably where I
would exit the position. So you can see how you can
use these moving averages. You very clear buy and sell signals that can put you
in the right direction, but you always want to be buying into the
trend if the price crosses above the moving average and it stays above
the moving average, I do not want to be
shorting the stock. The price is going in a bullish direction
and I always want to be buying or selling into
the trend, not against it. Now, in summary, for
moving averages, you need to get in there and you need to change the
variables so that you're moving averages can give you a cleaner buy and sell signals. We need to use the
moving averages to identify what direction the stock is trading in and
when that trend changes. And lastly, the price is
crossing above or below a moving average represent
bullish or bearish signals. They are never going to
work 100% of the time. This is not a foolproof method, but this is just another tool
to add to your tool belt when performing technical
analysis and trying to decide, do I want to get in? Do I have enough confidence? And do I think this is going to continue with the momentum
that is what you're using this information for is to build an overall position and an overall hypothesis
with evidence and signals that support
that hypothesis. And so you're using the moving average as just
one tool on your tool belt. It is not the only tool. So you're not going to
just rely on moving averages because it just
never going to work 100%. But we're going to combine
it with our indicators and technical analysis to build our positions and
make some money.
23. Setting up the charts: All right, everybody, welcome
back to another video. In this one we're going to start applying some of the things
that we have just learned. I'm going to walk
you through how to add volume to your chart, how to add moving
averages to your chart, and how to start
drawing support and resistance lines for
your technical analysis. Here's everything
you need to know. Let's go. Okay, so here is my dashboard. As you can see, I've just got one chart open right now we are on a one-minute timeframe
and we're looking at Nvidia. Now, just as a quick
walk through here, if you want to look
at a different stock, you just type in the
ticker here and Apple. And if you want to
change the time period, you just click this drop-down
menu and you can choose whatever you'd like
if you want to go one month, ten minutes. Every candle here will
represent ten minutes and the shaded areas here represent
the after hours trading. So these lighter areas here represent what has
happened after hours. If you want to turn that off, you just go to right-click. You go to Settings here, and then you click on Show, pre-market and post-market and make sure that's unchecked. Click on Okay, and
now it will get rid of all of the pre and
post market trading. Just kinda depends if you're interested in looking
at that at the moment. Now, I'm gonna go back to
NVIDIA because I haven't done anything on that chart yet and we can take
a good look at it. I'm going to change this
back to the one day, one-minute timeframe
and we're going to start doing some
technical analysis here. The first thing that
you may want to do is draw some trend lines. And up here in this menu bar, you can see where it says
drawings right here. And you have a couple
of different options. You have trend line, Priceline, Fibonacci fan, and a
couple of others here. I'm going to walk you
through these ones later. But the ones that you're
going to want to focus on, our trend line and price line. The trend line is
going to allow you to draw lines in a diagonal. It's going to allow
you to basically connect all the highest,
connect the lows. And you can basically put
these lines anywhere you want. The price line is going to be a little bit different
here because it is going to draw the
line only horizontally, is going to highlight a
certain price level so that you can focus on
just that price level. These lines are always
going to be horizontal. And as of right now, I actually have them set to extend to the right side so that as the
price continues to move on, my price levels will
continue to stay there. Now I set that up. You're going to
draw a price line. You're going to
right-click on it and you're going to click
on Edit price line. And then right
here where it says extend the price
line to the right. You're going to make sure
that's either selected or deselected depending
on what you prefer. I personally like to have my lines completely
extend to the right. So that is how you're
going to draw it, your support and
resistance levels. You can draw it your
resistance levels on top. You can draw your support
levels underneath. And then you can draw
your trend levels by just clicking on the drawing here
and clicking on trend line. Now to get rid of any
of these price levels, you're just going to
right-click on them and click on Remove price line, right-click, remove price line, and right-click
remove price line. And there we go. Got a nice clean chart ready
for some moving averages. Okay, so to add the
moving averages here, we're gonna go to store the
same section right here, but we're going to click on
studies and then we're going to drop down to
trend indicators. Remember what we're
trying to identify the trend with the
moving average. Everything kinda
makes sense there. And so we're gonna
go down and we're going to click on
moving average. And it is automatically
going to give us a moving average that uses the closing price as the input. And it's gonna give us a
simple moving average, is going to measure it
on 20 candlesticks. And that is this blue
line right here. If we go in and we
click on studies again, and we add another
moving average is gonna give us
a red line here, but it's gonna give
us pretty much the same characteristics
and the same variables. And we don't want that, we
want to change this up, so we're going to
double-click on it. And as you can see, we have
the parameters right here. And we can choose
the input whether we want it to be
the open and close, the higher, the low or the
combination of any of those. We're going to leave
it as a close. We're going to change this to an exponential moving average. And I'm going to
drop this down to a period of just
ten candlesticks. I'm going to click on, Okay, and I'm also going to
go change our simple moving average to a period of 50 candlesticks so that we have a fast moving average and
a slow moving average. And there we can see
them now displayed on our price chart, and
it looks pretty good. You can see that the price crust above our blue moving
average right here, it stayed above it all the
way up to a price of 173, where it is cross below
it and now it has stayed below it all
the way down to 171. So at first glance here we've got some resistance on the top. We've got maybe a little bit of a price level of support
right here around 170, we're definitely in a bearish
trend right now because our price is below both
of our moving averages, it looks like we may be finding some support right
here around 170. Now, one tool that can help us determine
if we're going to see some support come in right here is the volume indicator. So we're gonna go back up
to studies right here. And we're going to
click on volume. And it is automatically
going to give us a little chart right
here at the bottom. And as you can see,
we've actually seen a bit of volume pick up in just the last few minutes as the price has
started to sell off. So it looks like
maybe this trend downwards is probably
going to continue. Now, here we can see that we can actually move the price and the volume bar so that we can shrink the volume compared
to the price chart. I usually like to have it
about a quarter of the size. Like I said before, I like
to have the volume Bart match the color of the
candles and the price chart. We're going to click,
right-click here. We're going to click
on Edit studies. And then we're going to click on lines and we're going
to go all the way to the right side and
we're going to click on match tick, apply. Okay, and there as you can see, now our volume also matches the color of the
candles and it looks like our price is
continuing to sell off with fairly high volume. So this trend is probably going to increase
and I don t think this support level here is
going to hold up for us. Now throughout the
rest of the course, I'm gonna be showing
you a couple of different indicators and tools that you can add to your chart. And I'm going to walk you
through how to use them. But if you're interested
in checking out some other ones or getting
a head start on them. You can find pretty
much everything in this studies
column right here. Go to trend indicators. We're gonna be looking
at the Mac D as well as the relative strength index and a couple of others in here. These are all just
technical indicators that take some calculation based on the price and turn it into a visual representation
that you can use to buy or sell the stocks, or at least pull
information from the chart and get
some signals out of. So we're going to walk
through a little bit more in depth how to use these
throughout the course. But I just wanted to
give you a quick run through so that you can start to apply what you've just learned
in the last few lessons.
24. MACD: All right, everybody,
welcome to another lesson. In this video, we're
going to talk about the Mac D and how you can use
it to improve your trading. Now, first of all, let's just talk
about indicators. The Mac D is a type
of indicators like the RSI or volume or
the moving averages. And all they are is mathematical equations
that displayed buy or sell signals or give us
some visual cue on the charts. I want to emphasize to you that no indicators work 100% of the time and you
should never be taking a trade based on
just an indicator. You should also not
be adding a bunch of indicators to your
analysis into your charts. You need maybe two or three, some of the ones
that we're going to walk through in this course. But if you're adding 567
indicators to your chart, it is not going to
improve your trading is just gonna give
you mixed signals. Now, when it comes to the Mac D, This is an indicator
that stands for moving average
convergence divergence. And we're going to use it to
identify changes in trends. So if we're in a
bearish trend and that price is changing
to a bullish trend. This MAC D is going to
help us to identify that. Now, here's what it looks
like on a stock chart. As you can see, we're
looking at Apple stock, a six-month time period
with one day candles. You can see some
of the technical analysis that we've done here. The stock is currently
trading within a channel, and we have our blue and our red moving
average on top here, we have our volume with the
matching bars right here. And then on the bottom
we have our Mac D. This is the new indicator
that we've just added. And as you can see
it as a red line and a blue line and a bar
chart in the middle. When we zoom in here, this is what it looks like. So we've got the blue line, and that is actually going
to be called our Mac D line. And as you can see, it is a fairly quick line here that crosses above and
below the red line. That red line is
what we're going to call our signal line. Histogram in the middle is just this bar chart
right here that actually represents the difference in space between the red
line and the blue line. Soon notice when the blue
line is below the red line, the bars are on the
bottom of this 0 level. When the blue line is above
the red line like right here, for instance, the bars
are above the 0 level. And so the bars in the
middle just represent the difference between
the signal line and the Mac D line. Now, how does this work and
how are we going to use it? Well, first of
all, the blue line represents a fast
moving average, or a moving average
that takes into account a short time period. What I mean by that
is this blue line is literally very similar to the moving average that we
put on our price chart, but it is taking into
account a short time period. Whereas our red line
here, our signal line, is taking into account a longer time period and therefore it is a
slower moving average. Or in other words, it is much smoother as it goes
across the chart. As you can see, the red line is much more smooth and gradual, whereas the blue line
crosses above and below it because it is taking information from a
shorter time period. And again, the bar chart in the middle just represents
the difference between them. Now, how do we use
this as traders? How does it work and what kind of information are
we pulling from it? Well, as traders, the buy
signal or the bullish signal, or the change in trend to a
bullish direction occurs when the blue Mac D line crosses
above the red signal lines. So you can see right here on
this green line here where the blue line crosses
above the red line. This is an example where the histogram goes
from the bottom to the top and the blue line
crosses above the red line, and it stays above the red line for a certain period of time. A sell signal from
the Mac D occurs when the blue Mac D line crosses
below the red signal line. I have highlighted
that right here. You can see that the blue line comes here and then
right in this area, a crosses below the red line. I've indicated with this
vertical red line right here. And this would represent a
sell signal from the Mac D. And so just based on this Mac D histogram on the
last two trades right here. We have a buy signal right here, and we have a sell
signal right here, because the blue Mac D line has crossed above
the red signal line, or it has crossed below
the red signal line. Now, when we take
that same MAC D and we add the
chart back onto it, you can see that our buy signal occurred right here around $140, and then we received our cell signal right here around a $170. So just based on the Mac D, If we had traded
based on the Mac D, which we're not going
to do that exclusively. But if we had, we would have
made about $30 per share, which is a nice little tray. Now, to zoom in a
little bit here is the Google stock over
a four minute candle. So this is actually
today's charts, just over a four minute candles. So we've got basically at 930 in the morning right
here where we opened. Now we've got two PM my time, four PM Eastern time
where a closed. And if you look at
this, each candle here represents a four-minute period. And we have one
by signal rate at the beginning of the day
rate here around 10:00 AM, We have another cell signal
right here around 12:30 PM. And as you can see, you
could have gotten at 11430 and sold out at 11572 just in a matter of an hour-and-a-half based on the buy and sell signals from the Mac D, we had another by signal
here around 230 PM Eastern, and another cell signaling
rate before the market closed. Four PM Eastern. And so just based
on these traits, again, you would a man a nice
little couple of percent. And so this is how
you use the Mac D, you get buy and sell signals based on when these
lines cross-over. Now, I want to point
something out here. As you can see, we have
just four signals on this chart right
now because we're looking at the
four-minute candles, I basically rotated through the different options that I have for how I can
look at this chart. And I found that the
four-minute candles gave me the cleanest signals. We had to buy signals
and to sell signals. And as you can see, it
would've worked out extremely well if we had executed
just solely on the Mac D. However, if I change this chart to the
one-minute candles, it is the exact same stock chart over the exact same time period. However, we have like 30 or 40 different buy
and sell signals here, and none of them would have
made us very much profit. So what I'm trying to
emphasize here is that you have the Mac D. This
is a tool that we can use, but you also need to adjust it based on the time period that best suits the chart
for Google stock today, for minute candles gave me the best and cleanest signals
that would have generated the most profit for me if I was looking at the chart on
one-minute candles though, it would have given me 30 or 40 signals from throughout the day. And it wasn't really
helped me out in any way. Just in summary here,
the Mac D is a tool that we can use to
improve our trading. However, price action is
the most important thing, but we can use the Mac D to
confirm or dispute our idea. What I mean by that is the movement of the
price chart itself. That is the most
important thing when we're drawing our support
and resistance levels, or the stock is trading in a channel or it's
forming a double top. That kind of analysis is the top priority
that is the most important and that is
where we should put the most weight for
our decision-making. However, we can then
complement that decision-making with our
indicators like the Mac D, and like some of the other
ones I'm going to walk you through to emphasize and to basically fill out and round out our position and
confirm that yes, this is a good idea to enter
the trade at this timeframe. And we use these
tools as part of our tool belt to basically
improve our trading. We are never going to
trade just on the Mac D, We're never going to trade
just on moving averages. We're never going to
trade just on volume. We're gonna put all of that
together and then evaluate it compared to other
opportunities in the market. We're going to take whatever
opportunity we see either fits our requirements or that we have the
most confidence in. Now, just to finish off these
last two bullet points, we're never going to rely
on just an indicator. I keep trying to emphasize that too many people
are trying to sell an indicator or an algorithm
like it's the holy grail. And the truth is, it's
just never going to work because nothing is 100%. You can start to combine
all of it together. You can build a better idea and improve your probabilities. Lastly, here, we use
the Mac D to identify a change in trend and
then buy into the trend. We want to know when
the stock is either going down or going up or
when that trend changes. Because when that
trend changes and we have confirmation of
that trend change, that is the best
opportunity for us to either buy or sell short. The Mac D can help us
identify those opportunities. Coupled with our technical
analysis of the price action. That's how we fill
out our trading. That's how we build
a position here, and that's how you
generate a trading ideas. So I hope this helped. I will see you in
the next video.
25. Multiple Time Frame Analysis: All right, everybody, welcome
back to another video. In this one we're going to talk about multiple
timeframe analysis, which is an extremely
important concept for you to integrate
into your trading. And I'm also going
to walk you through a really good example that I'm sort of selfishly proud of.
So let's jump right in. Okay, so multiple
timeframe analysis, when I say these words, basically what I'm
referring to as looking at a stock over a long
period of time, a medium period of time, in a short period of time,
multiple timeframes. That's the idea here. And we always want to start with the big picture and
work our way down. Now what I mean when
I say big picture is we want to start with the country that we
want to trade it in. For me, it's Canada and the United States and a little
bit of China we've done, we want to choose the market. I usually like to trade nasdaq, dow Jones and S and
P 500 companies, the larger cap companies
because they have lots of volume and it's easy to get in and out of them
as a day trader. I also like to focus on
the technology industry specifically because
it's where I find the most interests and I
find it the most exciting, and it's also where I
have the most experience. Now, once I have a stock
that I think there's a trading opportunity in
that I want to pursue. I will always look at that stock on the daily candlestick chart. I'll usually look at
it over a six month to two-year time period and try to understand what is
happening right now, what has happened in the past, and what is the
overall direction of this company
over the long term? If I feel like there's
a trading opportunity that I want to take advantage
of that that point, I will then go into
the hourly chart. I'll perform my
technical analysis. I'll draw my support and
resistance line and I'll try to understand what
are the key levels that I need to know about. And if I still feel like
there's an opportunity that I want to trade and I want
to take advantage of. Then we'll zoom into
our day trading charts. We will start looking at
the five-minute chart and the one-minute chart and
planning out our executions. So we are working from
the large picture here all the way down to
the one-minute chart, we're actually going
to execute our traits. Now, the reason we
do this is because our goal as traders
is to identify what direction the market
or the stock is trading in and then buy or
sell into that direction. We're not trying to pick the absolute top and
the absolute bottom. We're trying to wait until
that point is established. A new trend is formed that we can read and we can analyze. And then we want to
bind to that trend to take advantage
of the movement. We're not trying to pick
the top and the bottom. And when that trend changes, we're trying to identify
when a trend has been established and by
herself into that trend. Here's some things
that you need to know and they're
super important. Number one is that most
dogs will trade in the direction of the
market on a daily basis. So what I mean when
I say market as I'm talking about the
broad market in general, usually the S&P 500, nasdaq and the Dow Jones. Those are the indices
that I use to represent the broad market here in
North America basically. Now, what I mean when I say most docs will move in the
direction of the market, is that if you looked at
those three indices in the morning to
start your day and you notice that
they were all up, at least just slightly. You'd be able to look at the
rest of your portfolio and your watch list and
almost every other stock. And it would more than likely
be up to the tune of like 90 to ninety-five
percent of stocks be up. If the nasdaq, the
Dow Jones and the S&P 500 are all rising on that day. And it's because the
market moves as a whole, it goes the other way though. If you wake up in the Nasdaq, dow Jones and S and P 500 are
all tumbling a little bit. 95 to 99% of the stocks you look at that day are probably
also going to be declining. The remedies and
the exceptions to that case will be the companies
that just had major news or just reported
earnings or how to major catalysts that
dramatically affects them. But most cases, most
times most stocks, they will move either
up or down together. Now the variation and the amount that they
move up or down depends on how good the company is and how much the
news affect them. The reason it happens is because there are a
lot of large factors outside of general
markets that can affect how people feel
about their position. So for instance,
if there was a war right next to you that is
going to affect your country. Everybody's get a panic. Everybody's going
to sell off and everything is going to
come down that day. But for instance, if
the government releases a large piece of news that investors are very
positive about, that would probably lift the
entire market altogether. So it's not like
half the market goes up and half the market goes
down each and every day. It's usually like 90%
of the market goes up, or 90% of the market goes
down almost every single day. Now, just to give
you a visual example of what I mean by this, here is Apple stock with one day candles over a
three-year time period. And this green line underneath here is the nasdaq Composite. Now, obviously Apple has done better than the
nasdaq Composite. But what I want you to focus on here is when the
nasdaq is going up, what is Apple's stock doing? Is it doing the exact same thing or is it doing the opposite? And what you'll find is that throughout
this entire chart, it does the exact same thing. When the nasdaq is going up, Apple stock is going up, nasdaq is going down, Apple stock is going down. When the nasdaq goes up over
a two-year time period. Apple goes up over a
two-year time period. When the nasdaq starts to fall, Apple starts to fall. So when I'm trying
to show you here, is that most stocks will
move up and down together. If you can understand what direction the
market is going in, you can start to understand what direction the
stocks are going in. You can start to understand what direction you
need to be trading it. Now, how do we use
this as day traders? Well, once we find a stock that we want to evaluate for a trade, We then need to evaluate that stock on
multiple timeframes. Like I said, daily candlesticks, five-minute candlesticks, one-minute candlesticks,
and even hourly candlesticks in-between
here, if you'd prefer. Now, here is an example that I pulled from this morning and
it's actually really cool. So the company has
called Snowflake. They make enterprise
software as there are very, very exciting company
and they just reported really good earnings last
night or this morning. It was after hours here. And the stock, as you can see, has gapped up by 20% here from one
fifty, one, ninety two. It is doing extremely
well right now. And this is a good gap. This is a very positive gap
because it's gapping up on a good catalyst and has broken through
previous resistance. And we're in kind of what you would call a short-term
bullish trend right now. So this is a very
positive catalysts. This is a great reason
to trade the stock. This is great momentum and the overall market is
going up today as well. Now, when it comes
to this technical analysis on this chart, you can see we were training bearish Lee and a
channel right here. We broke out of that channel, which is a very
positive bullish sign. We have now also established three consecutive
higher lows right here, which has formed a
new level of support, which is extremely nice to see. We have gapped above
our previous resistance here at the beginning of August. We also have increasing
volume right now. And if you zoomed
into the Mac D, be able to see that
it is crossing over. So everything on this chart is looking very, very positive, giving us a lot of reason to trade this doc and try and
make some profit here. Okay, So now that we're zooming into our five-minute candles, It's very exciting
because we can see this gap up in
great detail here. And we can see that
the price actually opened around 191192 right here before coming up to
193 and closing below, giving us a red candle, followed by two
more red candles, which means the
first 15 minutes of the day wasn't so good for Snowflake and we established our first level of
resistance rate around 193. We came down to 184 here and we found support before
rallying backup to 193 and getting rejected for a second time before
trading sideways for about two hours and then
coming back up to 193 again for what looks like
it could be the third test. Now for us, we just had
a very positive gap up the market is moving
higher and we have a great catalyst
for the stock. So we're gonna be looking
for a buying opportunity. And as we come up
to this 193 area, it looks like there could be
an opportunity to get in. So we're going to zoom in closer to our one-minute candles. Okay, So this is
what our one-minute candle chart looks
like right here. And it's very exciting
because as you can see, we're definitely reproaching the previous high at around $193.60. We're also above are moving
averages right here. We're starting to
see a little bit of an increased in volume. And we're definitely
watching this one very closely for
the bullish side. And so at this point right now, I would be watching
this one like a hawk. I'd be looking to buy
in on the breakout of 193, probably fifty, one, ninety three sixty as soon as we can get
above this level, that'd be confirmation of a breakout and
I'll be looking to ride that up until the trend
starts to change again. Now, just to show you
the end result here, here is what happened over the next hour to
hour and a 0.5%. As you can see, we broke through the 1 ninth 350 level and we
actually ran all the way up to $196.99 before starting to cross back through
our moving averages. This is where you would
want to kinda take your profit and exit the tray. And just in right there, you could have captured
two or $3, a nice, beautiful profit per share, and a great, great
trading opportunity, all just strictly
based on starting with the big timeframe,
narrowing it down, performing your multiple
timeframe analysis and using a rational mindset to understand what the
price action is doing. And so when it comes to
multiple timeframe analysis, always start with the big
picture and work your way down. Always try to understand the direction of the
market before trading individual stocks and
always make sure to buy or sell into the
prevailing trend. We do not want to be
swimming upstream. And if there's anything you take from this video,
please take that.
26. Analyzing the Market: All right, everybody, welcome
back to another video. And this one we're
going to start talking about how to analyze the market. Now you've probably heard me say several times that we want to be trading with the
market and not against it. In this video, I'm going to walk you through what that means and how to understand
what direction the market is going in. Let's jump right in. Okay, So the overarching
theme here is that we always want to start with the big
picture and then zoom in. So for me, that means starting with the country where
I want to invest, seeing how the markets overall
are doing in that country, then choosing an industry
within those markets, and then starting to zoom in and evaluate
different stocks. The goal of this strategy
is to understand what is happening in the big picture so that we can have contexts. When we start to zoom
in. Think about it. If you were like Award general
and you're going to war, you want to have a full idea
and as much information as possible about the terrain and the enemy and
what is happening. And then you want to
start zooming into a strategy so that you can slowly start picking
your enemy apart. That is the exact same thing as what is happening
here in the market. We want to get as large
an idea and as good of information and context as to what is happening
in the overall market. So we can start choosing the best opportunities and zooming in and
finalizing our strategy. We want to start
with the big picture and then zoom our way in. Now when it comes to
evaluating the country, you probably have
that already chosen. But a couple of factors
you may want to consider are
political stability, environmental factors like
drought or forest fires, or power consumption,
things like that. And then lastly,
as interest rates, we're going to talk
about interest rates and a second video and then a separate section
because it's a big topic. But in this video,
I want to start looking at the market
and the industry. So Here we're going to go through three
different factors that you should be evaluating before you start choosing stocks. The first one is
looking at the indices, the second one is
looking at the V6. And then the third one is
starting to look at how the industries within
that market are doing. This is what we're going
to focus on in this video. Okay, so the first factor
here is the indices. I think that's multiple for
index just so you're aware that the exact same thing
when I say index and indices, indices is just
multiple indexes, but here is a comparison. This is Microsoft stock
with daily candles compared to the nasdaq
Composite Index. The nasdaq Composite is
this green line right here. And then Microsoft stock
is the irregular candles. And what I want to
point out to you, and I've kinda showed
you this before. But the stocks move in the
same direction as the index. And so we can use the index to understand what
direction the stocks are probably going to go in. So for instance, when this
green line is going up, Microsoft is going up. When the green line turns
around, microsoft goes down. Same thing that happens over
the next year right here as the green line or the
nasdaq Composite goes up, microsoft goes up, and as
soon as it starts to change, microsoft starts
to change as well. Now this happens on
a long timeframe, like what you are
seeing right here, as well as a short time-frame. So here's the exact same
stock, Microsoft stock, but with one minute candles taken from today's screenshot. As you can see, it moves almost perfectly in line
with the index. As data is the first thing
you should be doing when you sit down at
your computer and you open up your platform, is looking at the indices and
how they're doing from me. I've made a watch list that
is basically the market view. Watch this, that shows me all of the major indices for Canada
and the United States. So on this list, we've
got the S&P 500, we've got the Nasdaq 100's, we've got the TSX composite, the Russell one thousand
and two thousand. We've got the nasdaq Composite, we got all the major indices that I would want to look at. So that as soon as I sit
down at my computer, I pulled this up and I'll
zoom in and let's say I want to look at the
nasdaq 100 index. Well, it pulls up my chart. I can perform my
technical analysis. And if I look at this
chart right now, it's very easy to see. We were in a very strong
bullish channel right here. We broke through support that started a new
bearish channel. We have three
consecutively lower highs, so we have a strong level
of resistance right here. We also have support based on these consecutively
lower lows right here. So we are now trading
in a bearish channel. It looks like we've
just been rejected at resistance right here. We have crossed through
our moving averages to the bearish side and the RSI
is also heading downwards. And so overall here, this is a very
bearish sentiment, were in a bearish
long-term trend where an embarrassed
short-term gender, the RSI is heading
down and volume doesn't look like it's
increasing in any way. I expect this to come down to the 11 thousand or
10 thousand level here the next few weeks. And so after looking
at the nasdaq 100 here, everything is bearish. It means that if I'm
gonna be trading stocks within the Nasdaq 100's, I probably want to
be trading them to the downside or to
the short side. So how do we use this as
traders wealth for us, we're going to keep a chart
of the correlating index open on your screen so that you can understand the
direction in the market. So if your training
technology stocks, you're gonna have
a technology index open on your screen
so that you can see how the stock is doing relative to the
rest of the market. And we always want to be trading in the direction of the market. If you're trading and
industrial company, you probably want to have the
Dow Jones Industrial chart. If you're trading just a regular consumer package goods company, you probably want to
have the S and P 500. It just depends on
what you're trading, but you want to have an
index that that stock is with them up on your
screen so that you can understand how
the broad market is doing with regards to
that specific security. Now, the next tool that
we're going to use here to understand the market is
what is called the v6. It stands for the
Volatility Index and it is also known
as the fear index. When this goes up, it means that people are scared and
they are gonna be selling their securities to basically meant
that fear and turn their risky asset into solid cash that they know
isn't gonna go down in value. When people get
scared, they sell out. When people sell
out, prices fall. You saw that from the
first videos that we did as more and more
people want to sell, that is what drives
the price down. And so when people get scared and they sell prices go down. And the VIX helps us understand
when that is occurring. Now, you can't buy
or sell the VIX, but you can use
it to buy or sell other securities and understand what direction they're
likely to go in. So for us, we use the VIX because if the
VIX begins to increase, it means that
people are becoming concerned about
condition of the market. If the VIX begins to
decrease and not increase, it means the opposite. And it means that
people are becoming more confident in the market, then the market may
begin to go up. V6 goes up, we go short. If the v6 goes
down, we go along. Now, just to show you
an example of this, here is the VIX over the basically three-month period where COVID hit the markets. So we've got January
of 2022, May of 2020. You can see where are
around 1175 years and we go all the way up to 8547 and we hit the higher of the v6 on the 18th
of March 2020. So the absolute high of the VIX was the
18th of March 2020. And then after that, the next day we didn't
get nearly as high. We kept down the next day, the day after that
was pretty volatile, but we didn't get
nearly as high. And the basically the trend started to decline after that. So the v6 went all the way up
and start to increase here, hit a high on the
18th of March 2020, And then it started to go down. As the v6 goes down. We want to be going long. We want to be buying into
the market and trying to make money by buying and
holding for the upside. Now, if we had done
that in the S&P 500, let's just see how it
would've worked out. So here's a chart of the S&P 500 pretty much over this
same time period here. And as you can see, we started at 3393 and we
fell down to 2191 here. And the low on the S&P 500
was hit on March 23rd, five days after
the v6 topped out, the S and P 500 bottomed out. And if you had bought and you
could have wrote it all the way up higher than
the pre-COVID highs. What have done extremely well. And the VIX actually gave us the first signal that the market was about
to turn around. Now, once you get to understand what direction the
market is going in and how the VIX is doing is time to start looking at
individual industries. And what I think you should do, and what I personally do is
I've built a watch this, it shows me the 11 different
sectors in the market. These 11 sectors represent
pretty much the entire market. And as you can see, I've got the description on
the right side. So we've got health
care, financial, consumer staples all the way
up to materials and energy, basically broken down here. And what this does is it
takes the overall market, cuts it into 11 different
pieces so that you can see how those individual
industries are doing. And it helps, you know that if the entire market is
down, just like today, we can see which industry
is down the worst, which industries down the least. Or hopefully maybe there's an outlier that we
can use to trade on. So how do we use this
industry watch list? Well, first of all, you need
to make this watch this. So take a screenshot of
this, go to your broker, plug this in and create your
own industry watch list. You can start to zoom in and see which industries
are doing better. This is really nice because it allows us to go
from the market to the industry and then into the individual stocks in
a step-by-step process. It's also nice because if
we see one industry that is doing way better than the others or even way worse
than the others. We can use that as a
reason to look into it further and see if there's
a trading opportunity. Okay, so here's an example of something that
could theoretically happen where looking at this industry can
really help you out. So let's say that you sit
down at your computer, you look at the market
and things are down. You go to the industry
watch list and you start to notice
that everything is down except for energy. Energy is up by three
or 4% and you're like, Whoa, what's going on here? Everything is down right now except for just this industry. So you look into a
little bit further and you do some research
and you find out that there's a
war starting between two oil and
gas-producing countries. That is a big concern
here because if two oil and gas-producing
countries go to war, it means that they
might not be able to produce oil and gas. And if there's less
supply of oil and gas, that means that the price
is probably going to go up, especially if demand
stays the same. If demand stays
the same and there is less resources to go around, all of these people are
going to pay more for those resources so that
they can secure them. That means that oil
prices are gonna go up because supply
has been constraint. When supply goes down and
demand remains the same, prices are gonna go up. So as the smart trader
that wants to take advantage of this and
try and profit from it. We're going to buy
oil and gas stocks in countries that are safe and stable and will continue
to produce oil and gas. Because as long as they
continue to produce, if prices go up, these companies will be
generating more profit and their stock will
become more valuable. And so for us, as traders, we're going to take
advantage of what we noticed in our
industry watch list. Because then we
did some research. We found a catalyst and we
found an angle that gives us an opportunity to make money
from the change in price. That's what we're trying
to do is day traders. This is just a golden example
of how you can do that. Now, in summary here, the overarching thing
is that we want as much info as possible about the conditions
of the market. Before we start
looking for traits, we want to know how the
entire battlefield is looking before we start zooming in and choosing which targets
we're gonna go for first. We also want to use this
info to help us find the traits as well as the
direction of the market. We want to use this info to figure out where
are the outliers, What's happening right now? Is there a catalyst that
we can take advantage of? And if not, what direction is the overall market
going in so that at least I can understand
what I should be looking for when
I start zooming in. Also, we want to be
trading with them market, not against it. I've said that a lot here. The market is going down. You do not want to be
buying securities. If the market is going up, you do not want to
be short-selling. We want to be trading
with the market. We want to be
swimming downstream. We don't want to be trying to
go up against the current. That is not how we're
going to make money. We're gonna make money by swimming in the
direction of the river. So we'll see you guys
in the next video. Hope this one was helpful
and we'll see you there.
27. Economics and Interest Rates: All right, everybody, welcome
back to another lesson. In this video, we're going
to talk about economics and interests rates and how
they can affect your trading. Let's jump right in, okay, so first of all, interest rates, interest rates in
general are set by the Federal Reserve in the United States of America
and the Bank of Canada. In Canada, depending on
what country you live in, you're probably going to
have a regulator that sets what is known
as your prime rate. The prime rate is used as the base rate for
almost all debt, including mortgages,
car loans and business loans and pretty
much everything else. So what happens is when you
go out to get a mortgage, you're gonna get a mortgage
with an interest rate. That interest rate is made up of prime plus, let's call it 2%, whatever prime is that is set by the government and you have to pay that no matter what, then you're paying
an additional 2% to the bank for giving
you that money. And that gives you a
total interest rate of, let's just call it 4%. So prime is at 2%, the bank is charging
you to present your total interest rate
on your mortgage is 4%. If the prime rate changes to 1%, then your total interest
rate is only 3%. But if the prime rate goes up, let's say it goes up to 5%, then your total
interest rate is 7%. So the Federal Reserve and the regulators set what is
known as the prime rate. And that is the baseline for pretty much all debt
in the economy. Now, when the Federal Reserve
or the Bank of Canada chooses to set a high
interest rate that is super important for us to know as traders because it makes borrowing money very,
very expensive. And if you are a
growth stock that is borrowing money from marketing
to acquire new users, to grow your company. It makes it more expensive and it's probably going to
slow down your growth. That is why high-interest
rates slow down the economy because companies can borrow less money to accelerate
their growth, that slows the
company's down and it usually deflates a
stock prices as well. However, one benefit of high-interest rates
is that it also slows down and
decreases inflation. So this is really important
right now as a film, It's August of 2022. Interest rates are like seven or 8% in Canada and
the United States. The Federal Reserve and
the Bank of Canada, or increasing interest rates to try and bring down inflation. The downside of that
is that borrowing money is now more expensive and people in general have less expendable
income because let's say that you're a family of four and all of a
sudden your car loan on your mortgage just went up. That means that you will
all of a sudden have less money to spend on
Apple and Samsung products, which means those
companies are going to bring in less revenue, which means their stock price
is probably going to fall. Everything in the
economy is connected. And that's what you
need to understand. Now, let's say we go vice versa. And the Federal Reserve
and the Bank of Canada actually decided to set low interest rates, maybe around 1%. Really, really nice because it makes it easy
to borrow money. If you're a company
that is trying to grow quickly and you
can borrow money at one or 2% and invest it
at five or six per cent. Well, you just made
four per cent profit there and you're gonna
do extremely well. Low-interest rates speed up
the economy because it helps companies to grow faster and people can afford to
borrow more money. If the interest rate is low, you can afford to
buy a bigger house. You can afford to build
a bigger mansion, hire more people,
hire more carpenters, do all of these things. And that accelerates what is
happening in the economy. And it really, it gives people more expendable
income because they can usually make
more money as well. So as you can see, we've got
two different scenarios. We got low interest rates and
we got high-interest rates. But the real question is, why does it change? Well, I gave you one
example already. For instance, in Canada,
the United States, we have very high
inflation right now. So the Federal Reserve
Bank of Canada, or increasing interest rates
to slow down inflation. And it's basically like
do you want the pain of inflation or do you want the
pain of high interest rates? The Federal Reserve has decided for us that
we're going to take the pain of higher
interest rates so that inflation doesn't
get out of control. That is one reason why you might be in a condition of
high interest rates. Regulators use
interests rates to provide price stability
to the markets. The goal of the regulators
is to try and achieve consistent inflation
and consistent prices over a long period of time. So that businesspeople and
executives and regular folks can go out and they
can predict what their food is going to cost them six to 12 months from now, they can predict
what their mortgage is going to cost them six
to 12 months from now. It allows people to forecast
and make decisions based on stable prices so that
they don't have to worry about the price of milk
going up and down like this. They don't have to worry
about the price of housing going up
and down like this. The goal of regulators is to try and maintain a smooth
and consistent economy. And they do that by
increasing or decreasing the inflation rate to speed
things up or slow them down. Now, how do interest
rates change? That's a very good
question and I'm so glad you asked very simply, regulators meet every
six weeks to evaluate economic data and
choose whether or not they want to increase or decrease the interests rates. And so every six weeks they'll pull together the
inflation information, the jobs information,
unemployment. They'll pull together
housing information. Evaluate all of that data. And just like us,
they'll try and get a big picture idea of what
is going on in the economy. And then they will
make a decision of whether or not they
should speed things up by decreasing interest rates or slow things down by
increasing interest rates. Regulators very
interestingly, also talk in public about how they feel with regards to raising
or lowering rates. And this is actually
kind of cool. This just happened
like two days ago, three days ago as I'm
filming this video, a regulator came out,
they did a speech, they said something,
and the market reacted. I'm going to show you
that in just 1 second, but I want to talk about
why does this all matter? Why am I covering it and why do you need to
know about this? And it's because interest rate
changes, move the market. If interest rates are going up, that means that your house became more expensive
and you have less money to spend on
Apple and Samsung products. So their sales might go down. Higher. Interest rates make it harder for companies to grow. It makes it harder for the
companies to sell products. It makes it harder for
them to borrow money. And in those scenarios, stocks are a little more than
likely going to go down. Now if interest rates are
very low and everybody has a bunch of money
and it's easy to borrow money and
everybody's making money. Stocks you're likely to go up. And so interest rates going
up or down can sometimes dictate the direction
of the market just like what is
happening right now as I film this course, it's not always the case though. And also because regulators
talk in public about how they feel with regards to
raising or lowering rates, the markets also react
to those speeches. So just as an example here, this is a photo
of Jerome Powell. He is the chairman of the FOMC, which is the basically
regulatory body that decides whether interest
rates will go up or down. He just did a speech at
Jackson Hole on August 262022, just a few days before
I am filming this. And it's really, really crazy because he basically
came out and said, Our job is not done yet. We're going to continue to
increase interest rates. And I caution anybody
against trying to pull their foot off
the pedal too early. We've seen what's
happened in history. That's not the right case. We're going to keep going
ahead until the job is done. That's basically what
he said in his speech. And as soon as he said
that the market went from 13,175 all the way
down to 12,620. It's sold off massively. The entire market tanked
by like three or 4%. And it was a
bloodbath on Friday, 100% because of his speech saying that interest rates are going to continue to go up. We're not slowing down
anytime soon and you should get ready for it because growth is probably
going to slow down. He even came out and said
that we're probably going to experience a sustained period
of below trend growth. And when the guy that
dictates interests rates, which has a big effect on
the economy and the stocks. When he comes out and
says that kinda news, it's not a good situation
for the stock market. And you can see exactly
how we reacted. We dropped by a massive
amount on this day and I was like three or 4% for the entire market,
which is rough. So imagine you've got
$100 thousand portfolio just because of
this guy's speech, he just has three
grand overnight and it actually continued going
into Monday and Tuesday. So what you need to
think about is how do you use this information
as day traders? If regulators are raising rates, it makes it harder for
stocks to grow quickly. So if you're in an
environment where the regulators are pushing
rates up real fast, you might want to think twice
about trying to buy long and buy these companies for growth and trying to
get in on alongside. You might want to go short, especially around some of these conversations because when rates change or when regulators
discuss making changes, like what I just
showed you here, the market usually
reacts dramatically, either up or down, depending on what
they're saying. And as day traders, we can use that momentum to execute our own traits and
make some money.
28. Trading Process: All right, everybody, welcome
back to another video. In this one, I just
wanted to talk about the trading process
and what we're going to go through in order to evaluate different companies
and execute the trade. I also want to talk about
my daily trading routines that you can kind of get an idea for what my outline looks
like and then you can customize it for whatever
fits your lifestyle best. And at the end of it, I also just want to give
you a couple of tips and tricks for what I would do if I was
just starting out. This is what I
recommend and this is the framework that I think
most people should use. That's what we're going
to cover in this video. Okay, so first of all,
this steps to trading. This is the process
that we're going to go through in order
to start with the big picture and get all the way down to the execution and the journaling
where we basically cycled through and try
to improve our strategy. So first of all, start with the big picture
and analyze the market. How are the indices doing? What is the economic
situation look like? What does inflation out? What are interests rates at, and how are people reacting to the overall
market conditions. Taking a look at the V6, for instance, could give
you an idea of that. Once you have an idea
of the big picture, that's when we're going
to start narrowing and we're going to
start dialing and we're going to try and find a
catalyst or reason to trade a specific stock and
perform technical analysis. So for instance, the
example we used earlier was every industry was
down except for energy, because oil and gas was
about to skyrocket and pricing could be a reason to trade oil and gas
stocks that day. If Apple releases
earnings one day, that could be a reason
to trade apple. If the technology industry is booming and everybody
is shifting to the Cloud, that can be a reason to focus
on that specific segment. It's really up to you and it comes down to your
personal preference. But what you're looking for is a reason for a stock
to go up or down. You want to try and
trade in that direction, as long as it lines
up with the market. Once you have found
a stock and you have performed your
technical analysis, and you think there's
an opportunity there, you then need to
calculate the risk to reward ratio and make a decision of whether or not this opportunity
fits your criteria. Now, you might
have a set list of criteria and as
soon as it fits it, you execute the trade. What I would recommend
for you when starting out is look at the
market as a whole, try and find a couple of
different opportunities and then choose the best
opportunity that you think has the
most likely odds of coming out profitable
and in your favor, That's the first trade
that you should take. The idea here is that you've got thousands and thousands
of stocks to pick from. Every single one is
going to show you some technical
analysis opportunities and going to have
some catalysts. What your job is to do is to take that
giant list of all of these stocks and
narrow it down to the very best opportunity
for that day. And that's where
you want to try and put your time and effort. Once you have found
that you want to execute and manage the trade, we're going to walk through
all the different order types and all the different
ways to do this. And then once you've done that, you want to journalling your
trade so you can analyze the data and improve
your trading over time. The best traders are the ones that keep track
of their data the best, because then you can use that past data to improve their
strategy moving forward, find out what they're good at, finding out what they're bad at, find out what works for them
and doesn't work for them. And that is the best way
to get better over time. This is like a pilot's log. You would never fly
with the pilot. That can't prove he's being
on all these flights. You would never give
somebody your money if they can't prove that they're
profitable over a long term. This is how you
prove that you're profitable over the long term, is by journaling your traits
and improving to get better. So those are the steps that
we're going to go through to actually execute the trade
and find our trades. But as day traders, we also need our own set of steps and our own
routine in our life. So this is what I do, This is how I personally manage my day and what I like to do. So first of all, I wake up
and the first thing I do, I have a big glass
of orange juice and I have a really
small breakfast. Usually it's an apple or a
bag or something like that. I go through my
morning routine and I just kinda get ready,
brush my teeth, get dressed, and kinda just
put myself in the head-space. Before I sit down
at my computer, I turn on some music
and I just researched what's happening in the
market for 15 to 20 minutes. There's no pressure
here. It's really chill. I'm just kinda zone in and
getting used to things, reading a couple of
articles online, going through a couple
of scanners and just seeing what's
moved overnight, what new news has come out, what economic events
happened overnight? How are the other
market's doing? And I'm just trying
to get a feel for what condition
the market is in. For me, I live in
Calgary, Alberta, so the market opens at 07:30 AM. At that point, I do not trade the first five
minutes of the day. It is going to be super volatile and nobody knows what
direction it's going in. So I usually wait for
at least the first levels of support and
resistance to be established. That way, I'm not jumping into
early on patient with it. And I can evaluate a few different options before narrowing in on the
stock that I like best, I will start to make my trades. I'm usually making just a
couple of trades a day. So nothing drastic,
nothing insane. And I'm trading for
one to three hours if it's a good day and
I'm doing well and I feel accomplished
all walk away and half an hour or an hour
or an hour-and-a-half. But if things aren't
going so well and I'm just kinda making a couple
of breakeven trades. I might stick out for
two or three hours, but I'm usually not shading
anything past that. Once I'm done trading, I'll journal all
of my trades and I will spend the afternoon
making content. Sometimes I have the charts open if there is a
company that's going to IPO or release earnings or any piece of big
news that's happening. For instance, if Jerome
Powell, who's speaking, any events like that, I might try and
take advantage of. But the day-to-day trading, the 80% of my trading
usually occurs in the first, let's call it 15 to 20 minutes to the three-hour
mark of market open. That's usually where
I'm doing most of my training and my
mentality here, especially when
I'm starting out, is that I'm trying to make steady and consistent
profits each day. I'm not trying to blow
it out of the park. I am not trying to just make hundreds of thousands
of dollars in one day. I'm just trying to build a strategy that works
and that is profitable. And if I can get
that out of the way, then I can just increase
the dollar amount in that account and
in that strategy. And I shouldn't be
able to scale it up. I'm not trying to hit home runs. I'm trying to build a safe
and reliable strategy that can scale up by just increasing the
dollar amount and doing everything else
the exact same way. That is the holy
grail to trading. That's what we're
trying to achieve here. And it doesn't matter if
you're trading with a 100 thousand or $3 thousand. Most of the stocks and most of the things that
we're going to talk about and trade in this course. It doesn't matter how
much money you have, it matters how good
your strategy is. And that's what we're going
to try and build out. Now, when it comes to
starting out as a new trader, the first thing you need to do, like I've said
throughout this course, is start with a
practice account. Make some trades in
there and make sure that you're profitable
for a one to two-week period at a minimum in that practice account before you start date treating
with real money. Once you put in your real money, only put in one thousand and five thousand dollars maximum. Just get used to it, try it out for a week or two to make sure
everything is the same in the real account as it was in the
practice account. A lot of practice accounts don't charge commissions,
for instance. So there are going to be a
couple of subtle differences. You need to make
sure that you're just testing things out
and dipping your waters. And solely, once you
feel confident with a thousand or $5 thousand and you're starting
to be profitable, then you can put the
rest of your money in. But don't just put all of your life savings into the account and start
detraining with it right away. You're making a mistake. I'm telling you right now. Also, you need to be journaling your traits from the beginning, we're gonna talk about this
in depth in this course. You need to be doing
that from day one. I promise you it will
help you so much. I didn't journal for the first
year of my trading and I wish I had all of that data x I could have improved
so much faster. I promise you it
is well-worth the time and effort you
need to focus on building a profitable strategy rather than making
a ton of money. What I mean by that
is if you have a profitable strategy
that you can repeat over and over again, that is what you need. That's the holy grail,
that's the golden goose. Because all you
need to do is just do it for a longer period of time or take some other
money that you have, put it into that account
and just wash and repeat. That is the golden goose here. That's what we're
trying to achieve as a profitable strategy, not a lucky trade. There's big difference there, and that's what we're
trying to focus on. So see you guys in
the next video.
29. Risk To Reward Ratio: All right, everybody, welcome
back to another video. In this one, we're going to talk about your risk to reward ratio and how to use that
when evaluating a trade. Here we go, okay, so what is
the risk to reward ratio? Well, very simply it
is the ratio between what you expect to
make or profit on the trade versus
what you are willing to lose if that trade
doesn't work out. So just as an example, if you buy stock XYZ with
the expectation that it will go to a $120 and
you buy it at $100, buy at $100, you set
a stop-loss and $90. Now I know we haven't
talked about that yet. We're going to talk about it
in detail in a little bit. But a stop-loss is an
order that will get you out of a trade if it falls
below a certain level, basically limiting
your downside risk. And so if you enter
a trade out $100, you expect the stock to
go up to $120 based on your technical analysis and
you set a stop-loss at $90. What is the risk
to reward ratio? I'm asking you that question. Think about it in
your head right now. The answer to that is a
one-to-two risk to reward ratio. You're risking $10 to make $20. You're risking one to make to it as a one-to-two
risk to reward ratio. And that is what
we're going to talk about in this example. This is how you
calculate it though your entry points and where
you expect the stock to go, that's your profit, and where your stop-loss is,
that is your risk. All we're doing is comparing those and turning
them into a ratio. And this one, is it a
ratio of one to two? Now, the reason that
this is so important for day traders is
because that number is kinda dictates how
many traits that we have to be right on in
order to be profitable. What I mean by that,
Let's assume that every trade either goes away
or it doesn't go our way, either hits our take profit, where it hits our stop loss. That's not the reality
of day trading, but let's just say
for this example, that is what happened. Well, if we had a risk to
reward ratio of one-to-one, meaning that we're risking just as much as we can gain on this. Then we only have to be right on our trades 51% of the time, kinda like casino odds. You only have to be
right 51% of the time. If it is 5050 odds, kinda like going to the casino, you only have to be
right 51% of the time if the risk to reward
ratio is one to one, that way at the end of the day, as long as you trade enough
and you make enough traits, what kind of average out
you will be profitable. The same thing goes here. If the risk to reward
ratio is one to two, like what we just
saw in our example, we're risking $10 to make $20, risking one to make two. That means that in order
to be a profitable trader, we only have to be correct about 34% of our traits
if you think about it, if we're correct, about one
in every three traits here, and we make twice
as much as we lose. That means that our break-even
point is gonna be at 34%. If our risk to reward
ratio is one to three, we only have to be right just
over a quarter of the time. If the risk to reward
ratio is one to four, jumps to just over 20%. You can kind of
get the idea here. What we're trying to focus on is how much are you
risking versus how much are you able to make and how often does that
work in your favor? Those two factors are what will dictate your profitability
as a trader. Those are the
largest two factors when it comes to trading. And if you could just
be positive here, this is what proves whether or not you have a
profitable strategy. Now when it comes to
my risk reward ratio, it kinda depends a little
bit on the situation. But my absolute minimum
that I will take for one of these traits is a one-point five risk
to reward ratio. So if I am risking $10, I want to make an
absolute minimum of $15 in every single situation. In that scenario at those odds, I only need to win about 40% of my trades to be a
profitable trader. Now, here is an example of
what that could look like. So this is snowflake
with one day candles. We've used this
example throughout the course because it's just
kinda good timing right now. Based on our analysis, we've got support along
the support line. We just kept up, we have
previous resistance at around $180 because we have kept up above
that resistance, that level is now
becoming support. I do expect us to find
some support at a $180. So as they zoom into
my daily chart, remember we're starting
with the big picture. We're zooming our way in as we zoom into our
day trading chart, we're looking at
one-minute candles here, and we can see that
the support level at 180 is actually holding
up pretty strong. We bounced off in the morning. We bounced off at
around 1045 right here. Then right here was
very interesting. We actually had another
double bottom at this one hundred and eighty
one hundred and eighty one level right here. And then we broke through the neck line of
this double bottom. You can see that
breakthrough right here. If you had bought in at 182, you could have set a
stop-loss at $180, that would have given
you a downside of $2. And you could have set
your take profit at $185. And that would have
given us a risk to reward ratio of 1.5. It would have been a nice,
beautiful trade right here. You could have wrote it all
the way up on Snowflake. I'm looking at the chart today because I'm actually
filling this in the next day and the stock
just tested 180 again. And so that is why we start with the big picture
and work our way down. Without that
analysis, we went to have known to look
for that 180 level. But really, really
nice example here. Now, in summary here, the risk to reward ratio represents what
you are willing to risk compared to what you
stand to gain in profit on each and every trade. We never want to take a
trade that is below a 1.5 risk reward ratio. And we always want to keep track of all of our trades
in our journal, the risk reward ratio is one of the most important
metrics that you can measure as a trader. And this variable
or this factor, this risk reward ratio
can also be called the r-value or the are multiple, just depending on who
you're talking to, what software is you're using, and what journal you're
keeping track of your trades. And so that is it for the
risk to reward ratio. This is one of the
most important topics for throughout the
entire course. So please make sure that you understand it because
we're going to use it in almost everything
that we do moving forward.
30. Position Size: All right, everybody, welcome
back to another video. In this one, we're gonna be
talking about position size, which is an extremely important
topic for any trader. So I hope you get some value. Let's jump right in. Okay, So when it comes
to position size, what I'm referring to here is how much money do you place
individual trades with? So if you decide that you're
going to day trade apple, you're going a day trade Amazon. Are you going to enter a
position in Snowflake? What I'm referring
to is how much money are you entering that
position with now, when it comes to
determining position size, I have a methodology
for you here that I use that so far has been the best way of determining what type of sides you should
put on for your trades. Now step number one to this
methodology is to choose your maximum loss percentage based on your portfolio size. So if you take a trade, how much of your overall
portfolio are you comfortable with losing
or risking in that tree? For me, it is usually
2% of my portfolio. So if I'm trading with a
$10 thousand portfolio, my maximum loss on a single
trade should be $200. The maximum amount of
loss that I want to take, one of my portfolio
is $10 thousand, is $200 on an individual trait. That's what I've set out as
my rule and my guideline. And I'm not going to change
that until I'm profitable. That's how you should be
thinking as a new trader. Now step number two here is
to divide your maximum loss. In this case it's $200 by
your risk on the trade. What I mean by this is if
you enter stock XYZ at, at $100 and you put
a stop-loss at $90, your risk is $10 per share. If your maximum loss is
$200 that you're willing to accept as a trader and
the risk is $10 per share. You're going to divide
those two numbers here, and it is going to give you
a position size 20 shares. So what we're doing
here is we're taking the total amount of money that we're willing to lose
on a single position. And then we're taking the total amount of
money that we could lose on an individual
stock basis, we're dividing them to tell us how many stocks that we can buy without going over
our maximum loss here. And the idea is, if we do this math is should protect
us and it should give us a position size that is never going to exceed our
maximum loss of 2%. And so in this example, we should be buying 20
shares of Company X, Y, Z. Because if the trade does
not go in our favor, we will only lose a
maximum of 2% or $200. And so your position size is
a factor of your stop-loss, as well as your
maximum loss based on your entire portfolio. That's how you should
determine how much money to invest into an
individual position. Now, why is this important? Why am I hammering this and
why are we doing it this way? The answer is because if your maximum loss
is 2% per trade, you would have to
lose 34 trades in a row to lose half
of your account. This rule is designed to help us reduce our risk by not taking on positions that are too large. Am I making sure that we
have tight stop losses with appropriate levels of
risk reward ratios and appropriate position sizes. So that if we lose a
couple of trades in a row, it's not going to have a major
impact on our portfolio. Remember, we're going
to have good days, we're going to have bad days. Sometimes you're going to
lose several trades in a row. And we wanna make sure that we have systems and protections in place so that if you
lose three trades in a row, it is not going to completely
destroy your account. It's not going to set
you back three years. It's not going to mess with you, is just gonna be a little
bump in the road that we can overcome because we're
long-term profitable traders. That's what we're
trying to build here is not a get rich quick scheme, but a long-term profitable strategy that can manage
the ups and downs. Now, in summary here, your position size
is a factor of your maximum loss percentage and your stop-loss on the tray, you divide your maximum loss
by your stop-loss per share. And that will give
you the number of shares that you should be buying for that position. This is a risk
management strategy to make sure you don't
blow up your account. You should not be choosing
your position size based on emotions and based on how you feel and based on
how you're trading, it needs to be a set list of rules that keeps me protected. It reduces your risk and
it makes sure that you're following a process and not just veering off based
on your emotions, that's what we're trying
to avoid as traders, if you're trading based on emotion and you're just
doing whatever feels right. That is not a system, that is not a strategy and
that is not replicatable. We're looking for
something that we can scale up over time by just rinsing and repeating and doing
the exact same thing. Emotions are the
enemy of that system. We are only also
going to increase our maximum loss when
we're profitable. So when you're just
starting out, I highly, highly recommend that 2% level only when you are profitable for a month or two at a time. Should you increase
that to three or 4% and you should only ever
increase it by 1% at a time. Now, that's it for this video. These last two ones here
with regards to position, size and the risk
to reward ratio, have been extremely, extremely important topics and I've
covered them quickly. So if you're interested, please go back and re-watch those videos because these are topics that are going to come up throughout the
rest of the course.
31. Stop Loss: All right, everybody, welcome
back to another video. In this one we're going
to talk about stop losses and how you can use
them to manage your risk. Let's jump right in. Okay, so what is a stop-loss? Well, very simply, a stop-loss is an additional order that you are going to place to exit your position if you're wrong. So let's say that you
get into Apple stock at $100 with the expectation that it's going to
go to one-to-five? Well, a stop-loss will get you out of the stock starts to fall. So if we place our stop-loss at $90 and the stock
falls below $90, it will exit that trade for us. And if the price
continues to fall, we will already be out of
that trade so that we're not just continuing
to hold those shares. A decrease in value, a stop-loss is used to exit our position when we're wrong and we use it
to manage our risk. Now, how do you
place a stop loss? Well, that is going to
depend a little bit depending on the software
and the broker that you use. Each one is going to
be slightly different, but this is what it looks
like in Quest rate. We're gonna go to Apple
stock right here. Aapl, either currently
just set for one share and the
order type is a stop. This is where you're going to
choose the stop-loss order. I'm going to walk
you through all of these different order types coming up here in
a future lesson. For this example, we're
going to use a stop order. We're going to set it at $129, which means that the price
of apple falls below 129, it will exit us
out of that trade. In this example, it's
just one share the duration and the routes
are good to close an auto. We're going to talk about
what that means later. And the account is in my
tax-free savings account. And when I click on cell, it's going to ask me to confirm. And then this is what it's
gonna look like on the chart. You can see this line right here where it says negative one. So that means I'm
selling one share using a stop order at a $129. And you can see it is listed
right at the 129 right here. So if the price of apple
falls below 129 right here, this trade or this
order, I should say, will execute and we'll
sell one of my shares. Now, this was just an example, so you can kinda
see it visually. I'm going to walk
through a couple of more examples in just 1 second. But first I want to
talk about why do we place a stop loss on our trades? Well, first of all, it helps us to visually see the risk and the
downside of the trade. By placing a stop-loss, it forces us to set
a point at which we are wrong and at
which we're going to cap our risks and
exit the trade. It makes us go through
their process and actually think about what is the
reward, what is the risk? Does this fit into my criteria? And is this a trade that
we actually want to do? Therefore, it helps us to reduce our risk and actually
think about the downside. We also use the stop-loss to calculate our risk
to reward ratio. Ever entry point right here, wherever our stop-loss is, that is our risk. And wherever we set
our take profit, that is the reward. We need our stop-loss in order to set the risk to reward ratio, which we're using in order to meet a minimum requirement
to enter the trade. Remember, we're not going to
enter any trades that are below a 1.5 risk reward ratio. And ideally, we're looking for a two or three risk reward ratio to make a really good trait. Number three here is that
by setting a stop-loss, it reduces our risks
to large price swings. So if the company comes out with an announcement or something
happens in the economy, or an interest rate changes anything along those lines that can really fluctuate the price during the middle of the day, setting a stop-loss allows us to protect the downside
against one of those large
fluctuations that goes against our trade and would
cause us some losses. The stop-loss prevents
us and it also protects our downside,
basically in general. So having a stop-loss will protect you from losing
a large amount of money. Now, the million-dollar
question here that everybody asks is where do you
place your stop-loss? And I've seen a lot of people explain this a lot
of different ways. And the best
explanation that I've seen and what has
worked best for me is that you placed
the stop loss at the level where your
analysis is wrong. So if we are inevitable
and we think that the stock is going
to one-to-five and we set our stop-loss at 90. That is because if the
price falls below 90, that proves that our
analysis is wrong, that the support level
we were watching for is no longer valid
and that the price is going against what we
thought was going to happen in a way that makes our
hypothesis completely invalid. That's what we're trying
to do here is set the stop loss at the level
where our analysis is wrong. Now, let's walk
through a couple of examples of what that means. So here's a stock
chart of Shopify. As you can see, we're trading
around $94.73 right here. Coming back down to
this 30% to 50 range where we found support at $38, we found some resistance
at around $55, and we'd been bouncing
back and forth between their support and
resistance several times over the last few months, we recently got rejected
at resistance and we are now trading
directly along support. And so when I look at this chart and I think about what is the risk to reward ratio and where would I
place my stop-loss? Here's what goes
through my head. So number one here, if support breaks down and the price falls
through $38.50, that is where my analysis
is going to be wrong. That is where the support
level is probably failing. That is where this technical analysis kind of breaks down. So at that point, I want to set my stop-loss just below that level so that if it fluctuates based on a big order or I'm off
by just one or 2%, I don't want it to take me out, so I want to give it a little bit of room
and I'm going to set my stop-loss at $3,838.25. So just below the previous
low of this channel. So during this channel the
price got it down to $38.63. I'm setting my
stop-loss just a little bit lower than that at $38.25. So that if we come
down and we set just a slightly lower low, it's not going to
exit my position. Now I'm also not
going to get into this position until we start to see a bounce
off of support. So my entry into this
trade would be at $41, my stop losses at 3825. So that gives me a total risk
on this trade of a $1.75. Now for me personally, I would set my tape
profit around $50 here, because as you can see, every time we bounce
off of support, we get back above $50 each
and every single time. So by setting my
take profit of $50, I'm fairly confident that if this works out the way
I think it's going to, that price will
break through $50 and I'll be able to
get out with my money. Now if my entries at 4100
AM I take profit is at $50. That means my reward
on this trade is $9. And since my risk is a $1.75, that gives me a risk to
reward ratio of 5.14, which is extremely good
and extremely safe. So in this example, I'm setting my stop-loss
at 38 Twenty-five, just below support right here. I am taking my profit just
below resistance right here, so that I have a
very good chance of getting filled on that order. I am looking for a $9 upside, gives me a risk to reward
ratio of over five. And this is a very good
and very healthy trade. Now, just to show
you another example, this is a day trading chart. I can show you this
one because we know how it ended up,
which is really nice. This is Amazon. I was
watching Amazon today and it showed me some
really interesting things. It wasn't a great
start to the day, but we did bounce higher
and we actually bokeh above our previous
resistance here at 130. This was a very bullish sign. I didn't enter the
position here, but I was watching it very
closely and it's stuck out to me because 130 enacted
as resistance right here, enacted as resistance for
about ten minutes right here. And then we broke through it to one thirty one thirty eight, and we came right back
down to this 130 level. And so it's acted as resistance twice now
attached to this support. So very important
level for us today. Now, as the price continues on, we can see that we rise back up, but we don't set a new high. We actually set a lower high, which is a sign that we don't
have continued momentum. So as you can see, our all-time high here was one thirty
one thirty eight. Our next high was
lower than that. Our next high after that was
at about the same level. Now we started trading in
the downward direction. So this made me start to think, okay, we're losing
momentum here. This bullish run might
be coming to an end. If I want to go short on
Amazon, how would I do it? And I went back
to this 130 level here because it was
super important. It acted as resistance
than enacted as support. And I thought if we
fall through 130, that could be a great
trading opportunity for us to go short on Amazon. So when I look at
entering this trade, Here's what goes
through my mind. I don't want to get into
this trade until support breaks down if the price
falls below 1 third, That's going to be
my entry point. And so I would be willing
to get into this stock below one thirty one twenty
nine point seven, five. That way I can get in right on the brake and hopefully
I can write it down. Now because 130 is the level
that I am watching for. This is the key levels
that I'm trading off of. And we're going
short on this trade. I'm going to set my
stop-loss at 130.25. So it's going to be above this key level that I'm
trading based off of. And if the price comes
back above 130.25, it means that the price did
not fall through support. It's actually bouncing
off of support. And I want to get out
of that position. I want to exit that trade
because my analysis was wrong. So the price starts to
break down below 130. I'm gonna be entering at one
twenty nine seventy five, setting my stop-loss at 130.25 and I'm going to
set my take profit at 128. We can see right here we
got down to a 128.1-six. If we really sell off here, I think we're gonna get
down to at least close to this level if not
setting a new low, because at this point the market was also starting to sell off. So in this trait here, we have a risk of $0.50. We're getting in at one twenty
nine seventy five were out at 13025 to $0.50
risk right there. And we're trying to
take profit at 128, which gives us a
reward of $1.75. Risk to reward ratio of 3.5. So now that we've got
this trade setup, we can enter the trade when
the stock breaks below. And just to show you exactly
how this trade played out, this is what the rest
of the day looked like. You can see that we flushed
below this 130 level. We came all the way down to 126.72 and our trade would
have filled out 128. And we would have made
that very nice 3.5 risk to return ratio and a
beautiful couple of percent on this trade. And so that is how I
think about these traits. That's how I think about
risk reward ratio. And that is how you should
be setting your stop-loss. Your stop loss should be based on where your
analysis is wrong and your take profit should be
based on previous levels of support or a minimum
risk to reward ratio. Now, in summary, the
stop-loss is part of how we mitigate our risk and
determine our risk setting. The stop-loss is something
that we do on every trade because it forces us to think about the
risks on the trade, the reward on the trade, and what the risk
reward ratio is while protecting our downside and
protecting our portfolio. So the stop-loss is extremely, extremely important on
every single trade. We placed the stop-loss based on where analysis would be wrong. And we're using a
stop-loss when buying long or selling short in the
Shopify example here, we were buying long. We're setting our stop-loss
below the level of support. In the Amazon example here, we're selling short
and so we're setting our stop-loss just above the key level that we
are trading off of. Makes sure that you understand
how to use a stop-loss. Because we're gonna
be going through this for the rest of the course. We're going to use a stop-loss on just about every
single trade.
32. Trading Journal: All right, everybody, welcome
back to another video. In this one we're going to talk about trading journals and how you can use them to improve your performance over time. Let's jump right in.
Okay, so first of all, a trading journal, what am I referring to when I say that? Well, basically what
I'm referring to is a journal to keep track of
your trading performance. We are trying to
document our win rate, our risk reward ratios, what stocks are
going well for us? What stocks are we
losing money on? What times of day, what days of the week, what types of securities
are going well for us? And we keep track of
all of that information in our trading journal
so that we can look back on it and improve
our performance moving forward by
adjusting our strategy. Trading journal
is the equivalent of a pilot's flight log. You wouldn't get into a plane
or a fly with a pilot if he couldn't show and prove to you all of the flights
he's done in the past. It's the exact same thing here when it comes to your
trading journal, you want to keep track of your performance so
that you can analyze what went wrong and you can
prove it moving forward. Now, when it comes
to journal options, you've got lots of
different options. You can do everything by hand and the calculations by hand, and you can keep track of
everything in a notebook. That's actually where
I started with, just document
everything by hand, talk about y-intercept, y-axis did it and kinda
did it from there. The problem with that, so
you have to do everything manually and you have to do all the calculations yourself. When you get tired
of the notebook, then you can move on
to the Excel sheet. The nice thing about an Excel
sheet that you can build in some of those calculations so that it's a lot less work. But the problem with
the excel sheet that you still have to
manually enter most of your trades or most
of what you were doing so that you can then
run those calculations. So these are the two free
options that you can use as a trading journal if
you're okay paying a little bit of money and
you want a cheap version, I would recommend trader sync. I'll put links to these in
the resource tab as well. But trader sink is
what I used for probably two or
three years here. It did a really
good job as 20 to $30 per month depending
on what plan you get. Basically, you make your
trade throughout your day. You download all of your traits, upload them to trade or sink, and then you can access all of your analytics in trade or
sink because it will pull all of your trades
from that download so you don't actually have
to manually enter anything. Dreyer sink was great. It did a good job for me for
a very long time. Now, today I'm currently using a platform
called trade cella. It's a pretty good trading
journal right now. It's a new company that just kinda got started a
little while ago. So it's still up and coming. They're still trying
to improve things, but so far, it's working
out pretty good for me. It is a little bit
more expensive though. So if you're looking
for something on the cheaper side or you don't want to pay that money up front, I would go to Trader sink and then move on to trade cella. If you're not getting
what you want, Autotrader sink when it comes to the goals for
your trading journal, here's what we're
trying to achieve. Number one is we want
to keep track of major trading statistics like our win rate and risk
to reward ratio. We want to help to identify what we're good at and what
we're not good at. So if we're really good
at training tech stocks and really bad at
trading utility stocks. Hopefully, we can use the
data in our journal over the first couple of weeks of
our trading career to try and understand that
so that we can avoid the stocks
we're bad at and stick to the stocks
that we're good at or that we're having
more success with. Training journals also
allow you to go back and analyze and improve
your trading strategy. If you notice that you
are buying into early on the breakouts and
their false breakouts and they're coming
back down on you. You should be able
to document that in your trading journal
so you can go back, analyze it, and realize, oh, I made the same mistake
three times that week. Let's try and cut that
out of my strategy. Now, just to get
you guys started, I am going to share my free
trading journal with you. It is an Excel sheet
on Google Drive and it is also linked in the
resources to this course. So definitely check it out. But here's what it looks like. It is a very, very
simple trading journal. All you do is you enter
in the month here. So let's say it is September when you were starting to trade, you enter that in here. And if you go onto
the next month, all you do is just
copy this page over and start a new
page for the next month. When you make a trade, you enter in the date of the trade. So let's say it was
September fifth, 2022, and we were trading
on Snowflake again, just as an example, let's say that we
got into Snowflake at 190 was our entry, our stop-loss was at 180 and we're trying to
take profit at 210. Then we enter in our exit price. Once we're done the trade, once we're actually out of it and we've closed
our position, what was our average exit price? Let's say that we didn't make
it all the way up to 210. We actually only
made it up to 209. We're going to then
click on Tab and we're going to highlight the
squares right here. We're going to drag
these formulas down and it's gonna give us
all of our new steps. So our projected risk
to reward ratio, a two-to-one risk
to reward ratio. Our actual realized ratio
was 1.9 because we actually sold for $1 less than our take profit or gain or loss on
the trade was about 16%. And we won that trade
because we made some profit. Alright, and then as you
make your next trades, you enter in the same
information here. You highlight these cells, bring the formula down
and it will automatically calculate your average
when rates are right here. So basically wins versus losses, and then your average
risk to reward ratio based on your projections. These are the two
major statistics that you want to keep
track of as a day trader. Because if you have these
going in the right direction, you'll be profitable
no matter what. Now, like I said, that was
just a free trading journal. You, you're welcome
to download it and build on it and add new
features and benefits. I highly recommend it actually, but it is at least something
to get you started completely free and it
won't cost you anything. So I highly recommend it now when it comes to the paid trade, trading journals, There's
actually a lot of advantages to them and
I would recommend them. Once you get started, you don't need them
in week one or two. But if you get into
this and you're a month or two into
any like yeah, day training is for me, then I would recommend going out and getting a paid
trading journal because those paid journals will provide you with much
better analytics and data. So basically, in this one here, I'm really just
providing you with the win rate and the average
risk to return ratio. Kinda see how well you've
done by tracking your trades. But realistically, there's not a whole lot of information here. So if you are interested in getting into this
more seriously, definitely check out one of
the penetrating journals because they'll give you a
whole lot more analytics. And you can usually export
your trades directly from the broker into the
trading journal so you don't have to
manually enter anything. You go through your day, you upload your trades, you analyze your data, and that's it, you're done. It's a very, very smooth
and efficient system. Now, in summary, here, you need to have
a trading journal on day one when you get started. So the dune in your notebook, use that Excel sheet
that I made for you or go out and pay for
one of these services, but you have to have it. You get started because the
trading journal is just like a pilot's Flight Log
is absolutely mandatory. Now, once you get
that training journal up and running and you
get some data in it, you then need to
use it to improve your trading overtime
by figuring out what you're good at and
what you're not good at. You need to analyze
that data to try and refine your strategy. And you can even
say to yourself, Jeez, if I didn't
make this trade, this trade and this trait, what would my
actual win rate be? What would my actual
risk to reward B? And then you can
use that to try and either eliminate things from your training or
adding new strategies or add to the strategies
that are working for you. So that's the idea behind
the trading journal, is to help you improve
your trading overtime by analyzing the data from
your actual traits.
33. Risk management Plan: All right, everybody, welcome
back to another video. In this one, I
want to talk about risk management plans and what factors you need
to consider when building your own risk
management plan, okay, so when I talk about
risk management plans, basically what I am
talking about is the safe guards and
the protocols and the systems that we
have in place to make sure that we do not
lose too much money. Basically, these
are the safety nets and the things that
we're going to do to try and protect ourselves in the event that
a trade goes the wrong way. Now, when it comes
to building out a risk management
plan as a day trader, a couple of different factors to that plan and things that
you should focus on. I'm gonna kinda summarize
them for you here, but you definitely need to
go into more detail for yourself when it comes to the first one that
is position size. We've talked about this before. Your position size
should be based on a maximum 2% loss to your entire portfolio
based on your stop-loss. That is the first factor of
your risk management plan. I personally think it should
be a maximum of two per cent if you're a new trade or you might want
to start with 1%. And if you're feeling
really risky and confident and you're
actually profitable, then you can up it to 3%. The second factor
here is a stop-loss. You need to identify
where you're going to set your stop losses. And me, I personally recommend set your
stop loss is based on where your analysis is proven wrong things
to price action. Now once you have
your stop-loss set, you're going to need
to calculate your risk to reward ratio. And this is the third factor
of our risk management plan. In order to manage our risk, we are only going to accept
traits that have a minimum of 1.5 risk to reward ratio, we would rather a trade that has a 23 or four risk reward ratio. But we're not even
going to consider or look at anything below 1.5. It is not worth the
risk for us as traders, there are better
opportunities out there. Give us better risk
reward ratios. We just need to do
the work and finding them next year is
your entry criteria. This is usually
going to be based on market conditions and
technical analysis. What is it that is making
you look at the stock? What is it that makes
you feel confident about support or resistance
and your entry point? Same thing goes with
your exit criteria. If the market starts to turn, that could be an indication
that it's time to get out. So these are the different
factors that you are going to want to list when identifying what is
your entry criteria and your exit criteria. Then you also want to journal your trades so that you can look at how much risk you took
on that day or that week, and evaluate how you can
reduce that risk or get a better return for that
risk in the future. The journal is part of our risk management
plan and it helps us to identify where we're good, where we're bad, and
how we can reduce or improve our risk reward ratios. And then morning routine, I know this sounds
kind of strange here. But going through
a morning routine, getting in the right mindset, being physically healthy and attentive when you sit down at the computer can help you reduce your risk because you
will have less brain fog. You'll make clear
decisions and I promise you that you'll
be more profitable. So actually going through
a proper morning routine, waking up early,
brushing your teeth, getting breakfast,
taken a shower, doing some exercise during
your morning research, and then getting into
the training mindset can significantly help you
improve your performance. That is why it's part of
the risk management plan. Now, when it comes to my
risk management plan, you're probably already
familiar with except talked about different pieces
throughout this course. But like I said, position size 2% max loss based
on the stop-loss. The stop-loss is paste where my analysis has proven wrong, 1.5 minimum risk
to reward ratio. My entry criteria is based
on a strong catalyst with market confirmation and
good technical analysis. My exit criteria
is that I want to change in trend based on technical analysis or when the market's changed direction. That's probably when I want
to exit that position. I journaled my trades every day with a paid service where I upload my transactions at the end of each day and then
analyze my performance. I go through a morning
routine each and every day that includes breakfast
and market preparation. And I will always step away from the computer after
three bad traits. So if I make three
losing traits that were just poor performance or
they just didn't work out. If I make three of
those in a row, I will step away
from my computer. I will go for a bike ride OK. Oval on the treadmill. I'll go to the gym. I'll go do something else that has absolutely
nothing to do with trading so that I can clear my head and I can
come back later. And I know that
as long as I have a max loss of 2% of
my entire portfolio, I'm only losing a
maximum of 6% that day. That is something
that I can stomach, that's something that
I could swallow. And it's not really a big
deal in the long term. Now, why are we doing this? And why is this important? And why is there a
whole video about this? Well, it's super important
because we want to be trading based on strategy
that we can scale up. I keep repeating this because strategy is the most
important factor here. All you're trying to do is build a system that is
profitable at the end. Because if that's the case, you can just add more money
or you can let it run longer and you're gonna
be extremely wealthy. But the problem is, if you are trading on emotions, if you're training on feelings, if you're trading on
signals from somebody else, if you're trading on anything
that isn't your strategy, you are not going to
be at to scale it up. You're not going to be able to rely on it over the long term. It is not going to
serve you as well as if you just learn how
to do this yourself. You write down
your own strategy, your own risk mitigation plan. You analyze your data to
improve it over time. That is the key here and that is the golden goose to day trading because the riskier if you don't do this is
very, very large. If you lose money, let's say, for instance, you lose 50% of your catchment and a
couple of bad trades. You now need to
make 100% returns on what you have left in order to just be back
where you started. So not blowing up
your account in the beginning is so
crucially important. I can't stress this enough. Start with practice money
until you're profitable. Start with a small account when you are profitable and then only add and once you have
the data to back it up. Because if you take a
loss in the beginning, the amount of money and
the amount of returns, the percentage return that
you need to make back up is ridiculous and it
just gets worse and worse the more money
that you lose. So in the beginning, especially losing money is much worse than
not making money. You are so much
better off having a break-even day making
absolutely no trades, or making three
trades that took you two hours and you walk
out with a big goose egg. That is so much better
off than losing money. Because now you have data
and now you have knowledge. Now you can learn
about the markets and how your brain thinks when you see different price actions. But if you lose money
in the beginning, it is so tough to recover from. So that's why I'm stressing
practice accounts, risk management plans, and
taking responsible traits. Now, in summary here, couple of points I
want to talk with, create a one-page
risk management plan. You saw the points that
I highlighted here. Go to Google Drive,
create a new document, just lists these different
points and then talk about exactly what your strategy
and your plan is. It should be almost
identical to this, but it's just important
that you write it down for yourself and you keep that
with you and your trading. You should also be making
sure that you've thought about the different scenarios
before they come up. So let's say that you
make to portrayed, so you're going to walk away. Are you going to
make another trade? Is it going to be high
risk or low risk? Or let's say that you're
doing really well. You've made three
profitable trades, really, really back-to-back. You're doing extremely well.
You're feeling confident. Are you going to
increase your ratios, are going to increase the amount of money that you're
trading with. What you should do is think
about those scenarios now, type them into your
risk management plan so that you know what
your game plan is, what your strategy is, and
how you going to manage that scenario
before it comes up. Because I promised you a emotions are the
enemy of your trading. If you get over confident the market will slap
you in the face. And if you get so
down on yourself, you're going to miss
the big opportunities. You really need to be
careful with your emotions. You need to stay away
from your emotions. You need to focus
on the strategy and the risk management plan
as part of that strategy. And this is usually the factor separates the good traders and the profitable traders from the traders and the guys that are only at this
for a month or two. So please be careful here. Super important lesson. Please take the time and effort to develop your own
risk management plan. And I'll also put a
template for this in the resources tab
for this course so that you have something to base your risk management plan off of and kind of an outline
that you can use. I highly recommend it,
super, super important. And this is, I can't emphasize this enough
that this is separate. What separates the profitable
or not profitable traders?
34. Order Types: All right, everybody, welcome
back to another video. In this one we're
going to talk about order types and how to actually execute on the order once you've identified the trade,
let's jump right in. Okay, So just to recap
everything here, our process as traders is to start with the big
picture and narrower our way down until you identified and found a
trading opportunity. Once we have identified
that opportunity, we want to take a look at
our risk management plan and see if that trade fits
within that plan. We want to buy or sell into
the direction of the market, We're looking for a
risk to reward ratio of 1.5 or maximum loss
on the trade is 2%. Does this fit in with
what we're looking for? And once it does and we're happy with how things are going, we wanted then
execute the trade. Now when we execute the trade, there's a couple of
different ways to place an order to buy or sell. In this video, we're going to talk about those different ways, and those are called
your order types. Here we're going to cover
three main order types. There's a variety of different
ways to place this order, but the majority
of the order types that you are going to use are either a market order
or a limit order or a stop order that kinda makes
up the majority of trading. That's what we're going
to cover from here. Now we're going to build
on it later in the course. Okay, So the first-order
that we're going to talk about here is
the market order. The market order is really
nice because it will execute your order right away at
the closest bid or ask. So here we've got a chart
with the price on the left. We've got the bid or
the buyer right here. So people are willing
to buy shares, 20 shares at 10530, shares at 10450, shares at 103. And on the other
side of the trade we have the sellers or the ask, where people are willing
to sell or they're asking for $106 for 60 shares, a $107 for 50 shares, under an $8 for 20 shares. We have an exchange with
a bunch of buyers and sellers located all around the country or all
around the world. They've placed their
different orders. And the marketplace right now
is somewhere between 15106, wherever the last
transaction close that. Now if we come in there
as traders and we place a market order to
buy 100 shares. That order would execute
60 shares at 10640, shares at 107, because there's only one person that is willing
to sell their shares out, 106 and there's only
60 shares available, but because our orders for 100, it is going to buy all the
shares at 106 right here, and it is then going to
buy 40 of the shares, 107 to complete our
full 100s share order, it is going to move
the market price of the security up to 107, but it is going to fill our entire order
absolutely. Instantly. We're gonna be able to
click the button and it should fill within a second. We're going to get those
shares at an average price of somewhere between 106, $107. So probably like $106.40 would be the average
price for the shares, which is really, really nice. And there'll be inner
account ready to go pretty much instantly
as day traders. So we can sell
them into minutes. We can do whatever we want. And it'll be really, really
nice as long as we're using a margin account like what
I recommended earlier. Now, if we decided to go
short and we wanted to short sell a stock using
a market security, it'd be pretty much
the exact same thing. But if we wanted to
sell 100 shares, for instance, we'd go borrow
the shares from our broker. We would sell them
directly into the market. And because there's only people willing to buy 20 shares at 105, we would fill all of those, would fill the next 3104 and we would fill all
of the 50 here at 103, and it would drop the price down to somewhere between 13102. And so depending on how you place your order and how
many shares are trading, and what security or trading. Sometimes your orders can
actually move the price, especially if it's
a market order. Or imagine that you're
placing an order and a quarter of a second before
you hit the buy button. Many else places a
massive order as well and their order moves
the price up and then your order
moves the price up. So sometimes if it is
a security that has a very large spread
or a difference between the bid and the ask
where it has very low volume. Placing a market
order can be a little bit risky because the price can move and you're order might execute at a price that
you weren't expecting. And so to overcome
that specific problem, especially as day traders, That's when we would
use a limit order. Now, a limit order will execute your order up to
the limit price. So here's an example. We've got the same chart
down here on the left, and we place a limit order
to buy 100 shares with a limit price of $106 and $0.50. So we're buying a 100 shares, but our limit price
on that by $106.50. So the maximum that
we are ever going to pay in this order is $106.50. And so in this scenario here, we're trying to
buy a 100 shares. We can easily buy
60 shares at 106, but then next batch of
shares that somebody is willing to sell
aren't until 107. We have a limit on
this order of 10650, which is below 107. And it means that
we're not gonna be able to buy those shares. And so in this example, we would have a partial fill of 60 shares out of the 100
that we were trying to buy. We would not be able to buy anymore because on this
specific security, there's nobody left
to sell our shares at a price that is
lower than $106.50. And so the limit order. Allows us to get into a stock
or out-of-stock quickly, but at a maximum buy or
sell price so that we know exactly what we're
going to pay or what we're going to
receive for the security. So we're transacting with a limit order is similar
to a market order, but it puts a cap either on
the upside or the downside. And it allows you to control the ultimate execution
of that order. Because for instance, if we go back to the market order here, and let's say I wanted to
buy 1 thousand shares while I'm going to buy all of these
shares all the way here, and it is going to
drive the price way up. And if I'm not
willing to do that, or if I'm worried about that, I'm worried about moving
the price with my orders, then I can place a limit order so that that doesn't happen. Now, generally, it's not that our orders are going
to be moving the price. It's at somebody else's orders, a big institution or a big bank, or somebody else is going
to front-run the orders. So for instance, if you trade on a platform that is
commissioned free, what is usually happening there, especially if you
place a market order is they're taking your order, they're selling it to
somebody else that is going to buy that
security and sell it to you for ¢0.5 or a cent more and make a
tiny little margin. And so a limit price
prevents that from ever happening and allows you to get in and out of the
prices that you want. And if somebody else places
an order in front of you, it is not going
to move the price before you get your
trade executed. We, as day traders
use limit prices, especially when the big spreads, when we have a big spread
between the bid and the ask, when this difference is
more than 0.5% or 1%, that is absolutely huge. So we gotta be really,
really careful with that. We also use it to just
control our trading. We're not just trying to
get in and out instantly now in order to
protect our risk, that is when we would
use a stop order, also known as a stop loss order. This is the type of
order that will execute when the price crosses
the stock levels. So, for instance, exact same
chart down here on the left. If you place a stop order
to sell 100 shares. So we're assuming that you
already own the shares, you're holding them
in your portfolio. You're trying to protect
your downside with a stop-loss and
mitigate your risk. You place a stop
loss order to sell 100 shares at $104.50, that order would only be
filled if somebody was willing to sell the 20
shares out 105 first. So for instance, in this example you have
a stop-loss at 10450. Your order is only
ever going to fill if the market price
falls below 10450. That's what I'm
trying to say here. So if you set a stop-loss out 10450 and the price drops to 10 for it is going
to fill your order and it's going to get you out because its price dropped below. If the price just touches it, even touches it for $0.01, it is going to fill
your order and is going to try and
sell your shares. It might not be a cell all of your shares depending on
how you place the trade. We're going to talk about
that a little bit later. But the stop-loss
is designed to get your position closed when the price crosses
through a certain level. Now when do we use these
different types of trades? The market orders are used
when we have securities with a tight spread and
I need to get in or out faster if you're
trading Apple, Google, Amazon, Shopify, any of these big name
companies that have high volume and
very tight spreads, you can use a market
order to get in and out. Most of the time, you're not
gonna have too much trouble. But if you're training
a penny stock or company that doesn't
have very much volume, or a company that is
moving very, very quickly. That's when you
would want to place a limit order
because you can get more control over the execution of your traits that is the
key with the limit order. And when it comes to
the stock order here, we use this when we need
to protect our downside, calculate our risk
to return ratio, and make sure that we
are mitigating any of the losses that we could accrue
on each individual trade. Now, in summary, here, we need to use the appropriate
order type based on what we are trying to achieve and
how large the spread is. Like I said, if you're trading the big name text
docs and they have very tight spreads and
everything is pretty liquid. You don't really need
to worry about using the limit orders too often. However, if you're training these younger companies
that are really, really volatile and
are moving quickly, you may want to
consider it also, you should always be starting
with the practice count. Test out these orders, test what it's like to go long tests what it's
like to go short, place a stop-loss on a
long and a short position, makes sure that you
understand how these work. Orders work and you
can control them. And lastly, some securities may require you to
use a limit order. So if you use Quest trade and you're buying
Canadian securities, I'm pretty sure that
you almost have to use a limit order on everything. You can add a limit to your stop-loss isn't
option that you can do. And so when that price
crosses below your stop-loss, your limit is the maximum amount that you're willing to sell for. So if the price
crossed below $85, it would trigger
stop-loss and it would sell at a maximum
low value of $80, which means it would sell
anywhere between 8480. Unfortunately, if it
opened up below that, you would still be
holding the securities. And so you need to
consider those things, but I'll walk you through
exactly what that looks like on the actual request
trade dashboard shortly.
35. Order Form: All right, everybody, welcome
back to another video. In this one, we're going to
talk about the order form and all the other variables that you're going
to need to fill out in order to place that
trade. Let's jump right in. Okay, So when it comes
to the order form, you should recognize
this image right here. This is the same order
form that I pulled up when I introduced you to
the brokerage platform. It has a bunch of
different kinda drop-down menus in
here that you are going to need to select in order to place the
trade that you want. The first one here
is the ticker. This is what we're
trading in this example, we are training Udemy
ticker symbol UDM y, and we're trading the stock. If you're training the options, This would see, say,
OPT right here. But for us, we're first going to start with all stock trading. And so we're looking
at UD, MY stock. We also have our little
paperclip linked up right here. So it is linked to our charts so that everything is
going to be lined up, which is really, really nice. After that, the first thing
that you need to fill out for the actual order
is the quantity of shares that you want
to purchase for right now we have just set at one
because this is an example. And then we have the order type. This is what we
just talked about. And one of the last videos
where we talked about market orders and limit
orders and stop orders. That is right here. After that, we have the duration
of the order, the route of the order,
and the account. That is what we're going
to focus on in this video. When you click on
the drop-down menu for the duration
button right here, you are going to see a
bunch of different options, probably four or five or six, depending on which
broker you use. Again, this might look
slightly different, depending if you're using
a different software. But most of the time all of these different factors are
going to be the exact same. So when it comes to duration, you've got a bunch of
different options right here. For us as day traders most of the time we're just going
to place de orders. And what that means
is that when we place an order to buy or we'd want
to stop loss out there, or we put a take profit. That order is going to
exist throughout the day. And then at the end
of the market close, that order is going to cancel. It's going to erase.
It's not going to exist. Going into after hours, are going into the
next day is what we're going to primarily
use as day traders. Because as data is we want to get in and out
on the same day. We don't want any orders
to execute the next day. Other options that
you do have though, just so you are aware of it, or a GTC order which stands
for good till canceled. Basically, if you don't
cancel this order, it will continue to exist
for as long as possible. Usually most of the
brokers cancel them after 90 or 180 days. But if you send an order
to buy Apple at 120, and Apple just
never gets to 120, but it's a GTC order
or good til canceled. That order will exist for as long as the platform
will allow it. The next type of
order here is a good till extended market order, and this is very
similar to a day order. It will go into
after hours trading. So if you want to buy or sell
anything in after hours, this is probably
the order duration that you are going
to need to use. The other option
here is a good till date option where let's
say that your swing trading or long-term investing
and you're willing to buy Apple at 120 up until
two weeks from now, you can actually set that
date in the order here, and as soon as
that date arrives, it will cancel your order. You also have a
fill or kill order, which basically means fill this order right
away or cancel it. Other option here is the
immediate or cancel, which is basically
trading and you could get a partial fill or
cancel it right away. So both of these ones are pretty much going to
happen right away. Ferc Order requires a fill
of your entire order, whereas the immediate or cancel order only requires
a partial fill. Now, as the atria
is, like I said, we're mostly going to use
the day order because we want our orders to work
on the day that we are training and we don't want
those orders to exist in the system three or
four or five days later, we may use a good till extended market order when we
want to trade after hours, but we'll talk about
that a little bit later. The next variable that
we need to talk about on our order form
here is the route. The route determines how our order makes it to the
exchange, how it goes. Oh, my light just change there. I don't know what happened. This determines how
the order makes it to the exchange and
how it gets from our computer to our
software to the exchange. Most of the time, your broker is
obligated to get you the best price possible
and at the quickest rate. And so most of the time you're going to want to
leave this to auto. This will basically
force your broker to choose whatever is the cheapest
and fastest rate for you. Otherwise, if you are
trading in after hours, you have to use an
arco route. Arc. This is designed specifically
for after hours training. It may depend on your
brokerage as well. So you may need to do
some research on this, but this is where I would start. Always leave your
order route, Otto. And if you are
training after hours, I would use an arco route. Now the last factor
here that you need to consider
is your account. This is probably the most
important thing that you need to think about when
placing your order. Because for instance, right now, I have a EFSA account and RSP account and a margin account
all with Quest Training. So if I start day trading in
my tea EFSA or RSP account, that can have some major, major tax implications for me. It can also really just mess
up my entire portfolio. And so what you need
to do is always double-check that you're
trading in the right account. Make sure that you're
trading in a margin account. I just have selected for
my TFS, say right now, we need to make sure your day trading in a margin account. And you always want to
double-check that every time you buy or
sell a stock that you are buying and selling it in the right account because nothing looks different
between your TFS and your RSP. Other than this little
drop-down menu, that is the only
difference here, the only difference between
any of your accounts. So you gotta be really, really careful and you always
got to double-check this. I've made this mistake
countless times, especially when starting out. So please be very
careful with this. Now, when it comes
to your order form, you're also going to get
some other information, mostly located here
at the bottom, you're going to see
the bid or the ask. That is the price
that somebody is willing to buy shares for. And that is the lowest
price is somebody who's willing to
sell shares for. The difference between
the bid and the ask of 16241627 is $0.03. That means that our spread
on the security is $0.03. You can also see the size
right here represented by S. These are actually
multiples of 100. So somebody is willing to
buy 200 shares at $16.24. Somebody who's willing to
sell 400 shares at $16.27. And it also gives
you the last price. So the last transaction, somebody who was willing to come up in what they were
willing to buy it, meet this person at
the ask at 16, 27th. So that's what this information means here down at the bottom, this Greenlight here
where it says real-time, basically shows you that
you are paying for data to get real-time information
on the stock. Otherwise, it would
probably be a white light and they probably have
a 15-minute delay. Now, in summary, here, you need to fully
master and understand how to use this window to
place the trade you want. We've talked about a variety
of different setups. We've talked about the stop-loss that take profit, different
things like that. You need to control this
order form in order to execute what you want
on that stock chart. And the only way to get good at it is by practicing
and the only way to practice without losing
money because you're experimenting using
a practice account. And so this is one of
the most important times that you should have
a practice count, because when you are placing
orders for the first time, it can get confusing, it can get disorientating. It can get really,
really nerve wracking. Because if you're training with real money and you
make a mistake, it is going to hurt,
it is going to be painful and it's
going to cost you. But if you do another
practice count, you can make as many
mistakes as you want. You can basically just
try out new things and figure it out for yourself while you're
playing with it. So that is what I recommend
opening of practice account, test out these different
order types and get used to it before you
start using real money.
36. Bracket Orders: All right, everybody,
welcome back. In this video, we're
going to start talking about bracket
orders now this is one of my favorite tools on any trading platform because it gives you a huge advantage when it comes to
actually executing your orders with an established
risk to reward ratio. So let's jump right in and I'll walk you through
how it works, okay, So when it comes
to a bracket order, a bracket order is designed so that when
you enter a position, you already have a
take profit level established and a
stop-loss established. And it does that by
basically placing all three orders
at the same time. So bracket order is placing your take profit and stop-loss
when entering the trait. The idea here and
the reason that we use a bracket order is to control your risk to reward ratio when entering the trade. And so here we've got
the same example. We are looking at Udemy stock. We're going to buy one share on a market order to enter the
position with a day duration, the route is set at IE X. I don't know why it's
set like that right now. It should be auto. And then the account that we're using is a margin account. Now, as you'll notice here, there's a little button right here that says bracket order. And when you click this button, this little section at
the bottom drops down. And this is where
we're going to fill in the information for
the bracket order. But before we do that, let's just talk about the strategy here and why
this is so important. And the number one
reason is because as you saw in the last video
placing these orders, there's a couple of
different drop-down menus. There's some things
to think about, and it takes a little bit of time by placing a bracket order. Instead of doing that same repetitive process
three different times, you can do it
altogether all at once. And you can make sure that you haven't established risk to reward ratio before
entering the position. That is the main advantage here. The other advantage
is that it costs absolutely 0 money in
order to place an order. You're not going to
pay a commission, you're not going to
pay for anything until that order actually fills. So I could sit at my computer, I could place a thousand orders
and if none of them fill, I'm gonna get charged
absolutely $0. No transactions are going to happen and I'm going to
pay 0 and commissions. So placing orders to protect
yourself costs you nothing. There's no downside to it, and you can protect yourself from losing additional money. That's why we use a bracket
order and that's why we have no hesitation when it comes to placing orders that will
protect our portfolio. Now how do we fill in
this bracket order? What does it actually look like? Well, first of all,
we're going to place our entry order up top here. This is going to be
the exact same process that I've already
walked you through. You can place the quantity, the order type today you're
going to set the route to auto and you're going
to choose your account. Nothing here is changing. This is how you are
entering the position. This is how you get
into the stock. This is how you start
your day trade. Nothing here is going
to change at all. However, when you click
on the bracket order, this is where you're going
to set your take profit as well as your stop loss. You can see these
two different rows here basically in the
bracket order section. If you only want
to set a stop loss or you only want to take profit, you can select or unselect
these arrows here. And then you're
going to click on the quantity of shares
that you want to set. Usually I keep
this equivalent to the entire position for
us on the stop-loss here, we have it set as a stop. If you're training a
Canadian Security though, you're going to
need to set this as a stop limit and
you're going to have to set the limit
price right here. Your stock price is, let's say when the
price crosses below 80 and your limit price is 70, so you're not willing to
sell anything below 70. Sometimes that's just a
regulatory requirements. So you're going
to have to choose stop or limit right here. You set your quantity, and then right here is where you set your first stop level. This is the price where
you want your trade to activate when the price
drops through it. For us, this is gonna be
that stop-loss level. Currently you can see it
highlighted with a dollar sign. If you click on
this dollar sign, you will usually
be able to turn it to a percentage as well. So you can set up
percentage stop-loss or percentage take
profit if you'd like. You set your limit
order right here for the amount out where you'd
like to take your profit, you set your duration as
good till close or good for the day depending on what type of trade
you are making. And then you leave it, you leave everything here and
you double-check it. You take a look
and you go through every single box a
makes sure it is set up correctly and it is
going to execute the trade that you actually
want it to execute. And then if you're getting into the position and
you're going along on the position with a take profit and a stop loss, you
would click on Buy. If you're selling short
and doing the opposite, you would click on cell. It will give you
a summary screen and then you click on Execute. Now, as day traders, we want to try and use a bracket
order whenever possible, we can change this order. Once the order is placed, we can move our stop-loss up and down and we can change
our take profit. There is some flexibility here, but at least having
it there will protect our downside
and it will allow us to filter out
the trades based on established risk
to reward ratio. So I highly recommend
trying to enter most of your trades
with a bracket order. But you need to always make
sure that you understand your risk reward ratios
before entering the trade. If you're going to enter at a 100 and put a stop-loss at 80. You need to either have
that in your head and you need to be ready to
place that order right away, or you need to have
a bracket order in place to protect
your downside in case a major swing happens or the trade just
doesn't go your way. Everything that
I'm talking about in this section here and
everything that we're doing is to protect the
downside, mitigate your risk, and to lose a little
bit of money or lose no money at all when the
trade doesn't go our way, we never want to
have a bad trade. They'll wipe this out. That is what we were
trying to avoid here. That is, what everything
is about is protecting us from that one scenario so that when the trade
does go our way, we can try and let it
run as far as possible. Or we can at least
capture those small, consistent profits to equal out on any of the small
little losses that we have down below. And when we hit that Runner, We're going to let it run all the way up and
we're just going to slowly move our stop-loss
higher and higher. And we're going to try and
take advantage of that. So we're going to talk about
that a little bit later on. But this is a
summary and this is why we are using bracket orders.
37. Placing Orders: All right, everybody,
welcome back to another video and
this one I want to walk you through a
real life example of how to place an order to buy, how to place an order to sell, and how to take advantage
of bracket orders. Here's everything you need to
know. Let's jump right in. Okay, so here is an
Apple stock chart. You can see we're looking at AAPL and the top
left hand corner, we are looking at the stock
and we are looking at it on a one-minute candle chart. This blue line that runs
across here is actually the opening price of where they started trading
throughout the day. And as you can see,
we've bounced off this key level right here
twice in the morning. It looks like we've
just got rejected by it twice here
in the afternoon. So this is a pretty key level. We were trading in a bit of a bullish channel here
throughout the day, but it looks like we've
just broken through the support level there
to the bearish side, and we've now been
trading sideways for about an hour to an
hour-and-a-half. We're going to use this chart as an example for how
to place orders. It's not the best example of a perfect trade or a trade
that I'd like to enter, but it is a good example. So first of all, we're
going to make sure that our charts are linked
up to our order form. You can see both of
these paper clips here are blue and
the first thing we wanna do is it looks like we've got a little bit of a
double bottom right here. The price is
starting to move up. It looks like the Mac D
could be moving higher. So we're going to place
a market order to buy two shares a day duration, the auto route, and
we're going to be trading in my margin account. We're going to buy this confirmation window
comes up here. You want to make sure
everything looks good. Then we're going to
click on Send order. Now, we currently own two shares of Apple, and
this is working out well, the price is rising right now, but the first thing we wanna
do is think about our risks. So we may want to set
a stop-loss right here below support for
that stop-loss. The only thing we're
gonna do is change the order type to a stop. And we're going to
enter in the price at which we want that
order to execute. For us, I want it to
execute at 153.45. So I'm going to type
that in here, 1.4553. I'm going to leave the
duration as day and leave the route as auto and then
leave the account as margin. And then I'm going
to click on cell. It's gonna give me another
confirmation window here. You want to make
sure that everything in this window looks correct. You're going to click
on Send order and it is going to put our
stop loss rate here. You can see it is now a line
that runs across the screen. And as soon as the price
falls below that line, execute our order to sell
two shares at a $153.45. So that is very nice. We have now protected
our downside. We have entered the trade
with a market order. And because it's Apple, the bid and the ask, or very, very close together,
apple is one of the most popular stocks
on the entire market. So you will never
see the bid and the ask much more than
two or $0.03 apart. So using a market order
on Apple has no problem. You can usually get in at
the price you are expecting. So now at this point
we own some shares and we have a stop
order on Apple. One thing we may
want to consider now is setting a take profit. But the problem
that we're going to have is if we own two shares here and we have an order
to sell two shares here. If we set another order
to sell two shares here, we could run into
a problem because if the price goes up
and we sell two shares, we now have 0 shares. And if the price
comes back down, we have another order
to sell two shares, and that would initiate a
short position, straight. And most brokers
know that that is not what most
traders want to do. And so they will not
allow you to place a second cell order in order for us to just place
a take profit on its own, we're actually going to need
to delete this stop-loss. Now in order to do that, we're just going to go
to pointer right here. And if you want to edit
or delete it at all, you can edit it by
changing any of the factors right here and
clicking on the pencil button. You can also move it up or down, which is really nice. So if you want to move
your stop-loss down, all you do is highlight
it like that. It will bring a
confirmation window up. You click on Send order and it will move
your stop-loss down. However, if you want to exit your stop-loss and just
cancel that order, You click on the X
button right here, click on Yes, and it will
completely cancel your order. At this point though, we have two shares and we're starting to think
about our take profit. I know the price is
changing right here, so it's not a great example. But let's say that we still wanted to place a take profit. The only thing we're gonna do is we're gonna go
to the order type here and we're going
to change it from a stop to a limit order. And this limit is
going to be the price at which we want that
trait to execute. In this example, it's
going to be 154.40. I'll leave the duration as day. The route is auto and
the account as margin. I'll click on cell again. It will give me a
confirmation window. And here you can see it has
placed my take profit at $154.40 to sell two shares so that if the price
comes up to this level, it will exit my position. It will lock in the profit
and I'll be golden. I'll make a bunch of money and will be set and ready to go. I hope you can understand, know why we can't set
both of those orders. Because if the price goes up and then fills the other order, it will initiate the opposite
of what you want to happen. Now to overcome that problem, that is why I told you
about bracket orders. Bracket orders are really nice. Because what happens
with a bracket orders? If you enter the stock at $150 and it goes up and
it hits your take profit, it will cancel the stop
loss, or vice versa. If the price goes down
and hit your stop-loss, it will cancel the
take profit so that if the price goes down and
then comes back up, it doesn't initiate that
other order right here, and it doesn't really mess
you up in screw you up. It will exit the trade if it doesn't give
you what you want, which is really, really nice. And so as of right now, I currently own two shares of Apple as it take profit of 154, actually want to get rid of that order so that we can place. A brand new bracket order. So I'm going to click
on market right here. I'm going to click on day. We're going to use Auto as
the route and we're going to keep make sure that it
is our margin account. We want to make sure
that we're using the same account
every single time. And instead of clicking
buy at market here, I want to click on cell. But first I'm going to get rid
of this take profit level. We're going to click on cell
and we're gonna get out of this order so that we can
place a bracket order. So there you can see
my order filled. That is how you sell two shares. We made a little bit of money on that, which is kinda nice, not a whole lot, maybe
like $0.50 or whatever, but we did make a
little bit of money. Now, let's try and
place a bracket order. So here you can see it will just trade with one share
and keep it simple. We will enter the position
with another market order. We will keep it as the day. We'll leave the
route as auto and we'll use a margin account. Make sure when your day training you use a margin account. In the bottom here, this is where we set our take
profit and our stop-loss. So first of all, our
take profit here, we are only going
to use one share because we're entering
with one share, we're going to set
our limit here. This is the level at which
we want to take our profits. For this example, we'll set it a little higher, 546100.6054. And we will leave
it as good till close to what that means is that this order is going to
exist until it gets canceled. But if the stop-loss
gifts filled, it's also going to
cancel that order, which is really, really nice. The advantage of the
bracket order when it comes to setting
our stop-loss here, we want to make sure that
this is highlighted. We want to choose our stock. We want to make sure that
the quantity is set to one. Then we want to enter
the dollar level where we want that
stop-loss to kick in. For us, it'll be one
fifty three forty five, just below the lowest
point there, 1.4553. And we'll leave it like that. No one option that I really like about Quest trade,
that's kinda cool, is if you click on
this dollar sign here, you can actually change it to a percentage difference or a price difference,
which is really nice. So you've got some
control there. We're not going to
set a limit on it because it's not
required for right now. But when we click on Buy here, what it's gonna do
is it's going to execute our market order, set our take profit right here, and it's going to set
our stop-loss down here. Now click on Buy. Oh, I
put a typo in here, 153. Oh, I did this wrong. 153.45. That's why you gotta
double-check everything. So we're going to click on
Buy here. Try this again. You can see our
orders to buy Apple as a market order or take profit order and
our stop-loss order are all here on the
confirmation page. So please make sure that
you read through this, makes sure that you
confirm and know what your training and when you
click on Send order here, you can see it placed. We've got our take profit
order up on the top. We've got our stop-loss
down here and we've got our order filled confirmation
that just popped up. So now in one single trade, we have entered the position. We have set our take profit and we have set our stop-loss, and as soon as one
of those gets hit, it'll cancel the other order. Now again, if you want to cancel or edit either
of these orders, all you have to do is click
on the pencil right here, or click on the X, and you'll be able to
cancel your order. You can cancel them
independently. So now we have no stop-loss, but we still have a take profit. You can also cancel this
one so that now we're just holding our current position
of one apple share. And if you want to
get out of Apple, we can set a limit
orders that we know exactly what we're
going to get for it. The lowest price that we're willing to take
for Apple array. Now, let's just say as 154.15, we will click on cell. Our bracket order is
still selected here, so we're going to remove
the bracket order. Click on cell here. It's
gonna give us a confirmation. We will click on Send order. And because our limit was within the basically
trading area there, it executed it right away. And now we are out of all of our positions. We're
all set to go. And that is how you
use a market order, a limit order, a stop order, and a bracket order. Please replay this
video if you need help. If you have any questions,
please let me know. Thank you guys for
watching this one. And let's move on
to the next video.
38. Currency Conversion: All right everybody,
welcome back. In this video we're
gonna talk about currency conversion
and what you need to do in order to buy stocks that are listed
in another country. Here's everything
you need to know. Let's go. Okay, so when it comes
to currency conversion, the thing that you
need to remember is that you need to buy stocks in the currency
of the exchange. Now this is super
important because think about a company like
Alibaba or $0.10. They are Chinese companies, but they are listed
on US exchanges, which means you need to buy them in US dollars if you're an American and you want to buy Canadian securities
listed on the TSX, the Toronto Stock Exchange, you're going to need to
convert your US dollars into Canadian dollars in order
to buy those securities. So the key thing
here to remember is that it doesn't matter
where the company operates. What matters is
where the stock is listed and what country
that is exchanges in. Because if it's listed or
that exchanges in the US, you're going to need
to use US dollars. So that includes the New
York Stock Exchange and nasdaq and most OTC markets. If you're in Canada,
that includes the Toronto Stock Exchange, the TSX Venture Exchange, and the Canadian
Securities Exchange. Makes sure that you understand
what stock you're buying, what exchange that
stock is trading on, where that exchange is located. Because that is what is going to determine the currency that you need to use in order
to buy that stock. Now, if you decide that
you need to convert some of your money in
order to buy a stock. You have three different
ways to do it. The first one is using margin, the second one is
using your broker, and the third one
is Norbert gambit. So in this one, I'm
going to walk you through these three
strategies and some of the factors that you may want to consider before choosing
one or the other. Now starting with margin, the idea here is that if you hold Canadian dollars
as an example, this can go vice versa
with us or Canadian. But let's say in this example, you hold Canadian dollars in a margin account and you go out to buy a US stock
on Quest trade, for instance, it will
usually borrow money from your broker
to buy that stock. So we'll borrow money
from your Canadian funds. It will give you US
dollars that is secured against those Canadian funds
and it will buy that stock. So you will be borrowing
money from your broker. It's not going to take that
$4 thousand away from you, but you're going to
have less buying power and you can made to
buy less securities because you are basically borrowing against
that $4 thousand. Whatever money you borrow gets locked up and Quest trade or whatever broker
you're using will give you those shares and
you'll own those shares. The downside here, you will have to pay a little
bit of interest on it. So if you're gonna do
this over the long term, margin might not be the
best option for you, but if you're going to just
day trade a security that's traded on another exchange for one day and see how it goes. This is probably the
best option for you. Now, if you plan to
swing trade or invest, you may want to convert
some of your money. Or if you just plan to day trade both Canadian and US markets, you may want to have
some Canadian funds and some US funds. And if you were trading
with a large amount or you're converting
a large amount, your broker is going to
charge you between 1, 2%. That isn't really a big deal
if you're trading with $100, but if you're trading
with $10 thousand, you're going to pay $200
just to convert your money. And that is kind of a pain in the *** and it only gets worse. Now some brokers are better. Some brokers or worse, usually it's between 1, 2%, but they will charge you a fee if you just
want your broker to straight up convert
canadian to US dollars. So to get around
this massive fee, especially for large
amounts of money, like imagine if it
was a $100 thousand, you'd be paying $2 thousand
just to convert your money. It's kinda ridiculous. And so to get around that, we use the third
strategy here and it's called Norbert gambit. The idea here is
that there is no fee and there is no cost
to convert your money. It takes a couple of days. So the benefit is
that you don't have to pay anything to
convert your money. The downside is
that it could take a couple of days to actually
make that conversion. So you need to ask yourself, are you willing
to pay the fee to your broker of $2 thousand here or are you okay waiting a couple of days for
your money to convert? Now, when it comes to Norbert, gambit is a three-step
process here. So the first thing you're
gonna do is you're going to buy a
Canadian Security. However, that security
has to be listed on both US and
Canadian exchanges. That is the key factor here. I'm going to tell you
which one I recommend buying in just 1 second here, but that is the first step by a Canadian Security that's
listed on both exchanges. You're going to reach
out to your broker and you are going to ask them to journal to the
equivalent US security. So you buy it in Canada, you reach out to your broker and you ask them to do something
called journalling, which is basically
converting that security from canadian to US dollars. It's just going to give you the equivalent number of shares. But on the US security of the exact same company or ETF
or whatever you are buying. So that's the idea
here is you're going to reach out
to your broker. You're going to ask
them to journal it to the US equivalent and then you're going to sell that
US security for US dollars. You will have US dollars
come into your account. And that way you will have converted your
Canadian dollars into US dollars without paying any currency conversion fees and without paying
any processing fees. Now, when it comes to choosing a security that's listed
in both Canada and the US, I highly recommend a US
dollar currency ETF. This is an ETF that tracks
Canadian and US dollar. And it basically
is trying to stay equivalent to what the
Canadian and US dollars worth. And so if it takes you a couple of days to
make this transaction, it doesn't really matter
because you're not going to be losing any value here. The idea here is that this ETF trades both in Canada
and the United States. And it's designed to track
the value of the US currency. That way, when you are trading Canadian dollars for US dollars, if it was a company
that you were doing this with those listed
in Canada and US, that company came out with
earnings and they were awful. You could lose some value
there that if you do it with DLR dot TO and DLR.edu.TO. You're not going to
lose any value there because there's not
gonna be really any news because it's just a currency ETF that tracks the
value of the dollar. Now, when you send that message to customer
service and to your broker, here's what I recommend
you say, hello, I currently own 100 shares of DLR dot TO this could be any
number of shares you want. I own them in my margin
account and I would like to journal them over to DLR.edu.TO, which is the American version. Can you please
help me with this? They will then ask you to verify your account through a
couple of questions. They'll let you know that they've completed
the transaction. You should see those
shares arrive in your account and
usually two to three, maybe four business days, depending on your broker. Now, in summary, here, you must buy securities
and the currency of the exchange if it's
a Canadian company, but they're listed
on the US exchange, you need to use US dollars. If they're a Chinese company that's listed on a US exchange, you need to use US dollars. You need to match your currency that you are transacting with to the currency of the exchange if you're dealing with
large amounts of money, I highly recommend
Norbert gambit. It is gonna be the most
cost-effective way to convert currency. And you need to make
sure that you are always aware of when you are borrowing
money from your broker. Make sure you understand
and go through the FAQs and look at how your broker is set up for currency conversions. Some of them might
let you borrow money. Some of them might
just automatically convert your money
and charge you a fee. Make sure you are
well aware of that. With trade, for instance, they will let you borrow money. So just make sure
you know that going into it that you're
gonna be paying interests when you
borrow that money. Probably not a good
long-term play. Lots of things to consider here. If you have any questions,
leave them down below and I'll try
and answer them. I know Currency is a big one that a lot of people
have questions about. Let me know if I can help out at all and we'll see
you in the next one.
39. Adjusting a stop loss: All right, everybody, welcome
back to another video. In this one, we're going
to talk about adjusting your stop-loss once you
have entered the trade. A lot of people refer to
this as trade management. And in this video,
I'm gonna give you everything you need
to know. Let's go. Okay, so just to recap here at your stop-loss is in
order to exit the trade. If you're wrong, once
you've set your stop-loss, you use that to determine
your position size. And for most of us, we're
going to use a rule of thumb of only taking
a position size that is gonna give
us a 2% maximum loss on our entire portfolio. We're also only going to
take traits that have an absolute minimum risk
to reward ratio of 1.5. Ideally, we are looking for a 23 or four risk
to reward ratio, but we are willing to
take a 1.5 if we're just looking for traits and we're looking
for opportunities, however, we always want
that number to be higher. Now when it comes to an example of adjusting
your stop-loss, I want to run you through a scenario that I
went through today. I'm filming this on
September 8th, 2022. I'm looking at Google and this is what the chart looks
like throughout today. I was watching it
and I was thinking, Hey, trading opportunity. And I want to just show you what I saw and how I think about this opportunity because it
was just a great example of chain management and
moving your stop-loss. Okay, so first of
all, this is what the stock chart looked like
throughout the day we had, I drew this key level right
here because it acted as resistance for about two hours,
maybe an hour-and-a-half. And here between 1112
and then we broke out of that level and we had
bounced off of it twice. So I thought it acted
as resistance in here and I thought it acted
as support right here. It was just a $109.50 level. That was super important to me. I noticed that the market was going in a
bullish direction. Google was also starting to
go in a bullish direction, but we're trading in a bit
of a channel right here. This was exemplified by a high those set right
here around 1245, another high set around
105110 right here. And then we were just approaching
that level right here. And because the
market was going up, Google's had some
good news lately. I thought that this
stock was going to continue to break
out and move higher. And so I looked at entering this position when the
stock broke above $110, you can see we're about
$0.06 away from it. So I was just setting up
the trade at this point. I wanted to enter
the stock at $110. I want to set my
stop-loss just below the highest rate
here at $109.80. So you can see that
red line right here. This is gonna be my stop-loss. This green line right here
was gonna be my entry. I was looking to take
profit at a $110.60, which would have
given me a risk to reward ratio of three. I was looking for a 67 game and I was willing to risk $0.20 on this day trade for Google stock at about
130 in the afternoon. Now, as you can see,
the stock did end up breaking out and I did get
my entry rate at $110. I set my stop-loss at a $109.80 and I have a
take profit at $110.60. So I got n right here at $110. My stop-loss is this
red line right here at $109.80 and might take profit
right here is a $110.60. Now my question to
you and the reason that this is an exercise
is under this scenario, now that the price has moved, the stock is broken out. I still have a take
profit up here and I have a
stop-loss down here. My question to you is, what is the current
risk to reward ratio? In this example, I want you to write it down
on a piece of paper. I want you to do
it in your head. I want you to think about
this for a minute and pause the video until you have figured that out and
come up with a number. I want you to think
about that real, real hard and just consider, here's the current situation. The price right now is $110.50. You can see this
label right here. What is the current
risk to reward ratio based on the trade
that I entered right here. Okay, So now that
you've got that in your head, Here's
the answer to it. The current price right now,
like we said, is a $110.52. My stop-loss is
still at $109.80. So if this trait doesn't work out and I
don't do anything here, I am going to lose $0.72 from where the
current price is at, right now, I'm also
only going to make $0.08 from where the
current price is at right now if this
trade works out. So if I'm completely hands-off and I don't do anything
and this trade works out. I'm going to make
$0.08 per share, but if it doesn't work out, I stand to lose $0.72 per share. So my risk on this
trade at this point, after the price has
moved now dramatically, dramatically higher
than the reward. And that is not a good
situation for me to be in. I want to be in a position where my reward is significantly
higher than my wrist. And this has happened because
the trade went my way. Now, I need to manage
this trade because the risk to reward ratio is
not where I want it to be, and it's well below 1.5. It's actually negative here
because my risk is much, much greater than the reward. So how do we manage
this? What do we do? What are our options? And how do we think
about this as traders? Well, as traders, we have a couple of different
options here. Number one. We can close the entire position and just take our profit. We can say, Hey, we made our
money, we're doing well, we're above our minimum of
1.5 risk to reward ratio. I risk $0.20 and I could take $0.53 in profit off
the table right here. I can close that the
entire position and I can walk away and
call it a wind. That is option number one. Option number two here is to
sell part of the position and take the profits and see
what happens in the future. You can sell 25%
of the position of 50% or as much as you'd like. And you can just leave
a little bit in there to see what happens.
That's option two. Option three is you can
move your stop-loss up, like we said before, you can adjust that stop-loss. Do you can modify it,
you can even click on it and drag it
higher and lower. And what's really
nice about that is it doesn't cost you anything. You don't have to
pay for anything, but it reduces the amount
of risks that you have. So that could be one option here is to move
your stop-loss up, or option for here
is to do nothing. Just let the trade play out. You can do whatever you want. Just leave it alone,
let it happen. You made your analysis
in the beginning. Let's just see if
you're right or wrong. That's option for, I want you
to think about this again. Decide for yourself,
what would you do? What is the right
thing to do here? How do you manage this? How you think about this? And then I'm going to
show you what I would do. Now hopefully you've
got an answer. I hope you've got
chosen 123 or four. I want you to stick with
that in your head and just stick with it and
glued into your thoughts. And then I want to show
you the next chart, the next chart here as
two additional candles. These are the next two candles that had just formed
on this stock chart. And the price went from
a $110.52 or $0.53. Here it is now at, let's call it a $110.38. We've had two very strong
red candles back-to-back. It also looks like our Mac
D is about to cross over. It looks like the
volume has actually increased on this
second candle here, and we're about to test
our moving averages. So now my question to you is your answer
is still the same. You had these four
options one minute ago. What was your answer? And now that you know, we've had to read candles like this, is your answer, still the same? That's my question for you. I want you to think
about that just for a second and ask yourself, what would you do right now? Now I'm going to tell
you my strategy, how I think about
it and what I would do here it is, number one, I will always move
my stop-loss up to reset my risk
to reward ratio. I am not gonna do
it every second. I'm not gonna do
it every minute, but every couple of minutes,
every five minutes, every ten minutes, I will
be moving my stop-loss up and resetting that
risk to reward ratio. So for instance, in the last scenario where
we were at a $110.52, we only had $0.08
to gain rate here, which means I am
setting my stop-loss at like three or
$0.04 below where the current prices that
is going to protect my downside and that is going to reset my risk reward ratio. I am not going to do
it every ten seconds. Definitely going to do it every at least five to ten minutes. Secondly, I'm always going
to make sure that that's stop-loss is set above
the next key level. What I mean by that is if we go back to this example here, and we know that we just broke
through resistance here. That means that that
resistance is now support. And as we move up, I want to make sure
that this stop-loss is above that key
level of support. And then as we see
this next level of resistance here with
a price consolidated, that is resistance as you break through that
then becomes support. And I want to move
this stop-loss up to the next level of support. I want to make sure
that at a minimum, my stop-loss is that
the next key level? And I also want
to make sure that it has a good risk
to reward ratio. I want to make sure that
I'm protecting my downside. And as long as I
am making money, that is ten times better
than losing money. As soon as I have
the opportunity to make money and
lock in profits, I wanted to eliminate any
risk of losing money. We want to be safe,
we want to be steady, we want to be consistent, and we're looking
for small profits rather than trying to
hit it out of the park, hit a home run, and
blow up our account. Now the third thing that I would consider here is because we were so close to hitting
our take profit level, I would start selling part of
my position on the way up. You can see here that we
moved up very strongly. We basically had another
breakout right here. After not pulling back
significantly at all, we didn't even retest the
previous level right here at $109.8990 right here, we didn't even retest
this previous level. And so as we break out here, that is showing
stronger momentum, a stronger breakout,
we're running higher and we're not
pulling back at all. Which means when
we do pull back, we're probably going to see
a significant pullback. And as a trader, I want to get up and I want to
get ahead of that. Therefore, I'm gonna be
selling part of my position. This strong breakout right here. As I'm moving that stop-loss up, that way I'm protecting
my downside. I'm locking in profits and
I'm making sure that I'm capturing as much profit
as possible on this train. And this is the next
two candles here. So for me in this scenario, what would have happened is on this second red candle here, my stop-loss was hit. I got out of this
trade, I exited it, I took my profit and yes, we did not hit our initial
take profit level. We did not hit that initial analysis pinpoint
that we wanted to get to, but we got pretty darn close. And we also got well above our risk to return
ratio minimum of 1.5, we risk $0.20 here. Locked in at least $0.40 here. So we locked in at least
a two risk reward ratio, which is still a good trade. So at the end of this, we didn't hit our initial
take profit level, but we locked in a good trade, we made good money on it. It was good profit and
our analysis was correct. So that is what
we're looking for. Our strategy as traders. This is what happened here. So in this scenario, our strategy has traders. We went into the trade
looking for a breakout. We saw a strong level
that acted as resistance, it acted as support. We were chatting in a channel, we are breaking out
of that channel. That's what we're looking for. And we went in with
a very healthy risk to reward ratio, three x. That's what we went
into the trade with. The stock then
broke out and made 2.5 x what we had wrist
before starting to pull back. You'll remember that
the stock minute all the way up to like 110, $0.52 here when we had only
rest $0.20 on the downside. So it made a 2.5
x risk to reward ratio before it even
started to pull back. And so as traders, we are trying to capture
that quick breakout. We thought there was
gonna be a breakout, there was a breakout. And so we're just trying to
capture just that breakout. We're not trying to capture
the rest of the day. We're not trying to
hit a home run here. We're trying to capture that small move in
price that we think has the best odds of happening
we can take advantage of. We're not trying to get greedy if we can't
get all the way up to our three x
risk reward ratio, but we can get to 2.5. I am happy with
that all day long. So in summary here
what I am trying to tell you is to
manage your trade. You want to periodically reset your stop-loss to realign with
your risk to reward ratio. Your risk to reward
ratio should be somewhere in the range
of two to three. When you are resetting
your stop loss, you probably don't
want to use the 1.5 numbers because
there might be just a little bit too tight. Secondly, you want to
focus on just trying to capture one price move. Yes, even in this example, the price actually
continued to just move up all the way
throughout the day. But that is not what we're
looking for as day traders. We are trying to
get in and out on a price movement that we can
predict and capitalize on. That's what we're trying to do. And that's the example that
I walked you through today. Also, don't get greedy and remember to take
profits along the way. As soon as you have the
opportunity to lock in profits, you need to eliminate any
risk of losing money. You also need to adjust that
stop-loss all the way up. And I personally, I sell part of my position if
it's going really well, I lock in that profit. And that allows me to say, Hey, this was a good trade,
no matter what. And if it just
continues to skyrocket, I've still got
money in the game. But if it turns
back the other way real quick or unexpectedly, Just honestly sometimes
happens, at least this way. I'm protected and I'm
not worried about it. And I've already
locked in profits to make it a good trade
and a good day. That is what is most
important to me. And honestly, if you can be profitable over the long
term and mentally healthy, is just going to help you
so much more along the way. So that's what I tried to focus on it and that's what I'm
trying to share with you. Protect your downside risk, make small consistent profits, keep healthy, and
keep on trucking. See you guys in the next video.
40. Margin: All right, everybody, welcome
back to another video. In this one we're going to start talking about margin because I know you're
probably thinking in the examples that I've gone
through in this course, zack, that stock price moves
by like $0.20 or $0.40. How am I actually going to make real money on such a small
little price movement? While hopefully I can answer that question in this
video, Let's jump right in. Okay, So when it
comes to margin, what I'm referring to is margin allows you to
borrow money from your broker to increase the amount of money that
you can trade with. Margin is also
known as leverage. And the idea here is that you're borrowing money
from your broker to increase the total
amount of cash that you can actually
make transactions with. Now, in order to do that, you have to have
a margin account. And when you create
that margin account, it's really nice because
it allows you to make those immediate
transaction so you can day trade multiple times
in the same day, but it also gives you
access to margin or to the ability to borrow money
if you choose to use it. If you do not choose to use it, this margin account will operate very similarly to
a cash account. You will just stay
within the limits of your own cash balance. Now, there's a lot of
positives to using margin. Basically, the positive here that allows you to
trade with more funds. So that if you have a profitable strategy,
key point there. If you have a
profitable strategy, you will make more profits. It's the same idea as like
if you're training on the $1000 and you
make it 10% return, you'll get a $100 back. But if you're chatting
with a $100 thousand and you make a 10% return, you'll make $10 thousand. We're trying to do here
is just scale up the pot. But using this same
profitable strategy that we're establishing and building throughout this course. Now the negative
side is that if you do not have a
profitable strategy, you'll just lose
your money faster. You will lose more money. It will become more
stressful and it will be, it will just destroy
your account. So you gotta be very
careful using margin. The other downside here
is that you will have to pay interest on the
borrowed money. Usually it's between 5, 7%, but it depends
on your broker. Some brokers also do not charge you if you do
not hold it overnight. You're just doing
a training with margin buying in the morning, selling in the afternoon. And you do not hold
that margin overnight, you may not have to pay any
interest, which is really, really nice, but each brokers
a little bit different. So make sure you read
into it for your broker. That's how trade works. Okay, So now here's
a screenshot. This is just level
one of Apple stock. You can get to this
from any broker. It's basically just
the overview that shows some stats
about the security. What's really nice here
is that inquest trade, it shows you the long
margin requirement and the short
margin requirement. They are shown as percentages. Long margin requirement is
what you need when you buy. Short margin requirement is
what you need when you sell. And the margin requirement
here basically refers to how much money of your own you need to have
in the position. For Apple, you need to have 30% of your own money
in the position. And then question,
will lend you 70%. This does vary depending
on the risk of the stock. 30% is extremely low. Usually it's 50%, sometimes
it's as high as 75%, and a lot of penny
stocks are risky. Companies will not get
any margin at all, so it does depend
on your broker. Again, to get to this
page though in question, you just click on level one. Basically this is just the stock overview page for any account. Now, let's put this into an
example here and let's use the same Apple stock here where the long margin
requirement was 30%. I've rounded the numbers here
to just big round numbers. So it's easy for this example. And let's say that
step one here is you buy three shares
of Apple and $100, then you borrow $300 from your broker to buy three
more shares of Apple. You now have six shares
of Apple with $300 of your own money and $300
of your broker money. If you take 300 and divide it by the total position of
600, that gives you 50%, which means your money makes
up 50% of the position, which is higher than
the requirement of 30% that is set by quest trade. So at this point
we're good to go. Our current margin is
50% were well above the requirement of 30% and
things are looking good. And let's see what
happens with the stock. Now, in scenario one here, Apple stock goes up to $200. This is very good for
us because we like the $200 price point
and we decide to sell six doc for a total of $1200. And then we return the $300 plus interest that we borrowed
from our broker. We profit $600 minus that interest payment on
a $300 investment. Remember, we put $300
of our own money and we borrowed 300 from our broker
and went up to $1200. We returned 300 from our broker. We returned our initial $300. And when leftover
with $600 in profit minus any interest rate that we may have to
pay to your broker. Now, the key here is
that using margin, we generated $600 in profit, but without using that margin, we would've generated
just $300 in profit. So in this scenario,
with the stock going up, using margin helped us
to make more money. That's the overall idea
and the goal here, but sometimes the stock
goes the other way. In this example here, the stock actually goes
from $100 down to $65. Now let's see what
happens to our margin. So when you multiply 65 times the six stocks
that we have, our current position
is now worth $390. However, we still owe our broker $300 for the money that we
borrowed to buy the shares. That means that in
our current position, we only have $90
worth of equity. We have $390 worth
of value here. We owe our broker $300, which means the
difference there is $90. And that's what we have. The problem is that
when you divide the $90 divided by the
390 and value, that is only 23%. And we have now fallen below are 30% margin requirement
for Apple stock. And that, ladies and gentlemen, is a very bad thing
because when that happens, you're gonna get something
that is called a margin call. That margin call will always
come through in e-mail. It may even be
somebody on the phone trying to get a hold of you bright and early in the morning. And it basically means that
you have run out of money, you no longer meet the margin requirements and you have a couple of options before your broker basically
takes over here account and starts to make some
transactions on your behalf. So here's an example of an email that I
received back in 2020. This margin call
was only for $86, so realistically, not
a big deal at all, but this is exactly
what it looks like. They will send you an email that says your account
is in margin call, your combined maintenance
excess is negative, which means you've fallen below the margin requirements here. And you need to take
action right now. And they give you a
couple of options when they send you this e-mail. And those options are to one, deposit more money to
close the positions yourself so that you can free up some cash to meet
the margin requirement. Or three, cancel any open orders that might violate your
margin requirement. Now, usually this is not
really an option because most people don't have open
orders that they can cancel. Usually people
either have to close their positions or they will
have to deposit more money. And the problem is that
if you do not take action within 24 hours or within
a certain price band, depending on that security, then your broker will
sell your positions to recover the funds and they will also charge you
fees for doing so. If quests trait has to make a
transaction on your behalf, they will charge you the
irregular commissions plus $45 from making the trade. So you gotta be very
careful when you use margin and as soon as it
starts to go against you, it can happen very quickly. And when you get this letter, you need to take immediate action to protect your account, deposit more money, or close out your positions
that are losing. Now, here are my thoughts when it comes to
margin number one, do not use margin when
you are starting out. When you are starting out, you need to start with
a practice account. Then you need to start
with a small cash amount that you need to build
on that calcium out. Then you need to prove that
you're a profitable trader, then you can use margin. But if you start using margin
before you're profitable, it is just going to make
you lose money faster. It's gonna make you
lose more money. And it's gonna
make your training trading journey, uphill battle, which is not what you want
when you are starting out, margin is extremely risky, especially when it is not used correctly and each broker
is slightly different. So please read into your broker to understand how
they treat margin. Now, in summary here
when it comes to trade, you can find margin
requirements in level one and stock view tabs. You can find them
both right there, but you'd need to make
sure that you understand how your broker will
treat margin and how to use margin and
how to actually read it on your broker and
in your statements. And you should only use
margin when you can prove in your trading journal and in your actual
trading statements, we're already profitable. You need to make
sure that you're profitable before
you use margin. If you are not profitable, you're just getting
closer and closer to the M line and
losing your account. So I don't mean to
discourage you by any means. I do mean to give
you a stern warning about using margin too early. But it is a great tool that
can help us capitalize and can increase our total funds so that when we see that 2050, $0.60 price moves, we can
actually put some real money in there and we can
take advantage of those small moves based
on technical analysis. So I hope this video helped, hope that answered
some questions. If you have any more questions,
leave them down below. I'll make sure to monitor this thread and we'll see
you guys in the next video.
41. Taking Profit: All right, everybody, welcome
back to another video. In this one we're going to start talking about how
to take profits, manage your trade, and set
that take profit level. Let's jump right in.
Okay, So when it comes to setting your
take profit level, there's basically
two different ways that you might want
to think about this. Number one is setting
your take profit level as the next key level of resistance based on your
technical analysis. So if you notice that the stock is trading within a channel, you're buying off the bottom. Your next key level
of resistance is probably going to be
the top of that channel. If you're trading a stock
and it keeps getting rejected at a $100 and you're buying in at $8,100 levels probably going to be your next key level of resistance, whatever it might be, depending on the situation and the technical analysis
for your stock, that's how you should
think about it. Now if you do not
have a key level of resistance because maybe
the stock is breaking out to all-time highs
or it just hasn't happened in a year
or two, that's fine. Or you should be
doing is setting your stop-loss
below the key level of support that you
are trading on. And then you should be
using your risk to reward ratio to set your take profit. If you do not have a key level to set that take profit on, I would recommend a risk to
reward ratio of at least two. That should be your minimum. Ideally, we're looking
for three or four, but I would be
willing to take two on a breakout to a
new all-time high. Now, when it comes to
your mindset here, there's a couple of things
that you really need to ingrained into your head
here because as day traders, mindset is one of the
most important factors that determines our
success or failure. And here's how I think about managing my trade and
taking my profit. Number one, don't get greedy. That's what I just
keep repeating to myself in the back of my
head as I'm in a trade. Don't get greedy. Is this the right
thing to do based on the technical analysis and
the risk reward ratios. How should you act in
this trade without being greedy and being grateful for what you've
already been given. That's what I think about
when I'm in the trade. I also think about
locking in profits early because it's much better to make a
little bit of money, then you go home
even or lose money. It is so much
better to just make steady, consistent,
small profits. Lose any money at all. Like I said, we are
trying to get rich with small, consistent
profitable traits. Those small consistent
profitable trades build up momentum for us and give us
confidence as day traders. The goal of this course is not to try and hit
a home run with a life-changing trade
that's going to make you a millionaire and give you
a Lamborghini overnight. The goal of this
course is to give you a system and a protocol
that you can follow, that you can adjust for
your personal preferences, that you can scale up to become a profitable trader and do this as a full-time profession and basically give you
freedom for your family. That's what we're trying
to focus on here. And so you need to focus on the mindset behind your trading. And these are the concepts and ideas that go through my head as I'm in the trade now when it comes to my strategy here, here's how I manage things. Number one, I am
consistently moving up my stop-loss to protect
the downside risks. I'm not doing this every minute, but as the price moves up, I'm moving it to the next
key levels that I think are important or that will be good
for me to manage my risk. So for instance, if we get two-thirds of the way up
to my take profit level, I'm going to move my
stop-loss up to readjust my risk reward ratio
and to make sure that my stop-loss is now
above my entry point. So that no matter what, I am profitable on this trait, when we approached my key levels or where might take
profit level is, I'm going to watch
that trade extremely, extremely closely because we come super close to
my take profit level. And then all of a sudden
the market starts to crash and the economic
conditions change. I'm just going to exit that
trade, take my profits, walk away from it and
re-analyze this situation. However, if the stock
price gets close to my take profit level and it does good momentum and I think
it's going to break through. That is when I might adjust things a little bit differently. That's what I would convert to a trailing stop-loss order. And I would do that
if the stock has indications of breaking
through the key level. Now we haven't talked about
the trailing stop-loss much. So let's talk about it here. The idea with a trailing
stop-loss order is that it will move
up with the price, but it will not move down. So if we're buying into a stock, we're buying in
and it's going up. We have a stop-loss right
here and the price moves up. Our trailing stop-loss will
move up with the price. And if the price
starts to come down, the stop-loss will not move, that order will not
move and it will fill as soon as the price falls
below that stop-loss. So it'll get us out
of the position. The idea here is
that it allows us to stay in the trade if
the stock goes up, but it will get us out
of the stock goes down. That's the idea here is that this order protects
your downside, but it gives you the upside if the price continues
to climb higher. Now, in order to place this
trade, It's very simple. You go to the order
form just like what we have done throughout
this entire course, you click on Order Type
and then you change it to a trailing stop order. Under trailing right here, you will have to set a variable. Now, you can choose to
set a dollar amount, or if you click on this button, you can change it
to a percentage. Then you fill in the
values that you want here, either the dollar amount
or the percentage. And what happens is if Apple
is out of $100 and you set a $1 trailing
stop-loss on it. As Apple moves up, the trailing stop-loss
will continually stay $1 below the market high. And then as soon as
the price comes down, if it falls by $1 from the high, it will then execute this order and get you
out of that position. Now, a couple of
things to know about placing a trailing stop-loss. It is the exact same as
placing a regular stop-loss. You're just changing
the order type and entering that value. It's very, very simple to do and I'll show you
through a couple of examples a little bit
later in this course. But basically, this
should be used when the stock is moving in
a favorable direction. I personally do not use a trailing stop-loss
to start my traits. The reason I don't use
a stop-loss to start my trades is let's say I'm
buying into outlet a 100, I set a stop-loss and $90 here. Then the first little bit
of the, of the trade, the stock goes up to
104 and then down to 10 to 101 and backup to 104105. Well, just that regular
little trading right there is going to
move my stop-loss up. And if it comes back down, then my stop-loss has
already been moved up. My risk to reward
ratio is way off here. And it could come down
and hit my stop-loss prematurely because it
already moved it up. So personally, I do not start my trades with a
trailing stop-loss, but I will convert to
a trailing stop-loss once the trade is starting
to go into my direction, that way my stop-loss is set and establish and
it's not going to be hit early just because of
some regular trading action. And lastly, this is
a tool that can give you more upside on a good trade, but it should be used carefully. You do have to click a couple of buttons and change
some variables here. So you need to make
sure that you have full understanding and
control of how to use that order form before
you start canceling trades in the middle
of open tray. So you need to make
sure that you have full control and
knowledge of how to use that order form before you start canceling orders in the
middle of an open trade. Now, when it comes to
scaling out of your trade, this isn't also an option that you can use to
lock in profits. But the idea here is
keep it simple, stupid. This was Tiger Woods saying
the acronym is kiss for it. And I thought it
was really good. So the way that I
keep it simple, stupid when it comes to
scaling in and out of my trade is I will only break
my trade into halves. So for instance, if I'm concerned
about my trade or we're starting to approach
resistance or trade sideways. That is when I will sell
half of my position because that is the first
sign of a trend change. Once that trend
change is confirmed, hello cell the second
half of my confirmation. So if the stock is moving higher and then it trades sideways, that's gonna be
the first sign or an indication that the
trend might be changing. And as soon as it starts
to trade bearish li, that is when I would exit the position and get
out of that stock, especially in the event where it hasn't hit my
take profit yet. That is how I would
handle that situation. Now if you're going to scale
in and out of your Trades, please keep it simple. If you're trading
with quarters of your account or fifths
or your position size, it can start to get really, really complicated
and you have to make a lot of decisions which can be overwhelming and it's just too
much to think about. So for me, Keep It Simple, Stupid as the best acronym, impossible when it comes to scaling in and out
of your traits. Now, in summary here, this is what I think about
number one is taking profit is just as important
as entering the position, how you manage the trade, how you exit the trait and how you capture
as much profit as possible is just as important
as what traits you take. So you need to make sure
that you're putting effort and practice into this. And you should be
tracking all of your exits and all
of your analysis in your training
journals so that you can analyze that data and
improve over time. If you notice that
every time you scale up or scale
out of a position, you are losing money or
it doesn't go very well, or you get in and out
at the wrong times, maybe you should
eliminate that strategy. Maybe you should just not
do that at all and you should just buy and sell
full position sizes. Same thing, vice versa. Maybe you're not
having so much luck with the trailing stop-loss. Maybe you should just set
it, take profit and move your stop-loss up until
one of the two gets hit. You need to adjust your strategy based on what is
working best for you, based on your personal
preferences and based on your own risk
to reward tolerances. Now, when it comes to trading
and managing your risk, the goal here is to reduce your risks and lock in profits. So that's what you should
be thinking about. That should be your mindset when you go into these traits. And that should be the focus
when you're sitting down at your computer and when you've entered a trait, I
hope this was helpful. I hope this was valuable and will see
you in the next one.
42. How To Find Stocks To Trade: All right, everybody, welcome
back to another video. And this one, we're
going to talk about how to figure
out what stocks to trade when you sit down at your computer in the morning,
let's jump right in. Okay, So in this video I'm
going to walk you through my five steps that I go through
in order to find a trade. And then I'm gonna give
you a real-life example so that you can
see it in action. Step number one here is to start the day with
a morning routine. I recommend keeping it as short and simple as
possible for me, it involves waking up, taking a shower and making breakfast and grabbing
a glass of juice. You, it could be slightly
longer, it could be shorter. The goal here is to go through some type routine that is
the same every morning that will get you in
the right mindset to sit down at
your computer with no distractions and devote
all of your effort and energy into making
profitable traits. That is the goal you need to figure out what
works best for you. Step number two here is to check online for any major news, economic events, or earnings. This could be things like
interest rates changing. It could also be new data
about inflation or GDP. It could be a major
press release from a couple of companies. It could be political changes, could be a natural disaster, it could be a war, it
could be a trade embargo. It could be a tariff, could be a variety
of different things. What you are trying to
understand is what is happening in the world so that
you have context. When you start to zoom in, we're starting with
the big picture. We're zooming into individual
stocks and we want to know and understand what is happening
around the world. So that as we zoom in, we can keep that in our
mind and we can try and buy into the general
overall direction. We're not trying to buy the DIP. We're not trying to pick the absolute bottom and sell
it at the absolute top. We're trying to find the
direction and buy into that trend and sell out
when that trend changes. Now, step number three here
is to check the markets and major indices to see what
direction things are going in. Most of these indices and a lot of these stocks
are going to be trading long before you get
up in the pre-market hours. So before the market opens, you can check the nasdaq, the S&P 500 and the Dow Jones. Those are the three that I check to see what direction
they're going in. Now, I live in Canada. I trade the North
American markets and trade mostly US securities. So these are the indices
that I check if you live in Europe or you live in Asia or somewhere else
around the world, you need to check the
indices that represent the markets that you are
going to be trading it. The idea here is that now that you've seen the big
picture around the world, we're going to zoom into the markets that
we're trading in to understand how the
market overall is doing. Now, once you have
checked into the market, then you zoom in
one level further. This is where our
sector watch list is going to come into play. I've talked about this
previously on the course. The sector watch list is
11 different sectors or industries within the market that make up the entire market. And it's basically a
division of the US economy. And so it is divided
into 11 sectors. Communication, energy,
real estate, consumer, discretionary consumer
staples, health care, financial industrials, utilities, materials
and technology. And the idea here by zooming in and looking
at these industries, you can see which ones
are the most bullish, which ones are the most bearish? And if you are interested in trading technology,
for instance, and every other sector is up and the overall
indices are up, but the technology
sector is down. That is something
that you are going to want to know before you go start trading and
looking for individual stocks, you're going to
want to understand, okay, maybe the
entire market is up, but the one sector
that I'm looking at or that I'm interested in down. You need to know about that ahead of time because
you're probably not going to want to buy long when
that sector is moving down. So you gotta be
very careful here. And it's basically like
zooming in one extra level here before you start looking
at individual stocks. Now, step number five, once you have looked
at the sectors, is to start looking at
your personal watch this to look for individual
trading opportunities. For me, I keep watch
list for technology, softwares, electric vehicles,
energy, and real estate. Those are the major industries that I tend to be day
trading most of the time. There are obviously
other industries that I play with
from time to time. But most of my day trades usually come from
these industries. And so I would
build a watch list for all of my favorite
tech companies, my favorite software companies, my favorite EV companies, energy companies and
real estate companies. And depending on the
information that I've gathered previously from starting with the big picture and
working our way down. I will then go into whichever industry I
think has the most potential to be very clearly long or be
very clearly short. And I will start to evaluate training opportunities based
on technical analysis. At that point. Then when the technical
analysis is good, I will evaluate the
risk to return ratio. I will evaluate
everything else going on. Then I would possibly
execute the trade, and then I will
manage the trade and move my stop-loss up as the price moves up or in the direction that I'm
trying to trade it into. Now, just as an example of
what I've just talked about, Let's put this into a real life scenario that
happened to me this week. This is how I came up with the trade and this is what
I was thinking about. So on Tuesday of this week, I think it was the 13th
of September 2022, inflation data came out and that inflation came out and it
was higher than expected, which means the inflation
number was 8.3. I think analysts
were expecting 8.2. That is bad because it means
inflation is too high. And it also means that the federal government
is probably going to increase interest rates to
try and bring inflation down. Now if that sounds confusing, I'm going to talk
about it a little bit later in the course. But basically this was
bad news for the economy. This was bad news
for the markets. And it means that
it's going to cost more money to borrow
from the government. It's going to cost more money
to borrow from the banks. And it's basically going
to slow the economy down. That is not good. And pre-market, all the
indices were selling off. Everybody was selling out of it. People were getting scared. The nasdaq, the S&P
500 and the Dow Jones or all selling
off in the pre-market. Now, in my mind, I think that tech stocks are
gonna get hit the hardest. Because when interest
rates go up, that means your mortgage
payments go up, your debt payments go up, and it means you have less
discretionary income. When people have less
discretionary income to spend on the goods and services that
they don't absolutely need. The companies that feel
the biggest hit are usually the technology
companies like Apple, or the technology companies
that provide a luxury good. For instance, I don t think as many people are going
to be buying the iPhone 14 if interest rates continue to climb and they have
less discretionary income. So this inflation data
was actually really bad for Apple because it means that inflation was
higher than we thought. Which means the
government's going to raise interest rates, which means people
are going to have less money to spend on luxury products like the
new iPhone or the new Mac. And that is going to
reduce Apple's profits. Therefore, I think tech stocks
you're going to sell off. And I am planning to short the big tech stocks
such as Apple. So when I sit down
at my computer, this is the stock
chart that I see. Obviously we're selling off in the pre-market and then we
actually started to trade sideways for a
couple of hours here from eight forty
nine forty eight m, We were pretty much
trading sideways, and we established a new
low rate here around $159, and then we traded a
little bit higher. We almost made it back up to
160 before crossing below that support to one fifty eight forty two,
this screenshot. So as I'm analyzing the stock, I'm thinking to myself, okay, markets trading down,
technology's about to take a hit. I think it's going
to continue to trade down throughout
the rest of the day. We just found through our
technical support level, the Mac D is still below. It looks like the line
is crossing right now. The volume is starting to
drain out a little bit. It's not as high as it
was earlier in the day. This is probably assigned
for me to go short on Apple. Everything that I'm
looking for is lining up when I evaluate the
risk to return ratio, I can see that we're
falling through support at one fifty
eight seventy three, I can currently enter the stock at one fifty
eight forty two, I can set my stop-loss at 159 is basically white
line right here, which is now above the
support level that we had established earlier on
in the day right here. And that would give
me a risk of about $0.58 on this trait. Now, throughout the day,
Apple continued to sell off. This trade worked out
extremely well and the price actually
fell all the way down to a $153.38 before starting to make its way back up and currently trading
around a $154, that is where I exited and
we profited about $4.74 per share on an
initial investments that had a risk of only $0.58. We made basically like six or seven x risk to
return ratio on this trade, which is extremely phenomenal. I'm very happy with it. This is just an example of how you can start with
the big picture, which was a GDP number. You can narrow that down to an industry that's
going to suffer, which is luxury technology. And you can find an individual
trade which was Apple, because all of the technical
analysis lined up, it was going in the
direction of the market. And it basically checked
all the boxes that we needed in order
to enter this trade. Now, my strategy here is
that the goal is to gather enough information so that by the time you are looking
at individual stocks, you already have an idea of
what trade you want to make. I could have made that
same trade with Google or Microsoft or probably
Zoom or Shopify. All of them were high-end technology
stocks that we're going to take a major
hit, something like that. And so there is
that opportunity to evaluate this and take that same shade on a variety
of different stocks. The goal is to
have that trait in mind so that by the time you're evaluating
different stocks, all you're doing is choosing
the one that gives you the clearest indication
based on technical analysis. In this scenario, it was Apple. And the idea here is again, start with the big picture
and work your way down. Now, other options that you can have other than just
trading blue chips, a lot of people start
detraining with penny stocks and it is definitely something
that you can do. All of the analysis
is the exact same. A lot of this strategy
is very similar, but here's where
they are different. Penny stocks are more volatile, risky, and prone to
hype or manipulation. Penny stocks trade
at lower valuations, They have much, much
lower market caps. And sometimes these
companies are only worth millions of dollars. So if a rich person
comes around, or if a day trader with a
lot of money comes around, they can start buying
or selling the stocks and moving that price
Extremely dramatically. You can also get influencers or investment
banks that write reports or short
reports that will come out to either hype up
the stock or tear it down. And that can drastically
move the prices without any actual
changes in the business. And so when it comes
to penny stocks, lot of their price and
valuation is based on future potential and the
hype around that company. Whereas with blue-chip stocks, most of the time is based around earnings and revenue
and profits, which is usually a little
bit easier to understand. Large market cap stocks
like Apple, Amazon, Google, any of these large
companies that have been around for ten years and
are already profitable, they usually have
more information available for us as traders. And they trade on the principles of organic supply and demand, meaning that they're
less or more difficult to manipulate
large money, or by traders, or
by people that are hyping up the stock or
trying to tear it down. So in summary here, what I recommend is trading in the direction of the market, tried to find a reason to
trade a specific stock. We call that a catalyst. And you find that
catalysed by starting with the big picture and
narrowing your way down. The goal is that by the time you start evaluating
individual stocks, you should have gathered
enough information on the way there that you
have an idea of whether you want to go long or
short and what industry you want to trade and think
about that for a minute. Lastly, here, you want to
always approach the market with an open-mind and
do not become biased. The market could go up
or down at any point. Usually it goes in the same
direction throughout the day. We need to approach
the market with an open-mind because that
trend can change at any point. And when that trend changes, you don't want to say, okay, I'm gonna
move my stop-loss or I'm just going to
adjust this a little bit. You want to be real
with yourself. You want to be honest with
yourself and say, Okay, I made a wrong trade, or that trend is changing. Or the signs that I thought
made this a great trade, just are no longer there and
I need to adjust course. That is the most difficult
thing as a trader is being real with
yourself and actually approaching these scenarios with an open-mind and not being
biased because you'll really like to stock
or you made a bunch of money longing it or
shortening it last week. You gotta be very
careful with that. And this is the system and the methodology that
I personally use.
43. Level 2: All right, everybody, welcome
back to another video. In this one, we're gonna
talk about level two and how you can use it
to improve your trading. Let's jump right in, okay, So when it comes to level two, this is what I'm referring to. This is the level two
windows that are just taken a screenshot
from on Quest trade, every broker is
going to have this. It might be set-up a
little bit differently. The colors might be
slightly different, but it's gonna be
the same principles. You're going to have a
chart here with the bid on the left side and the ask
on the right-hand side. As you can see, this is just all of the orders
of people that are willing to buy and at what price and quantity
they're willing to buy. Same thing on the other
side here with the cells. On the other side here we can see this green and
red right here. This is the order print. This is every single
order that actually gets filled for
whatever security you are looking at for us, we are looking at Apple. And so here is
every single order that is going
through the system. As I took this screenshot, that is what we are looking at when we talk about level two. Now the real question is,
how do we use level two? And here it is. Here's the basic
simple version of it. Number one, it is not
needed for new traders, so it is not a requirement
you do not need level two. It is not something
that you have to have in order to get started. Level two is a tool that you can use to incrementally
improve your training. It is not going to be
the difference between a profitable and
unprofitable trader, but it will give
you a little bit more information that you can use an analyze when
making your traits. That is the idea behind level two and is not
the golden goose. It is not the key to get rich. It is not going to fundamentally
change how you trade. It is not going to change
our system at all. It is just an additional
tool that you can use, an add to your tool belt to improve your trading
incrementally. The idea behind Level two is that we're going
to use it to help confirm a breakout
or a rejection. So when the price
approaches a key level, that is when we're
going to look at level two to help us determine as the price breaking out or is
the price getting rejected? The idea is that we want
to watch a level too closely when the stock price
approaches those key levels. In-between those
key levels though, Level two is not going
to tell us very much. So if a stock is just
training sideways in a tight little
zigzag like that. Level two is not
going to really tell us anything because
at that level, supply and demand
forces are pretty much equal if the
price is moving higher and it's
approaching a key level of resistance where it's been
rejected in the past. Looking at level two can help us to understand and give us a first indication of whether or not the price is going to
break through or get rejected. Now, when it comes to
the bid and the ask, so this was the left side
of that example here what we're looking for
is large orders. So when we go through
this and we see that most of these orders are one
hundred, two hundred shares. We've got an order for
1000 shares up here, but nothing nothing above
1 thousand right here, and nothing really above two
or 300 on the sell side, that means that there's no big whales that are
placing big orders. There's no giant stop
losses that are set. There's no huge take profit
orders in the system. But if we did see that, like let's say that
we saw a massive, massive order to sell shares at a certain
level right here, one forty nine sixty two. If we saw that, that would be a large
take profit order and we would expect that the
price might not be able to get above that
level because there's large selling pressure
at that specific level. That's what we're trying
to understand here, is where's the buying pressure? Where's the selling pressure? And is it at a certain
price level that we can use to base
our trading off of. Now the problem is that
a lot of the time, and we've talked about
this before in the course. This concept of spoofing. That is where somebody will
place a trade or an order, if I should say they will place an order that gets entered into the system that they have
no intention and filling. So somebody will place
a big order to make it look like you have a stop-loss
or take profit order. And then as the price gets
there and they'll just cancel that order and
then we'll get rid of it. And that can influence
the price action. And other traders, they're
looking at level two, so you have to be very
careful for that. It is not going to be a 100% accurate all the time
because of that factor. Now the other thing
that you may want to watch for is the spread. That is the difference between
the bid and the ask price. In this scenario, we're
looking at Apple, so there's only one sense. Apple is one of the most
popular stocks in the world. So usually the spread
is only one or $0.02. But if you were
starting to trade a penny stock or small
market cap stock, we're just a company
that doesn't have a whole lot of
volume or attention. This spread might be very
important for you and it might dictate what type of
orders you're going to use. If the spread is large, you may not want to
use a market order. You might want to use a limit
order, that kind of thing. So you want to keep an
eye on this spread, which is the difference
between the bid and the ask. And you want to watch for
large orders that will act as a stop-loss
or a take profit. The problem is that sometimes
those orders are spoofed. In other words, they are fake. Those orders will get deleted as soon as the price starts
to move towards them. Now the other side of it here is the tape that's usually
what most people call it. And basically it is a summary of every single transaction that goes through the system where
a buyer and a seller meet. The idea behind the tape is to document what is
happening in real time. Read orders here mean that the order was
filled at the bids. So somebody who is willing to pay one forty nine fifty one, and somebody that had shares came down to fill
their or too quickly, they came down to the bid. And that means that it came
out and it printed as red. When it prints out is green. That means that
somebody was asking for one forty nine fifty one, and somebody that
didn't have shares was willing to pay that
price and they came. That price, because
those orders move the prices when we see a green print or when this
entire screen is green, that means that there is buying pressure and the price
is likely to go up. Remember, everything
in the stock market is connected to supply
and demand forces. And so when we see a bunch of green orders
come through the system, that means that buyers are
stepping in and they're willing to pay higher
and higher prices. And that eventually if continued
at a high enough volume, is no matter what going to continue to push
the price higher. However, it works the
exact same way as well. If we see a bunch
of red orders here, that means that people that
own shares right now are coming down in price
to sell their shares. And eventually that is going
to push the price down. And so what we're looking for it when we look
at the tape, is, are we printing a
bunch of green orders or are we printing a
bunch of red orders? And is the price moving
with those orders? That's what we're trying to
understand and look for. A bunch of red orders means that orders are filled at the bid, which means the price
is coming down. A bunch of green orders means
people were coming up to meet the ask price and that is going to push
the price higher. So just as an example, here's a screenshot
of the tape that I took of Apple just as I was
making this PowerPoint. And as you can see, this is a full print of red. This means that people
were coming down in price to sell their
orders at the bid. We then got one order right here that was between
the bid and the ask, which means two people met in the middle between
the bid and the ask. You can see it was sold with
a 0.5 at the end of it. And so what we're looking for
is if you see this type of screen here where the tape
is just printing red, that means that people are starting to take profit and that the stock could be losing momentum if you see it
print completely green. That means that people
are coming into the market and
they are buying up the stock and is gaining
momentum and gaining volume. It's gaining traction and their price is
likely to go higher. Now what we're looking for
is for it to either print read or print green
at key levels. Because if we start to
approach a key level, see it print green. That is our first indication
that the stock is going to continue to breakout if
we see it print read, that is the first
indication that the stock is likely
to get rejected. Now, in summary here, the tape is much more important
than the bid ask orders. The bid-ask orders
can be manipulated, they can be spoofed,
and they are difficult to read when
they move quickly, the tape will tell you
what has happened, and it will show you in
a very bright green or a bright red what is
happening right now? However, it does move quickly, so it does take some
time to get used to. I will walk you
through a couple of examples in our live
day trading videos. Secondly, you should focus
on the tape at key levels. We're not trying
to read the tape. And level two, when the stock is in the
middle of the channel, we're trying to read the tape. And level two, when the stock approaches key levels of
resistance or support, we're trying to
understand is that most likely going to break
through or get rejected. That's what we're
trying to figure out when reading the tape. And we're looking for
strong indications of buying or selling by a green print or a red print
that is moving the price. That is the summary, that is the goal of level two. And it is a tool
that we can use to incrementally
improve our trading. That is not going to be the secret to trading
and is not going to be the difference between a profitable and
unprofitable trader. But like I said, you can use
it to hopefully give you the first sign or an early indication of a
breakthrough or rejection.
44. ETFs: All right, everybody, welcome
back to another video. In this one we're going
to talk about how you can use ETFs as another option when it comes to day trading, let's
jump right in. Okay, So when it comes
to the acronym ETF, basically what this stands
for is exchange traded fund. And ETF is a basket of stocks that trade like
a single security. So you're taking a bunch of different individual
securities and you're putting them
together in a basket. And this ETF can be bought and sold just like
a normal stock. So it has a ticker, it has a price. And you can see
all of the stocks that are held
within that basket. The nice thing about ETF's
is that they usually have very low commissions depending on what broker and
platform you use. Sometimes ETFs are
even free to trade. Now, just to give you an
example of an ETF, this is QQQ, this is put on by invest go, and this is an ETF that
tracks the nasdaq 100 Index. The nasdaq 100 is the 100 largest non-financial
companies on the Nasdaq. The Nasdaq is the exchange. The nasdaq 100 is an index of that exchange that represents the 100 largest companies
on that exchange. And QQQ is an ETF that
tracks the Nasdaq 100's. So when you buy QQQ, you're buying into or selling
out of the Nasdaq 100's. That is the idea here because
you cannot buy an index. An index is measured in points. It is a theoretical
group of companies, but you can buy an ETF
that tracks that index. And for the Nasdaq 100's, that ETF is QQQ. So for instance,
if you wanted to day trade the Nasdaq 100's, you would pull up
the chart for QQQ and you would place your
orders to buy or sell this ETF that currently
cost $289.44 per share. That is how it works and that's basically
what would happen. Now what I want you to do is
remember this pattern here, okay, the stock trades sideways. It has a nice little
run-up right here, comes back in and then
it starts to break out. This is what the Nasdaq
100's looked like today. This is what the ETF that tracks the Nasdaq 100's
looks like today. However, there are
some other options when it comes to ETFs, and that's what we're
going to talk about now. So the first one here
is a leveraged ETF. Etf will track the index. A leveraged ETF is still
a basket of stocks, but it trades at a
multiple of another ETF. So when we look at a leveraged
ETF and we see that it is two times leveraged or it
is three times leveraged. That means that it
is going to move by two times or three
times as much. So for instance, if
we look at T Q, Q, Q, This is the leveraged version of the Nasdaq 100's or the three times leveraged
version of QQQ. And so this security moves at three times the up or
down movement that QQQ moves at t q. Q is the
leveraged version of QQQ. It is a3x leveraged, which means it is going to
move by three times as much. If you look at the percentage of movement at the time I
took this screenshot, it was 2.35 per cent. If you look at QQQ,
it was like 0.57%. I took these screenshots a
couple of minutes apart, so the price obviously moved. But as you can see, T QQQ shows you almost
the same pattern, but the price is moving by just a much more dramatic
amount with regards to a percentage that dollar
numbers are never going to line up because they're just
different dollar values because of how they're set up. But the percentages that
they are moving in the day, t QQQ is going to
move at three times. What QQQ is going to move that. And QQQ is tracking the
Nasdaq 100's index. So now we've talked about regular ETFs that
track an index. We have also talked about leveraged ETFs that
track an index but give you two or three times the
movement in the price. The next option that we
have is an inverse ETF. An inverse ETF is very similar. It's still a basket of stocks. Usually trades in the
opposite direction of the other ETF for us, QQQ is gonna be that baseline ETF that we're
comparing to all the time. And inverse ETF is going to move in the opposite direction. So in this example, P S Q is the inverse of QQQ. And when QQQ goes down, this will go up. As you can see, it's the
exact same pattern as QQQ, but it's in the
opposite direction. We break down early and then
we start to trade lower QQQ. We broke out early, and then we start to trade higher P S Q is the
exact opposite of QQQ, and it gives you the
ability to still buy the security without having to short it and take on
that unlimited risk, as well as pay interest on the money that you're
borrowing from your broker. Now the last type of ETF that I want to share with
you is basically combining the leveraged
ETF and the inverse ETF. It is called the
leveraged inverse ETF. And again, it is still
a basket of stocks, but it usually traits
and the opposite of another ETF and
add a multiple. So for instance, an
example of this is S QQQ. As QQQ is the inverse three
times leverage of the QQQ. Basically, what's
happening here is that when QQQ goes down, this will go up by
three times as much and it will go in the
opposite direction as QQQ. You're taking advantage of the leverage and
you're also going the opposite way of the
underlying ETF or index. The idea here is that you're
trying to make money when the market sells off by
buying the inverse ETF. Now, as day traders, why would we want to use ETFs? Well, very simply if we can understand the direction
of the market, ETFs will give us another
option for DEI training. So if we can't find any
great opportunities, individual stocks, but we can identify the direction
of the market. Trading. Etfs gives us an
excellent opportunity to still make profit and make some trades
throughout the day. They can also help us to make money when the
market is crashing. So if some terrible
economic events come out, countries are going to war, major issues are
happening around the world and markets
are crashing. You can buy inverse
ETFs to make money as the value of the
underlying ETF goes down. Now, there are some risks to ETFs and a couple of downsides. Number one, liquidity can be a challenge depending
on the ETFs. So as you saw, P, S Q here has much lower volume. So getting in and out of ps q at the levels
that you want, or if you're in an
even smaller ETF, it can definitely
be a challenge. So you have to be very careful. You have to make sure that you
understand the spreads and the liquidity on that security. The other challenge here is that ETFs are more heavily focused on economic events rather than
individual company events. So individual companies report earnings and how products and they're fairly easy
to understand. But the economic events
that are driving the markets can be a little
bit more complicated. Things like GDP and inflation
and CPI, inventory numbers. They're a little
bit more harder to understand and see how
everything is connected. So you do sometimes
get less information when trading strictly ETFs
as opposed to stocks. So you do have to be
careful and you have to understand the dynamics that are moving the ETFs because
they're a little bit different than what
is moving the stocks. However, when it comes to finding ETFs, It's
very, very simple. All you need to do
is go to Google. You can type in your industry
and then the word ETF. And it will pop up all
the different ETFs that apply to whatever
you're looking for. You can also find a bunch of
people on YouTube that talks about all their favorite ETFs or which ones they're buying. I highly recommend doing one of these two so that you can
get some different ideas. But what you should
make sure you focus on making sure that the
ETF you are buying, you know what
exchanges it is on. So for instance,
if you're buying an ETF on a US exchange, you need to use US dollars. Same thing if it's in
Canada or another country. You need to make sure
that you know where that ETF is traded and
where it is listed. Now in summary here, ETFs are a great option for day traders and
many traders prefer ETFs Overstock because of the lower volatility
and low commissions. Not everybody trades ETF. A lot of people trade stocks. I personally trade
mostly stocks, sometimes ETFs, but they are a great option to have
an understanding. What I would recommend
is trying them out and our practice account,
that's what I recommend. Anytime you're trying
something new when it comes to investing and day trading
tested on an HR practices cow. First, see if you like it, see if you can understand
the technicals behind the ETFs better than you
can understand the stocks. You might find that you
have a strategic advantage in one or the other, but you do need to
make sure that you're still journalling your trades. And most of the technical
analysis is gonna be the exact same on the ETFs
as it is on the stocks. What is changing
is what is moving those ETFs and what is
moving those stocks. That's a big difference
there if you have any questions, leave
them down below. Thank you for watching and I'll see you guys in the next video.
45. Profit when stocks fall: All right, everybody, welcome
back to another video. In this one we're
going to talk a little bit more in-depth about how to make money when the markets are falling.
Let's jump right in. Okay, so throughout this
course I've talked about two different strategies
now for how to make money when stocks
are going down. The first one we covered at
the beginning of the course, and that was how
to short stocks. That's when you borrow
shares from your broker, you sell them in
the market and then you wait a period of
time and hopefully buy them back at a
lower price to return those shares and capture the
difference as a prophet, That's how you short a stock. And we just covered recently
what an inverse ETF is. It is something that trades like a basket of stocks
that tracks in index and an inverse ETF goes
up when that index goes down so that you can
make profit as prices fall. Those are two different
strategies that you can use to make money when
markets are crashing. Now the strategy and
the thought process behind this is really, really important because
you want to be sure of what is happening in the
first thing you need to know is first of all, what is happening and why, why is the important part here? Why are oil prices falling? Why our home prices rising? Why is this happening
or that happening? You need to know what is the
catalyst, what started it, and what is it going to take to maintain whatever is
happening right now. After that, you need
to ask yourself what companies and
industries will be most negatively affected
by this recent change or event or catalyst
that has just happened. And I'm gonna walk you through an example here
in just 1 second. And then the last thing
you need to think about is how to
short the stocks, the worst-performing
companies, or how to buy an inverse ETF for the industry that is going
to be most heavily affected. Again, we want to start
with the big picture and work our way down to the
best possible opportunities. If there are no
possible opportunities in individual stocks, then we will consider
industry ETFs. Now, here's an example that happened almost
two years ago now, but it's just the perfect, most glaring biggest
example that I think we've probably seen in
the last ten years, and that was COVID. Covid outbreak begins at the
beginning of 2020 and it expands around the world and it forces people to stay home. Covid was the event
that happened. The result is basically
people are afraid to go out. They have to stay
in their house. They are locked down. Because of that. Nobody is booking
a cruise ships, nobody is going on
a cruise ships. Cruise ships aren't even
allowed to operate, they're not even allowed
to bring on guests. And everybody is worried about
what is going to happen. And Cruz Industries and cruise companies have
absolutely 0 revenue coming in because they
can't operate any of their tours and they don't even know when
they're going to be at, just start operating again. So it is not looking good for the cruise industry as soon as COVID starts
to come about. Because of that, we can
think to ourselves, hey, everybody staying home to Cruz Industries are going
to be the hardest affected. Maybe we should be shorting the poorest cruise companies or the cruise companies that have the worst financial
results or have the most debt on
their balance sheet. So that's the strategy here, and this is the example. And if you had gone
through this example, you probably would
have come across Royal Caribbean because
their stock price fell from a $135 all
the way down to $19.25. And then get might've even gone a little bit lower after this, but basically for about a month to a month-and-a-half
period of time here, there was 80% days where it was completely red and the stock
finished lower than an open. You can see the odd
green candle here, but it really didn't
happen often and almost every single day here the stock finished lower than it opened. Which means you
could have shorted the stock and done extremely well for literally the exact same trade
for almost a month. So this is what I'm
looking for when we talk about how to make money
when the market is falling, figure out what is going
to follow the fastest, what's going to
follow the hardest, and what's gonna be the
most negatively affected by the reason or the catalyst that's causing
everything to fall. And then you want to short
that individual security. Now, in summary here
what I want to get across to you with this video
is that you have options. You have the opportunity
to go long or short at any point
on any security while you are trying
to do is narrow into the one opportunity
that's going to give you the best odds with the
best risk to return ratio. That happens to be shorting
the stock, that's fine, that's totally normal,
That's absolutely fantastic. Just make sure that you
are managing your risk and you understand
why you are shorting it and why you think
it's gonna go down and what it's going to take to
continue to push it down. Secondly, the key isn't
identifying the trend. I am giving you tools to make money whether the
stock goes up or down, it is your job to identify
what the trend is and then use those tools to take advantage and profit
from that trend. That's how we think about this. Lastly, bear markets give us just as many opportunities
as bull markets. Markets are really easy
to trade in if you have no idea what you're
doing because you can just go out
and buy anything. And over time, if the
market is rising, you'll probably do okay. The bear markets are where
day traders actually prosper. This is where we thrive
because we can make money, whether their stocks
are going up or down. It just comes down
to our strategy and our ability to determine
and realize and have an open mind and
a clear vision of whether that stock and that
industry is going up or down and then buying into that trend and
taking advantage of the tools that I'm showing you here to profit from that trend. That is the goal, that's what
we're trying to achieve. I will see you in
the next video.
46. Trading Strategy: All right, everybody, welcome
back to another video. In this one, I just wanna
do a quick summary of everything that we
have learned with regards to our trading strategy. I want to put it all
together and kind of summarize everything so
that it's easy to digest. And you've got all the
main points I want to try and get across,
okay, so first of all, the key principles to what
I've been talking about, I've summarized it here. And number one,
always start with the big picture and
work your way down. This comes when
you are evaluating which stocks to look at. It also happens when you are
evaluating a single stock. You want to start with
the daily time frame and then the hourly timeframe, and then five-minute
and then one minute, we want to start
with the big picture and work our way down so that we understand what is happening in the large picture. We have it as context with regards to our traits and we can use that information to hopefully make us more
profitable trader. Always start with
the big picture. Secondly, we want to
identify the direction of the market and buy or sell
in the same direction. When I say direction
of the market, what I'm referring to is the general overall sentiment of the majority of the market. If we notice that all three of our major indices in the
United States, the S&P 500, the Dow Jones, and the nasdaq, if they're all negative, that is a bearish market, that is a downward
training market. And in that situation, we want to take advantage
of that downward movement. We're not going to be trying
to buy stocks on that day. That is not the goal. We want to be trading with
the direction of the market. And lastly here, risk
management is what is going to separate you from a profitable
or unprofitable trader? It is what is going
to separate you from a good to a great trader. And this is the key differentiator
between day traders. It is your risk
management plan is how you handle a trade when
it doesn't go your way. And is whether or not
that trade blows up your account and then is how
you come back from defeat. That is what makes
good traders Great. All comes down to managing
your risk management plan. We're going to talk about
that in just 1 second. First of all, I want to
talk about finding trades. We talked about this a
couple of lessons back, but really it is super, super important when you
sit down at your computer, you're starting from a blank
slate every single morning. How do you figure out
your strategy and figure out what you're
going to trade that day. First, you want to
do some research on the global market conditions. Are there any wars? Are there any natural disasters? What is the economic
situation like? What is inflation like
around the world? You want to understand the
overall large situation. So you have context
when you zoom in, when you do start to zoom in, you want to zoom into an
individual market for me, it's usually North America, Canada, and the United States. So look at the indices that
represent those markets. Next, I'm looking at
individual sectors. I have shared that watch list
with you several times now, you should make a copy of that. Watch this so that you
can understand how the 11 different
sections sectors of the US economy are
performing on that day. So you can understand which sectors are performing better, which sectors are
performing worse. And hopefully you
can use that to your advantage when
you are making trades. And then lastly, that is
when you start to look for individual stocks or ETFs, and you compare them to
figure out which one is giving you the best
opportunity in the world. Think about it as if you're
going to the buffet of the stock market and
you are trying to find the single dish that
looks the absolute best. You can get the most money, the most value for your money. That is exactly what
is happening here. We're starting with
the entire buffet. We're narrowing it down to our specific type of
food that we like and then which pasta sauce looks the best and the topics
that we want on it. We're starting big or narrowing down to
find exactly what we want and find the
trading opportunity that he's going to make
us the most money, give us the best odds, the best opportunity
for us to spend our time on as we sit
down at our computer. Now, when it comes to your
risk management plan, there's a couple of key things
that you need to remember. Number one is your maximum
loss per position. You are going to
set your stop-loss. Then you're going to
run your calculation to see how much money you
are losing per share. You're going to divide
your total loss per position divided by
that amount per share. And that's going to tell you how many shares you can buy it. I personally recommend
a 2% maximum loss per position or portrayed
that you make that way, you're not going to
blow up your account. You probably going to make a couple of small chains
in the beginning, but it's going to slowly grow over time and it's
going to protect you. I also recommend only
taking a trade with a absolute minimum risk
to reward ratio, 1.5. Ideally you want
this to be 2345, but 1.5 is gonna be the absolute minimum that
you should ever take. You wanna be as picky as you possibly can when
you're a new trader, you want to just
understand the concept. You want to take one trait at a time and take it very slowly. I also think that you should put a stop-loss on every single
trade that you take. This will protect you
from the downside. This will lock in your risk when you calculate
your risk to reward ratio. So it's super, super
important and I think you should have it
on every single trade. You should also be journaling
every single trade that you make so that you can gather data about what you're good at, what you're not good
at, and you can adjust over time to improve
your performance. Lastly, you should
walk away from the computer if you make
three bad trades in a row. If you're not in
the right mindset, if you're not feeling good, if you are distracted or if you make a couple of bad
trades in a row, take the rest of the day off, go do something else, go mow the lawn, Go
work for your buddy, go find some other way
to make money that day. Do not sit at the computer. Do not dig yourself deeper. Have the self-control and the consciousness to sit down and say Today
is not my day. I'm going to come back a
better guide tomorrow. I'm going to come back
stronger tomorrow. I'm going to come back in
a better mindset Tomorrow. I'm going to do
something differently. I'm going to change up
my morning routine. Adjust your strategy to
what works best for you. Every single human is different. Some people are morning
people, some people are not. Some people need to
meditate in the morning. Some people just need a coffee
and they need to sit down. It depends on what
works best for you. You're only going to
understand what works best for you by journaling your trade and keeping track of it next, when it comes to
technical analysis, this is really,
really important. We're going to dive into
this a little bit more, a little bit later
on, but always perform multiple
timeframe analysis. You should be looking
at these stocks anytime you look at an
individual stock or an ETF, the first chart you
should be looking at is the one day candle chart. Then you should zoom into
the our chart than the 15-minute than the five-minute
than the one minute. You should start with the big
picture and zoom your way. And using multiple
timeframe analysis, you can see where the key
levels of support and resistance are from back
throughout history. Next, you need to make sure you have volume on your chart. This will show you if
it is a strong trend or a weak trend depending on if volume is increasing
or decreasing, you need to make
sure you have moving averages on your
charts so that you can tell if we were in bullish
territory or bears territory. They will also help
you to understand what direction we're going
in over the longer term. You need to make sure you have your Mac D on there to give you some indications of when
that trend is changing, then you need to go in
and you need to draw your key levels of
support and resistance so that you can
understand where you are expecting this stock to either continue
with the trend or reverse the trend at that point. That is where we're looking for a bounce off of resistance, a bounce off of support, or a breakthrough of that
exact same key level. We're looking for
the stock to hit a key level and either
continue going through or to change direction if it
continues going through that as confirmation of a bullish
trend and we want to buy em if it changes direction, that is confirmation
of a change in trend. And if the market
is selling off, that could be an opportunity to short the stock or the ETF. Now, in summary here, this is a quote that has stuck with me and that I've kind
of adjusted a little bit. But here's how I think
about day trading. Day trading is the ability
to see what is happening. Nothing fancy here,
there's nothing crazy. Everything is shown to you. So day training is literally you're looking
at a chart and trying to understand what is
happening and then using your skills to take advantage
of what is happening. All you are trying
to do is observe what direction the market
is going in than we are trying to use our skills and the tools that I've
taught you throughout this course to try and take
advantage of that direction. And when that direction changes, we want to get out of that trend hopefully without
losing too much money. That's the goal. That's what we're trying
to accomplish throughout this course and through the
next couple of lessons, I just want to basically
add continuously, add new tools to your tool belt. Now that you've got
the foundations of what we're trying
to accomplish here.
47. Share Splits and Mergers: All right, everybody, welcome
back to another video. In this one, we're going to talk about stock splits as well as mergers and acquisitions
and how you can take advantage of
them as a day trader. Let's jump right in,
okay, so first of all, a stock split is
when a company will split or merge their shares, the market cap and the value of the
company stays the same. So nothing actually changes with the company or the
value of the company, or how much it's worth, or what the company does. However, the price
and the number of shares outstanding
does change. So for instance, if a company does a two
to one stock split, that means for every one share you owned before the split, you will own two shares after this split that are
worth half as much. It will be the exact
same, equal value, but you'll have two
shares over here, and you'll only have one
share before the split. Basically, nothing is
changing with the company, but the price and the number of shares outstanding are changing. Now, here are two examples. You can see that Tesla
actually went through a three-to-one stock split
here back in August. This is very exciting. It brought their shares
down from $891 to $297. And on the other side of it, we've got hexachord, which is a Canadian cannabis company. And they did a reverse
split or a share merge, where for every four shares
that you own before, you owned one share afterwards, now, you're probably
thinking to yourself, why are companies doing this? What is the point? If nothing is actually changing
with the company? And here's the answer. If the price is too high, like in Tesla's case, it can make it difficult for retail investors
to buy the stock. So Tesla knows that a large portion of
their shareholders are regular average people that are investors that just want to own the company
because they liked the cars where they
believe in the vision, not training with large
amounts of money. So when the price goes too high, it eliminates some people
from being able to purchase shares by
doing a stock split, they can bring that price
down and make it more accessible for almost everybody
to own shares in Tesla. That is good for the
company because it also drives the price higher. On the other side of it, hexose is interested
in doing that share merge or that
reverse split because their price got to
low and the company risks being removed
from the exchange. So in hexose situation, they were on an
exchange that required your shares to stay above $1. Their price per share fell below $1 for a continuous
period of time, and therefore they went
through a reverse split to bring that price
back up above $1, meet the requirements
of the exchange. Now the next type of event that I want to
talk to you about, the second half of
this video here is about mergers and buyouts. This is where one company will acquire or merge with
another company. Every deal here though, is different and not all
deals end up going through. And these deals
take a lot of time. I am talking about
half a year to a year timeframe for
most of these deals. And not all of them
go through because governments oversee a lot
of these large mergers and acquisitions and they do not want to allow any of
these companies to establish a monopoly
where they're the major player in
that marketplace. So sometimes the
governments will break up these deals
or even break up individual companies to
make sure that there's no monopolies forming
within their country. Now, here's an example of a
merger or an acquisition. This is Adobe. They're set to acquire a company
called Figma and they're paying $20 billion for
it in stock and cash. Figma is privately held, so their shares aren't
really changing much, but Adobe's chairs are fluctuating pretty
drastically on this news. There's also a lot of other acquisitions
happening in the space. For instance, Microsoft
is set to acquire Activision Blizzard
that is going through the system right now
and that is in the process. So there's a lot of
things happening here. But what I want to point
out to you here is that this article was published
on September 15th of 2022. And they note here
that the deal is expected to close
some time in 2023. So there's like four
months left in 2022. And this deal isn't gonna
close till sometime in 2023. It's gonna be a long time.
It's going to take awhile. There's a lot of paperwork
and a lot of things that have to happen
for a deal like this. Now, why do companies go through mergers
and acquisitions? Well, there's two main reasons companies will acquire or merge with other companies to
accelerate their own growth. That's reason number one, or to eliminate competition. That is usually
Reason number two, adobe acquiring Figma in that situation was to
eliminate their competition. Figma was the number two
player in this space. Adobe just said, will
write you a check, will acquire the company and will eliminate our competition. We'll see if that makes it
through the US government. But honestly it's kind
of a smaller market, So I don't expect them to
have too many hurdles. On the other side, we also have Microsoft who was
acquiring Activision, and that is to accelerate
their growth in gaming. Activision is not really a
competitor to Microsoft. They actually make games
for the Microsoft platform, So they kinda work together. Microsoft is just
trying to expand their reach and get
into some new markets. And they are doing that
through acquisitions. So it's good to understand
why the company is making the acquisition then in order to take advantage of
it as a day trader, there's a couple of things
you want to think about. Number one is that
as the atria is, we are trading on the
short time-frame. So what we wanna do is we want to trade on the day that
this news comes out. Because usually
an acquisition is a good thing that drives a lot of volume and a
lot of attention. When a company announces that they're acquiring
another company, that is usually a good thing. And if they're getting
it for a good deal, that is usually going to
drive the price higher. Share splits are also good at
drawing a lot of attention, but you need to realize
that they do not fundamentally changed
the company in any way. However, here's how you take advantage of it as a day trader. If a stock was previously too expensive for a
lot of retail traders, means that when they
do that stock split, there's gonna be a
lot of retail traders that can now enter the market, which means they're likely
to drive the price higher. And you can take
advantage of that going long and riding in the new
wave of retail investors. That is usually the
strategy when it comes to managing
these share splits. Now, just as a
quick summary here, share splits are done to
change the price of the stock, but they do not
change the company, they do not change
anything underlying, and they do not
change the valuation. The one thing that they do, do is make it easier for retail investors to
get into this company. So if you can arrive
that new wave of retail investors entering the
stock to the bullish side, you may have a great opportunity
for a short-term trade. Acquisitions are
made to accelerate growth or eliminate competition. That is the only role of
acquisitions or mergers. So please keep that in mind. Try to determine what
they're trying to do with that merger acquisition. And when that news comes out, see if it has good
deal and if it is, you may be able to make
another short-term trade. Both events are usually bullish. You are looking
for any red flags when you read through
that press release, if there are no red flags, you kinda wanna trust management and think they're
doing the right thing. And that is usually
going to send the price higher as long as
you have volume. Volume is gonna be the
key indicator here. If you have good, higher volume and the
price is going up, that means it was
probably a good deal. If you have higher
volume and the price is starting to go down or sideways, that means it might not be a good deal and the market
is concerned about it. Use the volume to
help you understand what direction the majority
of people are going in. And then find that
trend trade into the trend and exit the trade
when that trend changes, the principles are all the same. These are just
unique market events that I wanted to explain to you. I hope you got some value out of it and we'll see you
in the next one.
48. Company News: All right, everybody, welcome
back to another video. In this one, I'm going to walk you through step-by-step how to find company news from a
variety of different sources. Let's jump right in. Okay, so to start us off here, a couple of different places
where you can find news. Number one is the
company websites. I'm going to walk you
through how to do that as well as how to find the news and financials
on CDR and Edgar, you also have a couple of other news stations and news
websites that you can go to. But first, we're going to talk about the company websites. If you want to find
the company news, the press releases, the
financials, anything like that? On the company website, you're first going
to go to Google. You're going to type
in the company name. And then right after
that you're going to type Investor Relations. So if you're looking
for the Nike stuff, you're going to type in
Nike Investor Relations, Tesla investor relations,
whatever it might be. Because if you just
type in Tesla, it's gonna take you to their website and
you're gonna have to sort through it and you're going to have to go
through everything. But if you type in Tesla and investor relations into YouTube, it's going to take you directly into Google, I should say. It's going to take you directly
into the page that you need That's going to give you all of the quarterly earnings. It's gonna give you all
of their documents, their events, or annual reports. Everything you need is
gonna be at company name, investor relations in Google, it'll be the first link
less way to do it. Now, if you don't want to go
through the company website, you can go through
the official source, and that is going to be
through CDR or Edgar. Cdr is the system
we use in Canada, and Edgar is the system we
use in the United States. These are the official platforms where companies must submit all of their filings
and investors can also view all
of their filings. So if your company trades in Canada and Canadian exchange, they're gonna be submitting
their documents to see if they're in the
US on a US exchange, they're going to be submitting
their documents to Edgar. Here are the two websites that you can just
click onto go-to it, just to show you an example, we'll go through one right now. So this is the
seat, our website, both of these websites
look extremely old. They have no bells and whistles, but they work well when you go to search database right here, you can type in company. And let's say that
we are looking for a drone delivery Canada. That is a company that
I follow a little bit. You type it in there, you click on Search, and it's gonna pull up
basically their name on the left-hand side here and
then their document type. I always like to click on
the name and then click View this company's documents and
it will sort by the dates. So you can see September 13th, that company put
out a press release and then back in August, they put out their
financial statements that a couple of more
press releases in here. And you can go through and
you can literally click on every single document that the company has ever
submitted to regulators. Now if you want to go
to the edgar website, it's also very simple
and very similar. It's actually looks a little bit better than
the Canadian one. You just type in the company or the ticker right
here for this one, we'll look up Apple for example. And here you can see all of their information,
their eight K reports. You can see their
current reports, you can see their
annual reports. You can get all of the
information that you want a belt the company
going through these links, that company websites
themselves will probably be designed a
little bit better though. Now, other sources
where you can get information about
press releases and new news and new
agreements and mergers and acquisitions and financials
from these companies. You can get your
information from Yahoo Finance,
CNBC, or Bloomberg. The only problem is
that when you start clicking on links out
of these homepages, some of those articles
are paid media, which means journalists
are getting paid to talk about and
promote specific stocks. So make sure that whatever
article you read, look at the top or look at the very bottom of the
article and figure out if the author received
any compensation for writing that article. If they did, you need
to basically just ignore that article
because they're getting paid to pump that stock. So you need to be very
careful with that. It is completely legal. Yahoo, CNBC, all of these
companies sell articles to promote and pump and
promote certain securities. Realistically, they're
getting paid to pump them up. And you need to be very,
very careful because the best companies don't
need to pay for that. So think about that. Lastly here, my
favorite resources for finding information,
especially about earnings. I like to go to earnings
whispers when I'm day trading, I usually have trader TV live. You can get through
them through YouTube. I watch a lot of
the news, honestly, a lot of the major
economic, political, or legal events that
happened around the world will usually
have some type of impact, usually on a large sector. And there you can find
the best opportunities with individual stocks
within that sector. So I watch a lot
of the news to try and find training
opportunities as well. Now, in summary, here when it comes to company
news and financials, that news can come
out at anytime. So you kinda need to be ready for it when it comes
to financials, most companies will
give you some heads up as to when they expect
to release the financials. Not all companies though some companies will just post
them without any warning, any notice, drone
delivery Canada is one of those
companies, for example. Secondly, you need to
try and see if there's any recent news when you
decide to day trade something. So when you sit down and
you're ready to day trade, what you might want
to do is just take a quick 5 second peek to see if the company has
any press releases that have come out today, if they have any
financials or if there's any other major events
or news that could impact the direction
of the stock or if there are any that are
forecast to come out that day, something you should
definitely be aware of. And then the last thing here is when a company puts
out a press release, you need to ask yourself, how important is this news to the actual business
operations of the company? How important are
the new financials? How important is
that press release? How important is that merger? How important is that
announcement They just put out to the actual business model
that they are operating. A lot of companies before
they go to raise money, will put out a bunch of press
releases to try and drive the stock up so that they can raise at a higher valuation. You need to be very careful
and easy to actually ask yourself when a company
puts out a press release, is that good for the business? Is that bad for the business? How much does it
change the business? And if I were the CEO, would I be doing the same thing? You need to ask yourself
those questions very carefully when you're
trading based off news. Other than that, I hope this video helped and we'll
see you in the next one. Talk to you soon.
49. Economic Events: All right, everybody, welcome
back to another video. In this one we're gonna
talk about economic events. We're going to talk about how to find them, what they mean, and how to take advantage
of them as a day trader. Let's jump right in,
okay, so first of all, economic events, what am I actually referring to
when I say those words? Basically what I'm referring
to is reports that are released indicating how
the economy is doing. The three major reports that
we're going to talk about, our GDP inflation
and employment. Economic events also
include changes to the interest rates or discussions about
the interest rates. We're going to dive into
all of this in this video, but that is what I'm referring to now, starting this off here. Gdp. Gdp stands for Gross
Domestic Product is the total amount of
all the goods and services produced
within a country. It is a statistic and
a measurement that we use to analyze how
your country is doing. Is it growing? Is it producing more in goods and services, or is it shrinking
and contracting? We use GDP to try
and understand that. Now, in most cases, 2% growth in GDP is
extremely healthy. That's a good, healthy operating economy that most world
leaders are striving for. However, when you get to
quarters of declining GDP, that is what puts countries
into a technical recession. When you see GDP declined by as much as 10% or when it declines over a
sustained period of time, like two or three years. That is what puts countries
into a technical depression. You remember the
depression of the 1800s. You remember the
recession of 2008. Those are the definitions
that we're using. And most of the time
those definitions come from the result of
gross domestic product. Now when it comes
to finding GDP, that number is released
once per quarter. It is released at this
website right here. I'll put a link to
it in the resources for this course so you
can find it very easily. But here's a screenshot
of what GDP has looked like in the United States for the last six quarters. As you can see, it has reduced in the last two
quarters in a row, which would put
the United States into a technical recession. They don't want to admit it and nobody from government will
come out and say that. But based on the
technical definition, they are definitely
in a recession. Now, the next factor and the next basically indicator and metric that I want to talk
about here is inflation. Inflation is really important
because it refers to how much spending power you lose from one year to the next. As an example, if
inflation is at 5%, your $100 this year will only
buy you $95 worth of goods. Next year, everybody will
remember those posters and those old school photos
and videos of people going and buying a Coca-Cola
for like $0.05 or $0.10. You can't do that anymore. Everywhere you go, it's
going to be like a dollar or 2.3 a can of Coca-Cola. And that's because of inflation. It's because the
price of goods and services go up
steadily over time because governments are
printing money and because the cost of those inputs
become more expensive. Now, how do you find inflation? While it's actually
fairly simple, you go to this
website here again, I will link it in
the resources tab. Let's just open
it up real quick. And as you scroll down here, this is what inflation
has looked like. This data comes out each
and every single month, which is really, really nice. But you can kinda see
where currently at 8.3% inflation in
August of 2022. So it is quite high, especially compared to where it used to be, like two or 3% about
two years ago, which would have been really, really nice if we
could sustain that. But as of right now, inflation is climbing up. It is climbing higher, and it's not a good
thing because it means that everything
costs more for consumers. Now, why does
inflation happened? Well, like I said, it happens
because of two reasons. Number one, governments are printing money to
stimulate the economy. That is what happened to put us into the
current situation. Covid hit in 2020, governments printed
money to give to businesses and consumers, and they spent that money and basically erased
all of the prices because there were
more dollars chasing after a limited number of goods. And that drove all the prices up because companies could
just charge more. Now unfortunately, about
a year or two later, the goods and services are also starting to become
a little bit scarce because of supply
chain issues and demand issues and being able
to actually source products. And so as of right now, we're sitting in this weird situation where
governments have printed money and goods and
services are becoming scarce. And that is why
the United States has very high
inflation right now. Now, obviously people
can't afford to lose 8% of their money each
and every single year. So the United States government
is trying to step in and reduce inflation
in order to do that, they're controlling
the interest rates. Interest rates are the governments gas
pedal and brake pedal. The interest rates how the
United States government pushes the car forward and stops it when
it's going too fast. That is the idea
with interest rates, the goal is to keep
prices steady, growth, Steady, and keep the
United States economy just humming along. Nice and steady. Governments will
use interests rates because they're the base of
all other interests rates. What I mean by that is
if you get a mortgage, a credit card, a line of
credit, or a car loan, the interest rate that you pay on that debt is going to be a factor of the
government interests rate plus a risk factor. And so if the government
interests rate increases, it means that you
as a consumer are going to be paying
more in interest. That is how pretty much every interest rate in the
world works right now. It is the government interest
rate plus a risk factor, depending on your
profile that will dictate the ending interest
rate that you must pay. Now, when government
interest rates go up, that makes borrowing money more expensive and it slows down the economy because
less people are taking out loans and buying houses
and starting businesses, because the interest rate
is just too expensive. And so governments raise the interest rate to
slow down the economy to reduced inflation
because there'll be less people chasing after
the same amount of goods. That is how the governments
slows down the economy. And when they want
to speed it back up, they reduce the
interest rates to make it very easy
to borrow money, to go out and start a business, to buy a house, to
get a loan for a car. The government makes it
very easy by reducing that interest rate and that starts to accelerate
the economy, starts to accelerate GDP, and it also can in
some situations, start to accelerate
inflation rates. Now, why does the government
changed the interest rates? Well, like I said before, they do it to try and
keep price stability. That is the goal of
the Federal Reserve, the body that controls the interest rates
and their number-one mandate is to try and keep
steady price stability. They want to keep inflation
at a target rate of 2%, which means you're
Coca-Cola only goes up by 2% more each and every
year instead of the 8.3%, which is where
we're at right now, the government will use
low interest rates to stimulate the economy
and they will raise interest rates to slow down the economy and try
to reduce inflation. Now, what impact does
that have on us? Well, like I said, when
interest rates go up, people have to spend
more money in paying off their interests and they
have less disposable income. Think about it. If you have a variable
rate mortgage on a $500 thousand house and your interest rate
goes from 2% to 3%. That means that your mortgage payment probably just went from $2 thousand to $2500 per month, which means you have $500
less disposable income in your, in your pocket. That means that the people
that are affected by that are going to buy less
products and services, which means the economy
is going to slow down. There's going to be
less transactions. And that means that
companies are going to sell less products and services, which means they're
going to reduce prices, lay off employees,
and they're going to end up making less profit. Now, how do we use this information as
day trader as well? The idea here is that
economic events will usually have a large impact
on market day. So for instance, if your day trading on a day where
interest rates are changing, GDP information is coming out, inflation information
is coming out. You're probably
going to notice that there is an increase
in volatility. And there's also gonna
be dramatic price swings around that news depending on if it was good news or bad news. For us, we want to try and
take advantage of that news as day traders and be
ready to go with a strategy when that
news comes out. And then from the
big picture side, if the Fed is raising
interest rates, It means that going
long will become more difficult because consumers will have less disposable income, which means they're gonna
be spending less money. Companies will be
producing less profit and their stock prices
are more likely to fall than they
are to increase. So in a scenario
and an event and an environment where
interest rates are going up, inflation as extremely high
and stock prices are falling, we are going to want to go
short on most of our traits. You also want to think about is based on all the
information that I've given you and that
you've gathered about inflation at GDP
and interest rates, you want to start
thinking about, okay, Out of every company in
the marketplace right now, which company is going to
benefit the most from this? Or which company is going to
be hurt the most from this. And then you want to trade those specific stocks
because they give you the best likelihood of making money and making
returns on the trade. So that's how we think
about it as day traders. Just in summary, here you want
to use economic events to your advantage by treating
the direction of the news, you want to understand what the economic
environment looks like. We want to start with
the big picture and that usually includes
the economy. And then we want to
work our way down. We want to understand GDP, inflation and interest rates. And we want to use
all this information to help us with the big picture, work our way down and find the best opportunity
across the marketplace. That's what we're
trying to do and we'll see you in the next video.
50. Trading Halts: All right, everybody, welcome
back to another video. In this one, we're
going to take a look at trading halts and we're going to talk about how they work, what they mean, and how you can protect yourself
as a day trader. Let's jump right in. Okay, so first of
all, trading halts. This is when regulators to spend trading on a market
or a security. Basically the regulators
will come in, they'll step in
and they will say no more buying or selling on the entire market or on
an individual stock. Now, when they do this on
entire market is because a major index is moving
too much and too quickly. They want to basically
slow things down. They want to stop everything for usually about 15 minutes and they tell everybody go do some research to see
what's actually happening. Come back with a
cooler head and we'll reopen the markets
in 15 minutes. It's kinda like a
just automatic stop that puts the markets on pause if anything happens too quickly. Now, on the other
side of things is when they do it for
individual stocks. Now, individual trading halts
happen when a regulator or director of that company
chooses to stop trading, their specific
security, regulators will do it if they're worried
that something is wrong. If the company is releasing
wrong information, if they're worried
something bad is happening. If there's insider trading, if there's manipulation
happening, if there's anything happening, regulators can step in. And we have also seen companies
stepped in and implement their own trading halts when
they have big news that is coming out usually
during training hours. Now, what happens when this
actually goes into effect? Well, unfortunately you get
absolutely no heads up. There's no early warning system, there is no notification system. What happens is all of the trading just
automatically stops. None of your brokers
will take your trades. None of the traits will
go through everything. Literally just pauses
almost instantly. And in order for you
to figure it out, you either have to
either look it up, you have to realize
what's happening. You have to go to the
news and figure out what's happening with
that individual stocks. So it can be a little
bit worrisome, It can be a little
bit concerning. But if you ever noticed
that all of a sudden there's no volume and your
traits aren't going through. That's probably because
there was a trading halt. Now, why does this happen? Well, like I said before, it is to give investors
and traders time to appropriately react to
whatever has happened. We are all very, very
aware that fear in the marketplace can be a very
******* and damaging thing. And so if everybody
gets scared all at the same time and everybody
tries to panic cell, that can do some really, really big damage
to the markets. And that is what we
are trying to prevent. We're also trying
to help a company released news
during market hours without allowing
people to front-run that news or figure out what's
going on ahead of time. So just to show you a
couple of examples, here is one summary
of a trading halt. This came out of Vancouver for Joan delivery Canada,
ticker symbol FLT. And the reason for
the halt was at the request of the
company pending news. So this company was about to release news in the middle of the trading day and
they put a halt on their stock so they
could release the news. Everybody could see the
news and then reopen it. And everybody had a fair
chance at basically making trades based on when
the stock reopened. Another example of this
came during COVID of 2020. On March ninth, 2020, the Dow Jones fell 7.979 per cent within
minutes of opening. And because of
that, it triggered an automatic market shut
down for 15 minutes. I have never seen the
Dow Jones moved by 7.79 per cent in my life, except for during COVID. And that is when we saw
several market shutdowns because the prices were just
moving so dramatically. And honestly, I think it
was a very good thing. It really saved a lot of
people and it made people calm down a little bit because
if you're sitting there and you just
can't do anything, then you kinda think about it. You analyze the
data a little bit more and you kinda calm
down a little bit. I think it's a
really good system. And if you ever notice
that just know trades are going through not even
for any security, well, this is probably what
could be happening now. How to manage it as a
trade or when you see a trading halt either on the
market or on your stock, what should be going
through your mind? How do we manage it? Number one, you need
to try and understand the news or why the stock
or the market was halted. If it is a market hall because
everything is crashing, you'll probably be
well aware of that. But if it is a individual stock, you need to try
and figure out why that stock was
halted specifically. Secondly, you need to
protect your downside risk a lot of the times these halts
or not for good reasons. So when you see a halt, more than likely it's
because of a bad reason. So you need to protect
your downside risk. You need to put a stop loss in. You need to make
sure that you're not going to lose a ton of money. You also need to set stock
alerts so that you can be notified when it begins
trading or moving. Again, you want to set an alert so that as soon as it
starts training again, you get notified on your computer depending on
what brokerage you use, you should be able to
just right-click on a price chart and
click on Set alert. And you should be able to set
that up very, very easily. Now, in summary, here, if you ever want to look
into trading halts or if you think your stock has just been hit with a trading halt. I ROC dot ca, it will give you all
of the information. And I will also link this in the resources tab
for this course. So you have all of these links. Remember, trading halts are
usually not a good thing. So make sure to manage
your risk appropriately. They are very rare though. So for instance, while
arm day training, they've only ever happened
a handful of times. They do not happen very often. They are fairly rare,
but when they happen, there's usually a big reason or big piece of
news tied to them, so please be very
careful with them. If you see a training called, make sure that first
thing you do is protect your downside risk. And I hope this video was helpful to see you
in the next one.
51. 49 Day Trading Taxes: All right, everybody, welcome
back to another video. In this one, we're going to
talk about day trading taxes. And I'm going to share with
you how I personally set up my day trading business
to manage my taxes. Let's jump right in. Okay, So when it comes to taxes for trading and investment, There's two major types
of taxes that you need to be aware of and you
should fully understand. The first one is
capital gains tax, and the second one
is income tax. When you generate a profit
or when you pay yourself, you're going to have to
put that money through one of these two types of taxes. And which one you choose is
going to be very important. First type here is
capital gains tax is meant for
long-term investments and you'll have to
pay tax on 50% of the profits at your
marginal rate. Let's break that
down for a second. If you buy a stock at $1000 and it goes up to $3 thousand, you have generated $2
thousand worth of profit. You have to pay tax on
50% of that profit, which means you have
to pay tax on $100. You have to pay that tax
at your marginal tax rate. What that refers to is if you make one additional
dollars this year, what tax bracket
is that dollar in? In North America, we
operate on tax brackets where your first $10 thousand
gets taxed at this rate, your next 20 or 30 thousand
gets taxed at this rate, your next 40 or 50
thousand gets taxed at this rate and
you slowly move up. Your marginal tax rate is whatever taught
bracket you are in. So in theory, if you are in a 30% marginal tax bracket and you generate a $2
thousand in profit, you would have to pay taxes
on 50% of that profit, which is a $1000, and you would pay
30% tax or $300. That's how capital gains taxes work in Alberta, for instance, if you made all of your
money through capital gains, generated $100 thousand and you lived in Calgary, Alberta, Canada, which is where
I live right now, you would have to
pay $8,403 in tax, which is an 8.4% tax rate, which is extremely,
extremely good. So there's a lot
of incentive and a lot of people want to claim their income as
capital gains tax because that tax rate
is so extremely low. Now, the other type of
tax that we need to be aware of is income tax. This is probably a tax that
you are familiar with. This is the tax that
you had to pay on your first job in every
job you've had since. This is the tax that you pay on regular income that you are earning on a day-to-day basis. This is basically
the tax that you pay on your job and you have to pay income tax on 100% of the
income that you bring in. If you go work a job and you
make $100 thousand a year, you got to pay taxes on
$100 thousand a year. There's no 50% rule like
there is with capital gains. Because of that means you're probably going to end
up paying more tax. So for instance, if you make $100 thousand and
you claim it as income on your T4 or on
your taxes in Alberta, Canada, you're going end up
paying $26,764 worth of tax. And here is how that
is broken down. So as you can see,
income tax is going to cost you a whole lot more
than capital gains tax. Now the real question for us as day traders is how
do we decide whether the profits we're generating
is capital gains or income? Well, here's how you choose. Number one, income tax is meant for your regular
income or jobs. So if day trading becomes your job or your primary
source of income, you're going to have
to claim those profits as income tax. Capital gains tax,
on the other hand, is meant for your
long-term investments. And it's designed to not double tax you because think
about it this way. You generate income,
it goes into your bank account and you have
to pay income tax on that. You then go to invest it into
a property or into a stock, and you've already paid tax on that money that
you're investing. Therefore, they want to
encourage you to invest it, to put it back into the economy. So they're gonna give
you a lower tax bracket on the profit that
you are generating. They do not want to double
tax you are triple tax you, but they do want to
get a little bit of tax on the profits you are generating from the
money that you're investing. That is the idea behind
capital gains tax. But if it is your
primary income or your regular income or this is what you are doing on
a day-to-day basis. The government wants
you to treat that as income and pay income tax on it. So for us is day
traders, like I said, if you're making a living with day trading than it
is considered income, and I highly
recommend you do not try to submit your day trading
profit as capital gains. Capital gains taxes are meant
for long-term investments. If you try and submit
your day traits where your in and out in a couple
of minutes or hours. As capital gains, you
will likely get audited, you will get flagged and
you will get searched and they will go through every
single document you have, and you will probably
end up having to pay tax on it as if it were
a regular income. Now, as a new day
trader getting started, I know this can be kind of scary and you're like, holy cow, I don't want a bunch of tax on all the money that I
make, Don't worry. It's fairly simple when
you're first getting started, you don't need to take
it super seriously. Well, you do need to
figure out those how to build a profitable strategy. And if you actually
like day trading, those are the two most
important things. When you're getting started, you do not need to
form a company. You don't need to do anything, test things out preferably in a practice account to start. And then with like $5 thousand
maximum of real money, nobody is really going
to blink an eye at that. You can experiment
for a little while. Don't worry about it too much. However, you must keep your day training accounts separate
from your long-term accounts. So if you've maxilla see
live in Canada and you've maxed out your registered
accounts, you live in the US. You've maxed out your
Roth IRA and you're opening regular cash
or margin accounts. Make sure that whatever
account your day trading in, all you are doing as day training that
way you can classify every single transaction in that account as income
or as a day trade, you can treat it separately. Then you would treat
your long-term accounts that you're going to
subject to capital gains. You can segregate your
day trading account. You can subject
that to income tax. Very, very important here. You do not want to be mixing your long-term investments with your short-term investments
in the same account, you want to keep those
separate as much as possible. And trust me, you can open as many accounts as you
want with these brokers. There's almost no
penalty and no fees. I highly recommend completely
separating your medium, long-term, and
short-term investing into very separate accounts. Now when you are a beginner and you're just starting
out and you're just getting into day
trading and you're just feeling the
water a little bit. Here's how you
manage your taxes, keep track of all of
your profits and add any day trading profits to your income at the
end of the year. If you are generating a couple of thousand
dollars worth of day trading profits on a monthly
basis or a weekly basis, no problem, just add it to
your income at the end of the year and you will have to end up paying taxes on that. So be prepared for it. Make sure you're saving
about thirty-five percent of your profits for
tax and better yet, go to an online calculator, see what your bracket or
your taxes you're going to be with day trading and
without day trading, and then save the difference so that you can be ready
for your tax bill. That is the way to do it. But basically when you're just getting started out up until the point where you're making more than several thousand
dollars per month. You don't really need
to start a company. You don't really
need to do anything. You can just add that profit as additional income to your
taxes and manage it that way. For me personally,
here's how I have it set up for my company
and my day trading. I have set up a
numbered company. It's just like a
seven or eight digit, 22954 or five, whatever. Alberta incorporated,
that's all it is. That's the company name and
that's the organization. And I run all of my profits and revenue into that
numbered company. And then I pay for all of my expenses through
that company. And I pay myself a salary
out of that company. That's how I have it set up. And the idea here
is that the goal is I bring in my top-line revenue and that's my day
trading profits. I have all my expenses, which are my computer or
my software, my Internet, My commission's pretty much
all of those expenses, reduces my taxable income. I then pay myself a salary to reduce my taxable
income even more, the company is leftover
with no profit. The profit is paid out
to me as a salary, and then I then pay income
tax on that salary. And so basically
what's happening here is all of my expenses for day trading are write-offs and they basically
reduce my tax burden. Then I reduce my company
tax burden by paying myself a salary and I
personally pay tax, income tax on that salary. Now, in summary here, I've spent a lot of
time trying to avoid taxes and trying to
reduce my tax burden. And here's what I have learned. Taxes are just part
of life, honestly. The harder you try
to avoid taxes, the harder they're
going to come after you when they find out you're
trying to avoid taxes. So please be very
careful with that. Your time and your
energy is much better spent trying to make more money rather than
trying to avoid taxes. So if you find yourself
spending hours and thousands of dollars just to try and avoid a big tax bill or
reduce your tax bill. I am telling you that
you are personally wasting your time and your
energy and it would be better spent trying
to go out and create more money than
reduce your tax bill. Because either one,
you're going to reduce it so slightly that
it doesn't matter or two, you're going to reduce
it so much that somebody is going to
start looking into it, gonna cause you an
absolute nightmare. So I highly recommend being
very, very careful with that. If your day trading and that is your main
source of income, you need to treat it that way. You need to claim that
profit as income tax. You need to pay it out
to yourself through a corporation or you
need to add it to your income at the end
of the year when you go to file your personal
income taxes. And lastly, the last
thing I want to leave you with is
when you get into this and especially if
you decide to start a business around
your day trading, please make sure you
keep clean books and you are documenting
everything correctly and you're not mixing together your different accounts
every day trading and long-term investing. Because I promised you that if you get audited and you have to open up those books and explain every transaction
you've ever made. It will not be worth the time. It will not be worth the effort. You will regret it so much, I promise you it
is not worth it. I've been through it,
I've gone through that experience and it's just not worth the
time and the effort. So keep clean bucks, pay your taxes, handle things
right from the beginning, do things appropriately
and make sure that all of your accounts
are separated into their own individual accounts based off what type
of trading you are doing so that you can manage
them most appropriately. I hope this video helped and we'll see you guys
in the next video. I hope you never get audited.
53. After Hours and Pre Market: All right, everybody, welcome
back to another video. In this one, we're going to
talk about pre-market and after hours trading and how you can use them
as a day trader. Let's jump right in. Okay, so first of
all, when I refer to pre-market and after
hours trading, what I am talking about is
your ability to buy and sell stocks outside of the
regular trading hours. Those regular trading
hours are from 09:30 A.M. to 04:00 P.M.
Eastern Standard Time. In Canada, there is no pre-market trading unfortunately, but in
the United States, pre-market trading starts at
04:00 A.M. and it goes to about 09:30 A.M. after
hours training though, does exist in Canada, It starts at 04:00
P.M. and it goes till 05:00 P.M. and
then the United States, it actually goes to 08:00
P.M. so the US after hours in pre-market sessions are much larger than
they are in Canada. But there's a couple
of things you need to know about those
training sessions. Number one is that
volume is usually much lower outside of
regular trading hours. So execution can be
more difficult when there's a lot of
volume and there's a lot of transactions happening. It's very easy to get
your trade in or out. But when there's less volume and there's not as
many transactions, the spreads are larger
and it can be more difficult to execute the trade
that you want to execute. Secondly, specific
trade settings are required for after hours
and pre-market trading. Canada, for instance,
with Quest trade, it has to be a limit order, it has to be an auto route. The day has to be
set as duration, and it has to be in
multiples of 100 units. Each broker is gonna be
a little bit different. So just do some
research on your broker to figure out how they want
you to enter that order. But there usually will be some specific
requirements that you need to have in there when
you place that order. Now as a day trader, how do we use pre-market data? So right now we're
going to talk about the trading session that happens before the
market actually opens. For us. We're gonna be looking
for key levels of support and resistance as well
as a general direction. So I want to know, did the stock gap up or
gap down overnight? Is the stock trading higher or lower in pre-market trading? Are we seeing a
clear direction or did it jump up and
kind of level out? I want to understand
the price action that is happening
before the market opens so that I can identify key levels of support
and resistance, as well as try and have an idea of what
direction I think that market or stock or index is going to go
throughout the day. Now, to give you an
example of this, here is the chart that I was
looking at this morning. This is a real example. This is T QQQ. So this is the three
times leveraged version of the nasdaq 100. And I was looking at
this one because we had a major gap up after a
strong day yesterday. So we've got some very
positive momentum. We had a huge gap up
overnight right here. We traded a little bit
sideways Going into the actual session today with some major resistance at $22.09. Ever since then, it kinda
traded basically sideways, almost in a channel right here. And so what I'm looking at as I go into
this as number one, massive gap up for t q, Q, q. And at the same time, all of the other
indices were rising. So I was like, Okay, this
is probably going to be a good day for
the stock market. We had clearly established three-level resistance at
22:09 and we were looking for the breakout of 20 209 with a stop-loss at $22
on this trade. I was looking for the breakout because volume is increasing, we had positive direction
because we already had a gap up all of
the other indices. We're going in the
right direction. A very strong day
yesterday and we had some good economic
news come out. So everything was going
into bullish direction. Therefore, I'm looking for t QQQ to break through the
pre-market resistance. When the market opens up, I'm going to set my stop-loss at $22 and I'm going to
enter the position on the break of 20 209 with a profit target of
roughly $22.30. But I would convert it to a trailing stop-loss if
we see good momentum. Now, just to show you
how this played out, we saw excellent meant momentum. We actually saw a
breakthrough of 2,209 in the first couple
of minutes of the day. We broke through
it, we retested it, and then we continue
to run higher. It ran all the way up to $22.77. We did convert it to
a trailing stop-loss. We did extremely
well on this trade. It was a small dollar value of the actual money
that we made here. But what was nice
about this is that we only risked $0.09 on this trade and we hit our
take profit level of $22.30. And since we converted it
to a trailing stop-loss, I think I actually got
out around $22.50. We make five times as much money as we rest on this trade, which in my books is
absolutely phenomenal. Now, how do we use
after hours data? Let's talk about the after our session and what happens
after the market closes. For me personally,
this is an opportunity to trade on earnings
or presentations. For instance, Tesla just did there AID a couple of weeks ago. Apple does their
big presentations every basically
quarter to six months. And if either of those companies announces big news
are big changes, are big things happening
at those presentations. That can be an opportunity for the stock to go up or go down. And you can trade that
in the after hours. You can also do the
same thing when the company releases earnings. The idea here is
that we use after hours data usually to
trade on catalysts. The other thing here
is that if something happens around the
world, for instance, if a war breaks out on the other side of the world
and a bunch of pipelines get destroyed at 04:30
P.M. Eastern time, all the markets are closed, but you can treat based
on that information and the after hours and you can take advantage of it
before everybody else. So here's an example of
after hours trading. Here is FedEx over a two day time period
with five-minute candles. You can see the stock basically traded sideways for
about two days here, not a whole lot going on here with some support around $203. What was really interesting
here though is that in after hours and shortly
after the closing bell, FedEx released their guidance. That guidance was
much, much lower. They also released
their earnings and it didn't go so well, they didn't have a
ton of earnings. And because of that,
the stock fell by 24% in after hours. And so if you had to
trade those ready to go to short the stock
when it fell below $203, you could have made
all whole lot of money here in a very
short time period. It opened even lower than next day and it
continued to trade lower on because there was basically negative news and negative
earnings of the company. So you can take advantage
of that in after hours. Now, in summary, our strategy here is we want to use
pre-market data to analyze the stock direction and identify key areas of support and
resistance after hours data and after hours trading is
used to take advantage of catalysts or a major events that can impact the share price. That's how we look at
these two sessions. One is giving us information for the real trading day
and the second one is giving us an opportunity
to take advantage of major events that are
happening around the world. That's how I personally use them and that's what I
would recommend for you. We'll see you in the next video.
54. Pre-Market Game Plan: All right. Good
morning, everybody. It is currently 07:00
A.M. right now. And I'm about to
walk you through my entire morning routine and how I put together my
pre-market game plan so that when the market opens, I'm ready to go now. First things first, you got to go through your morning routine, get ready in the morning. I've already done that. I've got my orange juice ready to go. That is my personal
morning routines. So now I'm sitting down at the computer half an hour before the market opens and it's time to put together
my strategy, okay, So one of the
first places that I usually like to start
with is my discord chat. As you can see here, I have a daily update that happens in here every single day in one of the things on here is the economic calendar actually show you
what is happening in the world of the global economy and especially the US economy. It will show you what's
happening on a day-to-day basis. As we can see here, we're looking at
Wednesday, October 5. That is today's date. We've gotten employment
report coming out. We've done international
trade balance coming out both this morning. Snp's services, PMI,
ISM service index, and Atlanta Fed
president Rafael, both stick is going to speak at 04:00 P.M. Eastern
Standard Time. So a couple of small reports, no major events today. This one is actually going to be right at the market close, so we don't have to worry
about that too much. What you will find a
lot of the time is that major economic events will
usually happen 8-10 am. When you find that one of
those events is happening, you want to be very careful
trading because those events can change the direction of the market depending
on what is happening. So if you're into a position
that you think is bullish, one of those events
happens right at 10:00. It can very easily
change the direction, so you gotta be very
careful of that. Today it doesn't
look like there's anything big happenings
such good for us. Next thing I usually
like to check out as just see how the
markets are doing. And so I'm going to
open a new tab here. We're gonna go to Yahoo Finance. We're gonna go to CNBC. I'm just going to see if
there's anything big happening. I want to see how the
indices are doing. I want to see how the S&P 500, nasdaq and the Dow Jones or
chewing in the pre-market. And as of right now,
everything is down by 1%. So that is not good to see. Oil is up right now and the 10-year US bond
is up right now. But the markets are down in the pre-market before we
get started opening here. So that is not a great sign. Well, I mean, it's
not a terrible sign. We can trade on the downside. So it's just something
that we need to be aware of is that so
far in the pre-market, things down by about 1%. Okay, Now one other
thing that I usually like to check and usually
do this on a Sunday, but I'll just show you
here is burning whispers. This is a company that
kinda keeps track of all of the earnings that is happening each week and how companies do. I usually like to go to their Twitter because they will post this basically picture
here every single week and it will show you
what companies are reporting earnings
every single day. So you can see
that today we have these companies
reporting earnings. Tomorrow we've got
Constellation Brands and Levi's and then
Tilray on Friday. And this is a good thing to know about because if you're
going to try to stop, you better know if
they're having earnings coming out that day
or the next day. I'm going to talk to that. This can give you a shortlist of companies that might have
catalysts coming this week. So if you're looking to
trade individual stocks and especially
individual earnings, this can be a great
place for you to start. As of right now, there are not many companies reporting
earnings this week. It is not an earnings week. There are no major
companies that I really liked to follow
reporting earnings this week, constellation and Levi's are probably the two
biggest that I follow. But as of right now, not a whole lot of reason
to be trading earnings, not a whole lot of
reasons trading any of these companies because it's just not a big earnings week. There's not a lot of
big companies and none of them are companies
that I'm very excited about. Okay, so now that we
have looked at earnings, we've looked at the
pre-market data and we know what direction
things are going in. Let's minimize our internet
here and we're gonna go to an actual watch this, this shows us our sectors. So I've talked about
this a couple of times. We can see that the market
isn't giving us a whole lot of data here because our indices aren't open in the pre-market. But when we go to sector here, it is open free market. And we can see that pretty much everything is down except for what I
believe is energy, yes, energy is
skyrocketing right now. One major reasons,
and so the reason that energy is going up
right now is because opec, which controls about 40 to 50% of the global
supply of oil and gas, has actually come out and said that they're
probably going to cut production and think about
supply and demand again, this is super important. If one of the largest
producers cuts production, that
reduces supplier. If demand stays the
exact same though, what is going to
happen to the price? You have a lower supply, you have the same
level of demand. What does that do to the price? Well, it is going
to send it up and that is exactly what
we're seeing right now. As opec gets closer and closer, or talks more and more
about cutting production, the price of oil is
gonna go up and up because the demand is going
to stay roughly the same, especially unless we go
into a major recession, but it's going to stay
roughly the same here. And then the supply
is going to dwindle. That's going to
drive the price up. So right now, energy industry
is looking pretty good. This might be an area
that I want to focus on. There couldn't be
a couple of stocks in here that are
going to do well, especially as oil goes up. So that could be a catalyst that I am looking at for today. That's probably one of the
major things that I'm gonna be looking at today because we have a direction
in the market. We know why it's going up. And we have a
couple of companies that we can take advantage. So for instance, this
is the energy sector. And if I go to my
watch list here, I actually have an entire
watch this as dedicated. To energy companies, we can see that Canadian natural
resources and a looks like TC Energy Corporation or down a little bit just
in the pre-market here. But some core and supernovas are two oil and gas producers
that I expect should do well, especially if oil prices
continue to go up. So these are two stocks
that are gonna be kinda on my shortlist as we go
into market open here. Okay, So now since I'm
interested in trading with supernovas as well as Suncorp because there are
two oil and gas producers. They're both in Canada here, so they are not going to
give me any pre-market data. So what I'm gonna do is
I'm actually going to add the US version of
supernovas here. I'm going to add it to my watch. This, we're going
to click on it. And as you can see,
it's actually up in the pre-market trading
today, which is really, really nice if we
had zoomed into it, we can see it actually gap down this morning and now it
is starting to rally. So that is a very
good sign to see. This could be a great
opportunity for us. As we go into the day. We're going to have
to definitely see if we have enough volume
and where this opens, but it is a good option for us. Okay, So now the other
thing to consider now that we've got a
catalyst going with regards to energy is all of our indices are trading
in the bearish direction, which does give us confirmation
of a kind of bearish day. And it kinda shows us that things are probably
not gonna go well, I can also look at this. If I open up my tech
watch list here, pretty much everything
in the technology space is going to be downright. Now, if we go to our ETFs here, S Q, Q is up 4%, T QQQ is down by 4% and
spies down by 1.2%. So we do have some options to trade in the ETFs here as well. Because all the
markets are showing us good confirmation of going
in the exact same direction. That gives us an advantage
because if we trade into that direction and we see one or two of the other indices
start to turn around. And that can be the
first sign that we need to exit that trade. Trading with the market
or training into energy today seem like the
best options for me now, before we get started
in the actual trading, what we need to think about
is our risk management plan. Currently I'm trading with a really small accounts
just to kinda show you how you can get started and trading my account size
right now is $4,203, which means if I want to
have a maximum 2% drawdown, that means that my maximum loss here is gonna be about $84. I wanna lose 2% of my entire portfolio if the
trade does not go my way, which means my maximum loss
on one trait can be $84. So if I set my stop-loss
$2 below my entry point, that means that I
can buy 42 shares, because if I multiply
42 times two, that brings me to
my maximum loss. So by, by 42 shares and each
share loses $2 on my trade. If it just doesn't go my way, means I'm gonna lose $84
on that, on that trade. And that fits within my
risk management plan. So that is how I'm going to
calculate my position size. It's going to be based
on an $84 maximum loss. And wherever I set my stop-loss. Now, very interesting,
just as I was saying, that's Novus actually had a little bit of a pullback here. It looks like somebody sold off some pretty significant shares. So that is very
interesting to see. You will have to wait and
be patient with synovial. I don t think this is
one that I'm going to trade as soon as the bell opens, I think we're going
to give us some time, this one and Suncorp, we're going to give them
some time and see how the day proceeds and processes. And then we'll jump
in once we have established some key levels
of support and resistance, usually I would like to
see a lot more volume and the pre-market
here so we can establish more clearly
identifiable levels of support and resistance. But to know is just
doesn't have it today. Like for instance, if we go
to Apple, whereas Apple, Let's go apple and we
go to the pre-market here you can see that Apple has a lot of data in the pre-market. All of the, all of
the candles here are pretty close together
because there's good volume. There's a lot of transactions
and it's very, very clean. If we look at Apple here, we can very easily establish some pretty key levels of
support and resistance. For instance, we've
got a price line here. We will draw out our
resistance right here. It looks like we've
got a new level of support right here at 145. We might have some
more resistance or support right here at 01:44. It acted as support
rate in here and then we got rejected after
breaking down through. It looks like we're
bouncing off right here. So it will be interesting
to see if we can make it back up to
this 144 level. But we're going to
watch this one closely. Apple could be a play throughout
the day here we do have some pretty clear levels of resistance throughout
the last little while. So let's just go to the
10-minute chart here. We're going to zoom in
a little bit and see, as you can see, we
can fall. Boom. Oh, we're going to go
to drawings price line. We've got some key
levels right here, kilos here, in kilos here. So as the price of apple
falls through here, if it continues to fall
through level, level, level, that's gonna give us
more and more confidence of a bearish move in the day. And we would be looking
for some key levels of support right around 13650. I'd be surprised if it
dropped down that low. That looks like it's probably
going to be three or 4%. But we are probably going
to find some support in one of these levels
today would be my guess. Again, I'm just scrolling
over to our ETFs here. We do know that almost all of our indices are
downright now, so we have some good
market confirmation and because they're going down, we want to buy into
an inverse ETF so that we can buy in and
the price will go up. We're gonna be using S QQQ. This is a three times
leveraged version of the Nasdaq 100's. And it's really interesting right now if you look at this, we've got a very
clear trend line coming to the
downwards direction. We have now broken out of that, which is very nice to see. It looks like we're
probably going to run into a little bit of resistance rate around
this level at $54 here. So if we can break through 54, which it looks like
we're doing right now, That's going to be
a very good sign. Looks like our next key level here is probably going
to be around 56. So this is what I
would be watching for training the ETFs right
now is the bounce 53-56, put a stop-loss at 52 and
you would be all set. That is something that I'm
going to write down right now as something to consider
as the market opens. Usually I don't like to trade in the first couple of
minutes of the day, but this does look like it
could be an opportunity here. So today we're going
to focus on S QQQ. We may consider going short on Apple just because it looks like we have some
key support levels. We're going to look
at supernovas and Suncorp because we have
a major catalysts with regards to oil and opec cutting back production
that reduces the supply at
drives the price up because demand stays the same
when the price goes higher. So Novus and Suncorp are
going to make more profit, making their company
more valuable. So that's how I look at it. As we sit down at
the computer here, we've got confirmation
from our indices. Everything's moving in
the same direction. So that means S QQQ is
going to be in play for us. We also have Apple
with some key levels of support and resistance. And then like I said, the
energy companies were starting to put together a
bit of a game plan here, starting to like
what we're doing.
55. Trade Alerts: All right everybody,
welcome back. In this video we're
going to start talking about trade
alerts and how you can use them to manage multiple opportunities
and improve your trading. Let's
jump right in. Okay, so I'm gonna
be looking at my top screen here
because we're gonna do an example in question and just a couple
of minutes here. But trade alerts
are very simple. They are notifications
that alert you when the price moves beyond
a specific level. Here is an example. I am looking at Shopify stock listed on the Toronto
Stock Exchange. I have this white line right here, which
is a trade alert. You know that, because
it's got a little bell located on the left-hand
side here instead of the order or the stop loss
and take profit is literally just a bell that is
going to notify us when the price crosses
above this level. You can also set it to below the level you
can set it bearish, they are bullish
that you can move this price anywhere you want. And it's really, really nice because it is a notification. And when that price moves beyond that level, it will alert you. It will send you a
pop-up in question. It will give you an audio cue. It's basically like
a bell is ringing, and it will let you
know that the price has moved beyond
this specific level. Now, how do we use
them as data as well? It's very simple when we think there is an opportunity
to trade a stock, but we do not want to
constantly watch the chart. We will use a trailer. What I mean by that is let's say that
you're going through your pre-market watch list or
your pre-market game plan, you find a couple of different
trading opportunities, but you also wanna do
some more research. So you're not going to
constantly watch that chart. You might have it open on your screen and
you might have it on a different window
or close down tab. But you don't want to be constantly watching
that stock because you might have other opportunities
that you're exploring. What you can do
here is you can set a trade alert so that when the best opportunity or
when that training setup plays out and you have an opportunity to
buy or sell short, it will send you a notification. You can get ready,
prepare your order, and decide if you want
to execute that trade. Trade alerts allow us to get notified if the price gets
close to a certain level. The idea here is that
we do not want to set a trailer when the price breaks out or breaks
down through support. We want to set the trade
alert when the price gets close because this
is super important, you need to give
yourself enough time to set up the order once
you receive the alert. So if we are looking for a stock price to
just break out of, let's call it the
100 dollar level. We do not want to
set our alert at $101 when the price is broken out because
it's gonna be too late. It's gonna be at 01:03 or 104. By the time we place our order, we want to set our alert 97 or $98 so that
we get our alert. We can pull up the chart,
we can get our order ready, then we can decide to execute on the spot when it gets time. We do not want to be late
and we do not want to be rushing through
our order because that's how we make mistakes. Okay, now let's walk through an actual demonstration
here on questions. I'm going to minimize this
screen here and we're going to pull up straight.
And there you go. I actually just got an
alert as we pulled this up, the bid price of Shopify
has gone above $42. You can see it right here. So my alert from that screenshot that I just took is gone. The price is breaking
above $42 here, and it gives you all the information
that you need about it. My alert literally
just went off. Now, let's say that we want
to set a new alert at $42.21. We want to set an alert
for the breakout. Well, realistically we will actually want to set it lower. Let's just say we're
going to set it at $42.11 right here. We're going to
right-click on this and we're going to click
on Create New, and then go to alert entry. I'll move this screen up here. We're going to
leave it on price. We're going to set
it at the bid price, and we're going to set it
equal to or above 42.11. We're going to
click on activate, and that is going to set
our new entry in here. So if the price
breaks above here, that gives us enough time
before it breaks above the daily high rate here
to place our order. Now, what's
interesting about this is let's say that you
want to move your alerts. You have to do is go
to drawing and make sure you're selected on pointer. And then it will
allow you to move this alert anywhere you want. So it's going to bring up
confirmation tab right here. You click on Accept and it
will now move that alert. Now, let's say that you wanted to move it to the downside. If you just drop this down here, that is going to set the
alert to above this price. And that means
that it's going to automatically trigger right away because the price is already
above where this alert is. And so in order to move it below and go to
the bearish side, what we actually need
to do is we need to edit it or we
need to cancel it. Yeah, a couple of different
options there for us. We're just going to
click on Cancel alert. We're going to click
on create new alert, alert entry here and we're
going to set the bid price. I wanna get triggered
if the price comes back down to the
support level here. So we'll set it at 41.40 and we'll go less
than or equal to 0. I'm going to move this up. We'll go less than
or equal to 41.40. Click on Activate here, and now it is going
to put bid price less than or equal to 0 types
of right and wrong, okay? My bad less than or equal to 41, 40, that's what I
meant to do, 41.40. And then it will activate. And now we have our
price alert alert here. So if the price comes
back down to this 41.40 level is going
to send this alert. Hopefully, we can
place our order for the breakdown of the basically daily low
right here you can see this blue line right here
is where it started. So actually we dipped
a little bit lower in the first few
minutes of the day, but this is basically the
second low of the day. If we break below this and then bring it below the
low of the Open, now it'd be a very bearish
indication and that'll be a great opportunity for
us to short the stock. Now, in summary, here's
my strategy number one, I go through my
pre-market game plan. I just explained that
in the last video and I try to look for two to
three opportunities. Once I find those opportunities, are starting to do my technical
analysis on those charts, I set alerts for when the stock breaks any key level that
presents a good trait. Obviously, I'm
setting that alert before the stock breaks, do that key level so that I have enough time to place my
order and get set up. Lastly, I'm evaluating and
choosing the best trade. The idea here is that you have the entire market to trade. You could choose any of the thousands and thousands
of stocks that are out there. What you want to try and do is find a stock where
you have an edge, you have an idea of
what you think is going to happen for
x, y zed reason, then you want to try and shake the best risk reward
trade that you can find based on
technical analysis. And you want to find a couple of those so that you can evaluate different opportunities for the best one that's going to
make you the most money. That is, the idea here is we're starting with the
entire stock market, trying to narrow it down to a few opportunities
and then identify which one is hopefully
going to make us the most money and execute on that tree. That's what we're
trying to do here. And by using trade alerts, you can hopefully manage a
couple of opportunities more easily without having to just constantly
look at that chart, you can evaluate more
and more opportunities. You can dive into
one opportunity while one is kind of
cooking and progressing, you can just manage
your trades a little bit more easily and
be a little bit more relaxed that you're
not going to miss a trade if you don't get an
alert. That's the idea here. Hope you got some value, will
see you in the next one.
56. Penny Stocks and Pump and Dumps: All right, everybody, welcome
back to another video. In this one we're gonna
talk about penny stocks and pump and dumps and what you
need to know as a day trader. Let's jump right in. First of all, what
is a penny stock? A penny stock is very simple. It's any stock or
the price below $5, and they usually do not trade on major exchanges
like the nasdaq, the TSX in the New
York Stock Exchange. Those exchanges have extremely high reporting requirements. And so smaller companies
with low share prices cannot meet those
reporting requirements and so they list on
smaller exchanges. So if you ever see
a company that's listed on an exchange or an OTC exchange stands for
over-the-counter exchange. And they are much smaller
exchanges with much, much lower reporting
requirements, making it easier
for companies to list their shares
on those exchanges. It also makes it easier to
pump and dump those shares. That is when somebody
will hype up or promote the stock in order to get
attention and raise the price. They will then sell their shares when the price has risen. They're basically trying
to get other people to buy the stock on the idea that it is
a good investment or it's going to make
them a bunch of money, or it's gone up really soon. And then those
people will buy in, sending the price higher because the demand is increasing. And then once the
price has risen, whoever was pumping
it will then sell their shares and
take their profits. That's the idea behind
a pump and dump. Now, who can pump the stock? This is really important
because it can actually happen from a variety
of different sources. Number one is influencers. Number two is the actual
management of that company. Number three is new stations. Number four is online
articles or websites. And there's also a variety of other places that you
can actually find. Things like this, for instance, is a lot of companies
that will put out reports that will either say, this company is amazing or
this company is absolutely terrible and they
will already have a position in that company. Don't make money based on
the reaction to that report. And so this kind of thing happens in the marketplace
and he just needs to be aware of it and hopefully you can spot it using
this technique here. So how do you know when a stock or company is
being pumped and dumped? Well, number one, the price
is moving up dramatically. When I say dramatically,
I'm talking about more than five to 10% per day. If a stock is bumping
up by 15, 20, 25% a day over day over a
course of two or three days. That is your first sign. If the volume is increasing
at the same time, that is your second sign. And then third, this is the most important one because obviously right here,
this is the pump. But here's how you really tell. Number three here is that
there's no actual news that will fundamentally
improve the business. For instance, if the
stock goes up by 25% or even 50 per cent over
a couple of day period. That means that the
company is worth 50% more. There is no news that came
out that made that company worth 50% more like a new partnership and new
products and new development, a new contract, a new, something that made
that company worth dramatically more than
you basically got to start thinking
this is probably going to be a pump
and dump because the price is skyrocketing here and nothing has
changed with the company. That means that some
outside force here is influencing the supply
and demand factors behind that stock. Now, this usually happens to smaller penny stocks
on smaller exchanges. Number one, because the
reporting requirements are very, very low, there's
less regulations, is less people looking at it, and it's very easy to get a small company listed
on to exchange. Secondly, because if it's a small company
with penny stocks, if a bunch of people go into that company and
buy those shares, that price is going to
move exponentially. However, if they did the exact same thing
with like US company, the size of Apple or
Tesla or Microsoft. The price isn't
going to move it all that kind of size
isn't really going to change the markets
because there's so many shares being transacted. But in a tiny little
penny stock company with a couple of hundred
million dollar market cap, a couple of traits can
really move the price. And for somebody that
is pumping the stock, look in a cell it, they
can make a ton of money. So you have to be very careful here anytime
you're trading penny stocks on
smaller exchanges and when you see large
price movements, especially in the
upwards direction. No news. That is how you know, you're probably looking at
a pump and dump. Now, here's just one example of what a pump and
dump it looks like this was a big eagle aerial
systems, their drone company. And a few years ago I
was falling on fairly closely and their
stock went parabolic. You went from $2 here up to $17 in just a matter of
a couple of months here. And now it is trading at $0.45. It has come down like 95%. It's absolutely ridiculous. And it's because the
company released a bunch of press releases
and they let a couple of rumors get loose
that they were partnering with
Amazon that drove the stock absolutely
sky-high and they never put those rumors to rest and said they weren't true. Then all of a sudden
a couple of reports started to surface that
the company was lying. They didn't have a
partnership with Amazon and the drones
that they were making weren't actually
working in the stock, then eventually
basically began to plummet and the management team was selling the
whole way through. So very, very interesting
to see what happens here. And this is just a pure example of what a pump and
dump can look like. A bunch of fake news. Cent the price higher or report came out
saying that, hey, that news isn't real and this isn't actually
going to happen. And a lot of people lost a lot of money
with this company. And so in summary, what I'm trying to say
here is that pump and dumps and penny stocks
are very risky. The best way to protect yourself here is with a
trailing stop-loss. Secondly, you can take advantage of these pumps and dumps
when you recognize them, but make sure that you
are not promoting them. Make sure that you're not
pumping them up any higher. Makes sure that you are not encouraging this behavior
because it is manipulative, it is destructive, and a lot of people lose a lot
of money with this. So you need to be
very, very careful. You do not want an investigation from the regulators
coming at you and saying, Hey, what's the story here? Why are you talking about
this stock at this time, as the price is moving up, you might want to be really careful about how
you handle that. So for me personally, especially because I'm making content, I try to avoid the
pump and dumps. Too risky. They're
unpredictable. It's very difficult to perform technical analysis on them. And because I have a bit of
a social media following, I don't ever want to be accused of pumping and
dumping any stock. So I'm very careful with this. I usually avoid them. And because I like to
do technical analysis, it's much easier to do that on the larger cap, especially
technology stocks. So that's usually where I tend
to focus a lot of my time. A lot of people specialize in these small companies when it comes to day trading and they look for volatility like this. Personally, it is not my style, but a lot of the principles that I've
taught you from the, throughout this course will apply to everything
that you see here. Now, the big thing
to keep in mind, and I have said this from
the absolute beginning here is that everything
in the market and everything in the stock
market especially comes down to supply and demand
forces up pump and dump is just a manipulation of supply and demand
forces like what we talked about at the
beginning of this course. So when you see a new situation, like a stock that's skyrocketing
or a pump and dump, or somebody's come up
with a short report. Think about the supply and
demand forces and how they are being affected based on what you are
seeing in the charts, based on what you are
reading in the news, based on what is happening
with management, try and understand the
supply and demand forces because that will usually lead you to the path to profitability when it
comes to day trading, that's my best advice
for you and that's how I tried to think through
every situation. I hope that helps and we'll
see you in the next video.
57. Chart Analysis: All right, everybody, welcome
back to another video. In this one, we're going to talk about how to actually
analyze the chart and perform technical
analysis once you have identified a stock that you
think you may want to trade. So these are the four steps that I think you
should go through. And then I go through
when I'm going through my pre-market checklist
and then I've identified a stock where I
think there's an opportunity, or I think there's a catalyst or there's a reason to trade it. This is what I then go through. Number one here is always start with the big
picture for me, that means a six-month
timeframe with one day candles. This is my starting point. This is where I
like to start out. I can expand it out to a one
or two years if I want to. And the goal with this is to try and understand the
story behind the stock. Is this a stock that
just keeps getting rejected at the same
level every single year? Is this a stock that is grown immensely in the
past few years or is this a pump and dump
that just keeps spiking and coming back down. What is the story
behind this stock? The idea here is we
want to understand the big picture and
then work our way down. Once you know what
the big story and the long story is
behind the stock chart, then you want to start moving
into the actual company. This is where you want
to check the news, the earnings, any catalyst
or industry updates, or even competitor
news that might impact the stock price or what is happening
in the marketplace. You want to just be aware of what is happening
if the company is reporting earnings today,
tomorrow, next week, whatever it is, you want to
be aware of that if it is a biotech company
that's supposed to be reporting phase II
results this week. That is a catalyst that
you need to be aware of if the industry is absolutely collapsing because the price
of oil is falling off a cliff and all of your oil producing stocks
aren't doing so well. That is something that
you need to be aware of. You want to understand
how this company fits into the big picture in the marketplace and
in the economy, and in the competitive landscape outside of the stock chart. That's the idea with
this step here. Once you kind of understand
what is happening from the big picture on
the stock chart and in the marketplace. That's when you start
narrowing yourself down. You start to try and identify key levels on the
big time frame, and then all the way down to the small timeframe until
you get to the daily chart. Once you have identified your key levels on
the daily chart, that's when you set alerts
so that if the stock price moves in XYZ fashion, you are going to
react with XYZ trade. That's the idea here is that we're going to set
our key levels, set archaea alerts so that if the price starts to
move in that direction, we have a trade idea and a plan ready to go for when
that alert goes off. That's the goal here
and that's the process. Now, just to focus on
step two here real quick, where can you find
news and earnings information and catalysts
and industry updates? While it's actually
fairly simple, there are a ton of different
resources and you don't have to go through this
entire check, checklist. But if you're looking for
just general market news or what's happening
in the market, what's happening with the Fed. Yahoo Finance and CNBC are
usually good places to go. If you want something
specific to the company, I recommend going to the
company website or going to the company profile on either
of these two websites. If you want detailed information about the statistics
of the company, analysts reports and basic, basically any article that gets written about
the company at all. You'll be able to
find it on Canvas if you like, the
analyst information, you can find an
amalgamation of a bunch of different analysts reports
and how they feel about the company on a website
called tip ranks. If you're interested in kind of a high-powered version of CNBC and Yahoo Finance by
Bloomberg and your broker, meaning quest trade or
interactive brokers or Weibull, whoever you decide to use, they should have a stream where
you can find earnings and information and articles
about that company. So if you'd go through, and you just go through a
couple of these sources you should do to find all of the
information that you need, a belt that given company. Now when it comes to actually identifying key levels
and setting alerts, we're going to walk
through an example right now with so phi. Okay, So this is the
pie chart that we're gonna be using as our example. As you can see, we're
looking at this over pretty much it 12
to 15 month time-frame. I've taken it all
the way back to where if I listed publicly, you can see they
basically just started trading right here
around 23 or $24, rose up to 24, 95 here, and then came down to 14 before coming right back up to
that exact same level. And so first thing I want to
draw here is a price line. I'm gonna do that by
going to drawings, clicking on price line, and then highlighting this level right here where
they both connect. Now, my price line extends
to the right here. If you want yours to do that, all you have to do
is right-click, go Edit price line, and click this little
box right here that says extend price
line to the right. Click on Okay, and it will
do that same thing for you. I personally like it
because then all of my key levels just keep extending as the
chart builds out, is just personally a
thing that I like to do. So that is our first key
level of resistance. Pretty much 24, 95,
$25 right here. So next one is gonna be
this level right here. This was our key level of
support that we bounced off of pretty much at $14 here. And so that is going to be our key level of support
on the big picture. Now, obviously we have broken
through that key level of support and it looks like we formed a bearish
trend for a while. So I'm gonna go to
my trend line here. I'm going to basically showcase that trend
line right here. And it looks like
we broke through that trend line in
May of this year. But wow, this was a pretty strong channel for a little while. So that is good. We've identified key
levels of resistance, Q levels of support. We then traded in a channel
for what looks like. 2022 to May, so about five months here
before breaking out. And now it looks like we have a double top right here at $8. So again, I'm gonna go
back to my price line. I'm going to showcase this
level right here at $8. Now, obviously we've
got a couple of points and some wicks here
that are kicking through $8. And maybe you could
even argue that we didn't touch $8 right here. But the line or the
specific price level of $8.16 in this situation is not the exact
level of support. The level of support is an area. It's like plus or minus
a couple of percent. And so what I am trying
to indicate here with this line is that
around this area, we're likely to find a
level of resistance. That's what I'm trying
to identify here. And as we basically
slowly zoom in here, we can see more key levels
of support and resistance. And as we work our way across
here, it's like, okay, this five-dollar level has clearly been an
important level for us. And so I'm going to draw
another price line right here. Boom, $4.91, $5 anywhere
in here because we have bounced off
of it once right here and we have bounced off
of it again in June, and we were bouncing off
that right here in October. And so this is very exciting for us now as we start
to zoom in even more, I want to look for more
key levels of support or resistance based on the
highs and lows on the chart. As you can see right
now, we consolidated right around $5 for
the last few weeks, but the recent high
was right here around, let's call it $6.48. So this is the key level of resistance where I think the price is going
to bounce off of $5. And the next key level that I'm going to be
watching for is $6.50. So by starting out
with the big picture, we can narrow our way
in and say that, okay, I think the price is
going to bounce off of $5 and it's going to come up, it's going to rise up off of $5, just like it has
in the past here. And the next key level where it could get rejected is at $6.50. Now, as you had gone
through step number two here and you had
checked for the news, earnings and catalysts as
well as industry updates, you would have realized that Sophie had earnings coming up, which is very, very exciting. It could be a major catalyst. And if the earnings go well, the company could
do extremely well. And so when we look at
Quest right here and we actually start to zoom
in to the one-day chart. What I want to show
you here is very, very exciting because
here is our level, this white level right here. This is the line that
we just drew, $106.50. When we zoom in here, we can see that
earnings came out right here on November actually, they came on aftermarket on
October 31st right here. And the price skyrocketed up to our key level
right here at $6.50. And so if you had realized
this and you had seen, okay, we got the balance, we've got to bounce off of $5. We got up to that key level, that next one right here. Now the price is either
going to break out again or it's going
to get rejected. You could have seen that we got clearly rejected right here. And you could have sold
this stock off all the way back down to the key
level, right around $5. That is why we focus, and that is why we start with the big picture and
work our way down.
58. 57 Mindset: All right, everybody, welcome
back to another video. In this one, we're going
to talk about your mindset and your mentality when
it comes to day trading. Now, first thing that you
need to think about is your morning mindset before you sit down at that computer. First thing you need
is a very clear head. You do not want to be fogged, you don't want to be tired, you don't want to be
still not waking up mood. You want to be up
and ready to go as soon as you sit down
at their computer, you need to be
fully awake and you need to be not distracted. So if you've got
ten text messages on your phone that
you need to deal with at some point
in the morning after trading or do
it before trading. But make sure you are not doing it while you are trying
to trade or while you're trying to do your
pre-market session is just going to distract you and it is not going to be good. I personally recommend
going through a morning routine for me that's like going
to the bathroom, doing my kinda get ready stuff, go into the kitchen, having a big glass of
orange juice scene. If there's any big
things that I need to deal with throughout
the day and then sitting down at my computer and getting into that morning
pre-market session, I highly recommend building your own personal
morning routine. Now once you get into
the actual trading here, there's a couple of
just kind of rules of thumb that you might want
to keep in mind here. Number one, it is better to not make any traits
than to lose money. You see that the market
is really choppy. You don't have any
clear strategy here, you don't have any
clear direction, and you're just not really sure about the positions
that you're looking at. Don't take any traits, just
walk away from the computer, go do something else
during the day, stay productive, but
do not feel like you need to take a
trade every single day. If the market is not presenting you with any opportunities, you do not want to try
and create one out of a bad opportunity
and lose money. A lot of the time, it's better to just walk away
from the computer than to stay there and try and force something that
isn't really there. Secondly, never be scared
to lock in profits early. Good traders and rich traders are never worried about
locking in profits early. It doesn't matter if
the stock price runs up afterwards, that
is going to happen. That is part of the
game, that is part of how trading works. You need to be able
to manage that. You need to keep a calm, cool, and collected hat. If you lock in profits early, you need to call it a good trade and move on to the next one. Never be afraid to
lock in profits early. It could crash, it could
skyrocket. It doesn't matter. But if you can come up with a little bit of profit
on the trade, it's a successful trade, and that's all that
matters for a secondly, or thirdly here, set a point to walk away
from the computer. If you're into your
trading already, you need to have a very
hard line that says, if this happens, my day is over. You can set it as $1 amount. If you lose $300 in a day, your day is over and
you're going to walk away. Or it could be three
bad trades in a row, whatever it is, it's
really honestly, it's kinda flexible,
independent on yourself, but you need to have a limit, whether it's trade,
whether it's $1 amount, whether it's something
else, you need to have a limit that says
if this happens, I'm done for the day. I'm going to go find
something else to do today. I will come back with
a clear head tomorrow. Now. Lastly, here I've said
this a couple of times, but it's just so true. Small, consistent winds based
on a repeatable strategy, that is what we're
trying to achieve and that is what is going
to bring us success. We're not trying
to hit home runs, were trying to get onto
first base at every at bat. And that is a small consistent
when based on the strategy and the trading plan that we're creating
throughout this course. Now, when it comes to emotions, emotions are your
absolute worst enemy. I know this sounds weird, but you never want to be making any decisions based on emotions. One of the best examples
of this is looking at your profit and loss
while you were in a trade. If you're trying to get
to a big round number of, let's call it 500 or $1,000. And you're getting close there, your emotions are going
to want to draw you into holding that position longer
than you possibly should. That is going to mess up your trading strategy is
going to mess up your plan. It's going to mess up the
data in your journal, and it's going to
mess up your trading. And so you do not want to have
emotions in your trading. If you feel yourself
getting emotional, it is time to walk away. And that goes on both the
high side and the low side. You feel depressed and discouraged and stressed
about your trading. You need to walk away
and do something else. Also, if you feel euphoric and you feel like
you're on top of the world and you feel like
you've got confidence because you just mastered
for different traits, you need to step away as well. You're getting way too high. You got on a lucky streak here. You need to walk away. You need to thank God for the
luck that you had that day. Take a break, come
back tomorrow without clear and level head almost
as if it never happened. And just keep trying to repeat the exact same thing
that you did before. That's the strategy there. This goes both ways. I've been on the high
side and low side, and trust me, everything always comes back to the
middle at some point. And lastly here we have a
strategy and a trading plan. So we do not rely on emotions. Emotions are your enemy, they will divert you from your strategy and
your trading plan. We have a strategy and a training plan and I get
you to write it out and actually talk about it so
that we're not going to be pulled away when our emotions start to get the best of us. Now to other situations where you need to walk
away from the computer. And this has happened to
me if you get into a trade and you notice that your
heart rate increases, that is because you are getting excited or you're
getting stressed, or it is too big of a position
and you need to downsize. It is because something is happening that is
getting you excited, it's getting your
heart pounding. That means that emotions
are starting to step in. It also means that you're
probably not going to be thinking with as clear
of a head as possible. And it probably means
that you care too much about that position or you
care more than you should. And in that scenario, I highly recommend you
downsize your position. You trade with less money, you cool your jets a little
bit and make sure that heart rate comes back down
so that you are calm, cool, and collected and can
analyze the data for what it is that you're not being swayed
by any of your emotions. Secondly, here, if
you feel worried or stressed about
trading at any point, that is a red flag,
that is not good. You want to step away
from the computer. You want to go do some research. You want to go do your analysis, back to a practice account. Take your time. You do
not want to be stressed, you do not want to be worried. You do should not
be trading with more money than you can
afford to trade right now. And your heart rate
should not be increasing. If my positions
dropped by ten or 15%, it is not going to materially
affect my net worth. It's not going to
materially affect anything that I do in
my day-to-day life. And you need to make sure
that it's the same for you. If your heart rate is increasing every time you make a trade, you need to downsize or you need to change how
you are trading. This is a feedback loop. That's what we're trying
to establish here. You need to follow
your trading plan and execute based on
that trading plan. Then you need to
upload those traits to your journal so
that you can analyze your training and
gather data based on what worked and
what did not work, then you need to
adjust that trading plan based on that data. So this is a feedback
loop of trading, analyzing and improving, cycling through it
every single day. That's what we're trying to do, and that's how we get
better as day traders. That's how we understand
our own trading. That's how we realized
what we're good at, what we're not good at, we focus on the most profitable
aspects of our trading. In summary, here, you do not
need to treat every day, do not feel like you need
to make a trade every day. You can sit at your computer for 3 h and not make a trade. You should not feel
bad about that. There is nothing
wrong with that. You're not wasting
time is just set. Opportunities did not show up. It's like going out
fishing and going out for the entire eight
day and doing your absolute best and you
don't catch anything. Just part of the industry
as part of what happens, you only want to take
the best opportunities, especially if you have to
deal with the PDT rule. And in a lot of scenarios, I've seen it myself. I've done it myself and watched a lot of people
go through this. It can be better
to walk away from the computer in a
lot of situations. If you're stressed,
if you are worried, if your heart rate
is increasing, if you don't have a clear head, if you haven't done
your morning routine, step away from the computer, take your time, come
back in half an hour, take a break, go
back the next day. Just be patient with it. Be calm with it
and make sure that you're in the right mindset and Headspace to actually make financial decisions for
yourself and for your future. And makes sure that
it's not going to stress you out along the way. This should be an
enjoyable practice. This should be
something that you look forward to
and this should be a energizing experience without giving you a euphoria or a rush. We do not want to have a rush of trading when we're doing this. If you feel a rush or you feel adrenalin or you feel
your heart rate. That is emotion
stepping in and we need to take a
step back and make sure that we're following
our training plan and possibly take a break. So I hope this video helped. We will see you guys in the next video and we'll
talk to you soon.
59. 55 Goal Setting: All right, everybody, welcome
back to another video. In this one, we're
going to talk about goal setting while
your day trading. Now, when it comes
to day trading, your number one
goal and the number one thing that
matters the most is building a profitable long-term strategy that you can clearly articulate and you can repeat on a daily basis in
the marketplace. Now, how do you do that? How do you build a profitable
long-term strategy? Well, I've given you a
lot of the tools that you need in order to do
that in this course. Now what it comes down to is starting with the
practice account. The reason we start with the practice account
is because you are most likely to lose
money in the beginning. If you're most likely to
lose money in the beginning, you might as well
loose fake money so that when it's real money, hopefully you have
some track record and a little bit of
confidence going into it. You've already tested
out your strategy. Number one, start with
the practice account. Number two is to journal
all of your trades. Number three is to look at that journal information and
figure out what you're good at and what needs work or what you should cut
out of your trading. And then you need to
adjust your strategy. And when I say
strategy, I am talking about your entry
and exit points, your position size,
what makes you interested in a certain
trading opportunity? How do you manage that trade? How do you go through the process of getting in
and out of that stock? You need to adjust
that strategy. You are profitable,
enter practice account. And then once you're profitable
enough practice account for at least two weeks, if not two months, then you can open a
small margin account and continuously repeat
steps two to four to adjust your strategy to becoming more profitable trader
so that all you need to do is just
add more money and keep trading for a
longer period of time. Now when you're ready to get
started with real money, number one thing
here is do not start trading with all of your
money in the beginning, if you have $10,000 that you're willing to dedicate
to day trading. Start with 4,000 or $5,000, proven other a little bit, make sure that you're
profitable and then start adding the
rest of the money in. You do not need to dump all
of your life savings or all of your day trading money
into that first account. On day one, it is not necessary. Be patient with it, take your time and build
up with a small account. Because if you're profitable
with a small account, you can be profitable
with a big account. But if you start
with a big account and you're not profitable, you are just going to lose
more money than is necessary. So I highly recommend do not start with all of your money
right in the beginning, focus on the strategy and
the risk to reward ratio. That is the entire key here, is getting in and out of stocks with a good risk to
reward ratio and being right on a
certain number of those stocks that you come up profitable at the
end of the day, journaling that information
so that you can adjust that strategy and
improve it over time. And as a trader, it is the small consecutive wins that are gonna make you
a profitable trader. We're not here to hit home runs, were here to get onto first base each and every time
that we are up at bat, that is the goal here. And that's how we're going
to succeed long term. Now when it comes to your
actual goal setting, I see a lot of people
talk about trying to set a daily target with
$1 amount behind it. I personally do not think
that is the right strategy. I do not think you
should be setting $1 amount As your daily
target or your daily goal. For me personally, how I
managed this is my goal is to make one to four
good trades per day. That is the goal. If it doesn't happen,
that is okay. If I don't make any
trades one day, that is completely fine. But if I start
making bad trades, that is what I
need to step back. I need to reanalyze
and I probably need to take a break when
things are going well. I'm making one to four
good trades per day. And that is a, that is my goal, that is my target
because if you try and set $1 amount as your goal, what's going to happen is you're going to get into a trade. Let's say your target
is $200 a day. You're going to get
into a trade and that trade is gonna get up to $180. And the technical analysis and everything in U is going
to tell you the cell, but you're going to look at your daily profit and loss and see that you're only
$20 away and you're going to hold on as
that stock starts to sell off and it is going
to mess with your trading. You're going to divert
from your strategy. You're not going to
stick to the plan and it is going to mess you up. So you want to set
a goal of making good and profitable trades without $1 figure
attached to them. The other reason is because you can make as much
money as you want. If you have a
profitable strategy, you just increase
the position sizes and the bank account. But if you are not profitable, you're just going to lose
more and more money. So it's super, super crucial. Just focused on making
good traits and not trying to set $1
amount each and every day. Because if I am making
profitable trades each day, all I need to do is scale
up to make more money. So this goal is really only relevant to your
actual account size. It's not really relevant
to how you're trading is going to definitely think
about and consider, and in summary here to boil this all down and to
give you everything here, you need to focus
on what makes you profitable rather than how
much profit you have made. That is the key when
it comes to training. So when I'm trading, I'm trying to make one to four
profitable and good trades per day and I know
if they're good. If I'm kinda sticking
to my game plan, I'm adjusting as things come. Doing good analysis. That means that I'm
having a good day. And I, personally, I don't
even look at my profit and loss until it's like maybe lunchtime or
I'm about to wrap up, or if I'm really curious
about it in-between traits, but I will never look
at my profit and loss during the trade and is going to mess
with your head. It's going to mess
with your analysis. And it is just a bad, bad habit to get into. Because if you see that you
are close to your target, you're going to throw all
of your analysis and all of your strategy out the window just to try and hit that target. And nine times out of ten, it is not the right strategy. So that is my personal opinion. That is how I manage
my own goal setting. And I hope this
video helped you.
60. Hot Keys: All right, everybody, welcome
back to another video. In this one, we're
going to start talking about
hotkeys so that you can get better executions
and get faster at placing orders for an
entry or for an exit. I don't know if you've ever seen videos of other
people day trading and sometimes it looks
like they're not even clicking on the screen. It's probably
because you're using hotkeys and it's basically keyboard shortcuts that
allow you to set up your order form really
quickly and really fast. So in this video, we're going to use my
practice account on trade and I'm going to walk
you through how to set up hotkeys and then
how to use them. So to start us off, here, we have a chart right
here on the left side, we have an order window
at the top and we have basically our account summary on the right in the middle here. To get too hot keys, you're gonna go to File
and then you're gonna come down here to
user preferences. And you're going to
scroll over to hotkeys. You can see it right here. And the idea is, is you have all of these
different controls and all you have to do is kinda program
them with certain keys. You first have to make sure that you have hotkeys turned on. You can also print out this form and you can restore
your defaults here. But as you can see, I
have it set so that the buyer market
control is set for F2. Then I have this cell
Margaret control set for F3. And all you have to do is
just click on this and then type in the key
that you want it to be. You cannot use letters. So I have basically
programmed to all of my function keys at the
top of the keyboard. So F12, 12 are all programmed in here to
do different functions. What I recommend and how
I have it set up is F1, no matter what is
your Help button. And then F2, f3, and f4 from me are
different order types. F5.6, 7.8 are
different quantities, and then F9 and F
are stop orders, and f 11 and F2 are
changing the price. So I've kind of broken it up by basically what I wanna do. And you can see all
of that in here. F5, F6. All of these different basically programs are set in here to increase or decrease
the quantity or increase or
decrease the price. And so when you click on Okay, it will basically confirm
all of those hotkeys. And the big thing that
you have to remember, and this actually
messed me up early on here is that when
you use hotkeys, first of all, always
start this off in a practice account and
test it out first. But when you use hotkeys, you have to be selected
in the order window. So you can see that here, I have selected the
order window and it's slightly lighter than
the other windows. When I click on the Summary
window, it lightens up. You got to make sure that you're selected on the order window. And then for instance, as
you can see right now, the order type is stopped and
we've got a quantity of 40. If I'm selected on
this window and I click my shortcut
for buy at market. It changes the order
type to, first of all, select the buy button here, but it changes the order
type to mark it as well. So that if I wanted
to buy 40 shares, all I have to do is click
the Enter button twice. It's going to give me
that confirmation page. And then the second time that
I press the Enter button, it's going to
confirm that trade. And now as you can see, we have an open quantum need
for 40 shares of Apple. We have a position
in Apple and we just executed that trade with
basically three button clicks. We clicked the Biot market and
then we click Enter twice, and it executed that trade. If we want to get out of this, we can click sell at market. And now we didn't change the order type here because
it's still a market order. You can see it as highlighted, the red cell button, if I click on Enter
twice, just like that, it is going to exit our trade
and yet we're recording. I just wanted to make sure
you can see that on film. And so that's
really cool. And so now let's say that we actually wanted to increase or
decrease the quantity. Well, that's really simple. And what I've done
here is I've actually created a little bit
of a cheat sheet. Hopefully you can
kinda see this. But basically what it is, is it tells me exactly what each one of these
buttons is gonna do. So if I press F5, it is going to increase the
quantity of shares by ten. If I press F6, it's going to
increase it by 100. Same thing with F7 and F8, but going in the
opposite direction, decreasing by ten and
then decreasing by 100. Really, really nice,
really, really simple. And it just allows me to control this order with just a couple
of clicks of the button. Now, let's say that I
want to get back into it. So we're gonna go buy at market for 50 shares, Enter, Enter. And now I want to
place a stop-loss. Really, really simple for me. I have it programmed as FTN. As you can see there. It
is now going to set us to the cell button right
here with a stop order. All we have to do is
make sure that we have the price set
for what we want. Let's go 145.2. For this example here, we'll click on Enter twice here, and now it has
entered a stop-loss into our chart here and
into our order feet. And so this is really, really nice because
you can program these keys to do whatever
you want them to do once you get used to them and you kind of
understand how they work, you can get really, really
good at placing your orders, canceling your orders, getting
in and out really quickly, and it can overall
improve your execution. And when I say execution, what I'm referring to is your actual ability
to get in and out at the prices and the levels that you want
to get in and out at. So if you find that you're
trading a breakout and you're always still placing the order as the stock is breaking out, so you're rushing through it and sometimes making mistakes. This is probably
your holy grail. This is what you need and you need to get
really good at it and you need to practice
it in a demo account, in a paper account
and a practice count, whatever you want to call it, sign up for the trade one, you get 90 days of free use and it is absolutely fantastic. It's really, really good. Then once you're
ready to go with it, you can use any of the links in the resource file
for this course, and it will give you $50 in free commissions if you
decide to go with trade, go with Interactive Brokers
or Weibull or new moon, whichever one works
best for you. But you need to get used to hotkeys because it can
really help you improve your execution and
it can help you improve your profitability
as a trader. So that's it for this video. Hope you got some value
out of this video. Make sure that you understand
how these hotkeys work. I am probably going to be doing
a mix of just clicking on the orders here so that you can see how everything is
happening on the screen. And then for some of the videos or the live trade recordings, I'll use hotkeys as well. So hopefully you can kinda
see both strategies, but that's it for this one. We'll see you in the next video.
61. Trade Recordings : All right everybody,
welcome back. In this video,
we're just going to have a quick discussion about what you're going to see in the next section of the course, which is my trade recordings. Now, what is a trade recording? Basically what I've done
here is I've set up a video recording of
my pre-market session, basically my pre-market game plan for how I get
ready for the market. And then a separate video
when the market opens of my real trades and how I'm
actually managing the money, analyzing the
market and actually making the trades are
recorded, the whole thing, edited them into shorter videos so they're easier to
digest that basically just set everything
up so that you can see how I'm
actually trading. Now the goal here is to give you the ability to
see how I apply the lessons in this course
to my actual trading. The goal here is to teach you everything and then show you
exactly how I'm applying, what I've just taught you
through real-life examples. This is real money, this
is my real account. However, it is a small account. I don't want to show you how to trade with 100,000
dollar account when 99% of people are going to start out with
somewhere $1000-5 thousand. So what I've done here is I'm using just a small
margin account. It usually has about
$4,000 Canadian in it. I am trading in Canada, so there's no PDT rule for me. It is a margin account
and I am using Quest trade for pretty much
all of these recordings. You have any questions
about any of that? Leave a comment down below and I will answer them
as much as I can. Now, the key here is
what to focus on. Do not focus on the
profit and loss. You should be focusing on the strategy and how I'm
getting in and out of these trades and the
mindset that I have during the trade and during the entry and
during the exit. I'm going to try and talk
to you as much as I can about what I'm thinking
as I'm thinking it, as I'm doing the day trade. So obviously some of the
ideas are gonna be wrong. I'm gonna be kind of
a little wishy-washy on some topics until I
make a final decision. This is just my
actual mindset and my actual process that I'm going through as I'm
making these traits. What I really want
you to focus on, especially in some
of these examples, is how I manage the trades. Once I'm in them, do I stick
to my original plan or do I just and correct as I get new information, super,
super important. I also want you to
look at how I use different timeframes to
analyze the security and how I use the different tools
that I've talked about in this course to hopefully
make a better trade, I'm going to compare a lot of stock charts to the index e.g. and I want you to understand
why I'm doing it, how I'm doing it, and what kind of information
I'm trying to gather from it that is the goal of
these trade recordings. Now, if you don't make it to the end of the trade recordings, please remember that there is a bunch of resources
for this course. There's also a course
project for this course. So please go through
the project, take a photo of it, uploaded it, it would mean the world to me. I've also put together a document with trading
resources and links. This is all of the links and websites and
pretty much everything that I use for day trading. So you can download
that document, you can go to all of those links and a lot of them will
even give you bonuses. Now, if you get any value
out of this course, please remember to
leave a review. I sincerely appreciate it. I read all of them
and I try to use that information to correct and make better content
in the future. Also have several other courses, such as options trading. So if you're interested
in moving on from day trading stocks to
day trading options. Check out some of my
other courses and some other content right
here on the platform. And that's it for this video
without any further ado, let's get into some
of these real traits.
62. SQQQ Pre Market Game Plan: All right. Good
morning, everybody. It is 07:07 A.M.
on Friday morning, we're just sitting down at the computer getting
ready to go. I got my OJ, have gone through my morning routine now
it's time to start to put together our
pre-market game plan so that we can get
ready for the day. It is very early for me. I did not sleep super great. I do feel ready to go, but I did not seek great, So I do feel a little bit tired. But regardless, we're going
to get into it today. We're going to make
the best of it and we're going to try and
make some money today. So let's jump right in. Okay, First things first, I usually like to look
at the economic calendar today is Friday, October 7th. And we have actually a
lot of stuff going on. Nonfarm payrolls,
unemployment rate, average hourly earnings,
labor force participation. So we have a couple of
different metrics all coming out this morning at
08:30 A.M. so again, in about 20 min, actually 1 h
ago it would have come out. So we'll take a look
at those reports. And then 10:00 A.M. we've
got a couple of Speaks. New New York Fed president
John Williams speaks. We got consumer credit
coming out at 3PM. And Fed Governor
Christopher Walker speaks. So lots going on today actually from the
federal government in the United States. Let's just see. Earnings. Friday,
we've got Tilray, a cannabis company
cannabis companies actually popped off
yesterday because Biden announced that simple
possession charges from the federal government
would all be pardoned and cannabis stock skyrocketed. Probably because people
are thinking this could be the first indication
of legalization. Maybe they're clear enough
these little things before they come out
with new new laws. But who knows? We'll have to see cannabis could be something
to watch though today because it had just a
major catalysts yesterday. We also have a lot going on
in oil and gas right now. Opec is cutting production and that is kinda
messing with everybody. So that is what it looks like with regards
to the economy. Now when it comes down to, let's just take a look at
this sectors here, sector. I think everything
is gonna be down. Everything is down
except for energy, which is to be expected. As you can see, energy
is skyrocketing over the last few days on the news of the oil or the opec cutback. So that is another catalyst. So as of right now we've
got kind of two catalysts that we're looking at
cannabis as well as energy. Let's just take a look at how the markets are doing
though real quick. We'll go to Yahoo
Finance and CNBC. Just give me a second
here to open this up. Yahoo Finance here,
okay, S&P futures. What the heck happened here? We just took a big
dip on everything. S&p futures down, dow Jones features down Nasdaq
futures down 1.68%. And southern just
happened and listed, just got some news
that came out or something because
we just plummeted. Oh, it was the news. So this is super important here. So like I just showed you, there's a bunch of reports
that are coming out literally just like 40 min ago. And here's the impact it had. It took the Nasdaq from a positive day down
to a negative day. It dropped it down by literally
200 points and a matter of minutes just because of a couple of economic
reports that came out. So you need to be
very well aware of this to be very
careful with this. And if these reports
come out during 930 or ten o'clock or 11 o'clock while we
are actually trading. You need to be very aware
of this because if it's a bad report is going
to crush the market. And if you have no
idea what's going on, you're going to be totally lost and you're going to
take a major hit. So you always need to
check the economic events. Here is a perfect example of why we need to check
those economic events. No one they're
happening and be ready for them in case
the report is bad. Okay, so that's what
the nasdaq looks like, pretty much. Everything
looks like that. Now, let's figure out why the report or why
everything, okay, US payroll grew by 263 k.
Unemployment rate falls to 3.5. Very, very interesting. Future sink as Job's keeping
dovish pivot bets at bay. So basically that jobs
report kinda St. the market, that's basically what
we're seeing here. Soft futures fell and bond yields climbed
after data showing a still solid US labor market through cold water
on expectations, the Federal Reserve would
soon moderate it's pace of rate hikes to prevent a more significant
economic slowdown. So basically this
report is showing that the US labor market is
still extremely solid, even in the face of
rising interest rates, which they are doing
to combat inflation. And because the US labor market is so tight and so
solid right now, companies cannot find
employees, therefore, they're having to
increase their wages, contribute to the
problem of inflation. And it means that interest
rates are probably going to continue to go higher until we see some easing of employment or we see some major
easing of inflation. So very, very interesting
dynamic here. It's almost like the report was a good thing because
unemployment is really low. But it also means that
we're probably going to continuously seeing more
and more rate hikes because of unemployment
being so low and because people need to hire
people at better wages. So very, very interesting dynamic that is happening
right now in the marketplace. Again, it pretty much
sunk everything now, when we go into trade here
and we actually look at. Our sectors, you can see that
is very clearly happening. Everything is down right now except for energy because
it has major catalyst. We look at our markets. Sqs queue is up by 4.6%, t qs is down by 4%. So very, very interesting day that we're going to have
ahead of us here. Okay, Now when it comes
to my game plan here, we had economic news that
affects the entire country and all of our indices are down and pretty much the
entire market is down. So what I'm thinking today is I'm probably going
to start with some ETFs. Then we're going to take
a look at cannabis, then we're going to
take a look at energy. Those are the three plays that I'm going to focus on today. One is ETFs to trade the
entire market because the entire market fell based on full market economic news. And then two is based off the cannabis catalysts that we had yesterday in
the United States. Thanks. Thanks to Joe Biden. And three is the catalyst
that we have for oil and gas because opec is cutting supplies that is
increasing or decreasing, the supply, demand is
staying the same, therefore, prices going up and these oil and gas energy
companies are doing well. So those are the three catalysts that I'm going to
focus on today. Personally, I think
the market is going to drop with the
news that we saw today. So that is going to be my
bias going into the market. We are also in a very
long-term bearish trend. So if you just look, the
Nasdaq 100's right here, we are very clearly
in a bearish trend, finding some support around $11,000 draining basically sideways for
the last three days. So what do we very interesting
to see what happens today? But as of right now, I'm kind of leaning
towards the bearish side. Okay. Now when we take a look
at the actual ETF itself, we're looking at S QQQ. This is an inverse
leveraged ETF, meaning that when the
nasdaq 100 jobs by 1%, this is gonna go up by 3%, which is really,
really nice for us. Currently you can see it's up by 4.63% in the pre-market session. So first thing I wanna
do is just draw out a couple of key levels of
support and resistance. First, you can see that we got rejected right here at $50. We came down to $40, broke back up above $50
all the way to $60, and then came down
and basically tested $51 for the last
couple of days here. So $50 here. Very interesting and
important key level for us. We have got highs
at $61 right here. We've got support
around $33 right here. And it looks like
we've got a bit of a trend line kind
of forming here. Something along those lines. So it'll be interesting to see what happens around $50 here. If we do test 50, that is probably going to be a key level of support that I want to either
treat it to bounce or trade the breakdown of. So let's start to zoom
into this a little bit. Let's go to the 15-minute chart and see what this
really looks like here. So here's that 50 dollar level. You can see that we
actually bounced off $51.03 times right here. So that is very,
very interesting. We're also breaking
out of yesterday's high or two days
ago high right now. So that again, is another
interesting factor, will draw a line across there. And let's just see if there's any other key levels that we really need to point out here. You could say that there's
maybe one right here. We will just draw a line
there so that we can be aware of it and we
can understand it. There. We got rejected
rate in here. We got bounced off
right in here, and we bounced off again
on October 3rd right here. So very, very interesting levels that we're at right now
with regards to S QQQ, we will zoom in a
little bit more again, multiple
timeframe analysis. We're starting with
the daily chart. We're going to the
15-minute chart, five-minute chart,
one-minute chart. We are working our way down. Very key principle
to this course. Make sure you remember that. So we'll go five-minute now. Take a look at what the
five-minute chart looks like. Okay, we've got some very
clear resistance at $56. It looks like we've got some
good support around 51. 52. We will see where that opens, not really telling
us a whole lot different information as
we zoom in right now. And then let's just go down to a one day one-minute
charts just to see what this really
looks like on the inside. So here is our after
hours trading, here is our pre-market trading. We've got some resistance rate around this level right here. We've got major
resistance at the top, trading in a bit of a channel here it looks like we could be falling through this
level at 55 here. We'll have to see what happens
before the market opens. We have about 10 min
till market opens. So we've got some key
levels here on S, QQQ, Q, we're not gonna do anything right at
the opening bell. We're gonna give this a
little bit of time to unfold and see
what happens here. Then we will make our trade
and we'll be patient with it. Now, let's just take a
look at energy real quick, see if there's any companies here that we are interested in. This is Canadian
natural resources. Very interesting,
not a whole lot of volume in the pre-market
session right now, actually. Yeah, not a whole lot. They're not a whole
lot going on. To take a look at some novice. Novice looks like it's seeing a little bit of action today. Yesterday, so anovas pretty
doing pretty well yesterday. We'll have to see how
that one kind of unfolds. One company I am
interested in right now is true if they were up
massively yesterday, I think 37, 38%. So we'll take a
look at these guys and see how they are doing. So yeah, look at that, look at that
movement right there on the news of Biden
stepping in and saying, Hey, we were going to
forgive some of this. So again, starting with
the big picture here, we're looking at
daily candlesticks. We're going to draw some levels of key support and resistance looks like we're
starting to approach our level of resistance
right there. We'll go to the one-minute or one month, 15
minute candlestick. Wow, look at that
right at the end of the day there that
thing just skyrocketed. Unfortunately, not
a whole lot of volume on this throughout the
day in order to day trade, that would be kind of
tricky on thinking. Let's zoom in a little bit
to the one-minute chart. I think this is gonna be Yeah. See like that is not
really something that you want to spend a whole
lot of time day trading. It's tough to do
analysis on this. It's gapping up so
much There's not a whole lot of
volume only trading. Frick, I mean, 100
shares of minute. If we're lucky not a whole lot, they're very low volume. Probably going to see
some big spreads here. And look at the gaps here
as the price is moving up, you'll get these
major gaps here. So you gotta be careful
with a company like this. This might be better
for swing trading. I didn't realize it was quite as low volume might be
better for swing trading. Let's take a look at Tilray. They are reporting
earnings today. So let's see how they are doing. Oh, wow, big day
yesterday again, for Biden's report and the change in stance
there, 2.8, almost $4. Wow, this one, this one
really skyrocketed. We'll see what pretty much
flat though before this. So we'll see how this opens. Let's just draw, let's draw
a couple of key levels here. So we can just
stay on top of it. We'll go to the 10-minute chart and we'll draw a couple of price lines here so that we're
all on the same page here. We know where these
key levels are, we know what to look for, and we can just keep
an eye on that in case we see an opportunity. Now, one thing I
always like to do is I am a huge fan of these
big tech companies. These are probably the number one place that I like to trade. Apple, Amazon, Google,
Shopify, Alibaba sometimes. But these are, these are,
this is kind of my home base. So I always like to just
take a look at these stocks, see if there's any opportunities that really stand out to me. See if there's any key levels that I want to be
watching and just make sure that I'm aware
of what is going on now, sometimes when you perform
technical analysis on a daily chart and then you zoom out to the six-month chart. You get all these lines here
and you got to just kinda remove them and clear
things out and organize, organize your chart's
a little bit better, so that's what we're gonna do. I'm gonna cancel these alerts, cancel some of these lines, and just clear out this
chart a little bit. And so as you can see, we were at 176, we dip down to 140. We've had a nice
little bounce to start the week yesterday, a bit of a red day, and we'll see how
today goes so far, we're trading down 2% in
the pre-market session, which is not great to see. We'll just zoom in here, see if there's anything
that stands out to us. Again, apple dropping on that report this
morning right at 08:30. You can see that red at
the bottom, 830 comes out. That report went,
everything crashes. Not a great start to the day. Not the way you like to
wake up in the morning. So we'll keep that in mind. I'm going to zoom out
a little bit from the one-minute candles to
the five-minute candle's. Just so we can get
a little bit more information on our charts here and really trying to
understand what is happening. Okay? So this is good, this is better. We've got Boom, Priceline
136 here, that is the low. We've got some support there. It looks like we've probably got some resistance
right here around this 147 level and now it kind of feels like we're trading and had been a no man's land. We will see what what, what kinda happens here. 14143 could be Q
levels of support, but as of right now, I don't have a whole lot of information going into Apple and going into the open
here in 5 min. So very interesting,
we're probably going to have to be
patient with apple. Let's take a look at Google or Google hovering out
$100. I like Google. I like Google at $100. This is a key level for us. We got rejected right here. We found it a little bit
of support over here. I like Google at $100. That is, that is a trade
that I am interested in. Is Google either breaking down below 100 or
bouncing off of 100. I'm gonna get rid of this
alert here, cancel alert. And I like Google, we're definitely going
to come back to Google. We will add that to our list. Either very simply for the breakout of these
highs right here, or the breakdown of $100. I am looking for either
of those options. We will set an alert here, create new alert entry. I want to know when
it drops below $100. Oh, sorry, it's on
the wrong screen. I'll just move this up real
quick days and see it. So I'm going to set a bid
price floor below or equal to $101 so that if the price drops, well, it's probably
going to open there, but at least we'll be ready. We'll watch this one closely. Now, let's see. Nothing is up in tech right now, which is kinda
disappointing meters down 1.7% and continues to move
lower after that report. Looks like it could have a key level of support
right here on 135. So we will take a
look at that one. We'll keep an eye on it. But for right now it
looks like Google. Google is one that I'm going
to be watching very closely. I like Google at that
100 dollar level. It is a key level
that usually Google is either bouncing off
over findings support on. So that is good news. It looks like this is a fairly key level
for Amazon as well. So we're going to keep an eye
on Amazon and Google today. We're going to take a look
at the cannabis space, focus on energy and
probably start our day off with the ETFs just to see how things go as QQQ is probably what we're
going to start our day with, but we will be patient. We're gonna, we're gonna
take it nice and easy and we will see what happens
as we get into the market. We have 3 min off to the market. So I'm going to go
use the washroom line and get ready to go when
you meet patient probably not taking too many traits for the first couple of
minutes in the market. And then hopefully we
can get into one here. And that's our
pre-game checklists. So basically went
through economic events. We went through
earnings, went through what the indices and what
the market is doing. We saw if there was any
major news we read through. Well, we didn't read
through the whole report, but we've got the
summary of the report and why the market is
reacting the way it is. And we took a look at a
couple of stocks that we think could be
opportunities for us today. We also looked at cannabis
as well as energy. So we've got a couple of
different options today. We've got a game plan. I'm gonna get my
screen ready to go on. We will use the washroom and we'll be ready to
go for market open.
63. SQQQ Trade: All right, everybody,
welcome back. It is a couple of minutes into trading right now it's
7 min into trading. And I'm looking at SQ cues here. And we have an interesting
setup forming. We have a double top
right here around $56. And it also goes back
to a little bit of resistance previously if
we zoom all the way out. So this 56 30 level
is pretty important. What I'm thinking is
the market's going to continue to sell
off on this report. So if the price goes above this, because it's s QQQ, which means it's an inverse ETF. The price goes up when
the nasdaq goes down. I want to get in on
the breakout here. And so we're going to
look to get in at 56.40. We're going to look to
take profits at 57.40, 57.40, and we're going to look to exit this trade
if it loses $0.50. So that puts us at 55.90. And now we've got a trade
that is ready to go. So I want to enter this when we break this double top here, I want to get out
of it if we lose $0.50 per share and I want to
try and make $1 per share. That gives me a risk to
reward ratio of two to one. And I'm going in the
direction of the market. The market is going down. So the inverse ETFs are going up above both of our
moving averages. And we've got some resistance that I think we're
going to break through. So for me, that is my game plan, that is my training plan. That is where I'm
going to get out, That's where I'm
looking to take profit. Let's enter this trade here. I'll give you, I'll show you
this confirmation window so that you can see
everything here. We'll click on
Send order and now you can see my
levels are in there. So we've got the entry
F5.6 40 on the breakout, the stop-loss at 55, 90, so at $0.50
difference there, then we are trying to take profit when each
share goes up by $1. So that is the setup we
are looking at right now. We will see how this plays out. We'll give it some time
here and see what happens. Now, what's nice
about this setup is that we're not in the trade yet. And so if this doesn't go my way or if we get rejected
at these levels, then it's no harm to me. I may have wasted a
little bit of time, but it's not going to
enter me into the trade. I'm not going to
lose any money and it's not going to
execute anything. So this kind of setup where I am patiently waiting
for the price to finish the setup before it gets to the breakout
of the breakdown. That is the best-case
scenario you can be in as a trader because you've
got patients on your side, you've got time to
set up your trade. You just need to wait
and let it develop without getting too
eager or excited. Now, as you can see, this trade as of right now it looks like it might
not even get filled, it might not even get triggered. We will see what happens. I'm going to leave this and
let it go for a little while. We'll see what direction
things move in. But we got to be
patient with it. We have our setup, we have identified
our opportunity here, we have a good risk
to reward ratio. We're still trading in the
direction of the market. So things are still
in our favor. We just need to be patient and if the changes
doesn't happen, that is totally fine. I'm okay with that. I'm comfortable with that. If the outrageous
doesn't work out and the opportunity
doesn't present itself, we have to be confident
enough in ourselves, patient enough with
our own control that we're not going
to get worked up. We're not going to get excited. It shouldn't even affect our
mental thinking right now, if this trade doesn't execute, we should just be looking for other opportunities
in the market. That's how you need to
think about day trading, is that one opportunity you
should be prepared for it. And if it doesn't
come to fruition, just move on to the next one. You were like a soldier just
moving on to the next one, trying to find the best
opportunity to trade. Alright, we're
seeing high volume on this move down and the Moon. Oh, there we go. So now our order is triggered.
We are moving higher. And now that is nice to see we are in the position
stop-loss at 5598, take profit at 57, 40, we're now at 56, 48. We're moving higher, which is nice to see this trade so far is working out well and kinda
going according to plan. So that is great. 56, 55, we're slowly moving higher and we are in the trade,
we're ready to go. We got the breakout. So now let's just see
if this continues. Alright, so we're
getting closer to our stop-loss or to our
take profit level here, I am considering moving
up our stop-loss to at least our entry point so we can at least lock in
what we came with. I don't wanna do it
too early though, but it does look like we've got some good
momentum, some good volume. We are definitely going in the market
direction right now, which is very nice to see
everything is selling off. The VIX is going
substantially higher, so we do have good market
confirmation right now. Now, we just have to be a
little bit patient here. All right. A little bit of a pull back right now, definitely healthy. We saw a breakout. We're seeing a little
bit of a pull back. Hopefully this is a retest
where it's going to retest this 563-05-0640 level. So that's why I haven't
moved up the stop-loss yet. Because if I moved it up to our original entry
point and we saw breakout and then a retest
or stop-loss, we get hit. And I don't want that yet
because I want to be able to allow a retest of the key level of support
before moving higher. Once we get that retest and we start to
move higher again, that's when I would incrementally
move up my stop-loss. Okay. So we're at the point now
where we're at 56.91. By $0.50 on a trade
that we risk $0.50 on. So we're pretty much where we've made as
much as we wrist, which is really, really good at, is nice to see now to protect my money and protect what
we have invested in here, I am going to move to stop loss up to the previous level here, it was 55.33, pretty
much where we bought in. As you can see, we've
got the confirmation or two here I'm
going to click on Send order and now it has
moved our stop-loss up. So now I have the opportunity of making $1 for a risk of $0.07. That is my new risk
reward ratio is that if my take profit
gets hit at $57.40, the maximum I could
possibly lose on this trade at this
point, It's only $0.07. And so that is how the risk
to reward ratio changes with a trade as you are in the trade and as it
evolves over time, this trade clearly is
going in our direction, it's going in our favor and it's doing exactly what we want. So that is very,
very nice to see, but now I have a
risk of only $0.07. We're actually going
to move this up again so I can lock in. Now, I'm guaranteed to make
at least $0.05 per share, which is really, really nice. Obviously, you still have
to deal with commissions. But at least now we have
locked in a profitable trade. It looks like as long
as this continues, we're going to hit
our take profit here. And it's gonna be a
nice, beautiful trade, which is absolutely fantastic. And now I have locked in
at my initial investment, I've locked in everything
that was in here. I don't want to give that back. So now I'm slowly
going to move this up. And I might even convert this to a trailing stop-loss so that if this continues to break out, we can continue to
take advantage of it. Okay, we're starting to
see some green candles and our indices and possibly a
little bit of a pull back. So I just want to tighten up this stop-loss
just a little bit. 56.80. We will click on cell, we'll send that order
and we're going to move. Our stop-loss might
get hit here and that would be totally fine
if it does get hit. Because at this point
we've already locked in $0.40 worth of profit, which is very nice to see, and we still have
our upside here. So hopefully this continues to bounce and we get all the way up to our take profit level. But regardless, it is
a profitable trade. We've already locked
in the same amount of money that we received
on the traits. We have a minimum one-to-one
risk reward ratio. We are profitable on the trade. Overall, this is
already a good trade. Hopefully it just
continues to get better. Now, on the other
side here though, I'm just going to get my
stop-loss order already. So we're going to take
off bracket order. We're going to go
to trailing stop. Sorry, that's what I meant
to say was a trailing stop. We're looking for a percentage of 5% and we're going
to leave it at that. So now, if I feel
confident in this, I can exit both of these orders. I can cancel both
of these orders. I can place my new
trailing stop-loss. And as soon as this
price corrects by 5% will be out of the trade, we'll make our money and
we will be set to go. I usually like to use trailing stop losses on breakouts
because they take profit point usually isn't based on a key level of
support or resistance. It's usually based
off a factor of your stop-loss and your
risk to reward ratio. So in those scenarios, I find that the
trailing stop-loss is a great method and
a great way to exit your trade and lock
in profits while allowing the price to go
higher on the breakout. These are the scenarios
where I really like to use the
trailing stop-loss, but I usually enter the position with the bracket
order so that I can clearly define my risk and reward and might
take profit levels. Okay, I'm going to
change this from a percentage amount on
my trailing stop to a dollar amount and we're
going to keep it at $0.15. That is going to be
the maximum amount that I'd be willing
to lose on this. As you can see,
we're getting very close to our take profit level, which is great to see. It gets hit surprisingly,
that's totally fine. It just locks in our trade, which is absolutely fantastic. And if not, we're going to put this
trailing stop-loss on it. I'm not even time this, I'll leave it at
maintain it up to $0.12. 0.1 to 0.12. There we go. Okay. Now, generally stop-loss, boom, $0.12 a day auto. That looks good. Our indices continue to sell off. I'll just show you what
they look like right now. This is the v6 chart. The VIX is continuing
to move higher even breaking out past
that previous high, which is a great sign. This means that there is fear in the market and
people are worried, which means they're going
to sell their shares, which means the inverse ETF that we're trading is likely
going to go up in price, which is absolutely
fantastic and great to see now this inverse ETF is
based off the nasdaq 100. This is the nasdaq
Composite which has all the same
companies in it and it is clearly going in
the various direction. Let's just see if we can pull
up the actual Nasdaq 100's. Here it is right here and
the x-dot IN is the index. And as you can see, it
continues to trade lower. So we're going in the
direction of the market, which is exactly what I've
been talking about for a very long time and
things are looking great. We're at 372-05-0735. Okay. I'm going to exit both
of these orders right now. We're going to place our
trailing stop-loss in air. Exit both of those, exit both of those. We're going to click on cell
using a trailing stop-loss. Boom, we got to give
this a confirmation. We got to give this a
confirmation as well. We're going to sell it at $0.12. And there we go. We have exited our
original trade. We have entered in a
trailing stop-loss. On S QQQ. We're at 57, 38, so we're $0.02 away from
our original profit target. We have converted that
profit target into a trailing stop-loss so that if the price continues to run, we can continue to keep
that trailing stop-loss on there and let it just continue to rack
up profits for us. So we're at 57, 40, we just hit our original
take profit level, which is absolutely fantastic. We could have just exited the trade and called
it a beautiful trade, but we're gonna go for
just a little bit more. Remember, you don't want
to get greedy here, but you do want to try and make just a little bit more money. So we're at currently a
$0.12 difference right here. I'm going to tighten this
up to $0.08 just so that we can make sure that we're getting the most money
out of this as possible. We're going to edit that. Click on confirm here. It's going to tighten that
up just a little bit. We're at 57, 41 on
the actual trait, which is pretty good.
That was too high. So so far, so good. Markets continue to sell off. We're still seeing
red on most of our indices here and
it is going higher. Okay? We just got out of our order. We sold 20 shares of S QQQ. It looks like it came back down. And that was a beautiful tray. That was good. We made what did
we get in here for 56 40 we got out at 573-05-0740. So we made a nice, beautiful two-to-one risk to reward
ratio on this trade. Obviously, the
trailing stop-loss didn't work out quite
the way we wanted to. We could have just
locked in at 57, 40, but overall, we still
did extremely well. And if that stock
did continue to run, we would've made
even more money. So that is part of the game, that is how the atrium goes. It is eight o'clock
in the morning, so it would be an ad or
computer for only 30 min. We had a nice,
beautiful two-to-one risk to reward ratio trade. And so far so good. Now the price is pulling back. So we probably did get
out at a good level, which is actually we definitely
got out at a good level because now dropped
down a 57 15 there. We did extremely
well on this trade. I'm very happy that is a
good way to start the day. And if you can just
find a couple of those and then start to scale
up the dollar amount. That is literally
the key to this. That is everything that
we are trying to do is identify setup
before it happens, let that setup play out, try and make as much money and manage that trade
throughout that setup. And do that several times a day. That's, that's the golden goose. That's what we're
trying to do here. And hopefully you learn
something out of this video. Thank you guys so much
for watching to the end. And I got to go find a couple of more traits
will see you later.
64. AAPL Trade: All right, everybody,
welcome back. It is 929. The market opens
in thirty-seconds. Pacific time, not Calgary time, but we're about to
get underway here. It looks like Apple. Apple had a major run-up to 148. It's seeing a little bit
of a pullback right now. I am interested on
the breakout of this stock at 01:48 mark. It opens in 15 s, so we're gonna see
what happens here. 148.5. I want to get in
for 50 shares. 148.5. We're going to set a
stop-loss at 01:47. 0.5. Boom market, just open
market is just open. Stop-loss. Boom. 47.5 and our take profit
is going to be 14925. And let's see what
happens with that. Here. It looks like this is
probably going to go through and away and
our order just filled. Apple is pumping
higher right now. Good thing we're ready to
go when the market opened. Let's see if we end up in our
profit target right away. That would be very, very nice. We would make some, make a nice little oh, we're moving up,
we're moving up. Again. I'm going to move this
higher just a little bit. Oh, we just got hit. There we go. There's our
trade just like that. Boom, that's a good
way to start the day. We are in it, we're out of it. We made a quick oh, cancel that. We're in it. We're out of it. Oh. What just happened? Oh, no question. Just quit on me. Oh, come on. Come on, man. That is not what I wanted. What just happened there? Were canceled order canceled. I'm checking it on my
phone right now or to executed sell Apple
at 01:49, 50. So that was great. Boom. You just made a quick 50 bucks on
like 25 dollar risks. So that was phenomenal. Now we just gotta get back
in to illustrate here. I don't know why. Wait on me like that. That's the first time
I've ever seen that. Maybe we had too much
stuff going on there. Maybe we had too many
charts open, I don't know. Okay. Let's see if we
can get back here. The order definitely executed and we were able to get
out of it, which is great. Our first trade worked out
in less than a minute, so that's absolutely perfect, but I don't know why
exited on us like that. Very kinda frustrating. Let's go to Apple, right? Well, it was good trade prices. Price dropped down
to 14950 there, so we could have made it a little bit more
money on that one, but at least we
started off good. We're up $41 to
start the day after commissions in
less than a minute and we'll only risk $25 there. So a nice little two-to-one
risk to reward ratio, or I guess, what
did we risk there? I don't even know
that happens so fast. We might arrest the same
amount of might've been in one-to-one trade. 14750. I think we got in it. Yeah, I think it was
a one-to-one trade. Like not the best
risk to reward ratio, but when in our favor right
away we got exactly what we wanted and we made
a nice little trade to start the day,
so that was good. We saw the run-up in Apple
as it was breaking out that basically just continued
into the market open there. And very nice to see. Now, let's see what else
we've got going on. Shuffle off. They reset all my charts
when it closed like that. So now I got to
change everything up. God, That's annoying. I
don't know why I did that. Okay. Robin Hood moving
up higher this morning. That's nice. Amazon. Amazon actually
moving up higher to, Let's take a look at this xBtB. See now Apple's
trading sideways. So that was a good
trade. We got in and out at a good level there. That's that's
totally fine. Yeah. See everything on my
charts is messed up now this is frustrating. S&p 500 is R4 and
higher this morning, the VIX is crashing down, which is exactly want to see the Dow Jones is also roaring
higher, almost gapping up. Look at this chart. This is, oh my gosh,
in the Nasdaq, nasdaq is on fire
right now, leave this, leave this chart, that's the Dow Jones Industrial Average. That's how we're
starting the day. That is very nice to see. I need to get back into a
couple of these companies. Let's see what's
going on with Apple, like nasdaq is still just
motor and motor end up. Okay, we're gonna go with 50. Boom bracket orders. Stop. 150.50 is where I
want to get into it. My stop loss. I want to get out one-fifth. And our take profit is
going to be one-fifth. One-fifth. We'll see if Apple
maintains this momentum. I'd be surprised if we
didn't see a pullback, but as of right now the nasdaq, the S&P 500 in the
Dow Jones have all done extremely well in the first 5 min of the
market session here we've got Google that is crashing right now if
you look at Google, skyrocketed up, came
all the way back down. It got rejected at the
pre-market highs right here. Very, very interesting to see
how that kind of unfolded. Apple still doing okay. Amazon saw a nice
little skyrocket up and they have completely leveled
off in the last 4 min. Robin Hood seems to still
be doing okay here, like not terrible from Robin
Hood to start the day. Nice little pop that they've
got going there right now. We will see if this holds up. It looks like it looks
like it's going to though. Okay, we're going
to place this order for Apple. There we go. We're in at 01:50. Were out at 01:51. 50. Okay. We're in it. There we go. Let's see how this goes. We've got a $0.50
downside on it. We've got a $1 upside on it. So we're at a two-to-one risk
to reward ratio right now. And we'll give Apple a
little bit of time here in the Nasdaq and the Dow Jones is still in
positive territory. It feels like
they're doing well. And Apple continues
to move higher here, so this is good to see. So if you look at these charts, looking at the apple chart, and then looking at
the nasdaq chart. We should be able to use
these to try and understand what direction is
this stock going and when is it going
to turn around? So we're at 01:51, 18, which is absolutely great. We're actually kind of close to our take profit level here. I'll leave I'll leave
this chart here. Okay. I don't I don't have enough room to leave it there to
be honest with you. Okay. This is continuing to run. We're going to move our stop-loss up to our
break even point here, just to kind of protect
our downside risks here. Let's change this up here. 150.50. So I'm going to move that up. Boom, just like that. So now we have
protected our downside, we've protected our risk. And if the stock
comes back down, we will basically just breakeven and pay for our commissions. But so far, we're seeing
seeing all of the right signs. Alright, that is not the
sign that I wanted to see. I did not want to
see a big red candle with a tall, long Wick. That is not what any day
trader wants to see. So we want to see this continuing to move higher
with strong green candles. It looks like we
could be running into a little bit of resistance here. So we will give this yes. See now, look at this, look at how closely these line up now or nasdaq is
starting to turn around here we're
seeing a little bit of a slowdown in the Apple stock. This is where, this is where being a trader comes in
and you have to decide, are you going to take the profits that
you have right now? Or are you going to
let this ride out just a little bit longer for us? Oh, there we go. We just got hit again. There we go. That's to trade so far on Apple, both of them have
been profitable. We are up another $50 on that
trade, risking about $25. And that is how you do it. That is two traits that are both successful to start the day. And as a day trader, this is the best thing you can get into as a couple
of small trades that are going your way that you can build momentum on
and that you can feel confident and good about going into
the market width. You set your risk reward ratios, you set your bracket orders
and you let them play out. And then when you're
in the trade, you manage that
trade accordingly based on what you are
seeing in the markets. This is how you day trade. This is how you make
money consistently. And you'll look at this. I'm trading with
a small account. I'm training with an
account that's like $4,000 Canadian right now. I'm making small trades, but just so far in the
first 9 min of the market, we've made $85 on Apple stock. You can see that right there. And that is after Commission. So that is after we pay for
all the fees and everything, we just made $85 USD in 9 min. So realistically that's like
100 or $105 Canadian for me. And this is, this is
where you wanna be as a day trader is just slowly picking off
small little trades. See the stock is running higher here. It
doesn't bother me. We're here to try
and pick off small, consistent traits that
are going to give us the best opportunity to make
money on a consistent basis. That's what we're
trying to do as day traders were not trying to go out there and be very
blunt and hit a home run, it's going to make us $100,000. That's not the strategy here. The strategy here identify what direction the
stock is going in. Why does it have a catalyst? What direction is
the market going in? Place, a responsible
trade based on technical analysis and
then manage that trade. Alright, and as you can see, Apple continues to run here. Then nasdaq also
continues to push higher. We had that little
stop right here, which is where we were
considering taking profits. We didn't take profits and
it's continuing to run. So there could be even a third trade in this
Apple stock right now, I'm going to be a
little bit patient here and kind of see
where things end up. I don't want to get
too confident and start overtraining
and get too excited. We've already made two traits. Do they usually I'm making
somewhere 1-4 trades per day. So I'm gonna be a little
bit patient here. I'm going to give it some time and we're going to see what is the next trade that
presents itself to our, Our, to our hands here, to our opportunity and to
our personal training floor. Because so far this has
been quite exciting. Apple starting to slow
down a little bit. Wow, look at Amazon Louis, this chart right here. Look at this. It opens up at 97, runs to 100, comes right back down to the opening price and
ribs right back up. See, today's gonna
be a good day. Today. They're going to be some opportunities
for us to trade. And this is going to be looking
at this, even Robin Hood. Robin Hood is on fire right now. Any of these stocks, any of these stocks right now have opportunities
with them. It just comes down to, are you thinking
with a clear head? Do you understand
what's happening in the market and do you have the calmness to execute an
appropriate and proper tray? That's the idea here and that's all you need
to think about. So I'm going to sit around
for a little while longer. This video's already
been 12 min long, so we're going to stop it here. I'm going to let this
sit with you and we'll go from there and
we'll see you guys in the next video,
talk to you soon.
65. META Pre Market: Good morning, everybody. It is January 31st is
07:17 A.M. so again, started a little bit late, but welcome to another
morning recording. Today is a big day and a big week with
regards to the market, we have an earnings weeks or in the middle of
an earnings week, which means a large number of companies are reporting earnings this week including Apple, Amazon, Microsoft just reported. We had a couple of other big companies today
that we're going to look at. So this isn't earnings week. We also have the
Federal Reserve in the United States meeting
this week to decide on interest rates and that news is going to be
coming out tomorrow, going to be also a very
important day tomorrow. And we've got a couple of other geopolitical things
happening around the world. So let's just kinda dive into
it and see where we're at. As you can see on Yahoo Finance, the future have just
turned positive, which is a really
nice sign yesterday, it was a very strong
red day for the market. Not a great end to
January, but that's okay. With regards to earnings, We've got a couple
of things happening this week or today, sorry, we've got UPS
reporting earnings today. General Motors, ExxonMobil, Pfizer, McDonald's,
Spotify, caterpillar, marathon, Phillips 66, UBS, and a bunch of other companies. So lots of earnings
today we can basically use this list as a catalyst
for different stocks. One that we already saw
an article on McDonald's, they actually reported
this morning. And it looks like
they beat earnings. So that is really, really nice. Boosted by higher menu
prices and digital sales. So this could be a catalyst
for us to look into. This is really nice to see in McDonald's might have
to be on our list today. So that is one
thing to look into. Like I said, we've got a lot of earnings
happened in this week. We also have some
economic news coming out. So like I said, today, not really a massive day, but later this week
at 02:30 tomorrow federal Chair Jerome
Powell news conference. That's probably what
we're going to learn about the new
federal funds rate. So that is going to be
very, very interesting. That's going to happen
tomorrow afternoon. We don't really have to
worry about that today. We do have some news coming
out though at 10:00 A.M. consumer confidence index as
well as rental vacancy rate. So we want to keep that in mind because at 10:00 A.M. we could see like it could
change the market. It could have a small impact
on the market realistically, I don't think it's going to have a major impact because we have such big news coming out tomorrow with regards to
this federal funds rate. But it is something to
keep an eye on and to be prepared for around
that 10:00 A.M. Mark. Now, last couple of things that I just want
to take a look at, Bitcoin continues to hover
around this 23,000 mark. I've been trading
in and out of some of these Bitcoin miners lately, and I've done pretty well
here to start the year, but it is starting to
consolidate right now, so something to
keep in mind there. And CNBC, let's just take
a quick look through here. Spotify shares pop
after earning, showing strong user's growth. I feel like today might
be an earnings day. So we might just focus on the company's
earnings and maybe, maybe an index for today, but we will see how things go. So McDonald's and Spotify are two that I definitely
want to check out. Ups revenue falls
short of expectations despite growth in
the US business. Interesting, UPS,
Spotify, McDonald's, we've got a couple of year that we were going to
want to check out. Norway's gigantic
sovereign wealth fund loses a record $164 billion. Setting very unusual year
that is pretty wild. That has been the rock and foundation of Norway
for a very long time. So to see that lose
that much money is a little bit concerning. Dani rises out, rides out, storm as investors rally behind $2.5 billion sheriff sale. So this one is
really interesting. I Dani is an Indian
based conglomerate that has lots of
different companies. And just recently
a short seller, which is a basically a group
of people in an office that bet against these
companies and then release reports about how
bad the companies are. That's what a short seller does. A short seller just released a report about the Dani group and the shares tanked because people read the
report and they said, oh, maybe there's some
good points in here. Maybe this company is lying or defrauding investors are just isn't as good as
they say they are. And so the shares really tanked. So to see them turn around and then go to
the market and sell $2.5 billion for the shares
is actually pretty wild here. So this is definitely something that we may have to
look into hairless. I'm wondering if he
hasn't. He traded in the US donee enterprises. Okay. So here we go. And
then right there you can see that big massive
drop right there. That's when the report came out. Over the last month. They're down by 23%. The ticker symbol is a Dani entertainment or
Dani and ADA, an EMT. Let's see if I can pull
it up on question. It doesn't even look
like I can get it. So they must not trade. In Canada. Yeah, they're
headquartered in India. Really, really
interesting scenario. I don't know if I'm
going to trade this one, I guess because I just don't have an expertise on
the company at all. I don't have an
understanding of the market. I don't even know if I
can trade those stocks. So this might be
one of those things that I just kinda let pass by. Okay, we got 6 min
till the market opens. Let's take a look at what
these stocks look like. See if we can find some Q levels that we want to
watch out for here, what the heck is there we go. Mcdonald's, okay, boom. Kinda weird trading action
here on, on the 24th. Don't really know
what happened there. Stock right now though, let's go to five day, Let's go to ten minute. Let's bring out the
pre-market and post-market. And let's see what
this looks like. So, okay, very interesting. Pre-market for McDonald's has been extremely volatile and it looks like we are
starting to come back up, but nothing major there will
zoom in just a little bit. Five days, five-minute Spotify. Spotify's the constraint. Little bit of
consolidation here, going into the open new we watch for a
breakout on that one, but nice, nice pop
on Spotify and UPS we were taking a look at
possibly going short on UPS. Wow, super volatile
for UPS here. Very interesting. We've got some resistance there. We got maybe a bit
of support at 176. We'll see what happens
at these levels. But as of right now, UPS is kinda trading
right in the middle. Now, the VIX in the
pre-market right now is up. We've got five-minutes still. The market opens some
fixed right now. Pre-market is up. It has been on a bit
of a bearish trend as the market rallied for a
strong entity January, but yesterday
yesterday was a bit of a rough day and now
it is up to QQQ, also up just slightly, not by a whole lot, but just slightly
we're up on today. Bullish trend over
the long term, maybe bouncing off support here. Let's see what this looks like. Yeah, could be a little bit of a balance
off support here. You could even probably
extend this out. Interest in the TQ looks like
nasdaq over the long term, we're basically at this
resistance of a rate here around 11,500 when we zoom into it. Yeah, like we broke
through it yesterday. We came back or broke
through it two days ago, came back down
below it yesterday. And now. It's going to be interesting
to see where we open up. Let's just take a look. Tiki queues, SQS, queue, where is oh my goodness. There it is. Okay. As QQ. So this is the short
leveraged ETF of the nasdaq. This is the long leveraged
ETF of the Nasdaq. And yeah, like it
does kinda look like where we could be
bouncing off this trend. So if we break out, if we end up breaking out
above this here, I like it. If we break above $22.20, I like riding the Nasdaq off of this bounce here
using this leveraged ETF. But we will see what happens. Well, UPS T breaking
out in pre-market here. Now I'm just going
through my watch list, see if there's anything that
really kinda catches my eye. Metta. Metta is being rally and hard
lately I like metal lately. Various trend over these last over these
last few days here, but I need that rally. That's pretty good. We'll have to see what kinda happens here. We could see a
breakout on Facebook. Facebook would be one to
watch here, omega, sorry. Softwares. Schrodinger
is popping off today. Interesting. Snowflake, another
company I like, even over the longer term here, snowflake is really
breaking out right now, but okay, that's it.
That's it for the market. We've got a couple
of things to watch. Your market opens in 40 s here we will see you
for the live trading.
66. Meta Trade: All right, everybody,
welcome back. Mark, you just opened
literally 1 s ago and things are up and running. Okay. I'm going to change
my screen around just so that we can get a little better feel for
everything. Here we go. Okay. Start doing not too bad here. Where did it go? Meta matters running seat. That is running hard. I like metta. I like
metal right now. I agree in to see a really
strong day for Meta. S&p 500 is strong, start the day nasdaq is
strong and start today. Tau Jones's read
to start the day. Very interesting. Ups t is just at 10%. I think I want to put an
order in on Medicare. I really like it. We're gonna go with 20 shares
with a stop at 01:48, 0.8. Want to put bracket order and
I actually want this to be a trailing stop by $0.50. Okay, boom, and just
like that, we are hit. So we're already into Facebook. We got 20 shares of Facebook
and we move in higher. I got a trailing stop
loss on this for $0.50 is where we
are currently at. And I'm buying in on basically, we saw a run-up going
into pre-market. I liked the long-term pattern
on Facebook and we have broke out of major resistance that we established yesterday. We're also kinda
breaking through this short-term bearish trend here it looks like that trend is ending and already are
stop-loss is moving higher. So that is really,
really nice to see. Facebook is taken off. And so far this is a good
start to training day. The VIX mixes up three
quarters of a percent. It's not terrible. The Dow Jones is actually
come in way back down. Not great for our trade. Spy, spy is moving higher and nasdaq is still
rolling higher, which is great for our trade. Prices moving up right
here on our stop-loss and things are doing okay here. Hopefully this doesn't come down and get us out right away. But she goes here. That composite pretty
good start to the day, continuing to rally right now, I expect to see this come through in the Facebook
chart as well. There we go. See you
in a little bit of a pop here. Very good sign. See what's, I'm trying to point this out
to you so that you can see the correlation between
these charts to nasdaq. And a lot of technology
stocks move very similarly. So what we're trying to do
here is watch the Nasdaq and keep an eye on the
nasdaq Composite so that if we see a dramatic
turnaround here, we can probably expect that in the big name text doc
that we're trading, maybe you can get ahead
of that turnaround and exit your position early
for higher profits. Or you can use it
as an entry point on the other side of that trade. If you start to see
the nasdaq rally before your big
stock does, well, that could be a sign that
maybe it's time to get an entry into that stock if the technical
is also line up. Broom and again, we
continue to move higher. This is good news so far. We've locked in one or 2%. So far. 14988. This is going well. Our average price on
this trade was 148.85. That's our average price
into it right now. And our stop-loss is
currently at 01:49, 0.38. So we've already
locked in profits, which is absolutely fantastic. And we're only using a very
small amount of money, like two or three grand here, our current position right
now is valued at $3,000. So we're using a
very small amount of money to make this trade right
now, which is excellent. So I'm just taking
a look at our level two right now to try
and see if there's any major or large orders that there could be
holding things up, we're pushing things
higher or lower. Then I'm also keeping an eye mostly on the color
of this screen here. When, when it's green, it means that people are
driving the price up. When it's red, it means people
are driving the price down because they're
placing their orders at the bid or the ask. Okay, our XR, our
trade just got filled. We made was at 11
or $12 on that one. Not too bad for a really
small trade like that. We made less than
a percent or so, but it covers the commissions. We make a little bit of
money to start the day. And for a small account, if you can just keep building those up and repeating that, that is the ultimate
strategy here. That is the way to win when
it comes to day trading, even if it's just $10,
$20.30 dollar wins. If you can repeat that a
couple of times every day, all of a sudden, that account
starts to doubled really, really quickly and
then they're not 1,020.30 dollar wins there, 2050, 80 dollar
wins consistently. And all of a sudden
you've got two or $300 a day and that's
a full-time job. It's very, very easy to
get to that point once you can master these
small little trades and these small little wins. Because to get to that point, it's the exact same methodology. It's the exact same. Everything that you do. The only difference is that you're treating
with more money, but you can't do
that unless you can actually make money with
a small amount of money. And you can make these
10203040 dollar, small little wins with
very little downside, so that you can just slowly
build up your account and start stacking wins and start growing that average
position size. That's the key to
scaling this up, turning it into a full-time job and then starting to
make lots of money.
67. SHOP Pre Market Gameplan: All right, everybody,
welcome back to another video and it's currently 07:04 A.M. on October 27th. And we're gonna go through our
pre-market game plan here. This one is a big one. It's a big week right now
because it is earnings week. So we've got a lot of companies that are reporting earnings. A lot of big companies that
are reporting earnings. Hopefully it's going
to give us a couple of catalysts that we
can trade off of. Now, just to give you
an idea of what I mean, here is a photo from
earnings whispers. This is a website
I like to use for earnings and this
kinda gives you a visual representation of all the companies
that are reporting their earnings this weekend
when they're reporting. So you can see Monday,
Tuesday, Wednesday, Thursday, Friday, and you can
see whether it's before the open or
after the close. Today is Thursday,
which means yesterday, Facebook or Meta reported their
earnings after the close. We also add Ford
and Teladoc report their earnings and we
have shopped for Amazon, caterpillar and MasterCard, all reporting their
earnings pretty much right now or in the next few minutes here
before the market opens. So this is very, very exciting. We got a lot of reasons
to be training. We got a lot of catalysts
coming out and now we need to dive in to try and figure out where's the best
opportunity for us. So now before we do that
and we really dive in here, Let's just get an idea of
where the markets are at. You can see the S&P
500 has fallen from 4,800 all the way
down to a low of 34, 91, about 3,500
here, which is very, very close to the
pre-pandemic highs that we saw at 3,400. So we basically
came down to 3,500, are pre-pandemic
highs was 3,400. So we're sitting at a pretty crucial level of
support right here. I've got a resistance
line drawn. When we break through
that resistance line, that would be a first very, very solid indication
of a trend change. We're starting to
get close to there, but we've still
got a ways to go. When it comes to the
Dow Jones Industrial, it's a similar story. We did test the pre-pandemic
highs prior to COVID, which is really, really nice. We're starting to
bounce off of that. Again. We've got a couple of levels that we need to break through before we can say that they
should bearish trend is over, but it has been a pretty
nice rally we recently. And when we look at the Nasdaq, it's a slightly different story. It's being hit a little
bit harder here. That's the, sorry,
that's the nasdaq 100. This is the nasdaq. The Nasdaq has not seen as the large of a rally over
the last little while. And it has also come down very, very low at, has pretty much touched the pre-pandemic lows. And it is down from 16,200
all the way down to 10,000. So it has lost a significant
amount of value at a stern to climb back up
off of the sport level. But again, we've got a
major earnings week. It did kinda take the market
down a little bit yesterday. So we've got a lot of
different things going on. Now, when it comes to what is happening in the
rest of the marketplace, I usually like to go to
CNBC and Yahoo Finance just to see a quick glimpse of
what is going on here, we can see the Dow futures, S&P futures, nasdaq, the Dow
Jones and the S&P futures. It looks like they're going up. The Nasdaq futures looks
like it's going down. This is basically a
predictor of what's about to happen for these
individual markets. We can see here US
GDP accelerated at 2.6% pace in Q3 better than expected as
growth turns positive. That is very nice to see.
That is actually great. The Dow Jones just
turned positive on that news, which is fantastic. And now we've got a couple of articles here
that we can kind of read through and see if
anything catches our eye. Okay, so right here
at McDonald's, earnings beat as customers
return despite higher prices. So this is really good. Remember, McDonald's
reported this morning, and now we've got a
beef little article here telling us what happens. So worldwide, the company is
same store sales climb 9.5%, beating street account
estimates of 5.8% growth. That is really nice to see. That's doing pretty good. Third quarter
earnings and revenue. That's good. What McDonald's
top Wall Street's estimates for third quarter
earnings and revenue. So they beat expectations
from analysts. That means that the stock
is likely going to do well, at least in pre-market
and after hours. So this is definitely
something that we want to put on our watch list. Shares of the company rose about 2% in pre-market trading. We'll take a look at
that very shortly. Earnings per share, 2.68
versus 2.58 expected. So this is the
number that analysts expected and this is the
real number that came out. Again, it was better than the expectations in
both scenarios here, which is very, very
nice to come in. He reported third-quarter
net income of 1.98 billion or 2.68 per share, down from 2.15 billion or 2.86 per share earlier in the year. So a year earlier. So not great, still down a little bit
from a year earlier, but the company is doing well
and they beat expectations, which is absolutely
great to see. Also we add Facebook, coming out with earnings. Let's see what is
happening with Facebook. I guess this is meta. Now, there we go. Metta platforms. Oh no, they are taken a big hit. Oh my God, they're down 23%. Holy cow. That is massive. This is gonna give us something
to trade for sure today. And that is not very good. Oh my God, at lunch, 20% on downgrades and
it missed earnings. I told you, I told you if Facebook is not the place to be putting your
money right now, nobody listened to me on
YouTube, but that's okay. Oh my God, that is a big move. So this is something we're going to definitely have to check out. We've got. Mcdonald's, we've got Facebook, I believe Shopify, I said
also reported earnings. Let's take a look at
how they're doing. Shopify up 6.85%. That is pretty good. They are doing extremely
well on earnings. Let's see what happened there. I wonder if we can find
any just quick articles. Shopify up after strong Q3
results, that is nice to see. Shopify has just beat down for the last six months.
I'm glad to see. So company announced revenues of 1.4 billion in the
third quarter of 22%. What is going on with these ads? No, I don't want any of this. No, no, no. Man. See, sometimes when
you click on these ads, they're gonna make you try and buy stuff and it's just awful. Coming in ahead of
consensus estimates by $30 million,
that is very good. Adjusted net loss
came in at $0.02 versus $0.08 per share in
the same period last year. So that is improving as well. And gross merchandise value
increased 11% year over year. So very good metrics from Shopify that is
very nice to see. So we've got Shopify,
McDonald's, and Facebook. There are three stocks we're
going to want to trade. We also know that Apple and Amazon are going to be reporting after the close today. So that could be an
opportunity for us as well. We also have MasterCard and mercury as well as a
couple of other companies. But I'm not going to jump into every single one we
want to focus on a few. And for us I think it's going to be Shopify, Microsoft, Facebook. And then if we can't
find much there, we're going to dive
into Apple and Amazon, but for now, that
seems pretty good. We also have Microsoft and
alphabet report on Tuesday. I don't think that those
reports went very good. Alphabet dropped by about 6%. Microsoft dropped by four or 5%. They didn't do great yesterday. So we'll see how things go. We also have a lot of action happening in
the Chinese market. So Alibaba and Tencent
are two other companies that are seeing a lot
of catalysts right now and could have
an opportunity. So that is where we're at with regards to
those companies. Now let's take a look at the individual stock charts starting with Meta and oh my God, too down 23% right
now let's zoom in here to the five-day
chart and wow, yeah, that looks, that
looks pretty rough. We'll go 51 month
ten minute chart. So here's what it looks like
over the last little while. And it dropped from $130 yesterday down to
$101 right now. And that looks
really, really bad. It is not looking good for Facebook stock
at all of that is a really bad day
in a bad year for Mark Zuckerberg because
this stock Oh my God, this talk was like two or
$300 little while ago. Just looking at this
$384 down to a $100, right now in
aftermarket trading, it is down by over 75%. And this is one of the largest technology stocks out there. So this is, these are pretty big moves
here that you need to be prepared for if you plan to invest into any of these
companies long-term, because I don t think many
people saw this one coming. Now, here's what the stock
chart looks like right now. We're going to zoom
into this a little bit to the one day one-minute chart, as you can see here. Like that report came out and the stock just immediately
trashed and it's been trading almost sideways for the last little while here. So what I'm gonna be
looking at here is we've got one level
of support at $98.66. I think that level is probably going to break down on the
news that we're seeing today. Well, I mean, maybe it gets
a massive recovery here, but I'd be surprised if
we break down below 98, 66, that could be a good shorting opportunity
for when the market opens. That's probably what I'm going to be keeping
an eye on here. Or if it breaks above this 100 and let's call it
one-on-one level right here, then maybe you can
run it up to 10 for that is a possibility
and an opportunity. But we'll have to see what
happens here personally, I feel like this might go short and it's still
coming down here. So we'll see if it finds
any support at $98. I am going to set an alert here just above activated Priceline. I'm going to send an
alert, create new just above this support level so that it lets me know when that price
comes down to that level. So I want to know when it
gets equal to or below 98.80. We'll call it 98.809, 8480. And we will click on activate. That should give me a
little alert there. And when the price
crosses below that, we will get an alert now. So that is what
Facebook looks like. Let's just take a quick look
at what Shopify looks like. Who own. I got to go to the US
version of Shopify. There we go. Okay. Shopify looking pretty
good right now. Actually like very clearly, we've got a high level
right here at 31, 50. We've got maybe some support
right there around 29, 35. Key level around here at $30. Yeah, it looks like
right here is also. Pretty key, 28, 60, we found some good
support there. I'm going to back this out
to one 10-minute candle's, just so that we can move this back just a little bit more and see if there's any key levels that we need to be watching for. Oh yeah, there's 29, maybe
30 level is pretty crucial. Same thing with this,
with this level here. So we will see, see where we end up with Shopify stock as
the market opens, we're currently about 15 min
away from the market opens, so we're definitely
starting to get there. And personally, I think
Shopify is gonna do well. I think Shopify at $30
is a steal of a deal. If you look at this company
going back to six months, this company was
worth over $176. Now trading at $30. It again is down by like 80%. I don't know what
that percentage is, but it's pretty significant. And so Shopify shopify could
be a good opportunity here, especially if this
earnings report is the catalyst that starts
to turn things around. I think I think there could be a nice opportunity
for a day trade here. So we're going to keep
our eye on Shopify. I am watching for
Shopify to cross above that 31, 50 levels. So we're going to set another
alert here at 31, 44. The price to go above or equal to bid price is greater
than or equal to 31. No, bid price is greater
than or equal to 31.45. 31.45. We're going to click
on activate there. And now in the price
crosses above that, we should get a nice little
alerts, so that'll be good. Let's just see if anything
else is happening today. What did we do? We
did McDonald's. Mcdonald's. We didn't look
into McDonald's shirt. That's where we got it. Let's take a look at this. Okay, McDonald's Corporation,
Mc d is the ticker. Let's always look at the six-month chart
first so that we can see what is happening
in the big picture. As you can see, McDonald's
has not had a massive pull back like what we've seen
in the technology industry. It looks like we got support 30, we've got some
resistance around 260, 8% to 70 in here or on a pretty strong bullish trend
over the last few weeks, we've crossed above our
two moving averages here. We did have a red day yesterday, but it looks like today should
do pretty decent for us. When we go to the one day
10-minute candle chart, you can see that we're definitely
up in the after hours, which is very nice to see. We are on a gradual,
Wow, very gradual, bullish trend line
right here you can see boom, just like that. So we're going into
bullish direction. We obviously want to trade McDonald's to the bullish side, which is really nice to see. So I'm going to be probably
watching McDonald's, the break of this
pre-market high, which is now establishing a bit of a resistance
level around to 65. I'm looking for the price
to come up above to 65 and hopefully ride this
up throughout the day. It looks like we could have
some support it to 61. So possibly we're trading in a little bit of a
channel right here. We're going to have to wait
and see how we open up. But McDonald's to the upside, Shopify to the upside. And metal platforms to the downside is sort of what
I am thinking this morning. So what I'm gonna do now is I'm going to
open up three charts. One with all of these companies. I'm also going to open
up my charts that show me the indices and the VIX. As soon as we see that the
market is going up or down. Hopefully that gives
me confirmation for one of these
stocks to get into them with a good
risk return ratio and a good trading opportunity. Now before we do that,
I just want to take another quick look at anything else that is happening
in the market. So we'll go to Yahoo
Finance here just to see if there's anything else
that we need to be aware of. Again, Meta stock is
crashing GDP rebounds in Q3, which is very nice to see. I do think that's going
to have a positive impact on the market. And it looks like
Ford was sliding after release and they
affirm their low guidance, that is not good for Ford
and that's honestly, in my opinion, not good
for the car industry. Let's just take a quick
look at how Ford is doing. I believe they're
just TickerSymbol F and it looks like
I was right there. They're down a little
bit after hours. Let's again zoom this out
to the six month charts, See how the company
is doing in general. We've got a high of $25 here, which is pretty high. We got to a low of $10 here, which means this stock, you're literally
went from $25 to $10 in a matter of like
six or eight months here. That is pretty insane and pretty dramatic here we've got
some resistance around $16. We came back down to $11 here. It looks like we're
breaking out through our previous high
rate here at 12, 60. And it's been a good couple
of days for Ford here, but it looks like that
could be coming to an end. As we zoom in here to
the 10-minute candles, you can see the stock
is down in after hours. They didn't have great guidance. So it'll be very interesting to see where this stock goes today. I personally think it could have a bit of a tough time because any of these companies that
don't have good guidance are definitely taken a hit. So right here you can see
major resistance at $13. We've got possibly
some support at 12:39. Here we will see where this doc opens in a few minutes here. We've got about 9 min left.
68. SHOP- Managing a bad trade: All right, everybody, welcome
back to the trading floor. It is currently 08:06
A.M. Calgary time. And I've got my first trade here that I want to
take advantage of. It is going to be on
Shopify and shelf. I had a huge rally to
start the day up to 33, 84 came back down, took a break, and now it
is starting to rally. And I'm looking for the breakout of this previous high rate here. As you can see, the S&P 500 is going through a
bit of a rally right now, coming back to the
opening levels, we are also seeing the same
thing from the Dow Jones, a nice little rally over the
last ten to 15 min here. And if this continues, I want to buy into Shopify for the breakout, the
previous resistance. Now that does not mean that it is going to
happen for sure. But what I wanna
do as a trader is just be prepared in
case it doesn't. So as we set up this trade here, I want to enter the trade when the price crosses above 33.95, that's gonna be my
entry price is 33.95. And I'm going to set a profit
limit of $35 so that we have about $1.05 worth of
room there to profit on. And we're gonna get out of it. 133.50. So that if it falls
back below that level, is going to exit our trade. Now in order to get into this, I'm going to click on Buy, is going to ask me to confirm
the order right here. I'll just move this up for you. We will click on Send order, and now it has got
our levels in there. So as you can see, we've got an order to get into the trade right
here at 33, 95. We've got an order to get
out of the trade as 33, 50 in case it comes back down. And then we've got our
take profit here at $35. So we're going to let this
sit for a little while. We're going to see how it plays out and we're gonna
give it some time. And if the market
starts to turn around, I'm actually just
going to cancel the trade and get out of it and not let it
execute the trade. But we're going to be
patient with that. We're going to see what happens. And if this continues to rally, we are now in a position
to take advantage of it. So we will see what happens. We're seeing some nice price
auction here from Shopify. We're at 33.85, so about $0.10 away from getting into
our position right here. Hopefully that happens and hopefully it continues to rally. It'd be absolutely
beautiful to see, but if it doesn't,
well, that's okay. We only have a $0.45 downside
per share on 70 shares. So the maximum we can
lose is about $35 here, we're only trained with
small numbers right now, so we're doing well, we're playing it safe, and it looks like this is
probably going to hit, I expect this to hit, or $0.04 away or $0.01 away from hitting
our mark right here. So we'll see what happens. Oh, I guess we were
about $0.10 way, not 33, 33, 95. That is going to be
our entry point. It looks like we're getting
a small little rejection here at 33, 90. So that is very interesting
to see like this. This one could go either way. We could get fully
rejected here, or we could see the
breakout as of right now, the Dow Jones, the nasdaq, things are moving in
the bullish direction. We've seen a nice little rally, but they've tapered off here in the last couple of minutes, sort of to be expected. We'll see what happens
with Shopify stock here. We're not in a position
yet, which is great to see. But if this rally continues, we are well set up to be in position and take
advantage of it. So as you can see here, we've got a little
bit of consolidation up here around this same level, which is very interesting. We also have two very large
volume candles right now. So that is a good sign. It shows that there's a lot of action happening right here. And if all of these
sellers get bought out, the stock is going to
continue to rally. Our indices are doing okay. The VIX is actually moving down, which is a good sign for us. And I'm pretty okay with
this trade at the moment. We will see if it executes. Okay, so our nasdaq index is actually running
higher rate now the S&P is also rallying extremely hard right now,
which is good to see. And if you look
at the Dow Jones, it is also going up. Now it is approaching
a little bit of resistance around here. But in the last 2 min, all of our indices have
seen a nice little pop. We haven't seen that come
through and Shopify stock, which is actually really
interesting here, but the VIX also continues
to move lower and lower and lower and add a nice little rally at
the beginning of the day, but it is moving lower, which should be good for us, should give us some confirmation
here and look at this. We're at 303-90-3904
at the highs. It looks like we're
probably going to get triggered here any second. We will see what happens. Everything is moving
higher rate now though. So this is good. This is
exactly what we want to see and this is good
confirmation for our position. So it's giving me a
lot of confidence to hold this position because I am expecting Shopify to move up with the
rest of the market. So here if you
look at level two, you can see this is
moving up and up. There we go. There is
our order right there. And you can see that
all of those orders, 3390-99, all got filled in just a couple of
minutes there there was a big order that
went through there. There's a lot of people
getting into it. Now we are into our positions. Stock is at 33, 99, we are out of it at 33, 50, and we're looking for
a take profit at $35. That is a pretty high
take profit on this one. So I may end up
moving that lower. But as of right now,
we're doing okay. It looks like we have
some good momentum here. Everything is moving up. If you look at the S&P 500, we are moving up right now. If you look at the Dow Jones
right now, we are moving up. And if you look at the Nasdaq, it is moving up as well.
So that is good to see. We've got good market
confirmation on this trade. We have got the v6
moving lower and lower, which is exactly
what we want to see. So as of right now, everything is pointing in the right direction
for this trait. Damp, if you look at
Ford stock to four, doesn't just a massive
rally this morning. This is actually
kind of impressive, like just looking at this, stock opens at 12, 75, drops down at 12:42, rallies up to almost $13. That is a pretty good rally that we're seeing from
Florida right now. So very, very interesting there. And our Shopify trade
continues to move higher, which is nice to
see wrath 33, 15. Right now. We're going to
remove this trend line. And we might even convert this into a trailing
stop-loss here soon. And just let it see how
far it will write up. We're at 34, 20 right
now we're doing okay. We're up a couple of
percent on this right now, which is absolutely beautiful. And we're getting
closer and closer. So we'll see if we hit our
$35 take profit target. That'll be absolutely beautiful. We're actually not too
far away from it and the stock just continues
to rally here. We're going to let this one
play out for a little while. We're going to be
patient with it and kinda see where we end up. Alright, here we
go. We're starting to move higher a little bit. We've got our indices moving
up are currently at 34, 42. So we're up a couple of percent on this trade already so far, which is absolutely great. And we'll see what happens here. I'm considering moving this
stop-loss up a little bit, but I don't think
we're quite there yet. I'd like to see this
break above $34.50 before I move it up and at least lock in a
breakeven trade here. I do want to give this
room to run though, because Shopify had
great earnings, we have positive GDP
numbers coming out. So I think that the wind is at the back of
this company and I think we could see continued
progress throughout the day, but I also don't
want to get greedy, so we're going to
be patient with it. We're gonna see
what happens here. And if we get above 34.50, then I might start to lock in
using a trailing stop-loss. Oh, oh, we've seen a little
bit of a pull back right now. Because I didn't move that that stop-loss up too early.
We may have been hit. Actually, we definitely
would have been hit if I had put it back to the
breakeven level right here. So that is not a good sign. We're kinda backwards if you
started about 20 min later. So this trade is definitely going a little bit
slower than I had hoped for and not necessarily to plan that big red candle there
kinda screwed us over, but we're going to
stay patient with it. We're going to keep
giving it some time. We had a game plan
going into this. Our game plan has not
folded, it has not cracked, it has not being proven
wrong as of yet. So we're gonna be
patient with this. We're going to hold out
and we're going to let this just sit here and wait until we know or
we have confidence in what is happening
because as of right now, the S&P 500 continues
to move up. The nasdaq is doing
pretty good and the Dow Jones is
also moving hires. So as of right now, we do not have confirmation of the market going against us. So I don't want to get out
of this trade too early. I just wanted to be
patient with it. I want to let it sit
and let it rest. The VIX is going
up a little bit, so that's not in our favor, but as of right now, all the other
indices, the nasdaq, the S&P 500 in the Dow Jones, are still holding up strong. So I don't want to cut
this trade just yet. Okay, So we've
been in this trade for a while now and it looks like we've basically just formed a channel rate between 34, 50 and this 33, kinda 85 level, which is
sort of where we entered in. So it's been a very slow tray. This is taking much
longer than I had hoped that it would take and I'm trying to be as patient as I possibly
can with it. I haven't moved our stop-loss up yet because I think we've got a key level of support right here that we've tested recently. And I could see us
testing it again. So I don't want to
move this up yet, but I also don't want to be in this trade for like 4 h today. So I'm going to be
patient with it. I'm going to give
us some more time. We're going to let it
develop and progress. And so far I hypothesis and our prediction and the
reason we got into the trade has not
broken down yet. So I don't want to
go against my plan. I just got to be patient
with this and you know what? Sometimes this is
part of the game. Sometimes it's not going to happen in the time period
that you're expecting. But if your strategy
hasn't broken down yet and your reasoning for getting into that trade has
not changed yet. There's no need to rush,
there's no need to panic. You can just sit back, relax, do a little bit of
market research. Keep your eyes on
the stock chart and just be patient with it
and we'll see what happens. Okay, So this is
kinda cool here. If you look at our indices, they're all starting
to just slightly move higher right now so that
there was the Dow Jones. Let's just see if I can drag up the nasdaq here doesn't look
like it's going to lend me. So that was the Dow Jones. Here's the spine right
now, as you can see, just slightly moving higher in the last couple of minutes. And here is the nasdaq. So again, just slightly moving higher in the
last couple of minutes, we will see if this
continues and if it does, I do expect that to play
out well for Shopify here, as you can see, we just
said a new high of 34, 60. So we're still moving
in the right direction. We're still moving towards our take profit level that
we had set in the beginning, our original take profit level, and we've still
got good momentum. It is just taken a
whole lot longer than, than we had hoped for, but we will see
what happens here. Okay, So at this point, we're starting to see all of
our indices selling off and the VIX is starting to
really move higher. So what I'm gonna do is just protect my downside
a little bit. We're going to move this
stop-loss up to 34. Let's just go 340-53-0404, something in there just enough so that if
it does get hit, it's going to cover
are commissions. I'm going to click
on Send order here. If it does get hit and we lose on this trade,
It's no problem. We're going to cover are
commissions and we're going to break even, at least on it. So our absolute
worst-case scenario right now is breakeven
after commissions. But if we make money on it, it's pretty much 100% upside. We have no risk in
this trade right now, and we've protected
our downside. And as you can see,
Shopify is now selling off and look at
our indices right now. So if you look at the Dow Jones right now, it is selling off. We did not get that balance
that I was looking for. If you look at the
Nasdaq right now, it is selling off
pretty substantially. If you look at SPX right now, the S&P or SPY, sorry, at the S&P 500 Index, either one will actually work. It is selling off
pretty hard right now. And as you can see, Shopify is now selling off
in a couple of minutes. This is why we want to
look at the indices. This is why we want to have
them open on our charts, our screens, and this
is why we want to protect ourselves
from the downside. If this trade goes against us now we are
completely protected. We will have wasted a bunch
of time, which is okay, but we're not going
to lose any money we're going to cover
are commissions. It's not really going
to be a big deal. The problem though,
is that if you don't do this and it just
continues to sell off, now you've wasted a bunch of
time and you've lost money. So something to
keep in mind here. And the main reason
that I'm doing this is because all
of the indices, all at the same time there were starting to
just print read. They were showing
big red candles and they were selling off hard. In that event, more than likely. And a lot of the times
you're going to also see a sell off in whatever
stock you are trading. And as you can see, we
saw three big red candles right here exactly while
that was happening. So as I see that, I'm moving up my stop-loss. I'm protecting my
downside risks. And luckily we're seeing a nice little
recovery right now. So something to keep in mind, they're definitely
something you should be considering and managing while
you're in your position. Yeah. We just got hit. There goes our order and there goes almost an hours
worth of time. But you know what that is? Okay. We've protected
our downside. We got out at pretty much breakeven we probably ought
or commissions covered. I'll have to double-check on it. We didn't lose any money
and you know what, sometimes that is just
how trading goes. We, we ended up buying in and then we sat in a channel
here for an hour. Very unfortunate,
but you know what? That's how it goes. Sometimes you win,
sometimes you lose some. At least we've
protected our downside. We were able to
manage our money, we were able to
manage the trade. And now we've got all of
that cash that we can go and deploy into a better
opportunity hopefully. So hopefully you learned
something out of this video, sorry that it took so long
and sorry that it wasn't a nice dramatic finish like we're all hoping for,
but you know what? That is? The reality of trading. Sometimes you went to trade, sometimes you lose a trade. And at least in this scenario, we've protected our downside. So we didn't lose anything. We came out pretty
much breakeven. And now it's just about
keeping our focus, keeping that mentality, and getting ready for
the next opportunity. So we'll see you guys there. Hopefully you got
something out of this video and we'll
talk to you soon. Alright, everybody.
So I'm editing this video right now and
I've just watched everything back and I've got some
thoughts about what I should've done differently
with regards to this trait. And I thought I would
share it with you in this same video because
it just makes sense. So what I should've done
differently here is number one, when I identified that the stock was now trading
within a channel, you saw me identify the support and
resistance levels there. That is when I should
have changed my strategy and I should've adjusted
what I was doing. I identified the new pattern, but I didn't change what my
strategy was and that was my problem when we're
trading within a channel, you want to buy it on the
bottom and sell it at the top. Well, for us, we had
already held a position. We are already in the stock, we are in it before it
even got into the channel. So that was good for us and we should have taken advantage of that and sold at the
top of the channel, their stock had bounced
off the same level a couple of times and got
rejected and came back down. Unfortunately, we held
it all the way down. What we should've done is realized that we were
trading within a channel. And when we got to the
top of that channel, we should have either trimmed
our position or sold out of the entire position
and just locked in a smaller amount of profits. That is the way that I should
have handled this trade. And unfortunately, probably
because we were filming, maybe I was a little
bit flustered and talking to the camera. I decided that I
wanted to hold it and try and hit the
original profit target. And that just wasn't
the right strategy. It wasn't the right way
to manage this trade. And what I should've
done is said, okay, the strategy has changed because
the pattern has changed. Therefore, we need to
adjust what we're doing. We've got resistance
at this level and when the stock
approaches that level, I shouldn't be taking profits. That's how I should
have handled it. And I just wanted to jump in here and share that with you. And also, this has been a
wonderful exercise for me, recording my own trades and
then watching them back. So I highly recommend it
because I think it's very helpful to see what you
were thinking at the time, how the end result played out and what you could
have done differently. This has actually been very
helpful for my trading. Highly recommend it for
your trading as well.
69. Outro: Alright, everybody, You have made it to the end
of the course. I just want to say
congratulations and thank you. Thank you for
watching my content. Thank you for watching
all these videos. Thank you for going
through the exercises and putting in the effort. I sincerely appreciate it and
seeing the students come to this course truly gives
me a real sense of joy. Now to help you out on your next steps and your
path moving forward, I've put together a list of
trading resources and links. You'll be able to find
this in the projects and resources tab
of this course. And starting us off here, you
can join my discord chat. You can also book
a call with me. Those are the first two links. So if you want more
access to me, what I do, my training and my philosophy, those are the two links
you want to check out. You can also check out more of my content on
YouTube and TikTok. And if you want to take
anymore of my courses, I'm putting everything
on Skillshare and it's completely free
under that trial. Otherwise, you just
paint a subscription to Skillshare and you get access to everything including my other five courses right now, hopefully more in the future. Now if you're interested in getting opened with the broker, here are my links. Each one of these
links will give you a little bonus in terms
of free commission or a deposit bonus or free
stocks if you're in Canada, I recommend Interactive
Brokers request trade. If you're in the United States, I recommend Weibull or
Interactive Brokers. Scrolling down here, I have also inputted the two training
journals that I recommend. You can also get free access to the Excel sheet trading journal that I will also
upload to this course, so everything will
be there for you. I highly recommend starting your trading with a
practice account. I personally use the
Trade Practices count, but you should bid
to find a variety of different practices accounts. They will all do pretty
much the exact same thing. You need to start with
the practice count before you start trading
with real money. And if you're interested
in any useful websites that I use for my trading, I usually go to Yahoo
Finance for market news. I go to earnings whispers
for earnings news. And I go to this
link right here for any economic events that are happening today
or in the future. So that's how I kinda
prepare for it. If you need any more links
or any more resources, leave a comment on this
video and I will upload it. I will make sure you
get it and I'll make sure it is accessible
to everybody. Thank you so much for watching this course and if you've
got any value out of it, if it helped you in
any way or if you have feedback for recommendations
are improvements, please consider
leaving a review. I really do read
every single review. I take them to heart and
if there's a way that I can improve the course,
please let me know. I sincerely appreciate it if you have anything positive to say, I'd really love to see that
too at warms my heart. Thank you so much. Thank
you for everything. And we'll see you guys
in the next video. Hopefully we'll see you
in the next course are on my YouTube channel or in the discord chat
we'll see you around. Hopefully this won't be the end. Take care and talk to you soon.
 Zac Hartley, Entrepreneur and Investor